1. Introduction
Every year, more than 400,000 Europeans die early due to poor air quality, and many others suffer from respiratory and cardiovascular diseases caused by air pollution [
1]. From an economic point of view, poor air quality represents a cost of more than 20 billion euros per year for the European Community, as it increases healthcare costs, reduces the productivity of the labor force, and damages the soil, crops, forests, lakes and rivers [
1].
Low air quality and climate change are closely related to elevated greenhouse gas (GHG) concentrations in the atmosphere (carbon dioxide (CO2), methane (CH4), nitrous oxide (N2O), chlorofluorocarbons (CFCs), hydrofluorocarbons (HFCs), perfluorocarbons (PFCs), sulfur hexafluoride (SF6) and nitrogen trifluoride (NF3)).
Excessive greenhouse gas emissions result in global climate change, which may directly (e.g., changes in weather conditions, extremely high temperatures, droughts, floods, etc.) or indirectly (e.g., impaired quality of the air, water, soil, changes in agriculture and living conditions, etc.) affect both human health and various ecosystems.
According to [
2], greenhouse gas emissions reached a peak value in the late 1980s. In the years 1990–1994, this value decreased by approximately 28%, and since 1995 GHG emissions have stayed at approximately the same level. In 2017, the total greenhouse gas emissions in the EU-27 decreased by almost 27% compared to the values observed in 1990; this represents an absolute reduction of 1240 million tonnes of CO
2 equivalents [
3]. In order to maintain an acceptable air pollution level, certain international conventions, protocols and guidelines were concluded and adopted [
4,
5,
6,
7]. Their role is to ensure climate protection and achieve the stabilization of greenhouse gas concentrations at levels that do not create interference with the climate system. The main objective of the European Union (EU) policy on the protection of the environment and public health is to provide comparable information on the health and the state of individual environment components in the EU.
Despite the efforts aimed at reducing greenhouse gas emissions, and in view of the existing standards, the majority of the EU population does not live in a healthy environment [
8]. Exposure to excessive air pollution may cause a number of negative health-related consequences [
9]. In many studies, certain correlations were observed between daily changes in the air pollution and the increased occurrence of cardiorespiratory diseases [
10,
11] or cardiorespiratory mortality [
12,
13].
There are various sources of air pollution, i.e., the sources of emissions. The important ones include air transport, which significantly affects the greenhouse gas emissions. According to [
3], in 2017, fuel combustion and fugitive emissions from fuels, without transport, represented 54% of the total greenhouse gas emissions in the EU-27. In 1990, this source segment was even more dominant (62%). Fuel combustion in transport, including international aviation, was the second largest source of emissions in 2017, representing 25% of the total. When compared to the year 1990, there was an 8% increase. Industrial processes and product use represented 8%. Greenhouse gas emissions from agriculture represented a 10% contribution to the total greenhouse gas emissions in the EU while the lowest contribution to the total emissions was observed in the waste management sector.
The ecological effects of the transport sector on the environment are negative and often irreversible [
14]. That is why increasing attention is being paid to transport efficiency in terms of energy consumption and the production of greenhouse gases. Article [
15] presented a verified method of calculating the energy and emission efficiency of the transport system, which is based on the applicable European standards.
The percentage of all transport sector contributions to the production of greenhouse gas emissions in the EU-27 in the period from 1990 to 2017 increased by 10% [
3]. According to the latest summaries of the European Committee for the period of 2014–2024, the current aviation sector contributes to the production of approximately 7% of all emissions produced by the transport industry and approximately 2% of the total anthropogenic emissions of carbon dioxide. However, this share is increasing extremely fast as aircraft operations increase. According to the European Aviation Environmental Report 2019 [
16], greenhouse gas emissions from aviation activities have more than doubled over the last two decades. Therefore, prior to the 25th Conference of the Parties (COP25) in Madrid (December 2019), the European Parliament adopted a resolution requesting that the EU adopt substantial measures aimed at reducing aviation emissions.
Article [
17] presents information on the policies and objectives of international aviation organizations (particularly the Advisory Council for Aeronautics Research in Europe (ACARE) and the International Air Transport Association (IATA)), as well as the European Committee, in the reduction of aviation emissions, including basic information on the EU system for emission trading and its relationship to the integration of the emissions into air transport and the ambitious goals determined in the document titled European Aviation Vision 2050, which deals with the environmental impact of aviation. Polishchuk et al. [
18] developed and applied fuzzy modeling to information technology for making quantitative estimates of the emerging environmental projects in the air transport segment.
Koscak et al. [
19] focused their work on the creation of an algorithm for airport winter maintenance modeling. The purpose of the algorithm is to reduce maintenance times as well as the negative environmental impact of winter maintenance.
The general efforts aimed at maintaining air quality represent a topic studied by many experts (scientists and organizations). Jakubiak [
20] analyzed the methods of reducing the environmental impact of aviation. The inclusion of aircraft operators in the emissions trading system of the European Union was also introduced. Cerro et al. [
21] presented the results of air pollution measurements at a regional background site in the Balearic Islands. They also monitored the air pollution sources related to the transport sector. Mocerino et al. [
22] proposed an optimal network for monitoring air quality, which facilitated the quantification of the pollutant emissions produced by maritime transport. Their mobile monitoring proved to be a useful technique for characterizing the spatial variability of air pollution in urban regions and the concentration gradients of pollutants from particular sources [
23]. In their case study, Dong et al. [
24] used a model for assessing the population relative risk of air pollution exposure and methods for determining the air pollution concentration with the goal of identifying the optimal method of assessing the risk of the population’s exposure to sulfur oxides (SO2).
Vichi et al. [
25] conducted a survey on the impact of civil aviation on air quality. The 5-year research project was carried out at two international airports in central Italy. Paper [
26] presents the approaches aimed at the identification and quantification of an airport’s contribution to the NOx concentrations near the airport. The authors of the paper [
27] analyzed the data on emissions from global commercial aviation for the period of 2004–2006. The impact of long-distance passenger transport (mainly road and air transport) on greenhouse gas emissions and the related costs were described by the authors of the paper [
28].
According to [
29], aircraft emissions contribute to climate change (ozone depletion and greenhouse effect), acidification and disturbances (local air pollution and smells). The main factor contributing to this air pollution is civil aviation, but military aviation also plays a certain role.
The methods of multidimensional statistical analysis are used in many research areas, such as medicine, biology, psychology, technical sciences, etc. A multidimensional statistical analysis was applied within the examination of correlations between the N2O emissions and the online operational variables (concentrations of dissolved oxygen and nitrogen, temperature and flow velocity) in the biological removal of nitrogen from wastewater [
30]. Belandi et al. [
31] applied principal component analysis and the clustering method to identify the critical processes related to N
2O emissions reduction. The authors of [
32] used multidimensional statistical methods (factor, cluster, discriminant and regression analysis) to identify the impact of a tropical reservoir on the production of greenhouse gases. Ni et al. [
33] combined the principal component analysis (PCA) method and the deep belief network (DBN) method in their evaluation of civil aviation safety. On the basis of the PCA method, a complex approach to the assessment of the aviation maintenance support ability was developed [
34]. A combination of the PCA method and artificial neural networks (ANN) was also applied to identify the pollution sources at ten locations in Malaysia [
35]. When comparing the greenhouse gas emissions in 24 Asian countries, the authors of the paper [
36] used the PCA method and a cluster analysis. The results of the study were used to prepare procedures for reducing greenhouse gas emissions in various industries (energy, industrial processes, agriculture, waste, land use changes, and forestry and bunker fuels).
3. Result and Discussion
The research was carried out with the objective to:
analyze aviation’s contribution to the production of greenhouse gas emissions in the air of the EU-27 member states;
compare the EU-27 member states in terms of the impact of aviation on greenhouse gas emissions and other parameters that characterize a particular country by applying the PCA method and a cluster analysis.
Air pollution from aviation is also discussed in the Transport Policy White Paper of the EU [
42]. In 2017, almost 26% of the total greenhouse gas emissions in the EU-27 originated from the transport segment. The European Union appealed for a reduction of greenhouse gas emissions in the transport segment by 2030 at a level approximately 20% below that recorded in 2008.
The most significant increase in transport intensity has been observed in air transport. Despite improvements in fuel consumption, the aircraft emissions are expected to reach 7-fold or even 10-fold the 1990 value by 2050. This increase in greenhouse gas emissions from aviation and maritime transport was largely caused by an increase in transport intensity. The number of aviation passengers in the EU has tripled since 1993 [
43].
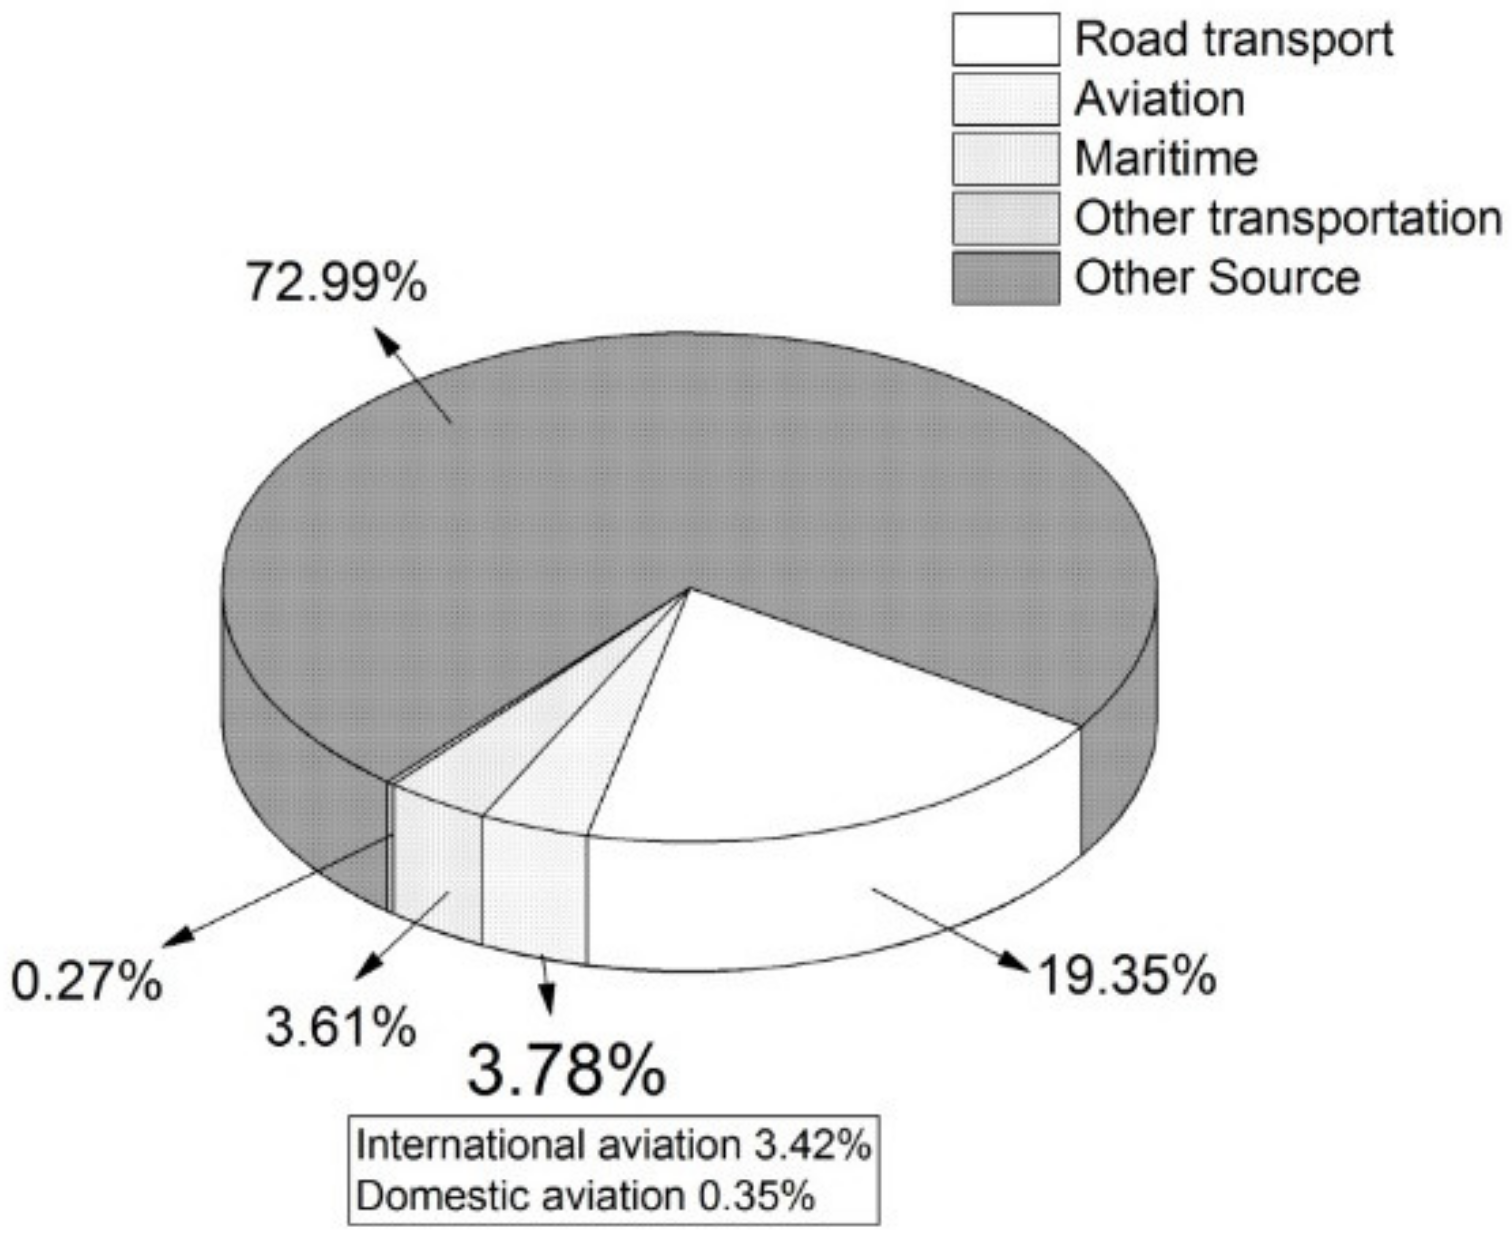
The percentage of aviation’s contribution to the development of greenhouse gas emissions in the EU in 2017 is shown in
Figure 2. In 2017, aviation (including international and domestic aviation) represented almost 4% of the total greenhouse gas emissions. Other sources of greenhouse gas emissions included the energy industry, industrial processes and product use, agriculture and waste management, excluding land use, land use change and forestry (LULUCF) [
44].
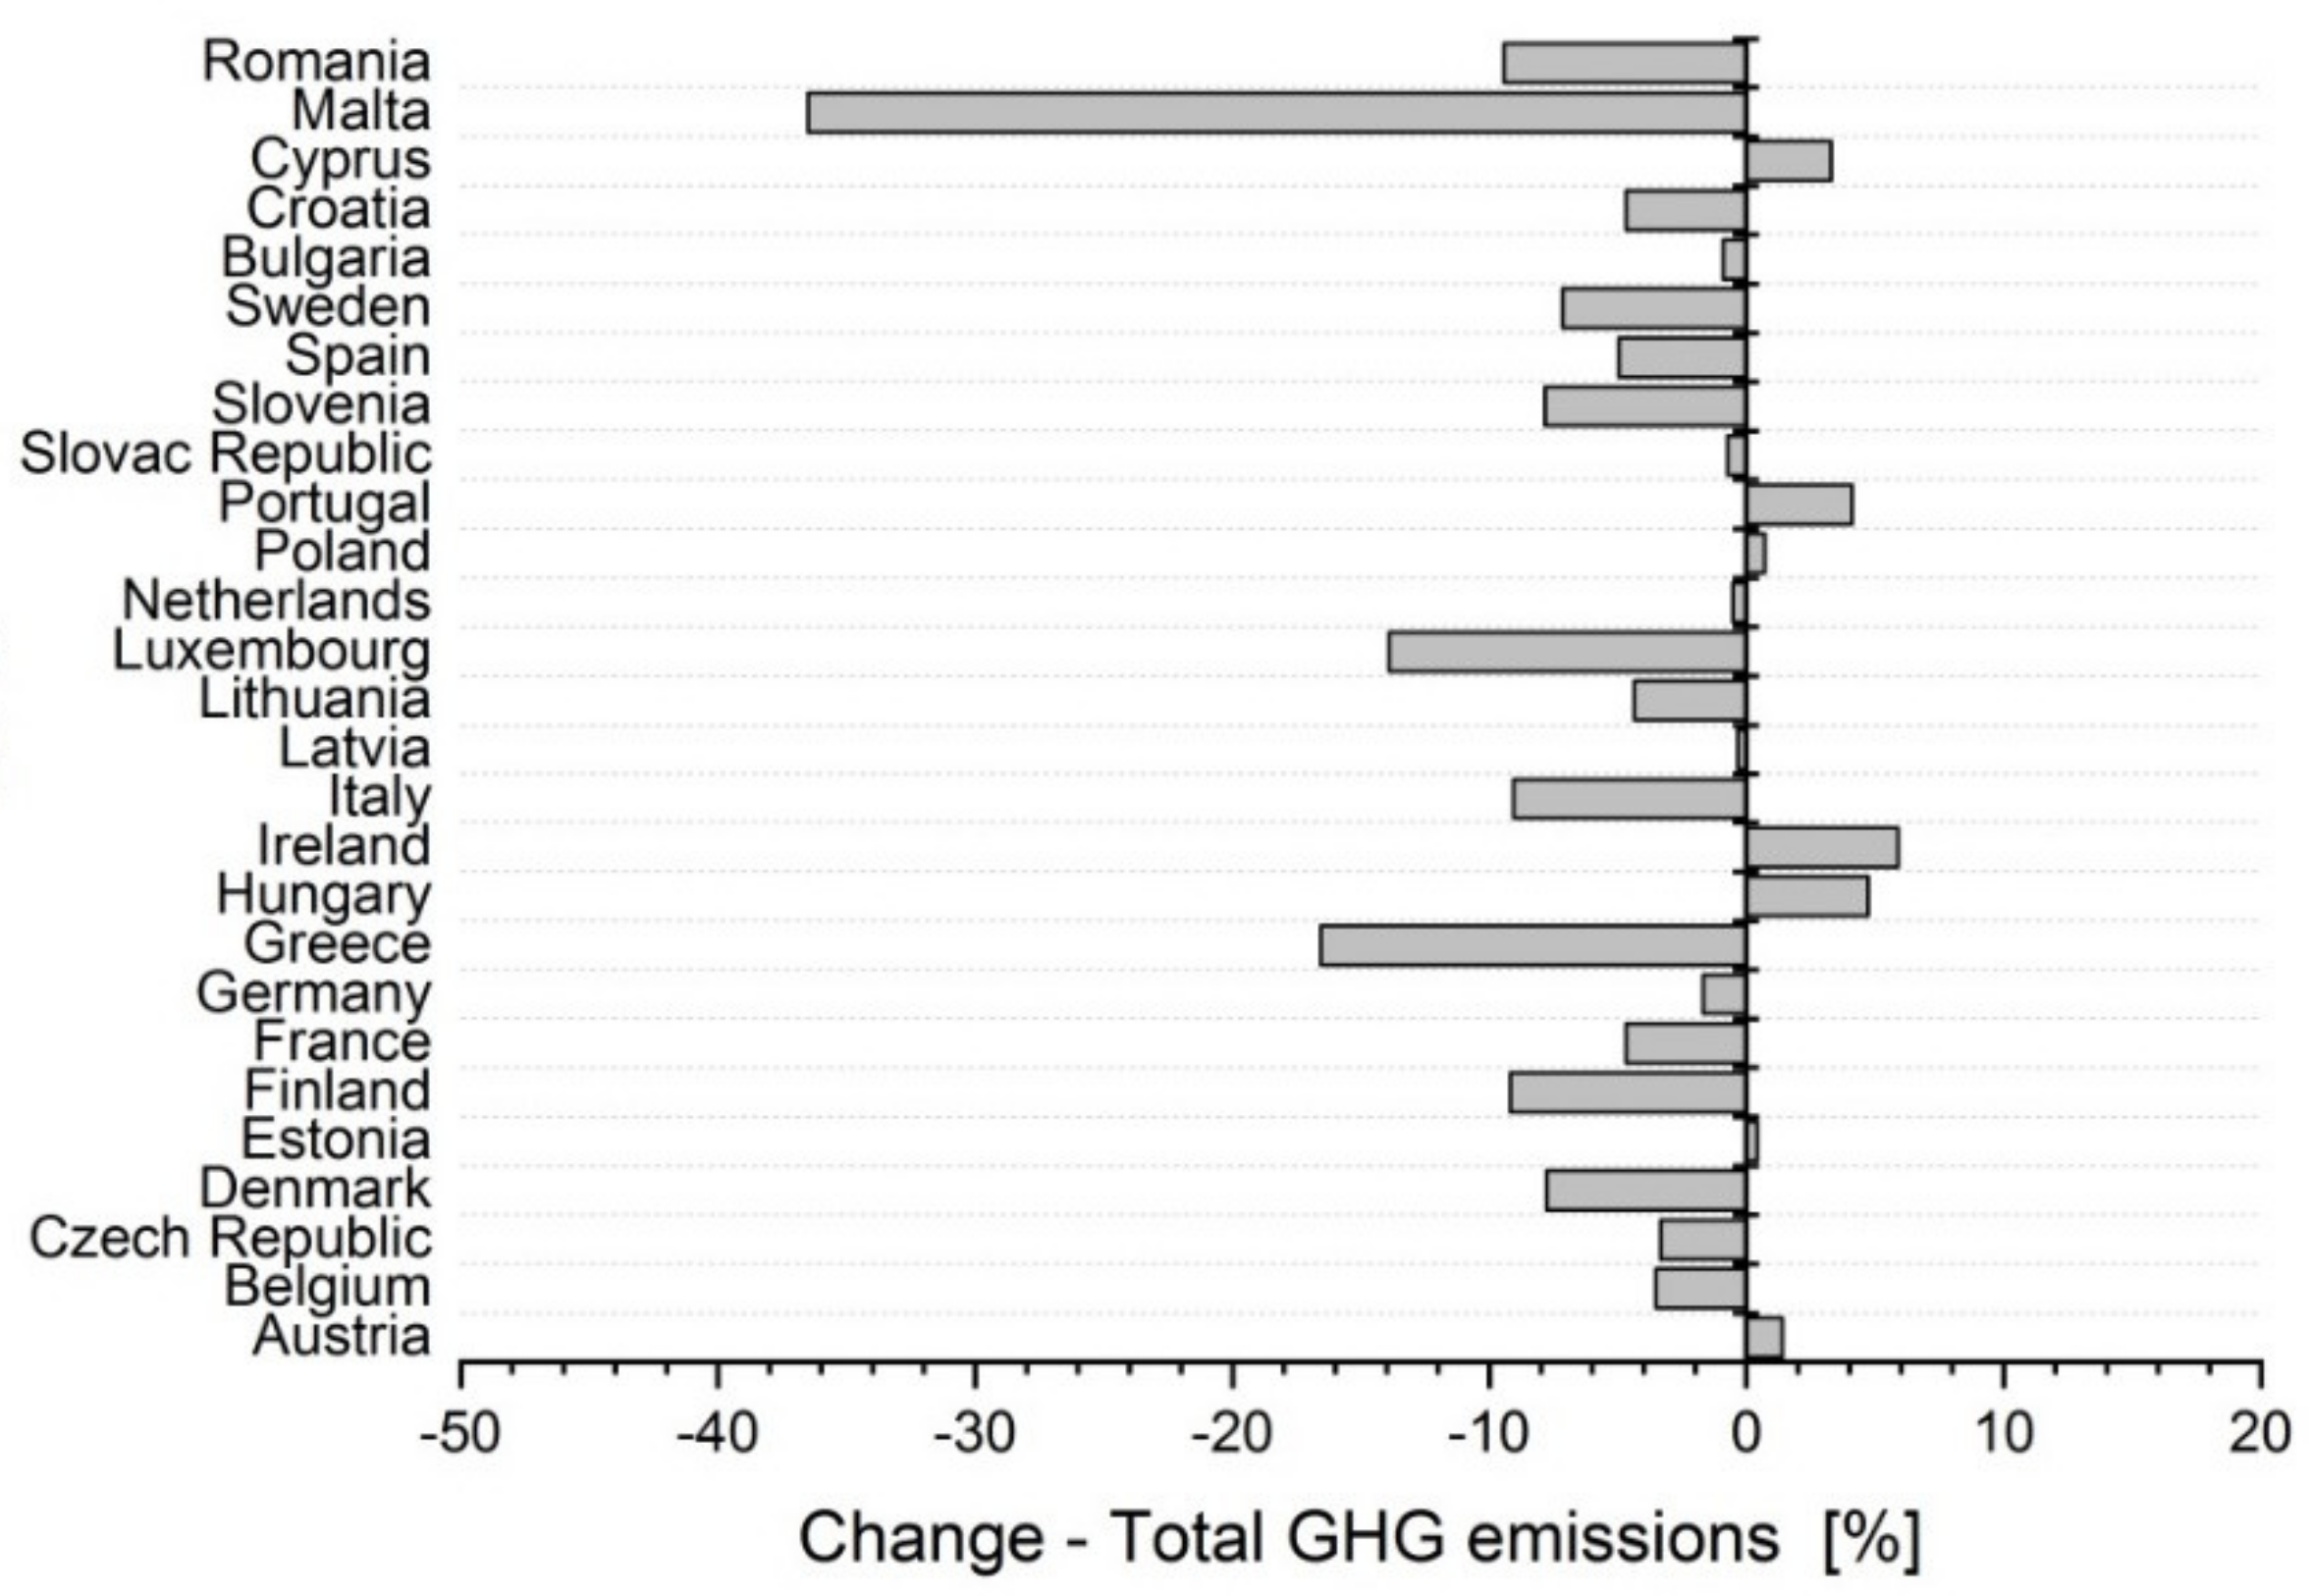
In individual EU member states, in the years 2012 to 2018, there were changes in the amount of the total greenhouse gas emissions (
Figure 3). The greatest decreases, compared to the year 2012, were observed in Malta (−36%), Greece (−16%), Luxembourg (−14%), Italy (−9%) and Romania (−9%). On the opposite end of the spectrum, the greatest increases were observed in Ireland (+6%), Hungary (+5%) and Portugal (+4%). According to a report from the Commission to the European Parliament and the Council [
45], many countries achieved such a reduction of emissions from the use of energy in buildings, from agriculture and from waste management. Emissions from industry and other sectors also decreased.
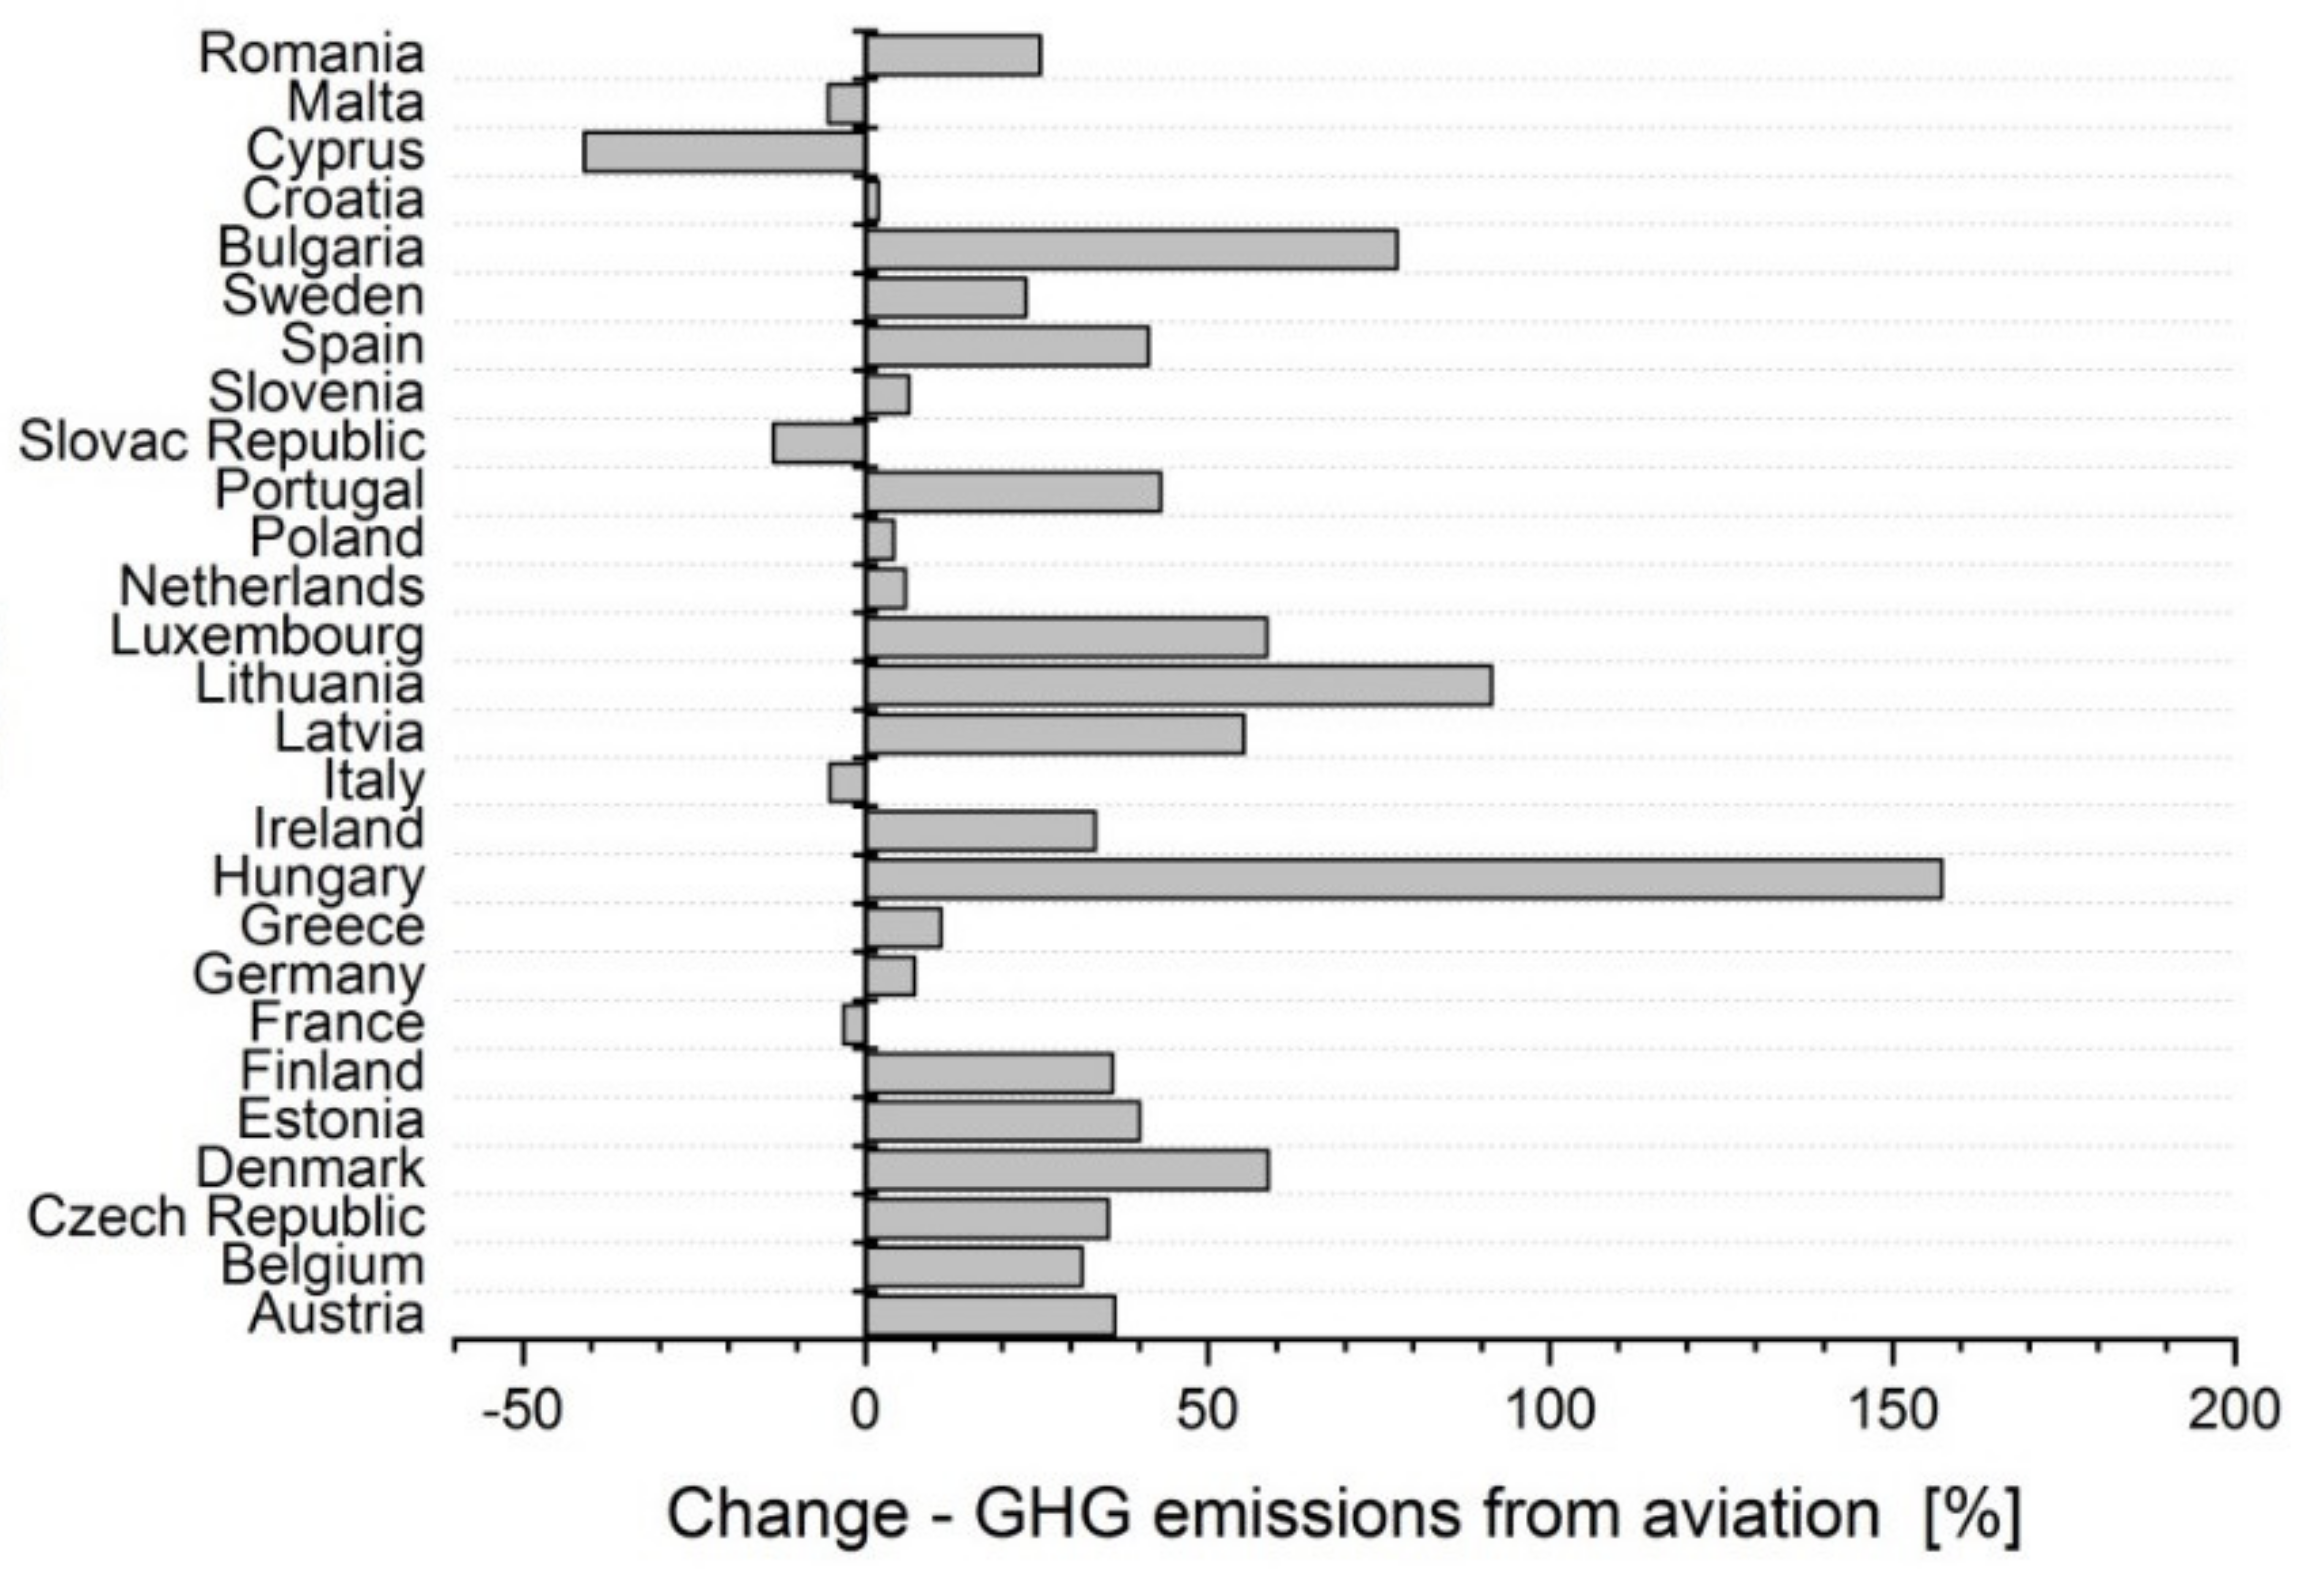
In the years 2012 to 2018, the total greenhouse gas emissions from aviation also exhibited some changes (
Figure 4). In almost all EU-27 member states, there was an increase in the aviation greenhouse gas emissions. The largest increases, when compared to 2012, were observed in Hungary (+157%), Lithuania (+91%) and Bulgaria (+77%). The largest decreases were observed in Cyprus (–41%) and Slovakia (–14%).
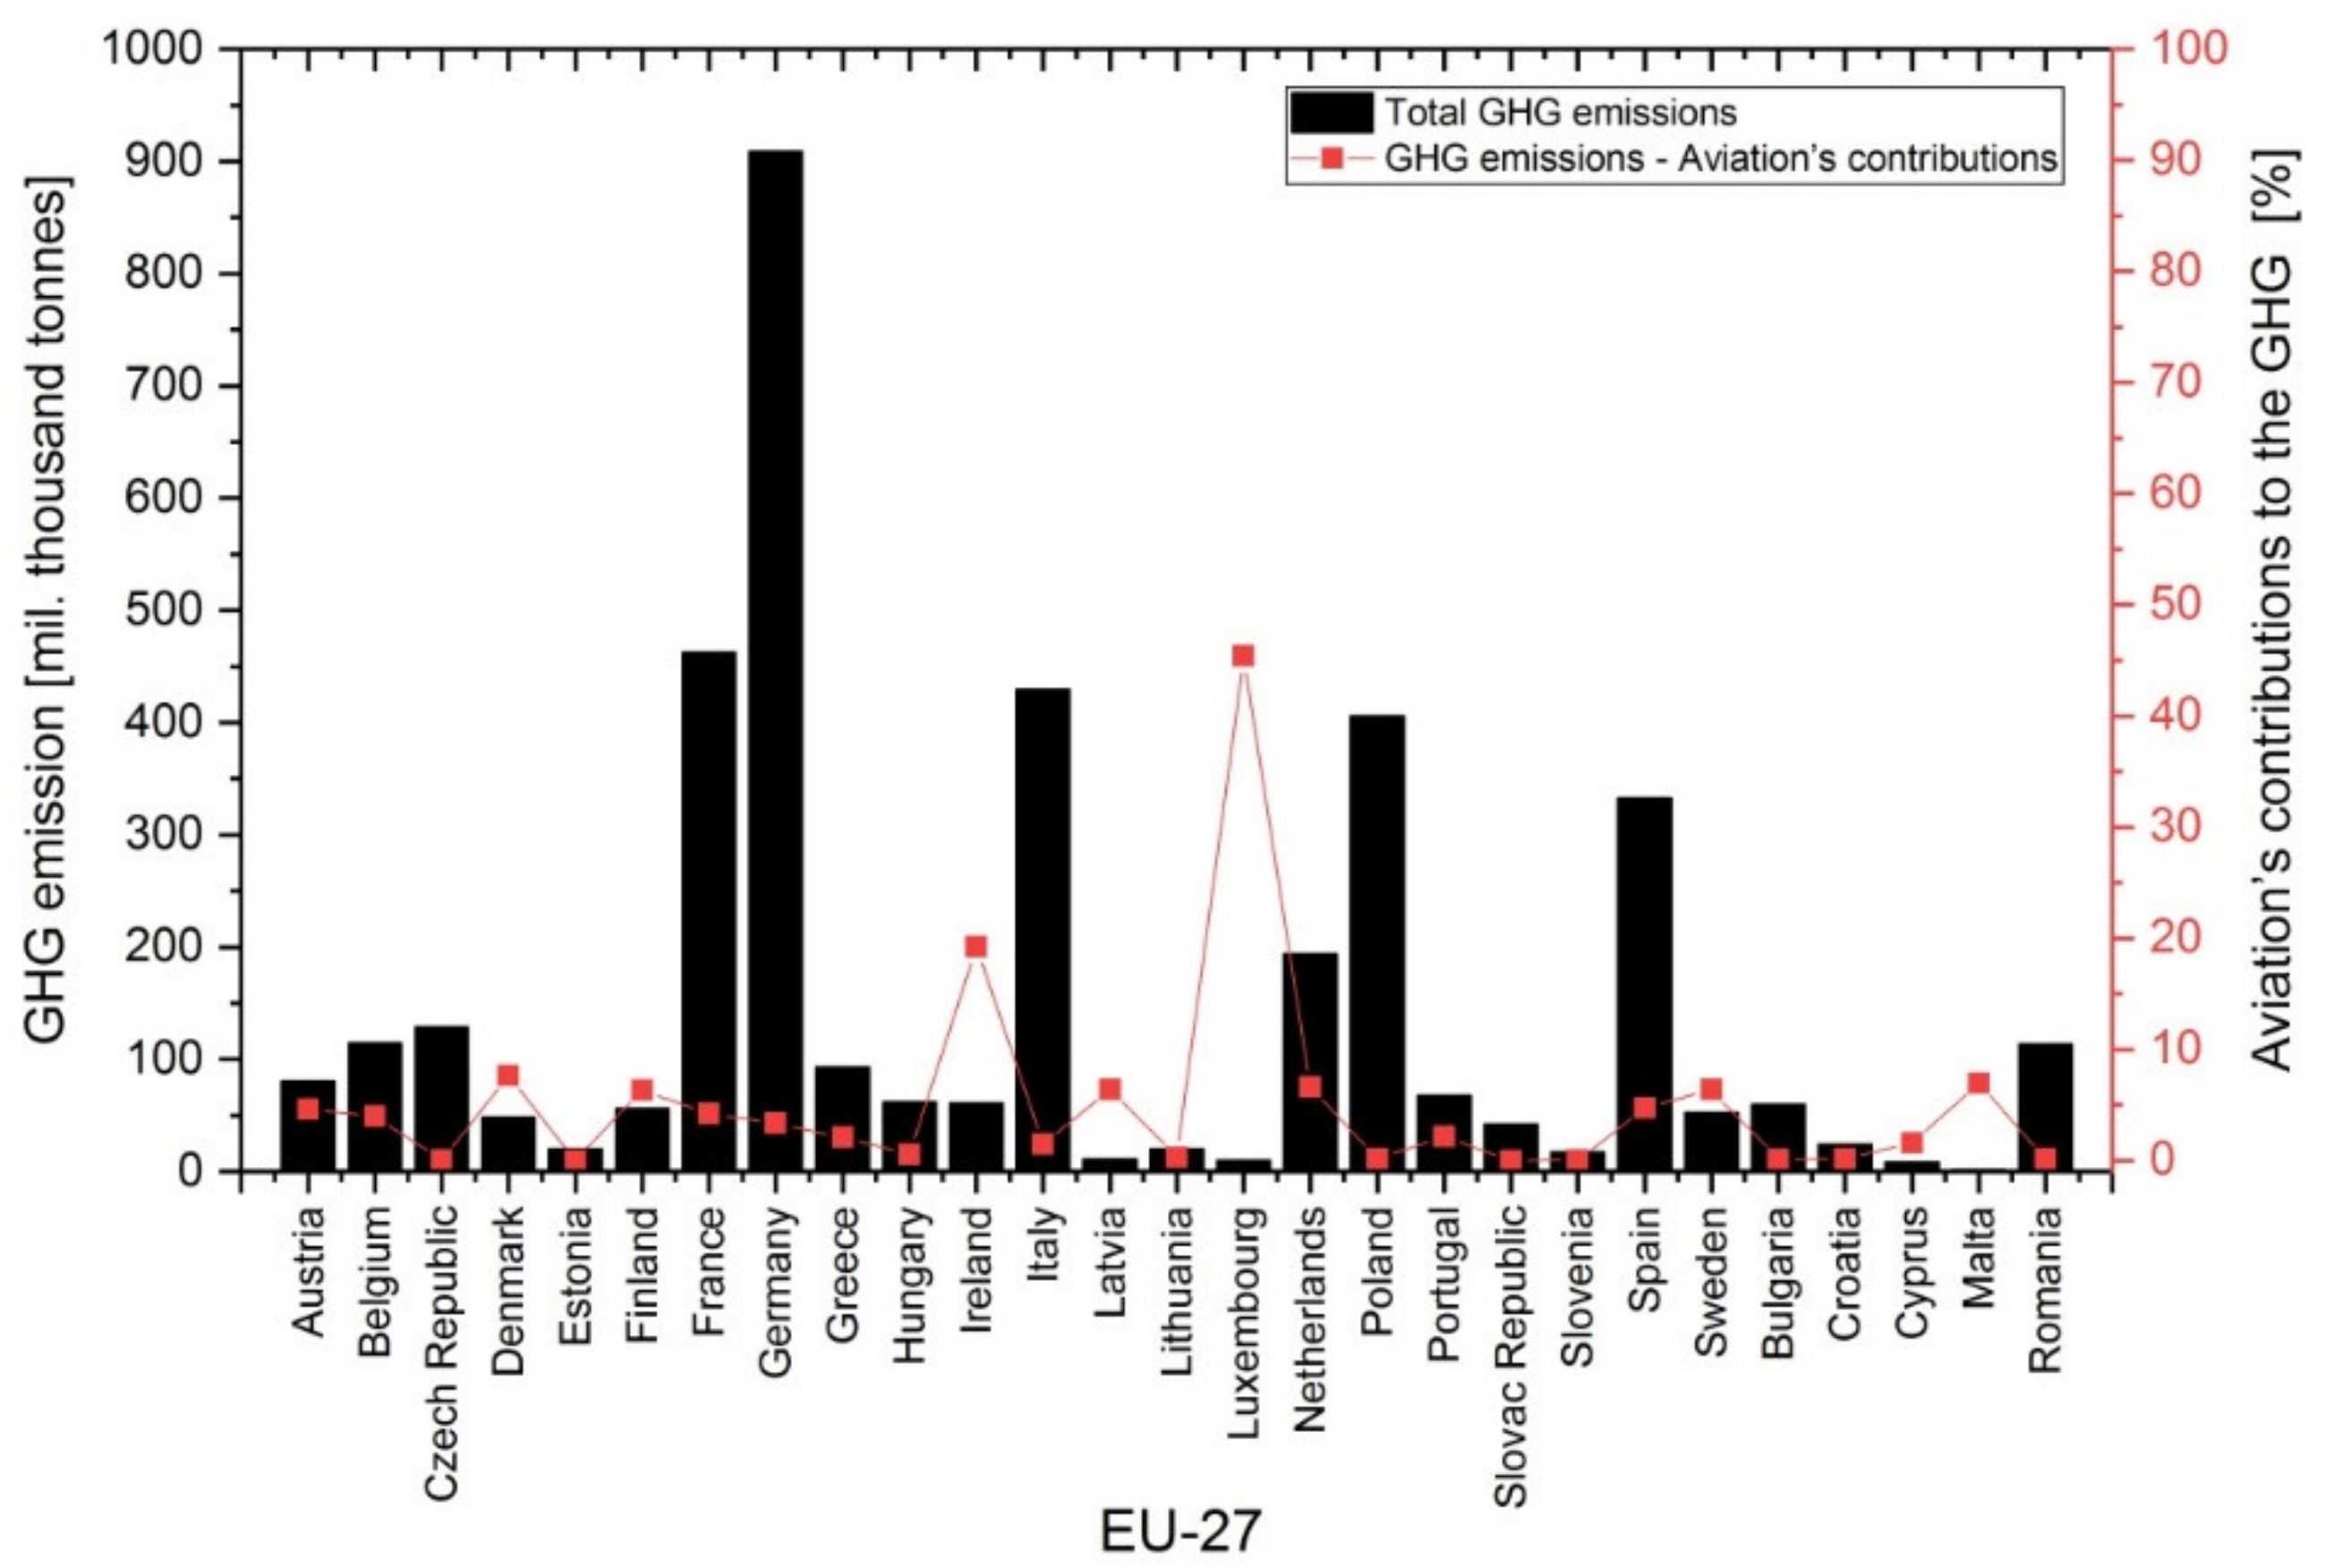
In 2018, out of all EU member states (
Figure 5, column plot), the greenhouse gas emissions were at the highest level in Germany (almost 24% of the total value in the EU-27), followed by France (12% of the total value in the EU-27), Italy (11% of the total value in the EU-27), Poland (11% of the total value in the EU-27) and Spain (9% of the total value in the EU-27).
Aviation’s contribution to the production of greenhouse gas emissions in the EU-27 member states in 2018 are shown in
Figure 5 (the line chart). High percentages of aviation greenhouse gas emissions were observed in Luxembourg (45%) and Ireland (20%). The percentages of aviation greenhouse gas emissions were similar in countries such as Denmark (8%), Malta (7%), Netherlands (7%), Sweden (almost 7%), Finland (6%) and Latvia (6%).
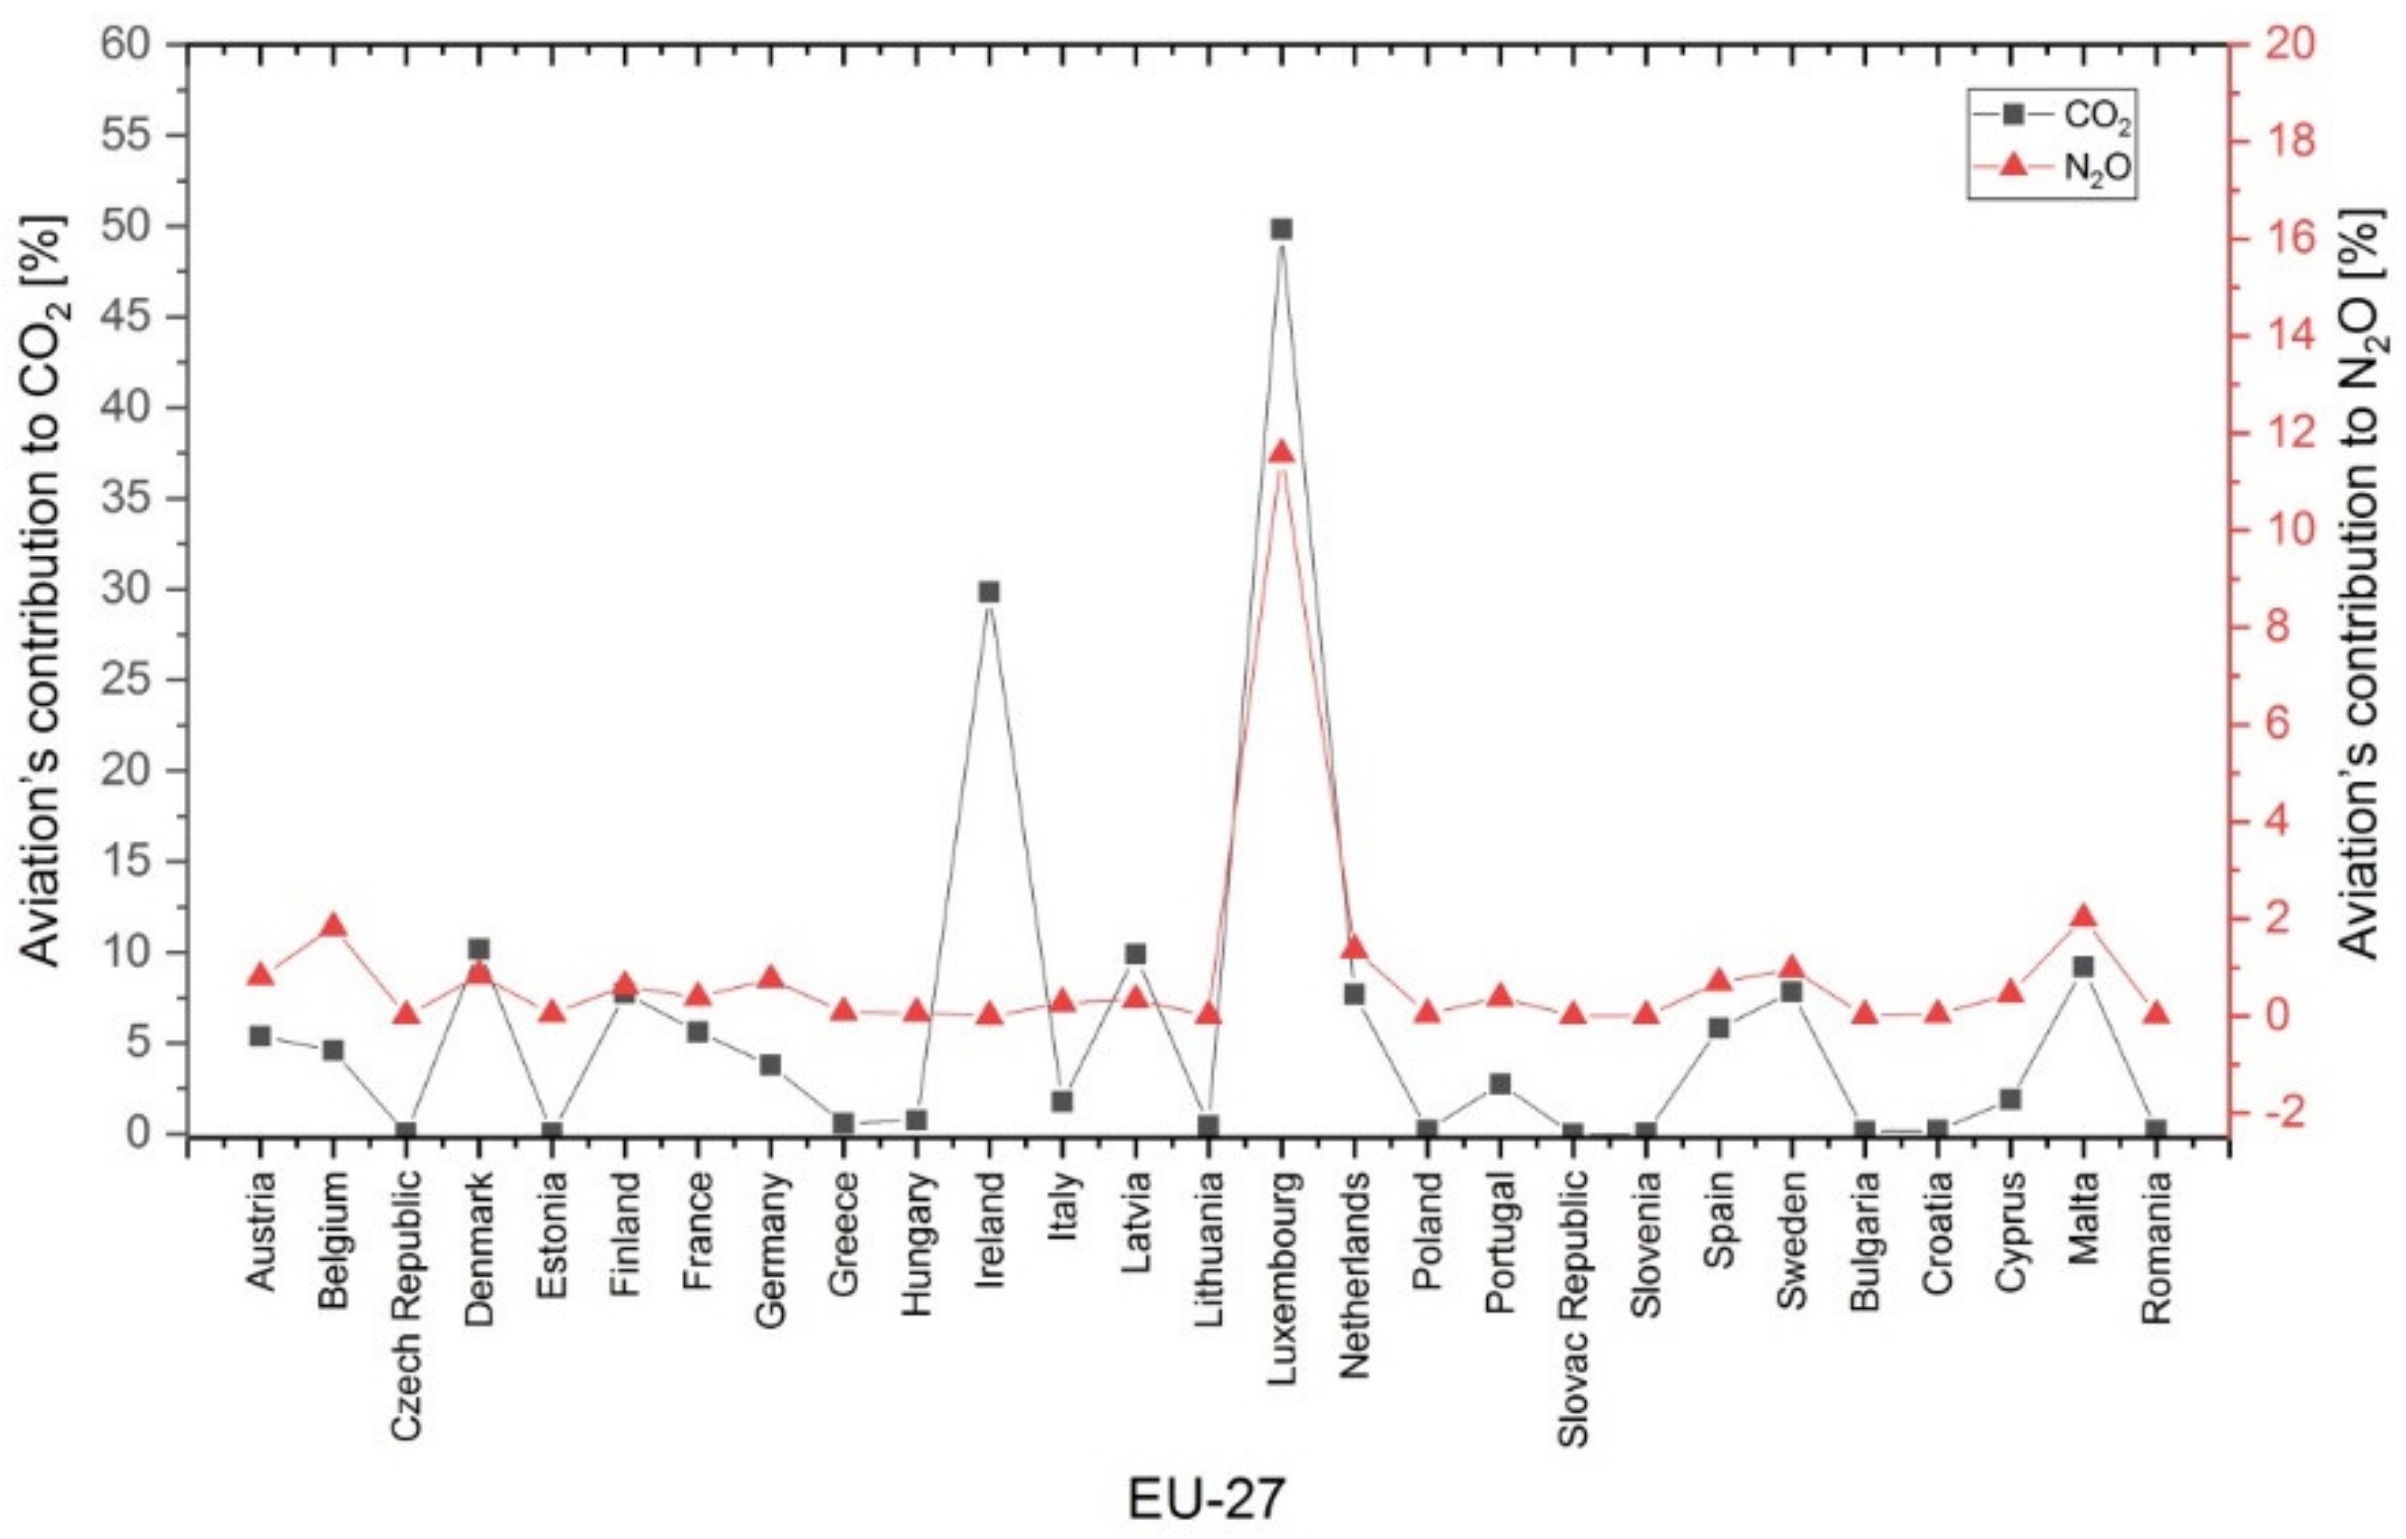
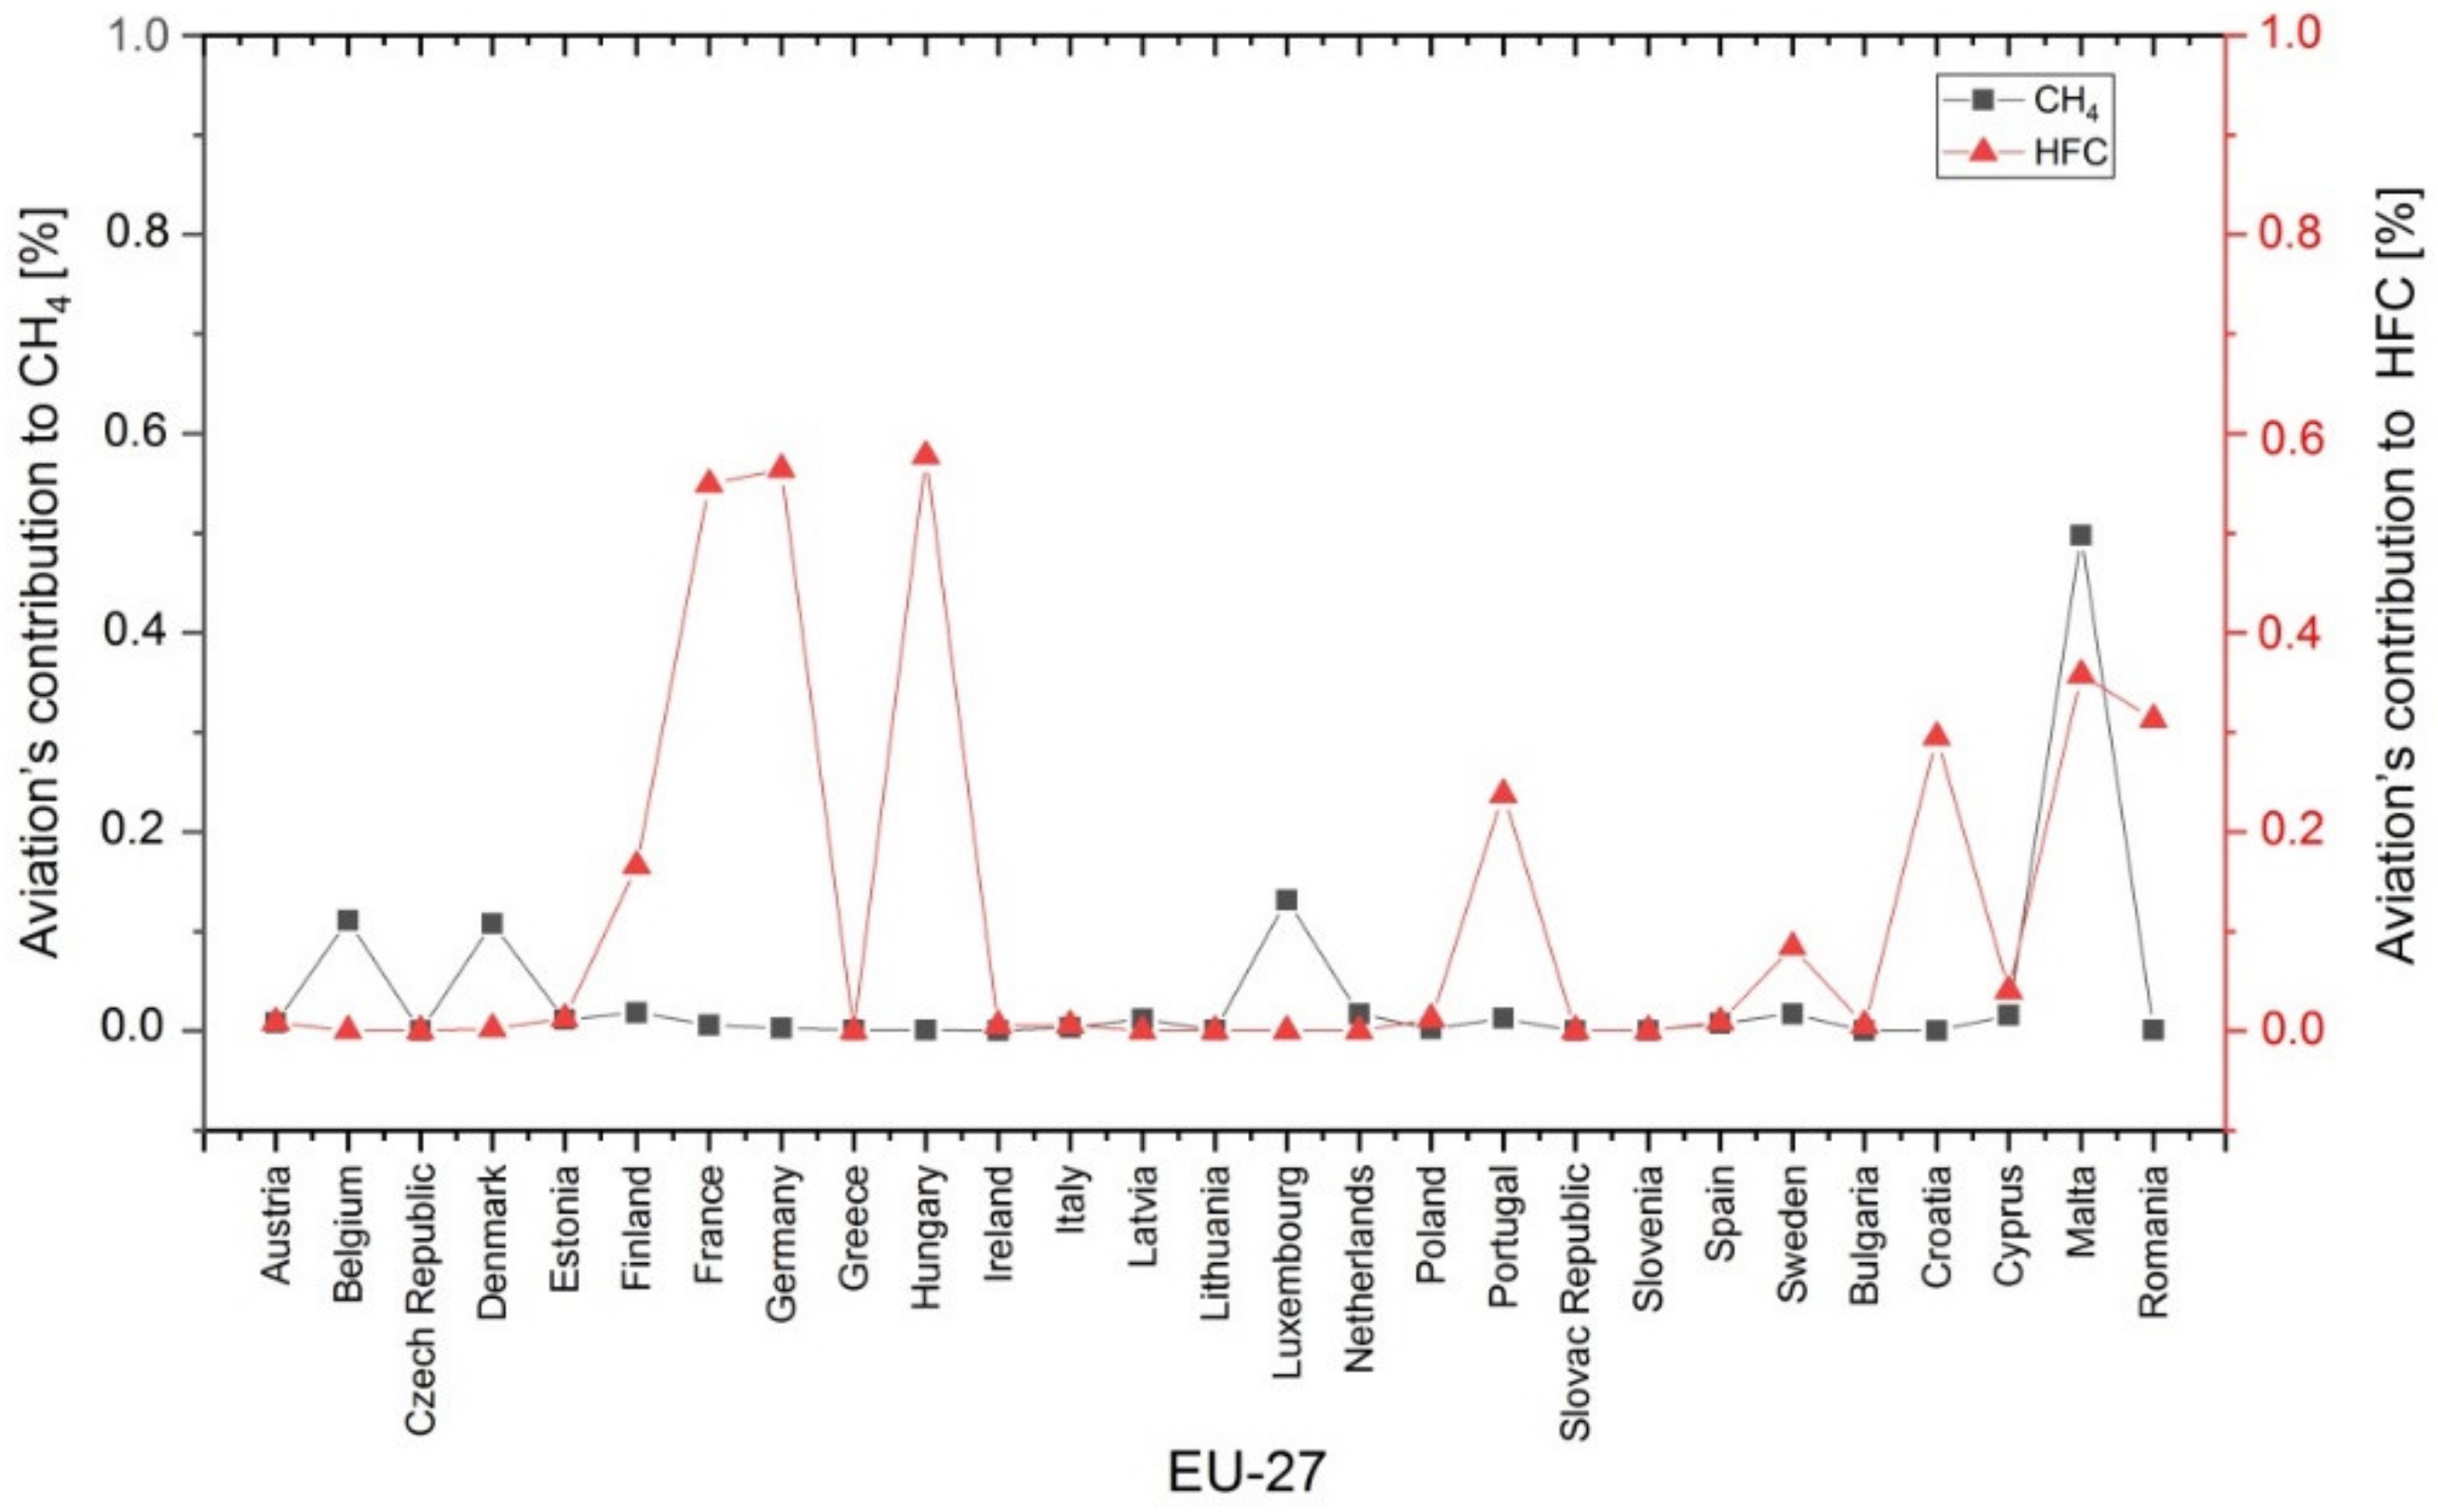
Figure 6 and
Figure 7 represent the percentages of the 2018 aviation’s contribution to the total emissions of CO
2, N
2O, CH
4 and HFC in individual EU-27 member states. The highest percentages of CO
2 emissions from aviation (
Figure 6, black plot) were observed in Luxembourg (almost 50%) and Ireland (30%). The highest percentage of N
2O emissions from aviation (
Figure 6, red plot) was observed in Luxembourg (approximately 12%).
In 2018, the percentages of aviation’s contribution to CH
4 emissions (
Figure 7, black plot) and HFC emissions (
Figure 7, red plot) were below 0.6% in all EU countries.
3.2. Comparison of EU-27 Countries by Applying Multiple-Criteria Statistical Methods
The impact of aviation on greenhouse gas emissions in the EU member states was characterized using several selected parameters (
Table 1).
3.2.1. PCA Method
When analyzing and evaluating the data, the first step was to identify whether the input variables correlated, i.e., whether they exhibited any relationships. As the monitored variables were measured in different units, the relationships between them were identified using the correlation matrix (
Table 2). The relationship between two variables was determined by the coefficient of correlation
r. We used the following scale: no correlation (|
r| < 0.29), weak correlation (0.30 < |
r| < 0.49), moderate correlation (0.50 < |
r| < 0.79) and strong correlation (S, 0.80 < |
r| < 1).
The results of the correlation matrix indicated that there were very strong correlations, for example, between aviation share of CO2 emissions (A11) and aviation share of total GHG emissions (A10) (r = 0.99), amount of aviation transported goods (A8) and aviation share of HFC emissions (A14) (r = 0.96), aviation share of total GHG emissions (A10) and aviation share of HFC emissions (A14) (r = 0.93), aviation share of CO2 emissions (A11) and aviation share of HFC emissions (A14) (r = 0.93), aviation share of total GHG emissions (A10) and amount of aviation transported goods (A8) (r = 0.90), aviation share of CO2 emissions (A11) and amount of aviation transported goods (A8) (r = 0.90), aviation share of CO2 emissions (A11) and number of aviation transported passengers (A7) (r = 0.86), aviation share of total GHG emissions (A10) and number of aviation transported passengers (A7) (r = 0.86), total greenhouse gas (A9) and number of aviation transported passengers (A7) (r = 0.86), total greenhouse gas (A9) and amount of aviation transported goods (A8) (r = 0.85) and number of commercial airports with more than 15,000 passengers per year (A6) and population (A1) (r = 0.87). Due to the fact that there were relatively strong relationships between many pairs, new independent variables were identified by applying the method of principal component analysis (PCA). This method facilitated replacing the original variables with new, independent variables—the principal components.
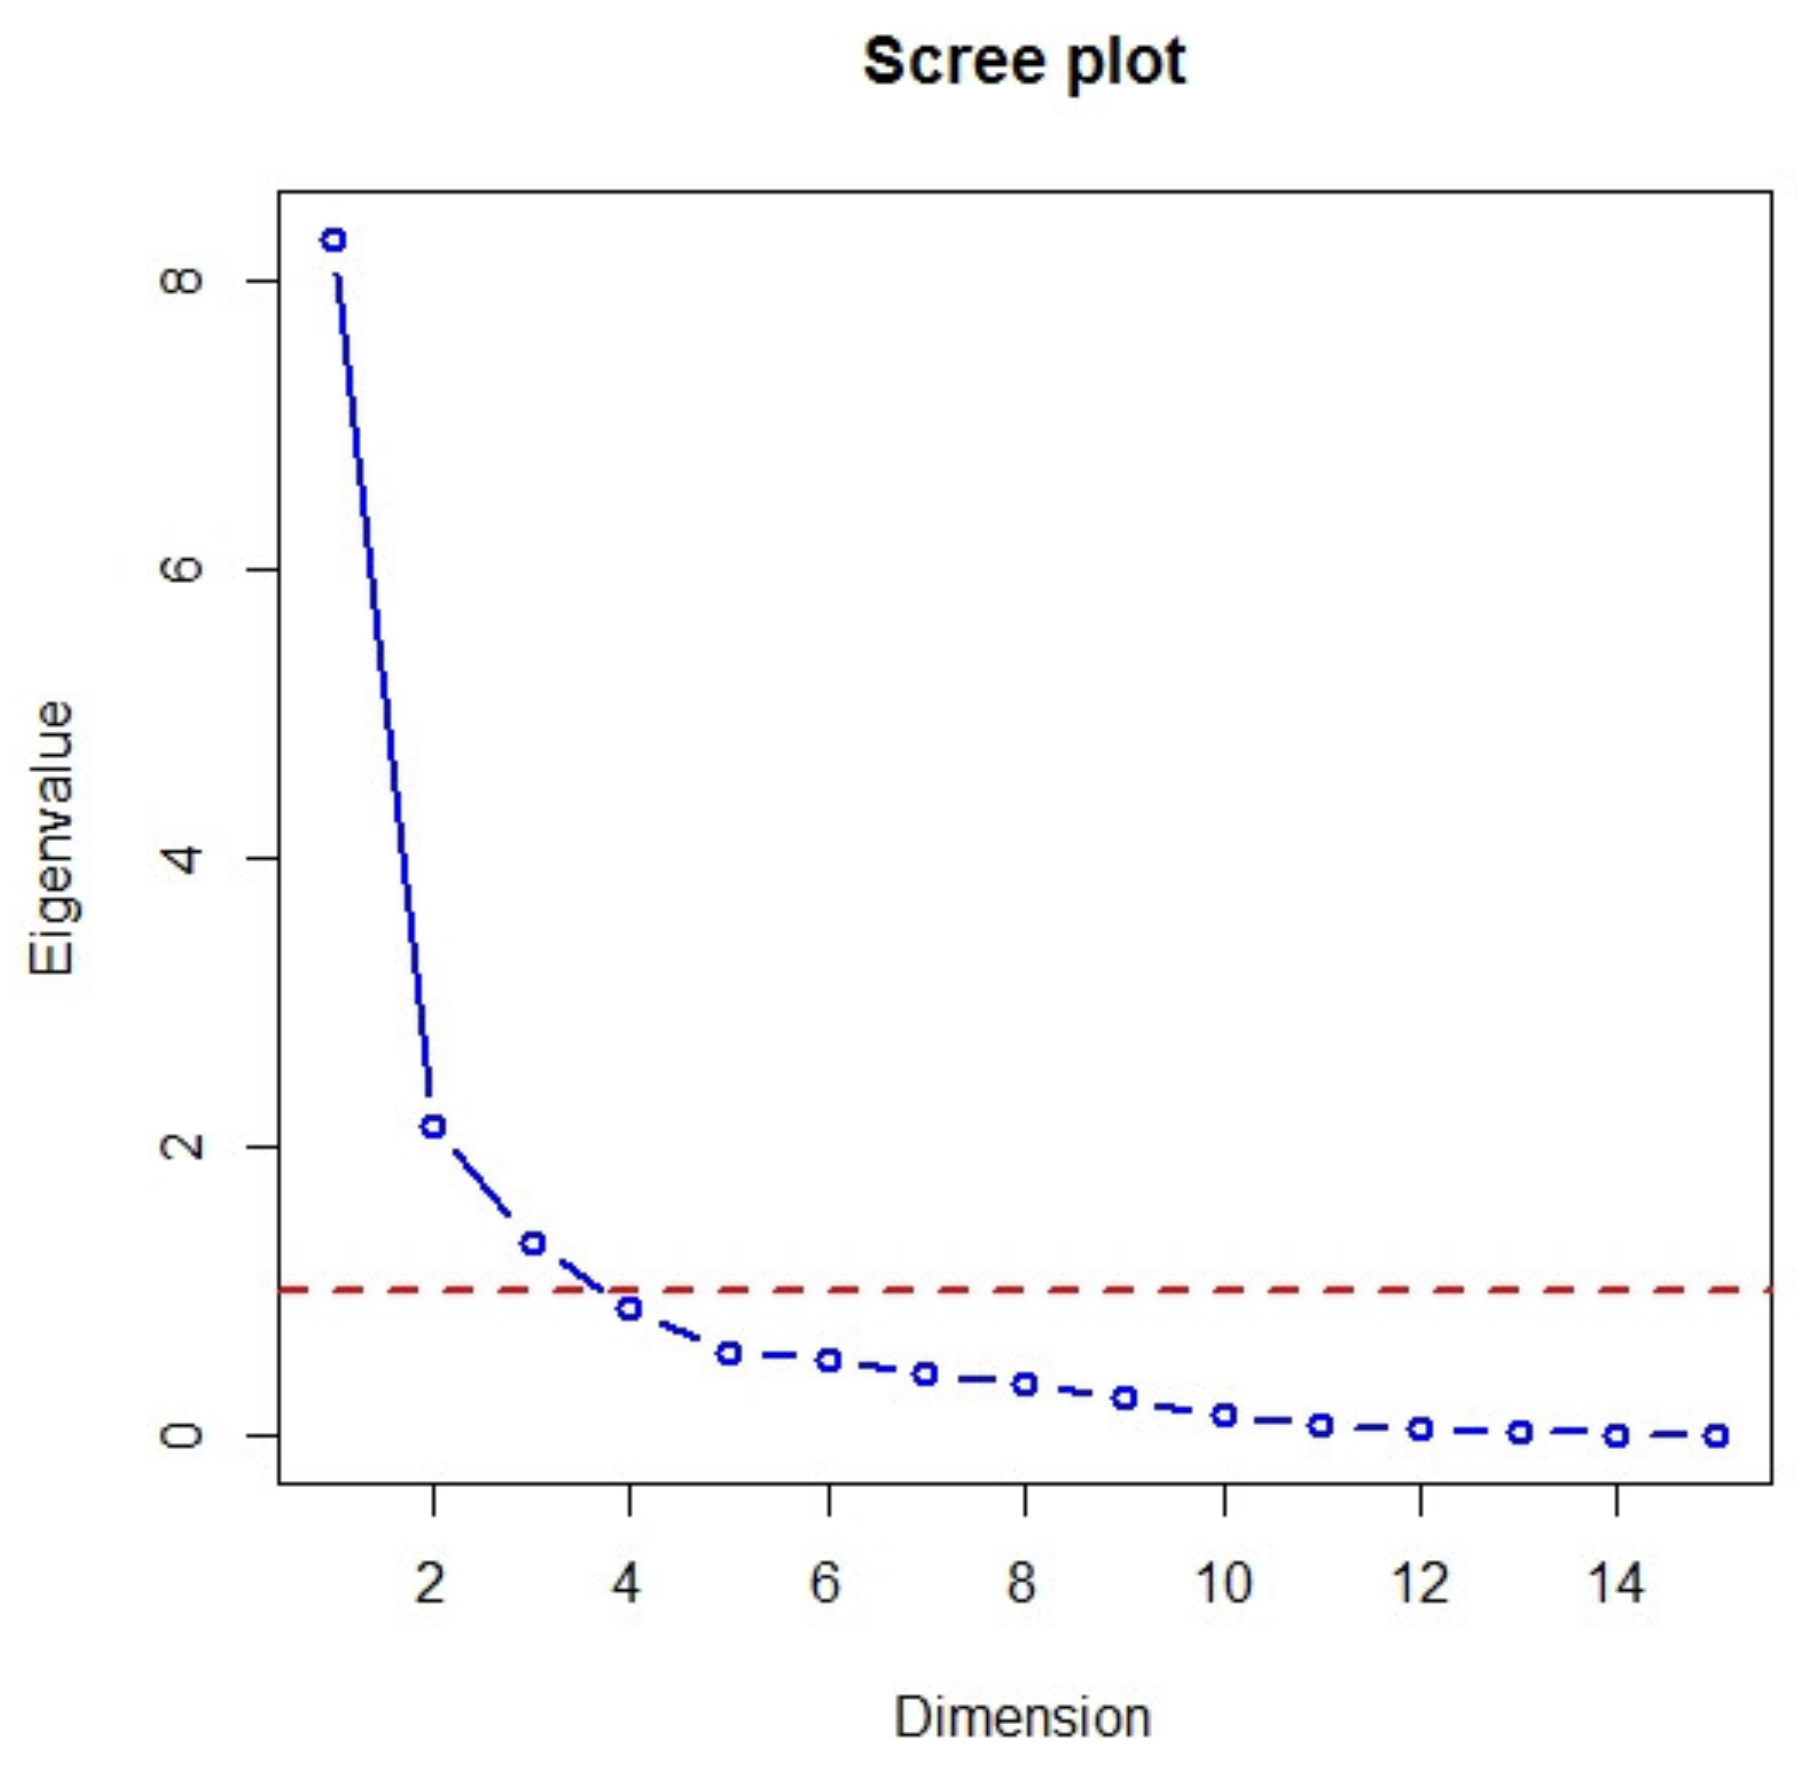
The principal components were identified using the eigenvalues shown in
Figure 8. A scree plot (
Figure 8, blue line) displays the eigenvalues for each new component (dimension) in a downward curve. The red dashed line corresponds to an eigenvalue of 1. The eigenvalue for the first principal component was 8.3, the second was 2.1 and the third was 1.3 (
Table 3). The first principal component described approximately 55.3% of the cumulative variance of the data, the second component described 14.3% and the third component described 8.9% of the cumulative variance. The other components represented approximately 21.5% of the cumulative variance. The eigenvalues and variance of the PCA components are listed in
Table 3.
The number of principal components was identified by applying the Kaiser–Guttman rule. We considered the components with eigenvalues higher than 1. This means that the identification of new variables was carried out using the first three principal components, which together covered almost 78.5% of the cumulative variance in the data.
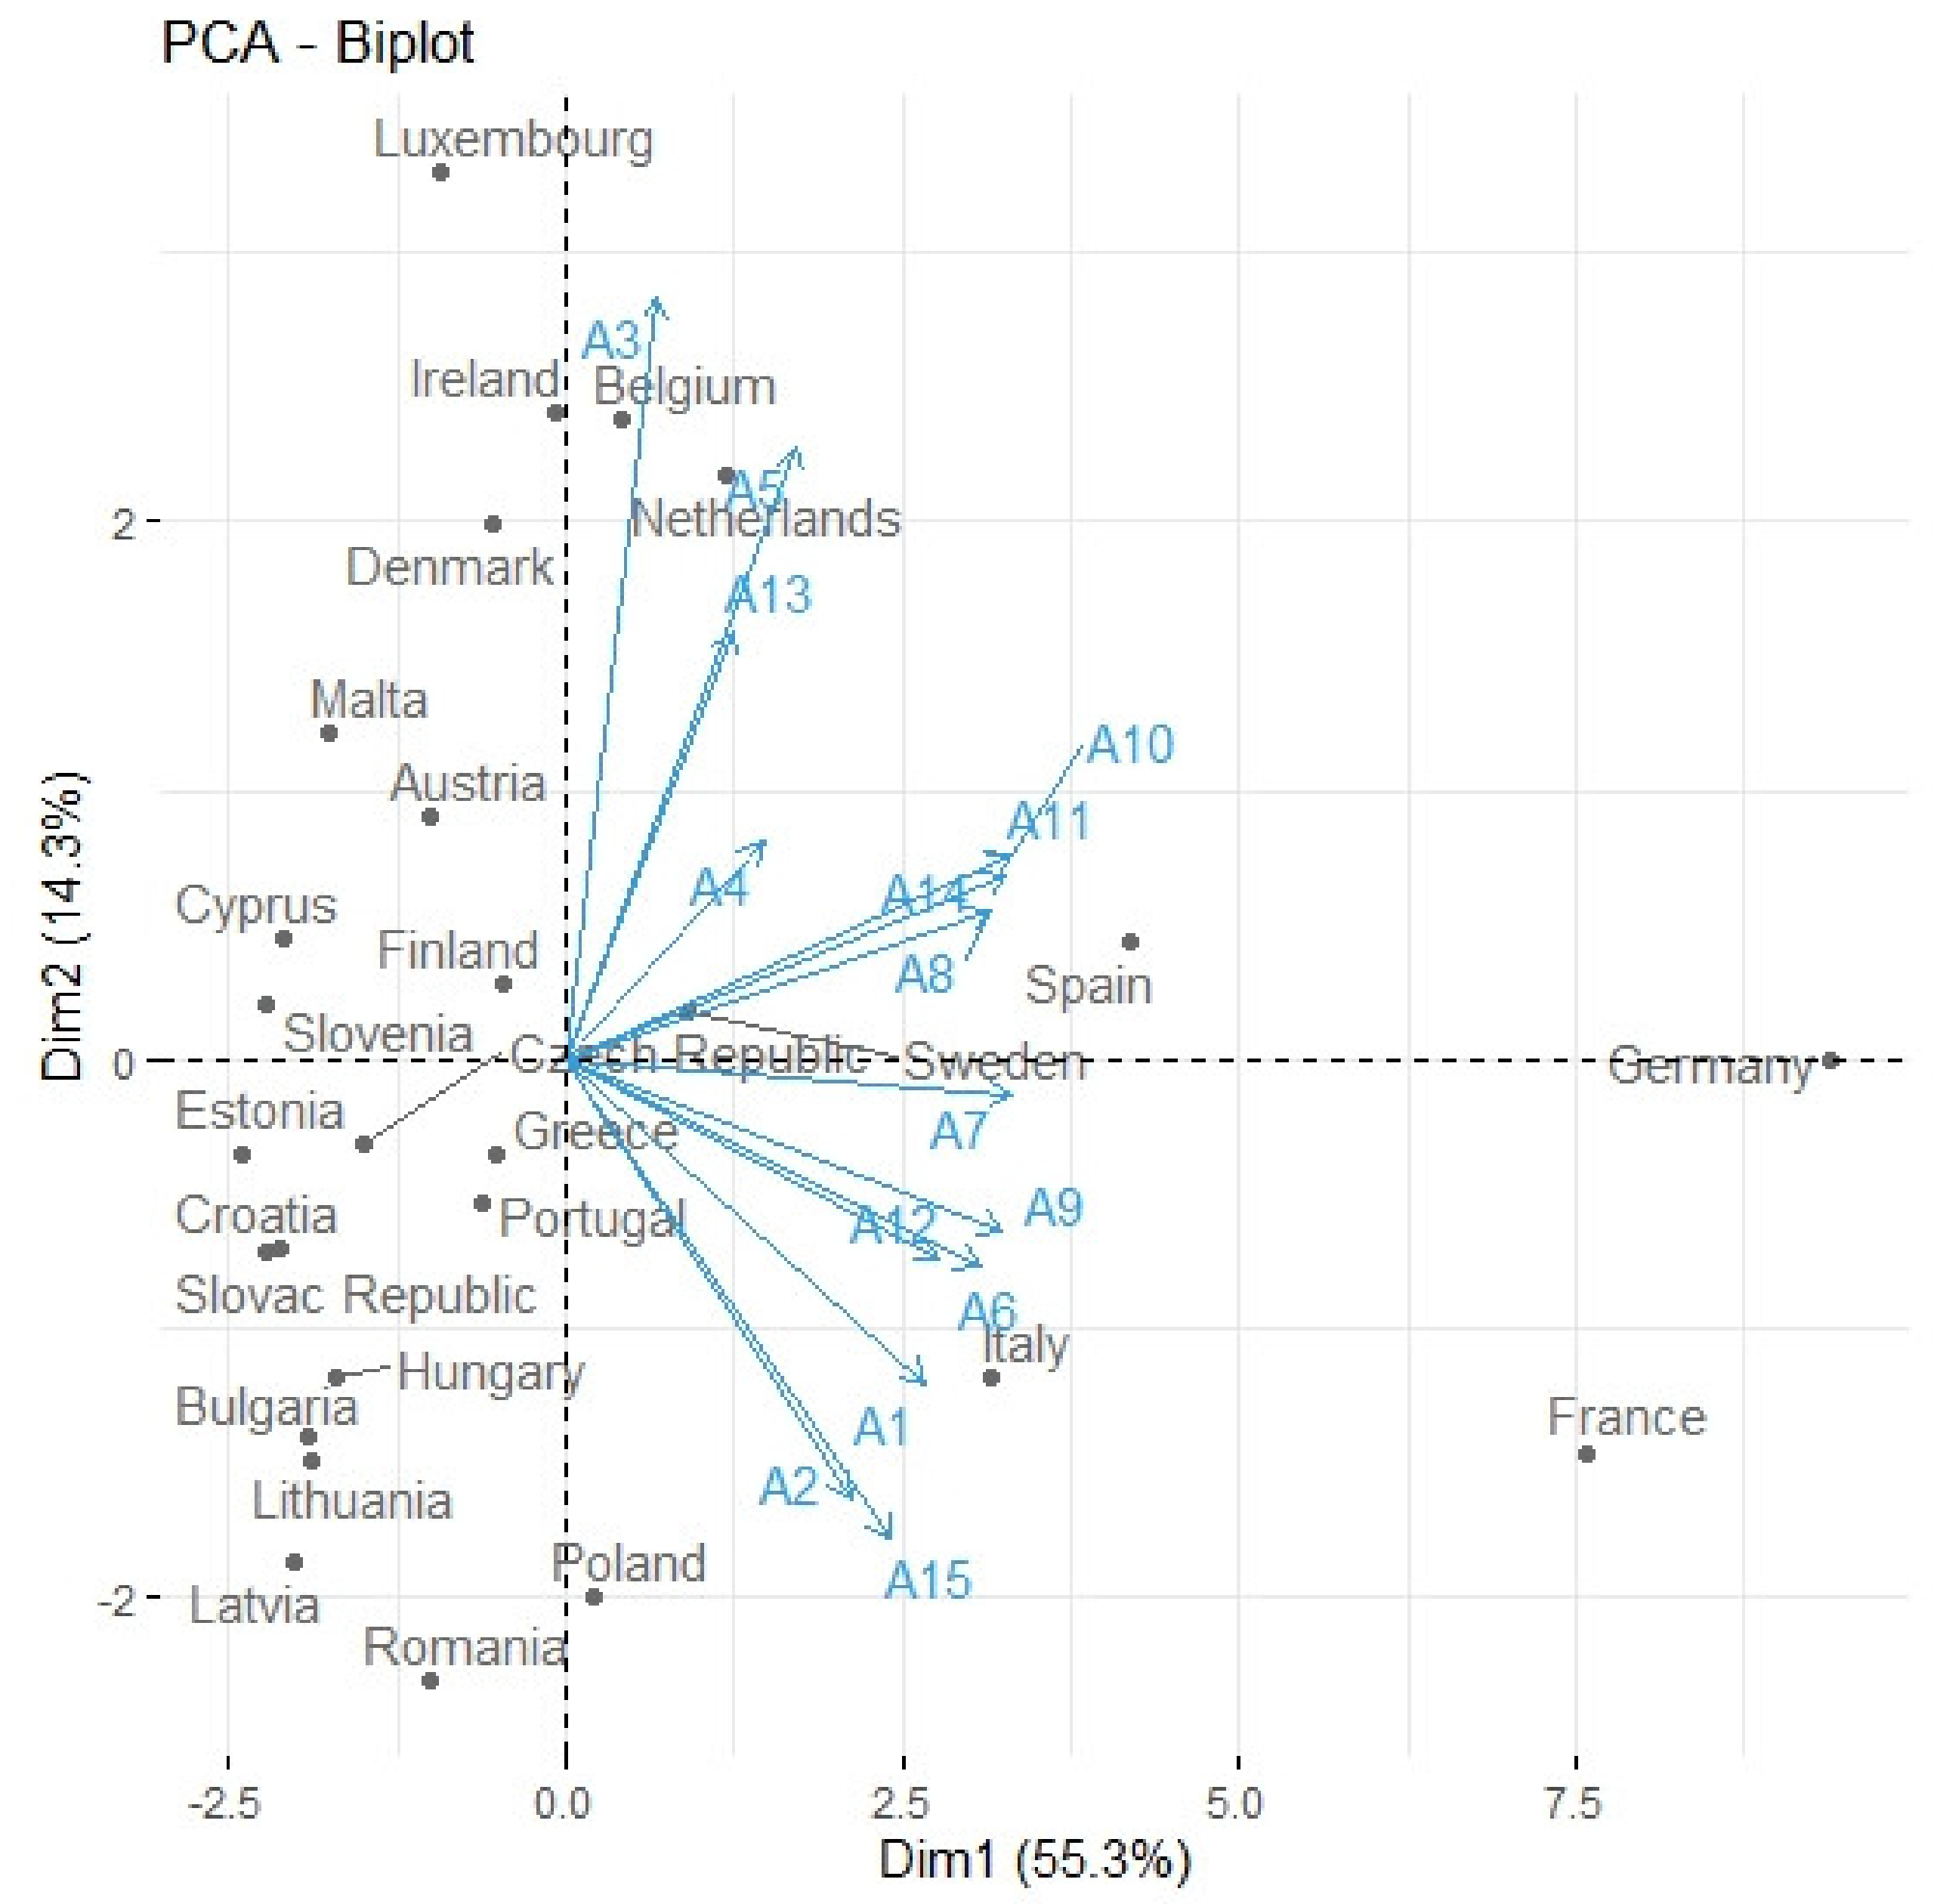
The eigenvector coefficients, i.e., the component matrix, for the first three principal components are listed in
Table 4. The first principal component Dim1 consisted mainly of attributes A1, A2, A6 through A12, and A15. The second principal component Dim2 consisted mainly of attributes A3, A5 and A13. The third principal component Dim3 was mainly affected by attribute A4.
The graphical representation of the data for the original attributes in the coordinate system of one principal component in relation to the second principal component is shown in
Figure 9.
The plot indicates that France and Germany, when compared to other EU-27 member states, seem to be the outliers. Similarly, Luxembourg, Italy and Spain also exhibited marked differences from the other member states.
3.2.2. Cluster Analysis
The member states with similar monitored characteristics were grouped by applying a cluster analysis. Agglomerative hierarchical methods were gradually applied: average linkage clustering, nearest neighbor algorithm, Ward’s method and median clustering. The distance measure was the Euclidean distance, which is the most frequently used measure, and the input variables were the three principal components created by applying the PCA method.
The verification of the accuracy of the results and the identification of the best clustering method were carried out using the cophenetic correlation coefficient CC (
Table 5). The highest value of the cophenetic correlation coefficient determined the best clustering method. The closer its value is to one, the more suitable the method of hierarchical agglomerative clustering is for the expression of the structure of the analyzed data. The results indicated that the best clustering method was probably the average linkage method.
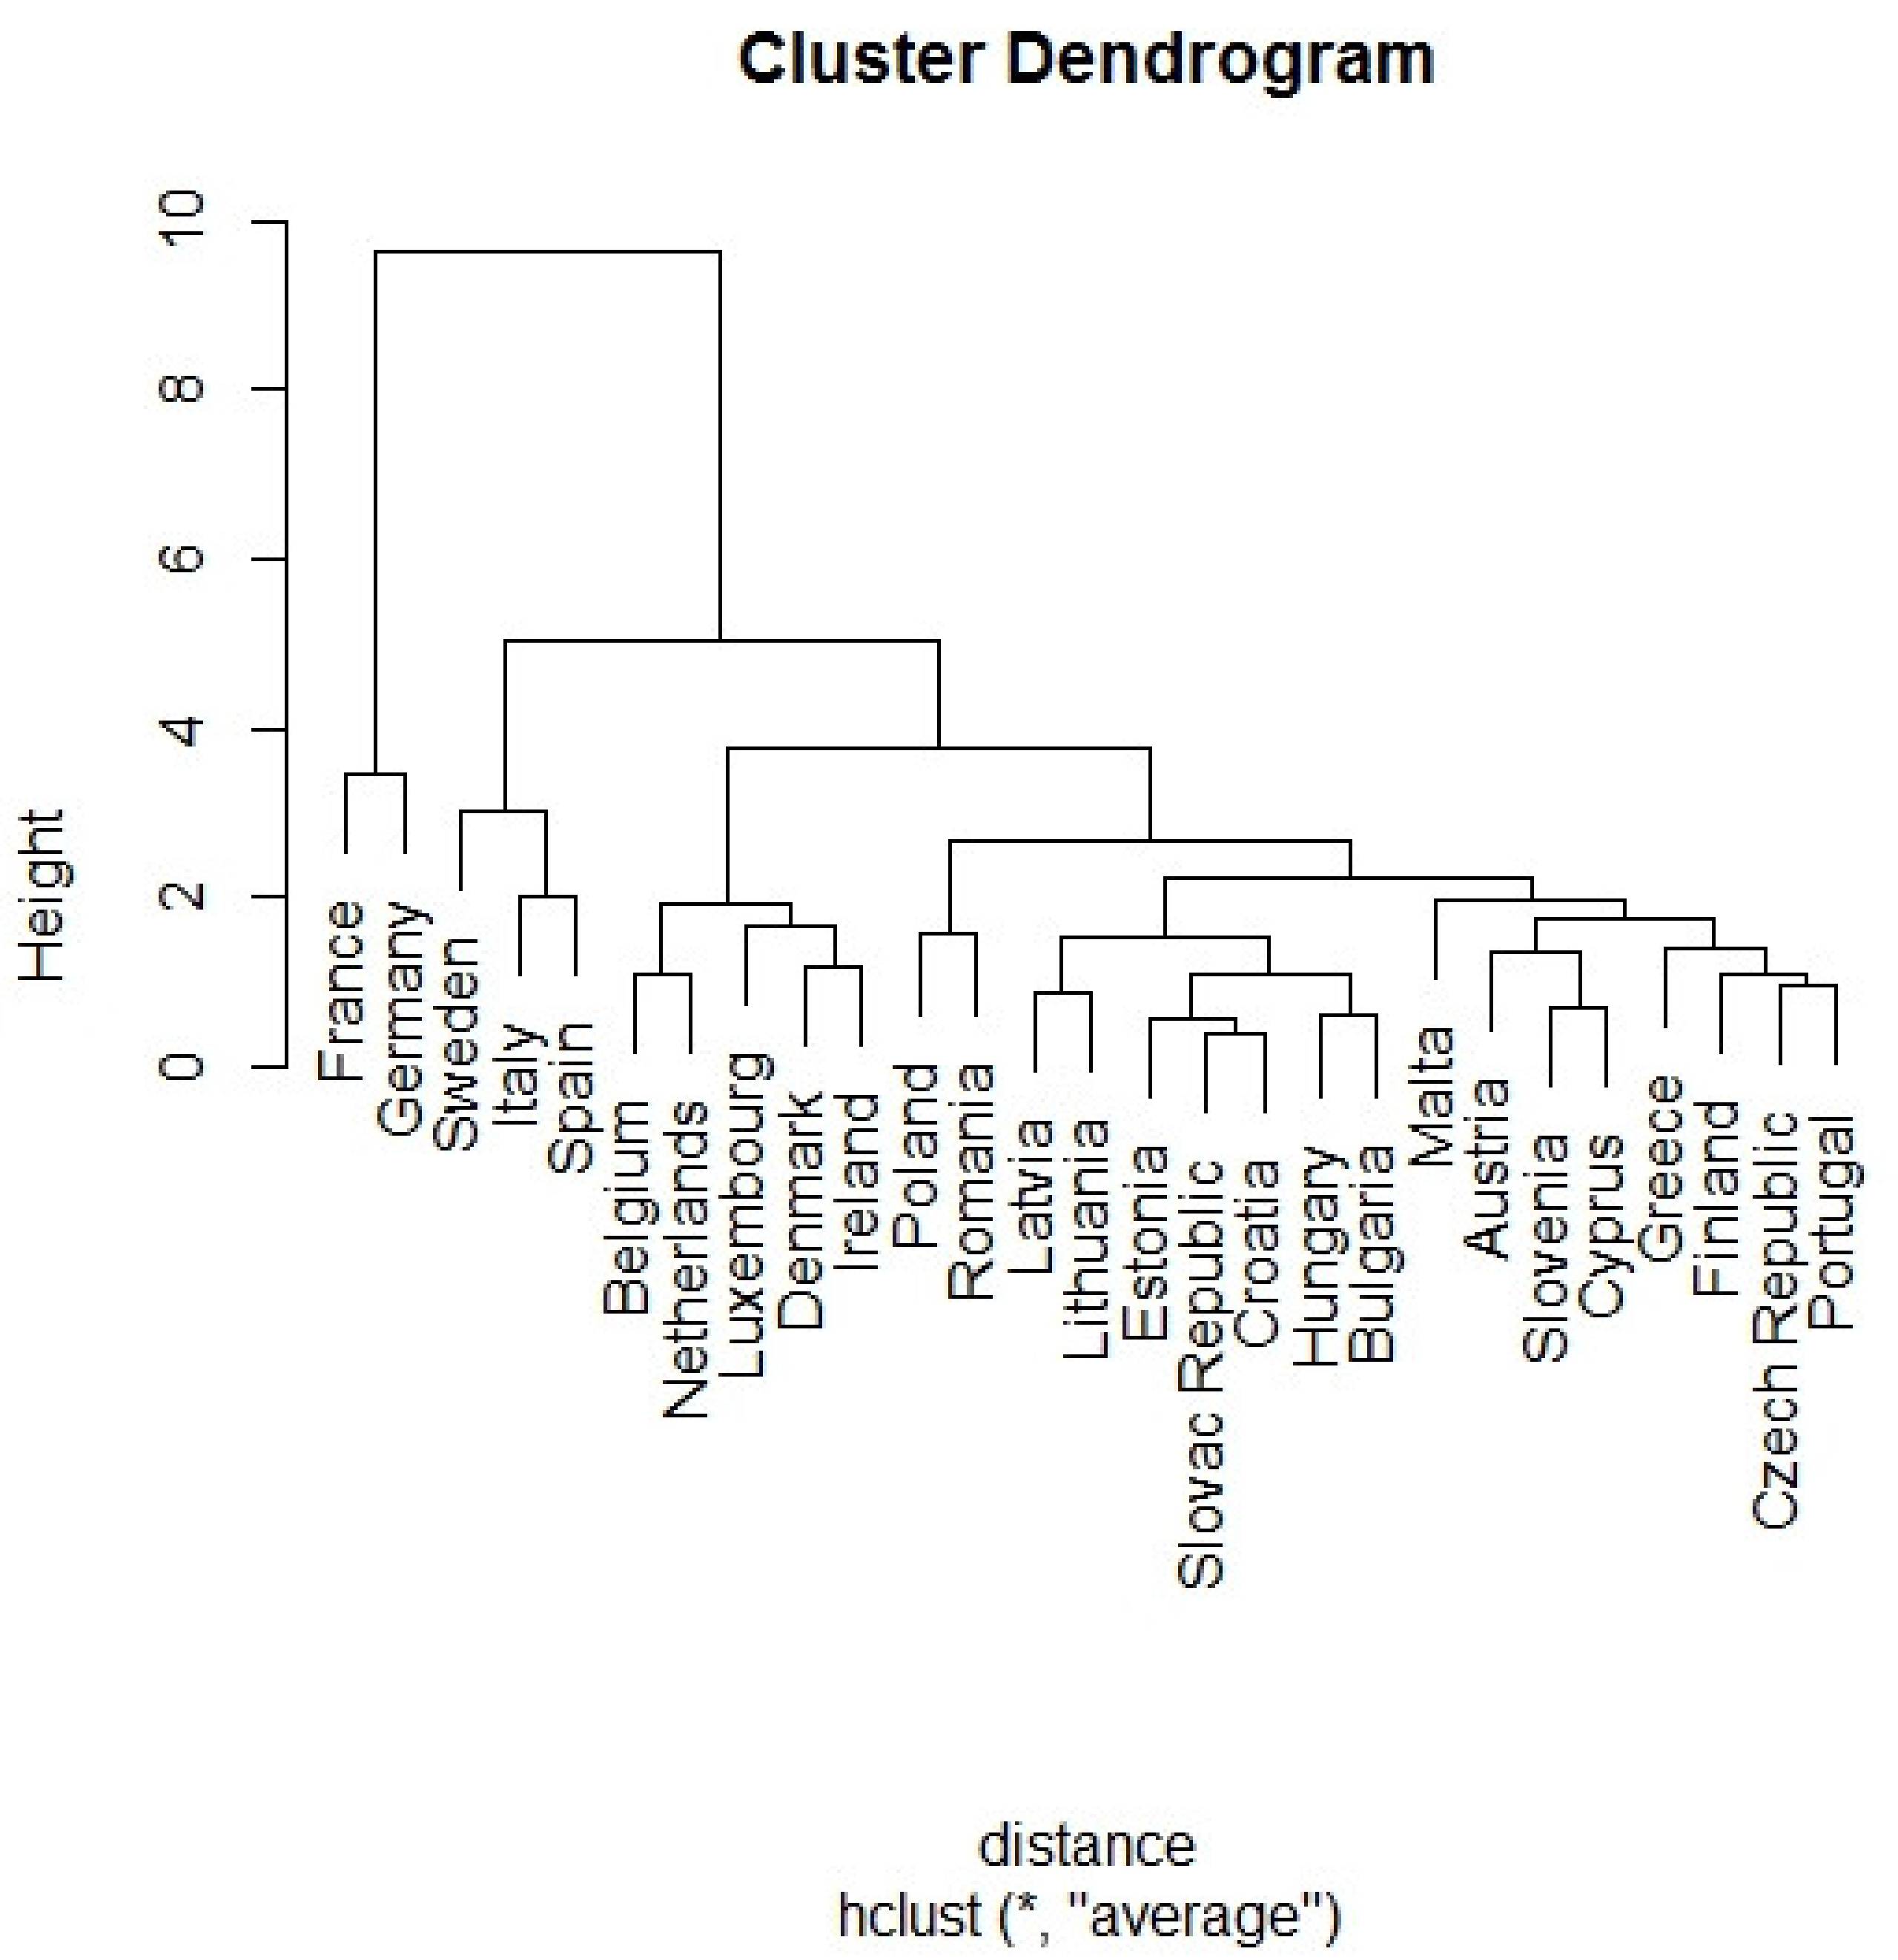
The results of the cluster analysis of the selected parameters that characterized the countries and represented the impact of aviation on greenhouse gas emissions in the air of the EU-27 countries are shown in
Figure 10. The dendrogram indicates that Germany and France formed one cluster. Another cluster consisted of Spain, Sweden and Italy. The third cluster consisted of Belgium, Netherlands, Luxembourg, Denmark and Ireland. The remaining member states were grouped into one big cluster (
Table 6).
4. Conclusions
The purpose of the existing EU policies aimed at reducing air pollution is to achieve an air quality that does not cause significant negative effects on human health and the environment.
The total greenhouse gas emissions in the EU-27 have decreased in recent years, but the percentage of the contribution of all forms of transport (including the aviation) to the production of greenhouse gas emissions has increased.
The present study examined information on the greenhouse gas emissions in the EU-27 member states. The utilization of other available data (population, area, life expectancy, number of airports, etc.) facilitated a comparison of the individual member states by applying multiple-criteria statistical methods. The result was the creation of clusters consisting of similar member states, while also considering the impact of aviation on the amount of greenhouse gas emissions. The processed data indicated that the EU member states may be divided into four groups based on their similarities. Group 1 consisted of Germany and France; Group 2 consisted of Spain, Sweden and Italy; and Group 3 consisted of Belgium, Netherlands, Luxembourg, Denmark and Ireland. The remaining member states were grouped into one big cluster of countries with similar characteristics. This analysis of the impact of aviation on the amount of greenhouse gas emissions demonstrates the differences between individual EU countries.
Aviation is a strong sector within the European Union economy, and its importance exhibits continuing expansion. Nevertheless, every member state in the EU-27 should also realize that, along with the growth of air transport, the reduction of greenhouse gas emissions becomes increasingly important for the sake of public health and safety.


