Profiles on the Orientation Discrimination Processing of Human Faces


Abstract
:1. Introduction
2. Methods
2.1. Participants
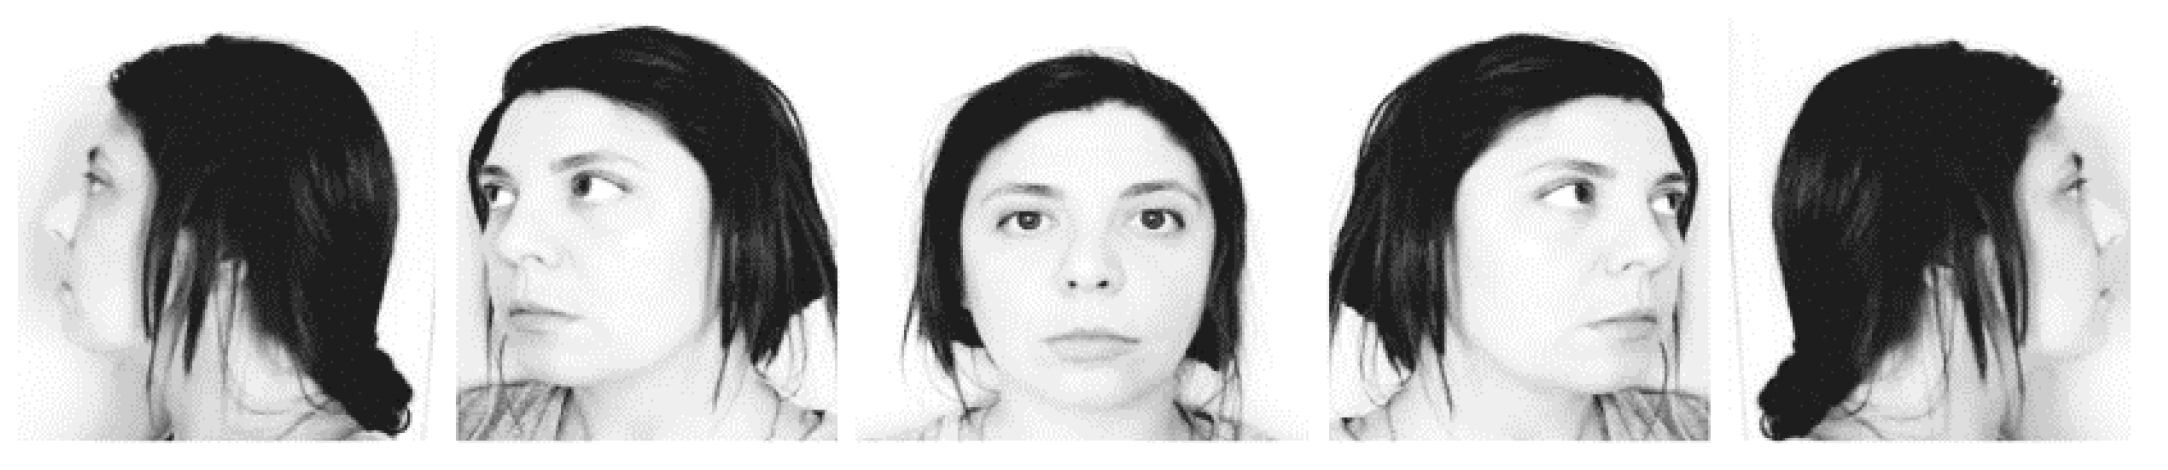
2.2. Materials
2.3. Procedure
2.4. Design and Data Analysis
3. Results
4. Discussion
5. Conclusions
Author Contributions
Funding
Acknowledgments
Conflicts of Interest
References
- Kortli, Y.; Jridi, M.; Al Falou, A.; Atri, M. Face Recognition Systems: A Survey. Sensors 2020, 20, 342. [Google Scholar] [CrossRef] [PubMed] [Green Version]
- Smart, N.R.; Horwell, C.J.; Smart, T.S.; Galea, K.S. Assessment of the Wearability of Facemasks against Air Pollution in Primary School-Aged Children in London. Int. J. Environ. Res. Public Health 2020, 17, 3935. [Google Scholar] [CrossRef] [PubMed]
- Almabdy, S.; Elrefaei, L. Deep Convolutional Neural Network-Based Approaches for Face Recognition. Appl. Sci. 2019, 9, 4397. [Google Scholar] [CrossRef] [Green Version]
- Biederman, I.; Shilowich, B.E.; Herald, S.B.; Margalit, E.; Maarek, R.; Meschke, E.X.; Hacker, C.M. The cognitive neuroscience of person identification. Neuropsychologia 2018, 116, 205–214. [Google Scholar] [CrossRef] [PubMed]
- Hupp, S.; Jewell, J. The Encyclopedia of Child and Adolescent Development, 1st ed.; Hupp, S., Jewell, J., Eds.; Wiley: Hoboken, NJ, USA, 2019; ISBN 978-1-119-16189-9. [Google Scholar]
- Morton, J.; Johnson, M.H. CONSPEC and CONLERN: A two-process theory of infant face recognition. Psychol. Rev. 1991, 98, 164–181. [Google Scholar] [CrossRef] [PubMed] [Green Version]
- Haxby, J.V.; Hoffman, E.A.; Gobbini, M.I. Human neural systems for face recognition and social communication. Biol. Psychiatry 2002, 51, 59–67. [Google Scholar] [CrossRef]
- Kanwisher, N.; McDermott, J.; Chun, M.M. The Fusiform Face Area: A Module in Human Extrastriate Cortex Specialized for Face Perception. J. Neurosci. 1997, 17, 4302–4311. [Google Scholar] [CrossRef]
- Dehaene, S.; Cohen, L. The unique role of the visual word form area in reading. Trends Cogn. Sci. 2011, 15, 254–262. [Google Scholar] [CrossRef]
- Rossion, B.; Hanseeuw, B.; Dricot, L. Defining face perception areas in the human brain: A large-scale factorial fMRI face localizer analysis. Brain Cogn. 2012, 79, 138–157. [Google Scholar] [CrossRef]
- Mei, L.; Xue, G.; Chen, C.; Xue, F.; Zhang, M.; Dong, Q. The “visual word form area” is involved in successful memory encoding of both words and faces. NeuroImage 2010, 52, 371–378. [Google Scholar] [CrossRef] [Green Version]
- Centanni, T.M.; Norton, E.S.; Park, A.; Beach, S.D.; Halverson, K.; Ozernov-Palchik, O.; Gaab, N.; Gabrieli, J.D. Early development of letter specialization in left fusiform is associated with better word reading and smaller fusiform face area. Dev. Sci. 2018, 21, e12658. [Google Scholar] [CrossRef] [PubMed]
- O’Toole, A.J.; Roark, D.A.; Abdi, H. Recognizing moving faces: A psychological and neural synthesis. Trends Cogn. Sci. 2002, 6, 261–266. [Google Scholar] [CrossRef]
- Haxby, J.V.; Hoffman, E.A.; Gobbini, M.I. The distributed human neural system for face perception. Trends Cogn. Sci. 2000, 4, 223–233. [Google Scholar] [CrossRef]
- Aglinskas, A.; Fairhall, S.L. Regional Specialization and Coordination Within the Network for Perceiving and Knowing About Others. Cereb. Cortex 2019, 30, 836–848. [Google Scholar] [CrossRef] [PubMed]
- Ramon, M.; Gobbini, M.I. Familiarity matters: A review on prioritized processing of personally familiar faces. Vis. Cogn. 2018, 26, 179–195. [Google Scholar] [CrossRef]
- Andrews, T.J.; Davies-Thompson, J.; Kingstone, A.; Young, A.W. Internal and External Features of the Face Are Represented Holistically in Face-Selective Regions of Visual Cortex. J. Neurosci. 2010, 30, 3544–3552. [Google Scholar] [CrossRef]
- Pascalis, O.; Slater, A. The Development of Face Processing in Infancy and Early Childhood: Current Perspectives; Pascalis, O., Slater, A., Eds.; Nova Science Publishers, Inc.: New York, NY, USA, 2003; ISBN 978-1-59033-775-2. [Google Scholar]
- Norton, D.; McBain, R.; Chen, Y. Reduced Ability to Detect Facial Configuration in Middle-Aged and Elderly Individuals: Associations With Spatiotemporal Visual Processing. J. Gerontol. B. Psychol. Sci. Soc. Sci. 2009, 64, 328–334. [Google Scholar] [CrossRef] [Green Version]
- Megreya, A.M.; Bindemann, M. Developmental Improvement and Age-Related Decline in Unfamiliar Face Matching. Perception 2015, 44, 5–22. [Google Scholar] [CrossRef] [Green Version]
- Sunday, M.A.; Dodd, M.D.; Tomarken, A.J.; Gauthier, I. How faces (and cars) may become special. Vis. Res. 2019, 157, 202–212. [Google Scholar] [CrossRef]
- Sunday, M.A.; Patel, P.A.; Dodd, M.D.; Gauthier, I. Gender and hometown population density interact to predict face recognition ability. Vis. Res. 2019, 163, 14–23. [Google Scholar] [CrossRef]
- Sigurdardottir, H.M.; Hjartarson, K.H.; Gudmundsson, G.L.; Kristjánsson, Á. Own-race and other-race face recognition problems without visual expertise problems in dyslexic readers. Vis. Res. 2019, 158, 146–156. [Google Scholar] [CrossRef] [PubMed]
- Moret-Tatay, C.; Murphy, M. Editorial: Aging in the Digital Era. Front. Psychol. 2019, 10, 1815. [Google Scholar] [CrossRef] [PubMed]
- Lopatina, O.L.; Komleva, Y.K.; Gorina, Y.V.; Higashida, H.; Salmina, A.B. Neurobiological Aspects of Face Recognition: The Role of Oxytocin. Front. Behav. Neurosci. 2018, 12, 195. [Google Scholar] [CrossRef] [PubMed]
- Moret-Tatay, C.; Baixauli-Fortea, I.; Sevilla, M.D.G.; Irigaray, T.Q. Can You Identify These Celebrities? A Network Analysis on Differences between Word and Face Recognition. Mathematics 2020, 8, 699. [Google Scholar] [CrossRef]
- Devue, C.; Wride, A.; Grimshaw, G.M. New insights on real-world human face recognition. J. Exp. Psychol. Gen. 2019, 148, 994–1007. [Google Scholar] [CrossRef] [Green Version]
- Chu, Y.; Ahmad, T.; Bebis, G.; Zhao, L. Low-resolution face recognition with single sample per person. Signal Process. 2017, 141, 144–157. [Google Scholar] [CrossRef]
- Lee, K.-C.; Ho, J.; Kriegman, D.J. Acquiring linear subspaces for face recognition under variable lighting. IEEE Trans. Pattern Anal. Mach. Intell. 2005, 27, 684–698. [Google Scholar] [CrossRef]
- Perlibakas, V. Distance measures for PCA-based face recognition. Pattern Recognit. Lett. 2004, 25, 711–724. [Google Scholar] [CrossRef]
- Rinaldi, L.; Di Luca, S.; Henik, A.; Girelli, L. Reading direction shifts visuospatial attention: An Interactive Account of attentional biases. Acta Psychol. 2014, 151, 98–105. [Google Scholar] [CrossRef]
- Kazandjian, S.; Cavézian, C.; Zivotofsky, A.Z.; Chokron, S. Bisections in two languages: When number processing, spatial representation, and habitual reading direction interact. Neuropsychologia 2010, 48, 4031–4037. [Google Scholar] [CrossRef]
- Chokron, S.; Imbert, M. Influence of reading habits on line bisection. Cogn. Brain Res. 1993, 1, 219–222. [Google Scholar] [CrossRef]
- Faul, F.; Erdfelder, E.; Lang, A.-G.; Buchner, A. G*Power 3: A flexible statistical power analysis program for the social, behavioral, and biomedical sciences. Behav. Res. Methods 2007, 39, 175–191. [Google Scholar] [CrossRef] [PubMed]
- Calvo, M.G.; Lundqvist, D. Facial expressions of emotion (KDEF): Identification under different display-duration conditions. Behav. Res. Methods 2008, 40, 109–115. [Google Scholar] [CrossRef] [PubMed] [Green Version]
- Forster, K.I.; Forster, J.C. DMDX: A Windows display program with millisecond accuracy. Behav. Res. Methods Instrum. Comput. 2003, 35, 116–124. [Google Scholar] [CrossRef] [PubMed] [Green Version]
- Selvam, S.; Balakrishnan, R.; Ramakrishnan, B.S. Ontology With Hybrid Clustering Approach for Improving the Retrieval Relevancy in Social Event Detection. Int. J. Semant. Web Inf. Syst. 2018, 14, 33–56. [Google Scholar] [CrossRef] [Green Version]
- Van Hoey, J.; Moret-Tatay, C.; Santolaya Prego de Oliver, J.A.; Beneyto-Arrojo, M.J. Profile Changes in Male Partner Abuser After an Intervention Program in Gender-Based Violence. Int. J. Offender Ther. Comp. Criminol. 2019, 0306624X19884170. [Google Scholar] [CrossRef]
- Zhen, Z.; Fang, H.; Liu, J. The Hierarchical Brain Network for Face Recognition. PLoS ONE 2013, 8, e59886. [Google Scholar] [CrossRef] [Green Version]
- Henry, D.B.; Tolan, P.H.; Gorman-Smith, D. Cluster Analysis in Family Psychology Research. J. Fam. Psychol. 2005, 19, 121–132. [Google Scholar] [CrossRef]
- Moret-Tatay, C.; Lemus-Zúñiga, L.-G.; Tortosa, D.A.; Gamermann, D.; Vázquez-martínez, A.; Navarro-Pardo, E.; Conejero, J.A. Age slowing down in detection and visual discrimination under varying presentation times. Scand. J. Psychol. 2017, 58, 304–311. [Google Scholar] [CrossRef]
- Moret-Tatay, C.; Lami, A.; Oliveira, C.R.; Beneyto-Arrojo, M.J. The mediational role of distracting stimuli in emotional word recognition. Psicol. Reflex. E Crítica 2018, 31, 1. [Google Scholar] [CrossRef] [Green Version]
- Sellke, T.; Bayarri, M.J.; Berger, J.O. Calibration of ρ Values for Testing Precise Null Hypotheses. Am. Stat. 2001, 55, 62–71. [Google Scholar] [CrossRef]
- Nuzzo, R. Scientific method: Statistical errors. Nature 2014, 506, 150–152. [Google Scholar] [CrossRef] [PubMed] [Green Version]
- Cureton, E.E. Rank-biserial correlation. Psychometrika 1956, 21, 287–290. [Google Scholar] [CrossRef]
- Glezer, L.S.; Eden, G.; Jiang, X.; Luetje, M.; Napoliello, E.; Kim, J.; Riesenhuber, M. Uncovering phonological and orthographic selectivity across the reading network using fMRI-RA. NeuroImage 2016, 138, 248–256. [Google Scholar] [CrossRef] [Green Version]
- Ventura, P. Let’s face it: Reading acquisition, face and word processing. Front. Psychol. 2014, 5, 787. [Google Scholar] [CrossRef] [PubMed] [Green Version]
- Goffaux, V.; Greenwood, J.A. The orientation selectivity of face identification. Sci. Rep. 2016, 6, 34204. [Google Scholar] [CrossRef] [Green Version]
- Goffaux, V.; Rossion, B. Faces are “spatial”--holistic face perception is supported by low spatial frequencies. J. Exp. Psychol. Hum. Percept. Perform. 2006, 32, 1023–1039. [Google Scholar] [CrossRef] [Green Version]
- Burns, E.J.; Bennetts, R.J.; Bate, S.; Wright, V.C.; Weidemann, C.T.; Tree, J.J. Intact word processing in developmental prosopagnosia. Sci. Rep. 2017, 7, 1683. [Google Scholar] [CrossRef] [PubMed] [Green Version]
- Corrow, S.L.; Stubbs, J.L.; Schlaug, G.; Buss, S.; Paquette, S.; Duchaine, B.; Barton, J.J.S. Perception of musical pitch in developmental prosopagnosia. Neuropsychologia 2019, 124, 87–97. [Google Scholar] [CrossRef] [PubMed]
- Grbavec, A.; Fox, C.; Barton, J. Use of a correlative training method in the rehabilitation of acquired prosopagnosia. J. Vis. 2010, 9, 487. [Google Scholar] [CrossRef]


| Target | Distractor | Δ | ||||||
|---|---|---|---|---|---|---|---|---|
| Mean | SD | Accuracy | Mean | SD | Accuracy | Mean | SD | |
| Central | 916.95 | 212.99 | 73 | 947.76 | 196.02 | 80 | 30.81 | 150.29 |
| Partial right | 891.12 | 164.97 | 78 | 964.48 | 222.65 | 77 | 73.37 | 154.19 |
| Right Profile | 889.37 | 160.33 | 75 | 974.39 | 225.47 | 75 | 85.02 | 148.27 |
| Partial Left | 880.43 | 159.18 | 75 | 953.07 | 209.97 | 82 | 72.64 | 164.29 |
| Left profile | 865.87 | 177.62 | 71 | 989.00 | 224.21 | 79 | 123.13 | 173.13 |
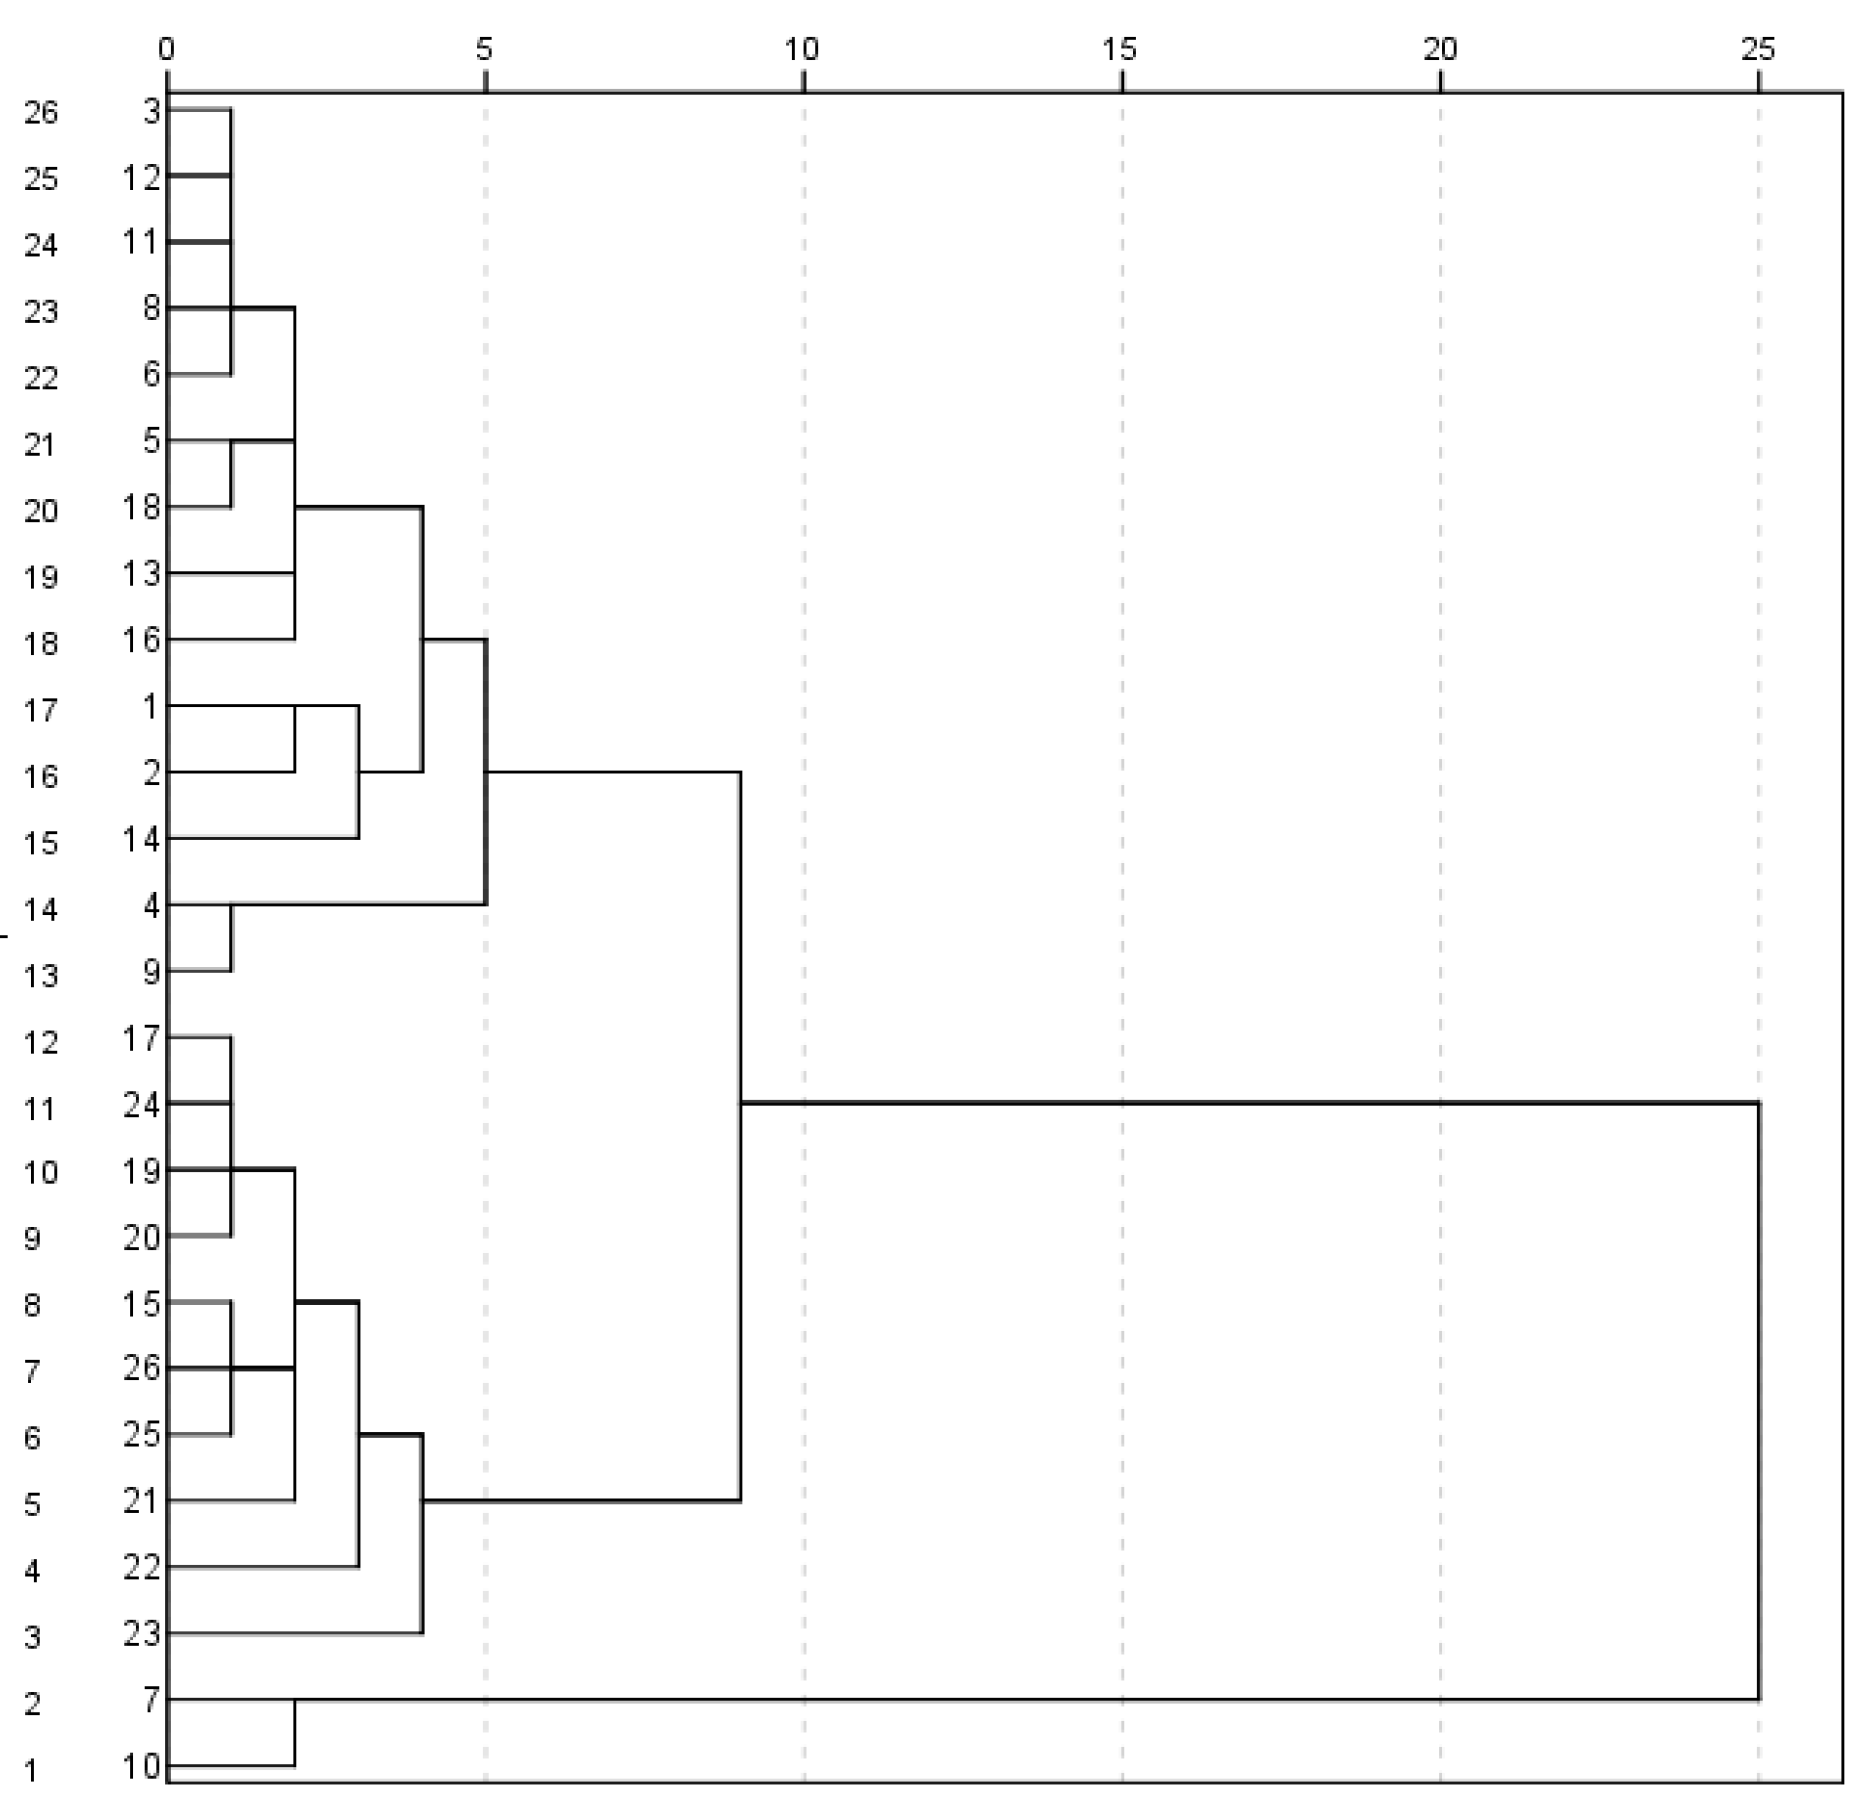
| Number | BIC | Δ BIC | Δ BIC Ratio | Distance Ratio |
|---|---|---|---|---|
| 1 | 120.166 | |||
| 2 | 111.049 | −9.117 | 1.000 | 1.976 |
| 3 | 122.533 | 11.484 | −1.260 | 4.279 |
| 4 | 150.185 | 27.651 | −3.033 | 1.116 |
| 5 | 178.349 | 28.164 | −3.089 | 1.571 |
| 6 | 208.118 | 29.770 | −3.265 | 1.234 |
| 7 | 238.421 | 30.303 | −3.324 | 1.174 |
| 8 | 269.062 | 30.640 | −3.361 | 1.860 |
| 9 | 300.599 | 31.537 | −3.459 | 1.031 |
| 10 | 332.168 | 31.569 | −3.463 | 1.234 |
| 11 | 363.929 | 31.761 | −3.484 | 1.015 |
| 12 | 395.702 | 31.773 | −3.485 | 1.136 |
| 13 | 427.572 | 31.870 | −3.496 | 1.070 |
| 14 | 459.488 | 31.916 | −3.501 | 1.016 |
| 15 | 491.415 | 31.927 | −3.502 | 1.066 |
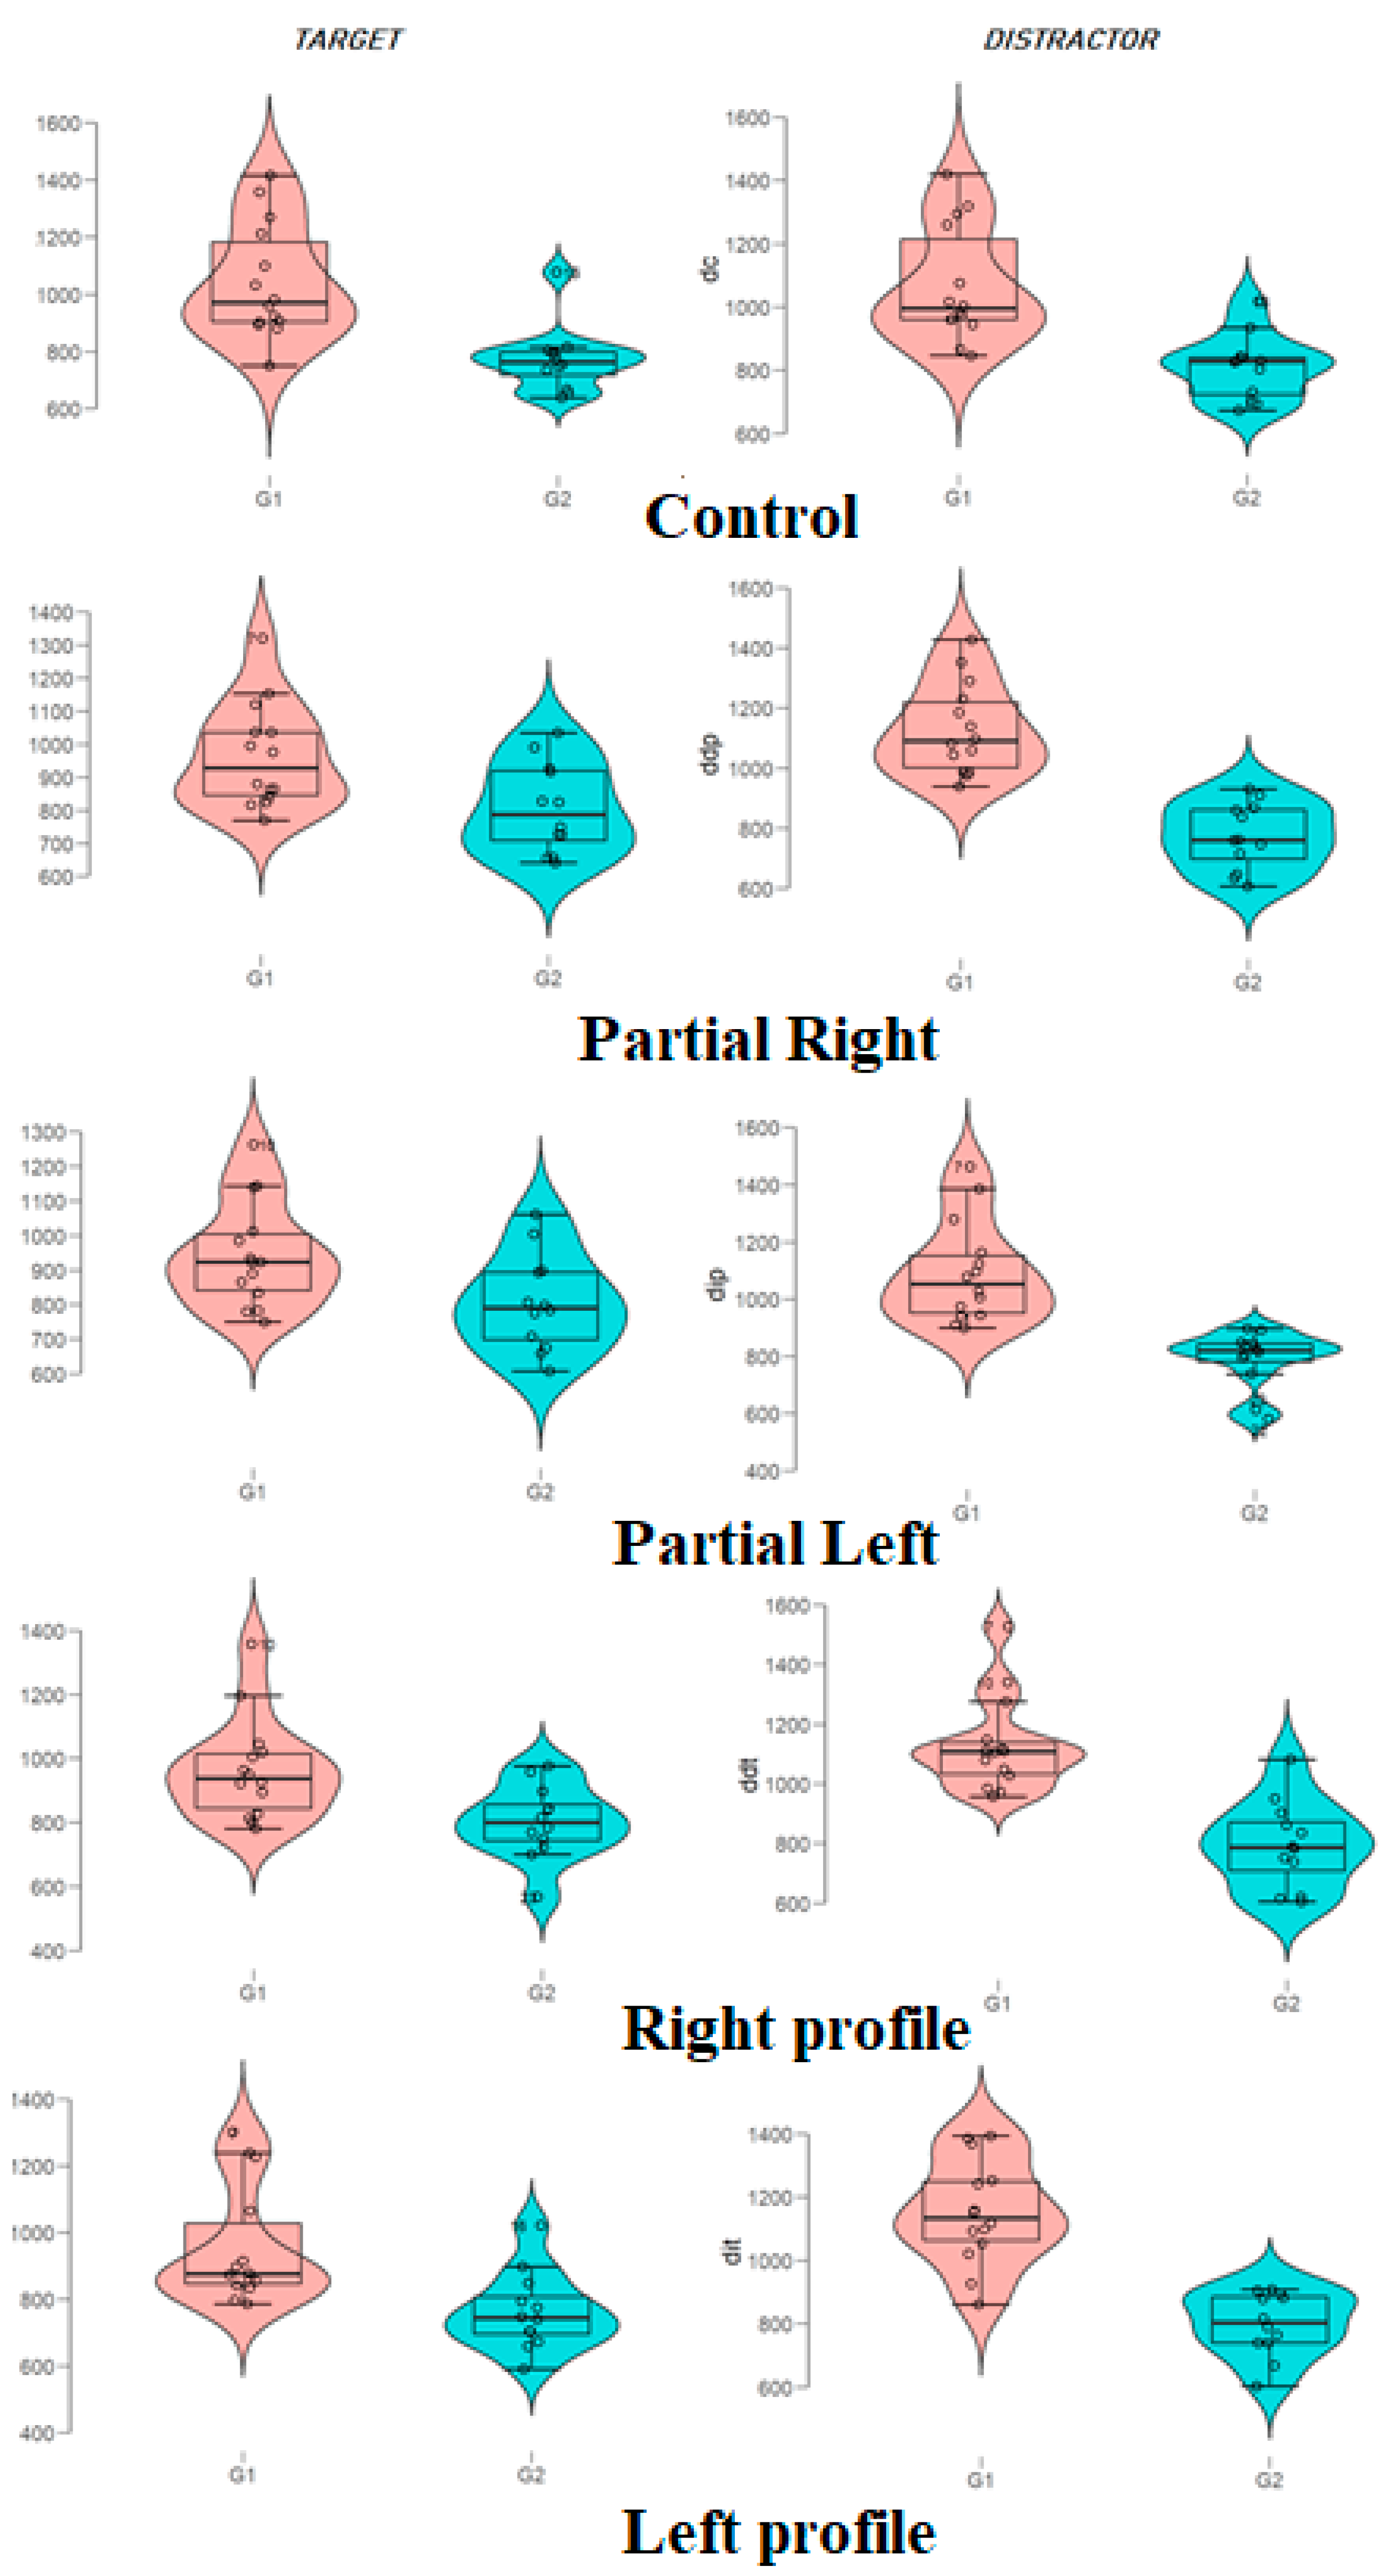
| Target | Distractor | Δ | |||||||
| Group | Position | Mean | SD | Accuracy | Mean | SD | Accuracy | Mean | SD |
| G1 n = 14 | Central | 1041.65 | 199.82 | 74 | 1065.77 | 180.95 | 71 | 24.12 | 177.35 |
| Partial right | 963.89 | 156.61 | 77 | 1128.42 | 150.15 | 74 | 164.53 | 113.43 | |
| Right Profile | 964.09 | 159.41 | 74 | 1128.62 | 157.13 | 69 | 164.53 | 124.86 | |
| Partial Left | 944.57 | 151.65 | 74 | 1091.98 | 176.81 | 78 | 147.41 | 139.73 | |
| Left profile | 954.26 | 175.91 | 69 | 1151.47 | 163.41 | 74 | 197.21 | 184.43 | |
| G2 n = 12 | Central | 771.47 | 114.17 | 71 | 810.08 | 101.11 | 89 | 38.62 | 118.49 |
| Partial right | 806.21 | 135.13 | 80 | 773.22 | 109.12 | 81 | −33.00 | 126.12 | |
| Right Profile | 802.21 | 113.99 | 75 | 794.46 | 144.12 | 82 | −7.74 | 118.77 | |
| Partial Left | 805.60 | 138.06 | 76 | 791.02 | 100.23 | 88 | −14.58 | 151.19 | |
| Left profile | 762.75 | 116.57 | 72 | 799.45 | 99.52 | 86 | 36.71 | 113.10 | |
| 95% IC Hodges-Lehmann | ||||||||
|---|---|---|---|---|---|---|---|---|
| Position | W | p | VS-MPR * | Hodges-Lehmann | Inferior | Superior | Rank-Biserial Correlation | |
| Target | Central | 153.0 | <0.001 | 296.13 | 235.59 | 133.007 | 406.296 | 0.821 |
| Partial right | 132.0 | 0.013 | 6.64 | 150.83 | 39.058 | 285.781 | 0.571 | |
| Right Profile | 134.0 | 0.009 | 8.59 | 137.71 | 42.708 | 245.354 | 0.595 | |
| Partial Left | 125.0 | 0.036 | 3.09 | 126.63 | 7.592 | 248.429 | 0.488 | |
| Left profile | 144.0 | 0.001 | 41.69 | 155.48 | 78.479 | 278.485 | 0.714 | |
| Distractor | Central | 157.0 | <0.001 | 900.44 | 228.16 | 131.955 | 376.916 | 0.869 |
| Partial right | 168.0 | <0.001 | 115,426.96 | 340.01 | 225.884 | 463.676 | 1.000 | |
| Right Profile | 162.0 | <0.001 | 4939.10 | 324.96 | 204.327 | 444.413 | 0.929 | |
| Partial Left | 168.0 | <0.001 | 115,426.96 | 269.16 | 151.331 | 413.728 | 1.000 | |
| Left profile | 163.0 | <0.001 | 7512.37 | 349.44 | 232.391 | 485.385 | 0.940 | |
| 95% IC Hodges-Lehmann | |||||||
|---|---|---|---|---|---|---|---|
| Position | W | p | VS-MPR | Hodges-Lehmann | Inferior | Superior | Rank-Biserial Correlation |
| Central | 83.00 | 0.980 | 1.000 | −2.095 | −132.04 | 119.8 | −0.012 |
| Partial right | 146.00 | <0.001 | 61.221 | 208.146 | 105.96 | 286.3 | 0.738 |
| Right profile | 139.00 | 0.004 | 17.727 | 169.989 | 71.61 | 277.1 | 0.655 |
| Partial Left | 142.00 | 0.002 | 29.110 | 134.609 | 65.32 | 235.7 | 0.690 |
| Left profile | 131.00 | 0.015 | 5.886 | 147.011 | 50.28 | 304.4 | 0.560 |
© 2020 by the authors. Licensee MDPI, Basel, Switzerland. This article is an open access article distributed under the terms and conditions of the Creative Commons Attribution (CC BY) license (http://creativecommons.org/licenses/by/4.0/).
Share and Cite
Moret-Tatay, C.; Baixauli-Fortea, I.; Grau-Sevilla, M.D. Profiles on the Orientation Discrimination Processing of Human Faces. Int. J. Environ. Res. Public Health 2020, 17, 5772. https://0-doi-org.brum.beds.ac.uk/10.3390/ijerph17165772
Moret-Tatay C, Baixauli-Fortea I, Grau-Sevilla MD. Profiles on the Orientation Discrimination Processing of Human Faces. International Journal of Environmental Research and Public Health. 2020; 17(16):5772. https://0-doi-org.brum.beds.ac.uk/10.3390/ijerph17165772
Chicago/Turabian StyleMoret-Tatay, Carmen, Inmaculada Baixauli-Fortea, and M. Dolores Grau-Sevilla. 2020. "Profiles on the Orientation Discrimination Processing of Human Faces" International Journal of Environmental Research and Public Health 17, no. 16: 5772. https://0-doi-org.brum.beds.ac.uk/10.3390/ijerph17165772