Article

FODMAP Intake in Spanish Population: Open Approach for Risk Assessment

by
Jonatan Miranda
1,2,
Maialen Vázquez-Polo
1,
Gesala Pérez-Junkera
1,
María del Pilar Fernández-Gil
1,
María Ángeles Bustamante
1,
Virginia Navarro
1,2,
Edurne Simón
1,2,* and
Olaia Martínez
1,2
1
Gluten Analysis Laboratory of the University of the Basque Country, Department of Nutrition and Food Science, University of the Basque Country, 01006 Vitoria, Spain
2
GLUTEN3S Research Group, Department of Nutrition and Food Science, University of the Basque Country, 01006 Vitoria, Spain
*
Author to whom correspondence should be addressed.
Int. J. Environ. Res. Public Health 2020, 17(16), 5882; https://0-doi-org.brum.beds.ac.uk/10.3390/ijerph17165882
Submission received: 23 July 2020 / Revised: 10 August 2020 / Accepted: 11 August 2020 / Published: 13 August 2020

Abstract

:
Fermentable oligo-, di- and monosaccharides and polyols’ (FODMAP) were related with intestinal complications. The present study aimed to determine the FODMAP consumption of Spanish children, adolescents and adults, analyzing the real FODMAP risk of foods, and to set an open methodology for the measurement of this intake in other regions as well as nutrient intake assurance. Total fructan analysis was performed analytically in eighty-seven food samples. Daily intake of FODMAPs, fiber and micronutrients was calculated by combining the food composition for selected fermentable carbohydrates with the national food consumption stratified by age in an open software. Spanish child and adolescent total FODMAP consumption was settled as 33.4 ± 92.4 and 27.3 ± 69.0 g/day, respectively. Both intakes were higher than that of the adult population (21.4 ± 56.7 g/day). The most important food sources of lactose, excess of fructose and total fructan, considering their content and dietary intake were different between age groups. The contribution of these foods to dietary calcium and fiber and the consequent risk of deficiency if they are withdrawn was highlighted. We demonstrated the relevance of stratifying the total FODMAP intake by age. An open approach for FODMAP intake quantification and nutrient control was provided.

Graphical Abstract

1. Introduction

Highly Fermentable oligo-, di- and monosaccharides and polyols (FODMAPS), are common dietary compounds. These 1–10 sugar-containing molecules are osmotically active substances that are poorly absorbed and which remain in the lumen of the intestine, acting as substrate for bacterial fermentation and producing short-chain fatty-acids and abdominal distention due to gas release [1].
FODMAPs have been blamed for their role as triggering agents of intestinal symptoms such as abdominal pain and bloating [2,3,4,5]. Their restriction in pathologies such as Intestinal Bowel Syndrome (IBS), Celiac Disease (CD) or Non-Celiac Wheat/Gluten Sensitivity (NCWS) have reported irregular results [6,7,8] and, though encouraging, this remains a subject of further investigation. It seems essential to determine the FODMAP intake of the population in order to evaluate its risk in terms of exposure, and to put in place effective strategies for diet-restriction when necessary, avoiding nutrient deficiencies, and depending on dietary habits and age [9,10]. This fact is also relevant in the case of pediatric population, as up to 20% is affected by functional bowel disorders (FBD) in the United States and Europe [11]. Nevertheless, little information about FODMAP consumption has been reported to date [12].
In this context, it is of interest to determine the intake of foods with symptom-triggering potential in the underage collective. The aim of the present study was to determine the FODMAP consumption of the Spanish adolescent and pediatric collective, as well as in adult population, and to set a methodology for the measurement of this intake, along with nutrient deficiency control, in other regions.

2. Materials and Methods

2.1. Study Sample and Design

The present cross-sectional, descriptive and quantitative research took data from two National Dietary Surveys carried out in Spain: “Encuesta Nacional de Alimentación en la población Infantil y Adolescente” (ENALIA) and “Encuesta Nacional de Alimentación en la población adulta, mayores y embarazadas” (ENALIA 2). Both cross-sectional surveys are included in the European Food Safety Agency (EFSA) Comprehensive European Food Consumption Database [13], followed the deontological standards recognized by the Declaration of Helsinki and were carried out in accordance with the EFSA “EU Menu” guidance recommendations [14]. ENALIA study is a survey conducted in Spain from November 2012 to July 2014 designed to measure food consumption of children and adolescents [15]. By contrast, ENALIA2 collected information about eating habits and physical activity in adults (18–64 years old), elderly (65 to 74 years old) and pregnant women from June of 2014 to July of 2015 [16].
A representative sample of Spanish children (3–9 years old) (n = 825), adolescents (10–17 years old) (n = 745) and adults (18–74 years old) (n = 933) participated in the surveys. The study population was people living in households throughout Spain. The criterion of exclusion was the institutionalized population not resident in households, in the age ranges stated before.

2.2. Dietary Assessment

In the mentioned ENALIA studies, dietary information was collected using two non-consecutive one-day food diaries (3–10 years old) or two 24 h dietary recalls (11 years and older) separated by at least 14 days. The 24 h recall was complemented by a Food Propensity Questionnaire including 1020 codified food items, designed specifically for this purpose [15].

2.3. Total Fructan Analysis

Fructo-oligosaccharides (FOS) and fructan polysaccharide-total fructan, analysis was performed by means of the commercial kit, K-FRUCHK (Megazyme International, Wicklow, Ireland) based on the Association of Official Agricultural Chemists (AOAC) method 999.03 and American Association for Cereal Chemists (AACC) Method 32.32. Eighty-seven samples containing cereal products plus onion and garlic were purchased from local supermarkets. Cereal-based product selection followed the consumption data of Spanish National Surveys (ENALIA and ENALIA2). Only frequently consumed, well-known brands were included in the sampling. Once in the laboratory, samples were stored until analysis at room temperature or frozen at −18 °C according to the storage conditions of the manufacturer.

2.4. Determination of FODMAP Daily Intake

Following the international recommendation by Varney et al. for cut-off values of high FODMAP diet [17], daily intake quantification was performed for total fructan, galacto-oligosaccharides (stachyose and raffinose), polyols (sorbitol and mannitol), excess of fructose (calculated subtracting glucose content to fructose content), and lactose. With the exception of fructans, the rest of the FODMAP concentrations (g per 100 g of food) were obtained from the open-access Food Composition Database named Food Standards Australia New Zealand [18].
The daily intake of each FODMAP was calculated by combining the food composition for selected fermentable carbohydrates with the national consumption stratified by age (3–9 years; 10–17 years; 18–74 years). Moreover, a top ten of those foods was created, representing the higher intake sources of lactose, excess fructose and total fructan in Spanish diet of each cohort. For this procedure, an open free software designed by the GLUTEN3S research team was used (GlutenFreeDiet) [19]. The software was linked to the Spanish food-composition database (BEDCA) integrated in the European Food Information Resource, and to the database with the FODMAP content, as previously detailed.
As the Australian database mentioned does not provide information about total fructan (only inulin), research articles were used as a reference for total fructan content of vegetables and fruits [20], as well as for pulses [21]. In the cases of cereal-based foodstuffs, onion and garlic, data from own determinations were used. Data on FODMAP content were uploaded to the previously mentioned software.

2.5. Determination of the Contribution of Main Risky Foods to Fiber and Micronutrient Daily Intake

The database generated in the open access software with national consumption food surveys for Spanish children, adolescents and adults could assess the daily intake of fiber, vitamin A, vitamin C, vitamin D, riboflavin, thiamin, calcium, magnesium, zinc, phosphorus and iron [15,16,19]. In order to evaluate the relevance of the top ten foods representing the higher intake source of lactose, excess fructose and total fructan to previous nutrients’ intake, these were subtracted from the previous database. Fiber and micronutrients content data were expressed as percentage of diet contribution.

2.6. Statistics

Variables, all quantitative, were presented as means ± standard deviations. Assuming the food-intake variables’ normality, due to the equality geometric and arithmetic mean of them, Student’s t-test (2-tailed unpaired t-tests) for independent samples was executed in order to compare FODMAP daily intake between Spanish children vs. adolescents, Spanish children vs. adults and Spanish adolescents vs. adults, as well as two different countries. Fisher’s exact test was used for comparison of each FODMAP proportion among different age-ranges. The level of statistical significance was fixed as p < 0.05. Data analysis was carried out using the IBM SPSS statistical package, version 24 (IBM Inc., Armonk, NY, USA).

3. Results

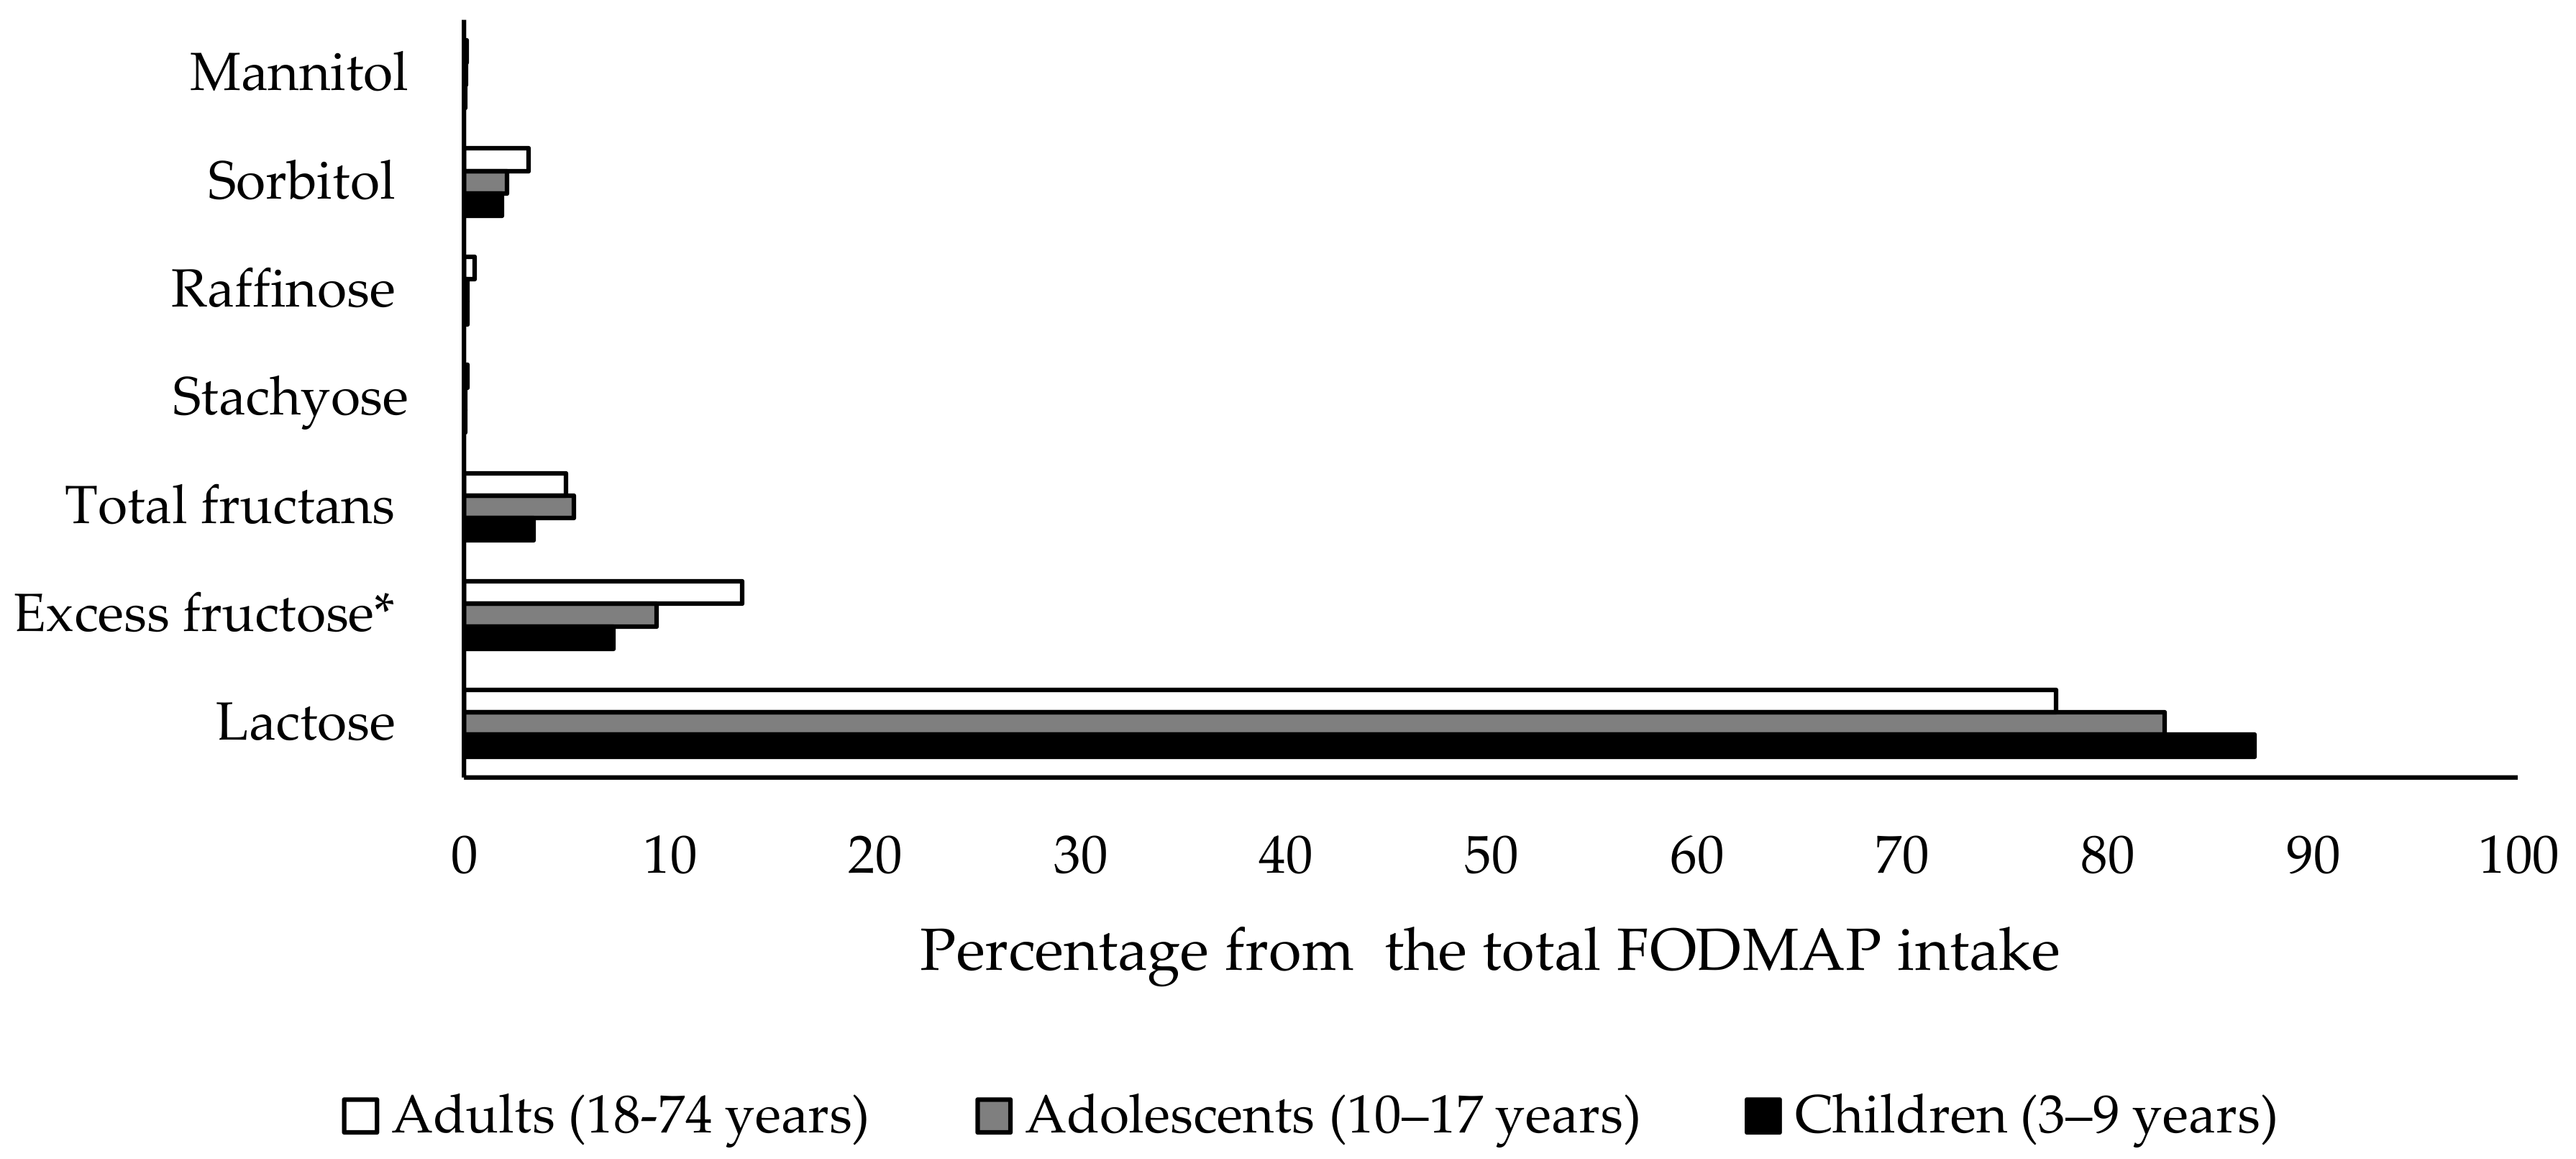
3.1. FODMAP Consumption of Spanish Children, Adolescents and Adult Population

Table 1 shows the FODMAP consumption of Spanish population, stratified by age. The total FODMAP intake ranged from 21.4 to 33.4 g/d, and was especially higher in the case of children (statistically significant only comparing to adults, p value < 0.01), because of their remarkable lactose consumption (p value of 0.06 and <0.001, comparing with adolescents and adults, respectively). In the case of fructan, teenagers reported a tendency towards higher intake than other age ranges (p value of 0.15 and 0.08, comparing with children and adults, respectively). By contrast, other FODMAPs such as excess fructose, stachyose, raffinose and mannitol increased with age; however, they did not always reach statistical significance.
The influence of each compound to the total FODMAP intake was also calculated (Figure 1). Lactose input showed a tendency toward reduction over lifetimes (87%, 82% and 77% in children, adolescents and adults, respectively) while that of excess fructose (7%, 9% and 13%, respectively) or total fructan (3%, 5% and 5%, respectively) tended to become more important with age. By contrast, sorbitol, raffinose, staquiose and mannitol contributions to total FODMAP consumption stayed constant among groups (2% in the case of sorbitol and less than 1% in all the age-ranges for raffinose, staquiose and mannitol). The comparison of total FODMAP distribution among the analyzed age-range of Spanish population did not show statistical significance.

3.2. FODMAP-Risky Foods among Spanish Children, Adolescents and Adult Population

Table 2, Table 3 and Table 4 show the top ten foods representing the higher intake source of most abundant FODMAPs—lactose, excess fructose and total fructan—among the three age groups. Milk and yogurts were the main lactose sources in the diet, reflecting whole milk consumption habits in children and adolescents (Table 2 and Table 3), whereas skimmed or partly skimmed milk was the most important lactose intake source in adults (Table 4). An excess of fructose consumption was due to fruits such as apple or pear, white bread, tomato and honey among children and adolescents (Table 2 and Table 3). Apart from those foods, in the case of adult population, alcoholic beverages such as sweet white wine contributed notably to the consumption of this carbohydrate (Table 4). With regard to total fructan intake, cereals and vegetables made up the entire top ten classification of most consumed food in children and adolescents (Table 2 and Table 3). Furthermore, fruits such as peach, watermelon or melon were also relevant contributions in Spanish adult population (Table 4). White bread and plain sweet biscuits not only made a major contribution to excessive fructose intake, but also to total fructan intake in all the age ranges analyzed (Table 2, Table 3 and Table 4). Similarly, sponge cake was positioned as one of the most consumed foodstuffs for lactose and total fructan source, but only in Spanish children or adults in the case of lactose (Table 2, Table 3 and Table 4).
Sorbitol and mannitol consumption was due to the same fruits, vegetables and fungi in the whole population (data not shown). Soy beverage as well as haricot and broad beans were the sole contributors of staquiose and raffinose intake in Spanish children, adolescents and adults (data not shown).

3.3. Fiber and Micronutrients’ Potential Deficiency Risk in a Low-FODMAP Diet Approximation

Risky food withdrawal from evaluated diet reflected the important contribution of these foods to dietary micronutrients and fiber. As expected, all the vitamins and minerals evaluated showed a decrease in children, adolescents and adults, but this was most remarkable for calcium, with a reduction of more than half (Table 5). For vitamins, vitamin C and riboflavin showed the highest depletion. Fiber was diminished noticeably in all the age ranges, but especially in children and adults, where it reached 55%.

3.4. Total FODMAP Consumption in Other Countries

A review of total FODMAP consumption from adult population of other countries was performed and data were compared to those obtained in our study (Figure 2). Only two studies by Halmos et al. in Australia were carried out with healthy subjects [7,22]. Data revealed that the FODMAP consumption of participants was similar to that observed in our study for Spanish adult population (18.2 and 23.7 g/day). A direct comparison carried out between Spanish adults’ total FODMAP intake and a Swedish adult cohort, showed no differences between the two countries (20.7 g/day in Sweden vs. 21.1 g/day in Spain, p = 0.84) [23].
Other studies carried out in people with IBS, however, reported differing data, even in the same country. For instance, whereas Staudacher et al. and O’Keeffe et al. observed that the adult population consumed almost 30 g/day of FODMAPs in United Kingdom in 2012 [24] and 2018 [25] (29.6 and 29.4 g/day in 2017 and 2019, respectively), the same authors in 2017 [26] and 2020 [27], reported lower FODMAP ingestion in other studies conducted with United Kingdom adult citizens (17.4 and 17.0 g/day in 2017 and 2020, respectively).

4. Discussion

FODMAPs are a heterogeneous group composed of lactose, fructose, sorbitol, mannitol, galacto-oligosaccharides (GOS), and FOS and fructan polysaccharides (the last two making up total fructans), among others [17]. Classification is not so simple in reality, as fructose is only considered a FODMAP when it is in excess in relation to glucose, because then its active transportation is saturated, and it is hardly absorbed and may potentially ferment [28]. These properties must be complied with to be part of this group of molecules. Therefore, fructose should not be considered when it is free in the whole diet but rather when it is free in a meal or for a short period of time, making its intake difficult to measure.
In this respect, considerable efforts have been made in recent years to determine the FODMAP content of foods and to establish cut-off values for their classification in low- and high-content food [17]. Nevertheless, there is still a lack of information about composition of food products in different regions and so it is difficult to establish an accurate FODMAP intake worldwide [29]. Moreover, some FODMAPs, such as fructans, are more difficult to find in food composition databases, and their intake is not always determined in diet-related studies [6,22,24,25,30].
Interest in describing the intake profile of these dietary components lies in their potential role as factors for intestinal symptoms. Consequently, their dietary control is being investigated as a possible therapy in intestinal disorders (IBS, CD or NCWS) [31,32]. Children with FBD could also potentially benefit from a low-FODMAP diet (LFD). Based on epidemiological data [11], up to nearly one and a half million Spanish children and adolescents could benefit from limiting this intake, as they suffer some kind of intestinal symptom (functional dyspepsia, functional abdominal pain, abdominal migraine, or IBS) [33].
In view of the above, this work aims to fill the gap and calculate the total FODMAP intake for Spanish underage population, with the aid of a specific software containing information about FODMAP content of foods [19]. The total FODMAP consumption of Spanish children aged between 3 and 9 years old was 33.4 g/day, while teenagers between 10 and 17 years old consumed 18% fewer FODMAPS daily. Data about the intake of total FODMAPs in underage population are scarce. As far as we know, Chumpitazi et al. carried out the only clinical trial in a paediatric cohort of young patients (7–17 years old) suffering from IBS, reporting the total FODMAP intake for Typical American Diet in 32.2 g/day (summatory of each FODMAP intake reported) [12]. These data are in agreement with the total FODMAP consumption of Spanish children aged 3–9 years, but not with adolescents’ intake. Apart from the differences in the diet followed by Spanish and American pediatric population, the age of volunteers and their health-status (especially regarding pathologies that affect diet habits) must be taken into consideration. Indeed, age range stratification has been proposed for FODMAP diet research in special populations (infants, pre-school children, primary-school children and high-school children) elsewhere [34].
In addition to child data, the software presented the opportunity to define the daily total mean FODMAP intake by Spanish adults as 21.4 g. These data revealed a significantly lower consumption of FODMAP in this age range than in adolescents or children (reduction of 22% and 36%, respectively). It has been proposed that high-FODMAP foods such as fruits, sweet vegetables, milk, yoghurt- or wheat-based foods are widely consumed among children or adolescents due to their easy acceptation [34]. Our data are in the same line, showing, for instance, an intake of 2.11 g/day of lactose from plain yogurt in Spanish children, while adults consume 1.09 g/day from the same food. That is also the case for apples, whose absolute excess fructose intake was around 1.6 g/day in both age ranges, but whose relative intake (by total energy intake) was higher in Spanish children than in adults. In terms of FODMAP distribution (lactose, fructose excess, oligosaccharides and polyols), the lactose percentage from total FODMAP reduced with age (10% reduction from children to adults), while that of total fructan and excess of fructose was boosted.
FODMAP intake for adult population in other countries varies from 17.0 to 29.4 g/day. The wide range of FODMAP intake is justified not only by the different dietary habits among countries, but also by other reasons. Some of those researchers analyzed the diet of patients with IBS [23,25], resulting in lower baseline FODMAP intake than the habitual diet of a healthy person. By contrast, even though some other authors showed a similar average consumption of FODMAP, it should be noted that not all of them consistently calculated the total FODMAP content of the diet. As suggested by Varney et al. [17], total a FODMAP analysis must include lactose, fructose in excess of glucose, mannitol, sorbitol, total fructan, stachyose and raffinose. The majority of the research summarized did not measure either the total fructan intake [7,22,30], or the excess of fructose [24].
With the aim of validating the results obtained, we compared our data for adult population with those of Nybacka et al., the most similar research in terms of sample size, total FODMAP classification, or patient’s age [23]. The similarity between Spanish and Swedish FODMAP intake, 21.1 vs. 20.7 g/day, confirmed our approach using national food consumption surveys and placed value on our open software for calculation [19].
In order to better understand the usefulness of the proposed methodology, it is important to note that the LFD strategy is usually based on a list of allowed/not allowed food, considering their total FODMAP content [35,36,37]. While the information provided by that kind of list is necessary [17,38], the “real risk” of each food, also bearing in mind its dietary intake, can be very useful. As in food toxicology, exposure assessments must be determined considering both the chemicals present in foods as well as the food-intake itself. In this line, it must be pointed out that the culture and habits of each country influence the consumption of FODMAPs and its sources [39]. For this reason, we identified top ten foods representing the most important sources of the most consumed FODMAPs (lactose, excess of fructose and total fructan) for Spanish population. This is practical and convenient information for Spanish health-practitioners, for them to use in their daily routine or in their research related to functional abdominal symptoms.
Obviously, the results shown in the present research are limited to the Spanish population. Several authors have proposed data related to different countries or cultures for food composition databases and intake [29,40]. Hence, we would like to highlight the importance of this approach performed to calculate the total FODMAP intake, in order to make its use widespread. The methodology was previously used by others to estimate the presence of inulin and oligofructose in the diets of North-Americans or Europeans [41,42]. GlutenFreeDiet software integrates total fructan, stachyose, raffinose, sorbitol, mannitol, fructose, glucose and lactose content of food. Taking into account that data from National Dietary Surveys are available for most countries, the software allows researchers from other countries to set, without pilot studies, the threshold of FODMAP intake corresponding to their national standard diet.
Moreover, this software allows fructose excess calculation by meal or by food, when fructose is considered a FODMAP constituent, and not subtracting the total glucose per day to total fructose per day, as calculated in some studies [24,43]. Additionally, the software integrates a wide range of fructan content in food, not usually present in food composition databases. In fact, due to the variability in the FODMAP content of processed foodstuff, and considering that fructans are the most frequent FODMAP found in wheat (one staple food) [44], the total fructan content of eighty-five cereal based processed foods was determined and permanently integrated in the open software for free use [19].
An LFD diet is very limiting and the long-term effects need further evaluation [45]. Among others, nutritional deficiencies concerns surround this kind of diet [46]. Taking this fact into consideration, in the present study we performed an approach to LFD of withdrawing FODMAP risky foods from the diet. The results obtained indicate that the risk of non-compliance for calcium dietary intake was remarkable, followed by fiber, and deficiencies in other vitamins or minerals cannot be discarded. In this line, recent research conducted with IBS patients showed that the number of patients who did not meet thiamin, calcium, cooper and iron recommendations tended to increase after following LFD for 4 weeks (for thiamin, the increase was significant) [47]. It is true that our approximation mirrors the most extreme scenario, in which all the highest lactose, fructose and fructan-risky foods were subtracted from the diet. However, a “top-down” approach for implementing LFD includes an initial phase which restricts all FODMAP subgroups for a 2–8 week period [48]. For this reason, we understand that a complete nutritional software is essential for LFD intervention, in order to control dietary recommendations.
A clear limitation of this study was the high deviation of the data. Nevertheless, this fact results from the huge sample simple size used (2503 people and 1020 codified foods). By contrast, the applicability (free approach) and the inclusion of total fructan database and intake can be considered a strength of the research.

5. Conclusions

In the present study, we demonstrated the relevance of stratifying the total FODMAP intake by age, presenting for the first-time detailed values of their consumption in children and adolescents. In addition to providing a useful and free resource for FODMAP intake quantification, we offer information about FODMAP risk for health practitioners.

Author Contributions

Conceptualization, O.M. and E.S.; methodology, J.M., M.V.-P. and G.P.-J.; formal analysis, J.M., M.V.-P., G.P.-J. and M.d.P.F.-G.; investigation, J.M., M.V.-P., G.P.-J., E.S. and O.M.; resources, M.d.P.F.-G. and M.Á.B.; writing—original draft preparation, J.M.; writing—review and editing, V.N., E.S. and O.M.; visualization, E.S.; supervision, J.M.; project administration, M.Á.B.; funding acquisition, E.S. All authors have read and agreed to the published version of the manuscript.

Funding

Maialen Vazquez-Polo and Gesala Perez-Junkera are IKASIKER fellowships of the Education Department of the Basque Government. This research was supported by a grant (University-Society US18/15 and GIU 18/78) from the University of the Basque Country, UPV/EHU.

Acknowledgments

The authors thank all the GLUTEN3S research group members and students who helped, in one way or another, with this work.

Conflicts of Interest

The authors declare no conflict of interest. The funders had no role in the design of the study; in the collection, analyses, or interpretation of data; in the writing of the manuscript, or in the decision to publish the results.

References

  1. De Giorgio, R.; Volta, U.; Gibson, P.R. Sensitivity to wheat, gluten and FODMAPs in IBS: Facts or fiction? Gut 2016, 65, 169–178. [Google Scholar] [CrossRef] [PubMed]
  2. Staudacher, H.M. Nutritional, microbiological and psychosocial implications of the low FODMAP diet. J. Gastroenterol. Hepatol. 2017, 32, 16–19. [Google Scholar] [CrossRef] [PubMed] [Green Version]
  3. Cox, S.R.; Lindsay, J.O.; Fromentin, S.; Stagg, A.J.; McCarthy, N.E.; Galleron, N.; Ibraim, S.B.; Roume, H.; Levenez, F.; Pons, N.; et al. Effects of low FODMAP diet on symptoms, fecal microbiome, and markers of inflammation in patients with quiescent inflammatory bowel disease in a randomized trial. Gastroenterology 2020, 158, 176–188. [Google Scholar] [CrossRef] [PubMed] [Green Version]
  4. Barrett, J.S.; Gearry, R.B.; Muir, J.G.; Irving, P.M.; Rose, R.; Rosella, O.; Haines, M.L.; Shepherd, S.J.; Gibson, P.R. Dietary poorly absorbed, short-chain carbohydrates increase delivery of water and fermentable substrates to the proximal colon. Aliment. Pharmacol. Ther. 2010, 31, 874–882. [Google Scholar] [CrossRef]
  5. Van Tilburg, M.A.; Felix, C.T. Diet and functional abdominal pain in children and adolescents. J. Pediatr. Gastroenterol. Nutr. 2013, 57, 141–148. [Google Scholar] [CrossRef] [Green Version]
  6. Skodje, G.I.; Minelle, I.H.; Rolfsen, K.L.; Iacovou, M.; Lundin, K.E.A.; Veierød, M.B.; Henriksen, C. Dietary and symptom assessment in adults with self-reported non-coeliac gluten sensitivity. Clin. Nutr. ESPEN 2019, 31, 88–94. [Google Scholar] [CrossRef]
  7. Halmos, E.P.; Christophersen, C.T.; Bird, A.R.; Shepherd, S.J.; Gibson, P.R.; Muir, J.G. Diets that differ in their FODMAP content alter the colonic luminal microenvironment. Gut 2015, 64, 93–100. [Google Scholar] [CrossRef]
  8. Whelan, K.; Martin, L.D.; Staudacher, H.M.; Lomer, M.C.E. The low FODMAP diet in the management of irritable bowel syndrome: An evidence-based review of FODMAP restriction, reintroduction and personalisation in clinical practice. J. Hum. Nutr. Diet. 2018, 31, 239–255. [Google Scholar] [CrossRef] [Green Version]
  9. Hill, P.; Muir, J.G.; Gibson, P.R. Controversies and recent developments of the low-FODMAP diet. Gastroenterol. Hepatol. 2017, 13, 36–45. [Google Scholar]
  10. Castro, M.L.B.; Arnal, I.R.; Romero, R.G.; Martínez, G.R.; Sainz, E.U. Implementationof a low FODMAP dietforfunctional abdominal pain. An. Pediatr. 2019, 90, 180–186. [Google Scholar] [CrossRef]
  11. Chitkara, D.K.; Rawat, D.J.; Talley, N.J. The epidemiology of childhood recurrent abdominal pain in Western countries: A systematic review. Am. J. Gastroenterol. 2005, 100, 1868–1875. [Google Scholar] [CrossRef] [PubMed]
  12. Chumpitazi, B.P.; Cope, J.L.; Hollister, E.B.; Tsai, C.M.; McMeans, A.R.; Luna, R.A.; Versalovic, J.; Shulman, R.J. Randomised clinical trial: Gut microbiome biomarkers are associated with clinical response to a low FODMAP diet in children with the irritable bowel syndrome. Aliment. Pharmacol. Ther. 2015, 42, 418–427. [Google Scholar] [CrossRef] [PubMed]
  13. European Food Safety Authority. The EFSA Comprehensive European Food Consumption Database. Available online: https://www.efsa.europa.eu/en/food-consumption/comprehensive-database (accessed on 14 July 2020).
  14. European Food Safety Authority. General principles for the collection of national food consumption data in the view of a pan-European dietary survey. EFSA J. 2009, 7, 1435. [Google Scholar] [CrossRef]
  15. Suarez, V.M.; Mañas, J.R.; Fernández, R.S.; de Dios, T.R. Spanish national dietary survey on children and adolescents. EFSA Supporting Publ. 2015, 12, 900E. [Google Scholar] [CrossRef] [Green Version]
  16. Marcos, S.V.; Rubio, M.J.; Sanchidrián, F.R.; de Robledo, D. Spanish national dietary survey in adults, elderly and pregnant women. EFSA Supporting Publ. 2016, 13, 1053E. [Google Scholar] [CrossRef] [Green Version]
  17. Varney, J.; Barrett, J.; Scarlata, K.; Catsos, P.; Gibson, P.R.; Muir, J.G. FODMAPs: Food composition, defining cutoff values and international application. J. Gastroenterol. Hepatol. 2017, 32, 53–61. [Google Scholar] [CrossRef]
  18. Food Standards Australia New Zealand. Australian Food Composition Database—Release 1. Canberra: FSANZ. Available online: www.foodstandards.gov.au (accessed on 14 July 2020).
  19. Lasa, A.; Larretxi, I.; Simón, E.; Churruca, I.; Navarro, V.; Martínez, O.; Bustamante, M.; Miranda, J. New software for gluten-free diet evaluation and nutritional education. Nutrients 2019, 11, 2505. [Google Scholar] [CrossRef] [Green Version]
  20. Muir, J.G.; Shepherd, S.J.; Rosella, O.; Rose, R.; Barrett, J.S.; Gibson, P.R. Fructan and free fructose content of common Australian vegetables and fruit. J. Agric. Food Chem. 2007, 55, 6619–6627. [Google Scholar] [CrossRef]
  21. Biesiekierski, J.R.; Rosella, O.; Rose, R.; Liels, K.; Barrett, J.S.; Shepherd, S.J.; Gibson, P.R.; Muir, J.G. Quantification of fructans, galacto-oligosacharides and other short-chain carbohydrates in processed grains and cereals. J. Hum. Nutr. Diet. 2011, 24, 154–176. [Google Scholar] [CrossRef]
  22. Halmos, E.P.; Christophersen, C.T.; Bird, A.R.; Shepherd, S.J.; Muir, J.G.; Gibson, P.R. Consistent prebiotic effect on gut microbiota with altered fodmap intake in patients with crohn’s disease: A randomised, controlled cross-over trial of well-defined diets. Clin. Transl. Gastroenterol. 2016, 7, e164. [Google Scholar] [CrossRef]
  23. Nybacka, S.; Störsrud, S.; Liljebo, T.; Le Nevé, B.; Törnblom, H.; Simrén, M.; Winkvist, A. Within-and between-subject variation in dietary intake of fermentable oligo-, DI-, monosaccharides, and polyols among patients with irritable bowel syndrome. Curr. Dev. Nutr. 2019, 3. [Google Scholar] [CrossRef] [PubMed]
  24. Staudacher, H.M.; Lomer, M.C.; Anderson, J.L.; Barrett, J.S.; Muir, J.G.; Irving, P.M.; Whelan, K. Fermentable carbohydrate restriction reduces luminal bifidobacteria and gastrointestinal symptoms in patients with irritable bowel syndrome. J. Nutr. 2012, 142, 1510–1518. [Google Scholar] [CrossRef] [PubMed]
  25. O’Keeffe, M.; Jansen, C.; Martin, L.; Williams, M.; Seamark, L.; Staudacher, H.M.; Irving, P.M.; Whelan, K.; Lomer, M.C. Long-term impact of the low-FODMAP diet on gastrointestinal symptoms, dietary intake, patient acceptability, and healthcare utilization in irritable bowel syndrome. Neurogastroenterol. Motil. 2018, 30. [Google Scholar] [CrossRef] [PubMed] [Green Version]
  26. Staudacher, H.M.; Lomer, M.C.E.; Farquharson, F.M.; Louis, P.; Fava, F.; Franciosi, E.; Scholz, M.; Tuohy, K.M.; Lindsay, J.O.; Irving, P.M.; et al. A diet low in FODMAPs reduces symptoms in patients with irritable bowel syndrome and a probiotic restores bifidobacterium species: A randomized controlled trial. Gastroenterology 2017, 153, 936–947. [Google Scholar] [CrossRef] [PubMed] [Green Version]
  27. Staudacher, H.M.; Ralph, F.S.E.; Irving, P.M.; Whelan, K.; Lomer, M.C.E. Nutrient Intake, Diet Quality, and Diet Diversity in Irritable Bowel Syndrome and the Impact of the Low FODMAP Diet. J. Acad. Nutr. Diet. 2020, 120, 535–547. [Google Scholar] [CrossRef] [PubMed] [Green Version]
  28. Shepherd, S.J.; Lomer, M.C.; Gibson, P.R. Short-chain carbohydrates and functional gastrointestinal disorders. Am. J. Gastroenterol. 2013, 108, 707–717. [Google Scholar] [CrossRef]
  29. Cingolani, A.; Paduano, D.; Vecchiarelli, V.; Demelas, M.; Corrias, P.T.; Casula, L.; Usai, P. Feasibility of low fermentable oligosaccharide, disaccharide, monosaccharide, and polyol diet and its effects on quality of life in an Italian cohort. Nutrients 2020, 12, 716. [Google Scholar] [CrossRef] [Green Version]
  30. Nanayakkara, W.S.; Gearry, R.B.; Muir, J.G.; O’Brien, L.; Wilkinson, T.J.; Williman, J.A.; Skidmore, P.M.L. Gastrointestinal symptoms and FODMAP intake of aged-care residents from Christchurch, New Zealand. Nutrients 2017, 9, 1083. [Google Scholar] [CrossRef] [Green Version]
  31. Staudacher, H.M.; Whelan, K. The low FODMAP diet: Recent advances in understanding its mechanisms and efficacy in IBS. Gut 2017, 66, 1517. [Google Scholar] [CrossRef] [Green Version]
  32. Dionne, J.; Ford, A.C.; Yuan, Y.; Chey, W.D.; Lacy, B.E.; Saito, Y.A.; Quigley, E.M.M.; Moayyedi, P. A systematic review and meta-analysis evaluating the efficacy of a gluten-free diet and a low FODMAPs diet in treating symptoms of irritable bowel syndrome. Am. J. Gastroenterol. 2018, 113, 1290–1300. [Google Scholar] [CrossRef] [Green Version]
  33. National Statistics Institute. Demographic and Social Characteristics of the Spanish Population. Available online: https://www.ine.es/index.htm (accessed on 14 July 2020).
  34. Iacovou, M. Adapting the low FODMAP diet to special populations: Infants and children. J. Gastroenterol. Hepatol. 2017, 32, 43–45. [Google Scholar] [CrossRef] [PubMed] [Green Version]
  35. Pedersen, N.; Andersen, N.N.; Végh, Z.; Jensen, L.; Ankersen, D.V.; Felding, M.; Simonsen, M.H.; Burisch, J.; Munkholm, P. Ehealth: Low FODMAP diet vs. Lactobacillus rhamnosus GG in irritable bowel syndrome. World J. Gastroenterol. 2014, 20, 16215–16226. [Google Scholar] [CrossRef] [PubMed]
  36. Roncoroni, L.; Elli, L.; Doneda, L.; Bascuñán, K.A.; Vecchi, M.; Morreale, F.; Scricciolo, A.; Lombardo, V.; Pellegrini, N. A retrospective study on dietary FODMAP intake in celiac patients following a gluten-free diet. Nutrients 2018, 10, 1769. [Google Scholar] [CrossRef] [PubMed] [Green Version]
  37. Fodor, I.; Man, S.C.; Dumitrascu, D.L. Low fermentable oligosaccharides, disaccharides, monosaccharides, and polyols diet in children. World J. Clin. Cases 2019, 7, 2666–2674. [Google Scholar] [CrossRef] [PubMed]
  38. Gibson, P.R.; Shepherd, S.J. Evidence-based dietary management of functional gastrointestinal symptoms: The FODMAP approach. J. Gastroenterol. Hepatol. 2010, 25, 252–258. [Google Scholar] [CrossRef]
  39. Hewawasam, S.P.; Iacovou, M.; Muir, J.G.; Gibson, P.R. Dietary practices and FODMAPs in South Asia: Applicability of the low FODMAP diet to patients with irritable bowel syndrome. J. Gastroenterol. Hepatol. 2018, 33, 365–374. [Google Scholar] [CrossRef] [Green Version]
  40. McMeans, A.R.; King, K.L.; Chumpitazi, B.P. Low FODMAP Dietary Food Lists are Often Discordant. Am. J. Gastroenterol. 2017, 112, 655–656. [Google Scholar] [CrossRef] [Green Version]
  41. Moshfegh, A.J.; Friday, J.E.; Goldman, J.P.; Ahuja, J.K. Presence of inulin and oligofructose in the diets of Americans. J. Nutr. 1999, 129, 1407S–1411S. [Google Scholar] [CrossRef]
  42. van Loo, J.; Coussement, P.; de Leenheer, L.; Hoebregs, H.; Smits, G. On the presence of inulin and oligofructose as natural ingredients in the western diet. Crit. Rev. Food Sci. Nutr. 1995, 35, 525–552. [Google Scholar] [CrossRef]
  43. Ong, D.K.; Mitchell, S.B.; Barrett, J.S.; Shepherd, S.J.; Irving, P.M.; Biesiekierski, J.R.; Smith, S.; Gibson, P.R.; Muir, J.G. Manipulation of dietary short chain carbohydrates alters the pattern of gas production and genesis of symptoms in irritable bowel syndrome. J. Gastroenterol. Hepatol. 2010, 25, 1366–1373. [Google Scholar] [CrossRef]
  44. Pejcz, E.; Spychaj, R.; Gil, Z. Technological methods for reducing the content of fructan in wheat bread. Foods 2019, 8, 663. [Google Scholar] [CrossRef] [PubMed] [Green Version]
  45. Fedewa, A.; Rao, S.S. Dietary fructose intolerance, fructan intolerance and FODMAPs. Curr. Gastroenterol. Rep. 2014, 16, 370. [Google Scholar] [CrossRef] [PubMed] [Green Version]
  46. Catassi, G.; Lionetti, E.; Gatti, S.; Catassi, C. The low FODMAP diet: Many question marks for a catchy acronym. Nutrients 2017, 9, 292. [Google Scholar] [CrossRef] [PubMed]
  47. Eswaran, S.; Dolan, R.D.; Ball, S.C.; Jackson, K.; Chey, W. The impact of a 4-week low-fodmap and mnice diet on nutrient intake in a sample of us adults with irritable bowel syndrome with diarrhea. J. Acad. Nutr. Diet. 2020, 120, 641–649. [Google Scholar] [CrossRef] [PubMed] [Green Version]
  48. Wang, X.J.; Camilleri, M.; Vanner, S.; Tuck, C. Review article: Biological mechanisms for symptom causation by individual FODMAP subgroups—The case for a more personalised approach to dietary restriction. Aliment. Pharmacol. Ther. 2019, 50, 517–529. [Google Scholar] [CrossRef]
Figure 1. Influence of lactose, excess fructose, total fructan, stachyose, raffinose, sorbitol and mannitol to the total FODMAP intake of Spanish population in different age-range.
Ijerph 17 05882 g001
Figure 2. FODMAP intake of adult population in different countries (n; age; pathology). Columns corresponding to each country are depicted in different background color. Error bars in striped columns show a 95% confidence interval and those in plain columns show the standard deviation.
Ijerph 17 05882 g002
Table 1. Intake of lactose, excess fructose, total fructan, stachyose, raffinose, sorbitol and mannitol in Spanish population stratified by age.
FODMAP Intake Children (3–9 Years)Adolescents (10–17 Years)Adults (18–74 Years)Children vs. Adolescents Children vs. AdultsAdolescents vs. Adults
(g/d)MeanSDMeanSDMeanSDp Valuep Valuep Value
Lactose 29.179.422.653.916.641.60.06<0.0010.01
Excess fructose * 2.436.312.567.042.907.210.700.140.11
Total fructan 1.133.951.465.091.064.290.150.720.08
Stachyose0.020.120.020.150.040.230.990.020.03
Raffinose 0.060.370.050.370.110.670.590.050.02
Sorbitol 0.622.050.572.180.672.520.640.650.38
Mannitol0.020.150.030.240.030.170.330.191
Total 33.492.327.369.021.456.70.14<0.010.06
Excess fructose * = fructose−glucose.
Table 2. Top ten foods representing the higher intake source of lactose, excess fructose and total fructan in Spanish diet of children population aged between 3 and 9 years old.
PositionFoodLactose Intake (g/d)FoodExcess Fructose Intake (g/d) *FoodTotal Fructan Intake (g/d)
MeanSDMeanSDMeanSD
1stWhole cow milk9.3311.2Apple1.523.06White bread0.140.16
2ndPowdered milk6.2731.8Pear0.331.01Garlic0.130.17
3rdPartly skimmed cow milk5.759.54White bread0.160.18Onion0.110.16
4thPlain yogurt2.113.96Plain sweet biscuit0.060.14Plain sweet biscuit0.100.22
5thFlavoured yogurt1.763.17Orange juice0.050.22Leek0.080.27
6thSponge cake0.924.76Tomato0.050.10Sponge cake0.080.37
7thSkimmed cow milk0.813.65Melon0.040.21Sandwich bread0.080.20
8thPlain skimmed yogurt0.571.45Honey0.040.23Chocolate biscuits0.070.24
9thEgg pudding dessert0.531.58Orange0.030.12Chocolate sponge cake0.020.16
10thMilk chocolate0.190.87Strawberry0.030.12Corn flakes0.020.11
* Excess fructose = fructose−glucose.
Table 3. Top ten foods representing the higher intake source of lactose, excess fructose and total fructan in Spanish diet of adolescent population aged between 10 and 17 years old.
PositionFoodLactose Intake (g/d)FoodExcess Fructose Intake (g/d) *FoodTotal Fructan Intake (g/d)
MeanSDMeanSDMeanSD
1stWhole cow milk7.9514.44Apple1.463.20White bread0.250.24
2ndPartly skimmed cow milk7.2011.19Pear0.281.02Onion0.150.24
3rdPlain yogurt1.944.01White bread0.270.27Garlic0.140.24
4thSkimmed cow milk1.935.92Tomato0.080.16Sponge cake0.100.40
5thFlavoured yogurt1.302.92Orange juice0.060.27Leak0.090.38
6thEgg pudding dessert0.561.68Orange0.050.14Plain sweet biscuit0.080.20
7thSkimmed yogurt0.401.24Plain sweet biscuit0.050.13Sandwich bread0.080.25
8thPowdered milk0.338.19Honey0.040.25Chocolate biscuits0.060.25
9thFlavoured skimmed yogurt0.110.75Strawberry0.040.15Pasta0.060.12
10thChocolate and hazelnut spread0.110.52Melon0.040.21Chocolate sponge cake0.030.20
* Excess fructose = fructose−glucose.
Table 4. Top ten foods representing the higher intake source of lactose, excess fructose and total fructan in Spanish diet of adult population.
PositionFoodLactose Intake (g/d)FoodExcess Fructose Intake (g/d) *FoodTotal Fructan Intake (g/d)
MeanSDMeanSDMeanSD
1stPartly skimmed cow milk4.878.69Apple1.783.20White bread0.170.00
2ndSkimmed cow milk3.887.07Pear0.311.03Onion0.160.27
3rdWhole cow milk3.577.16White bread0.190.00Garlic0.140.60
4thPlain yogurt 1.092.80Tomato0.120.19Sponge cake0.080.37
5thPlain skimmed yogurt0.902.11Honey0.070.31Leak0.080.38
6thFlavoured yogurt0.421.87Orange 0.070.15Sandwich bread0.060.20
7thSponge cake0.321.40Melon0.050.19Plain sweet biscuit0.050.14
8thEgg pudding dessert0.311.26Sweet white wine0.030.36Peach0.040.19
9thFlavoured skimmed yogurt0.281.18Tangerine0.030.10Watermelon0.020.07
10thIce-cream0.120.64Kiwi fruit0.030.14Melon0.020.06
* Excess fructose = fructose−glucose.
Table 5. Intake change (expressed as percentage of diet contribution) of some micronutrients and fiber after FODMAP risky food subtraction from the diet.
Percentage of Diet ContributionChildren (3–9 Years)Adolescents (10–17 Years)Adults (18–74 Years)
Fiber−55−47−55
Vitamin A−32−25−36
Vitamin C−46−39−46
Vitamin D−14−9−5
Riboflavin−52−41−50
Thiamin−37−61−36
Calcium−72−59−68
Magnesium−44−38−41
Zinc−33−29−38
Phosphorus−45−39−43
Iron−33−21−38

