Profiles of Active Transportation among Children and Adolescents in the Global Matrix 3.0 Initiative: A 49-Country Comparison

 , ,
, ,
Abstract
:1. Introduction
2. Materials and Methods
3. Results
4. Discussion
4.1. Comparability of Data
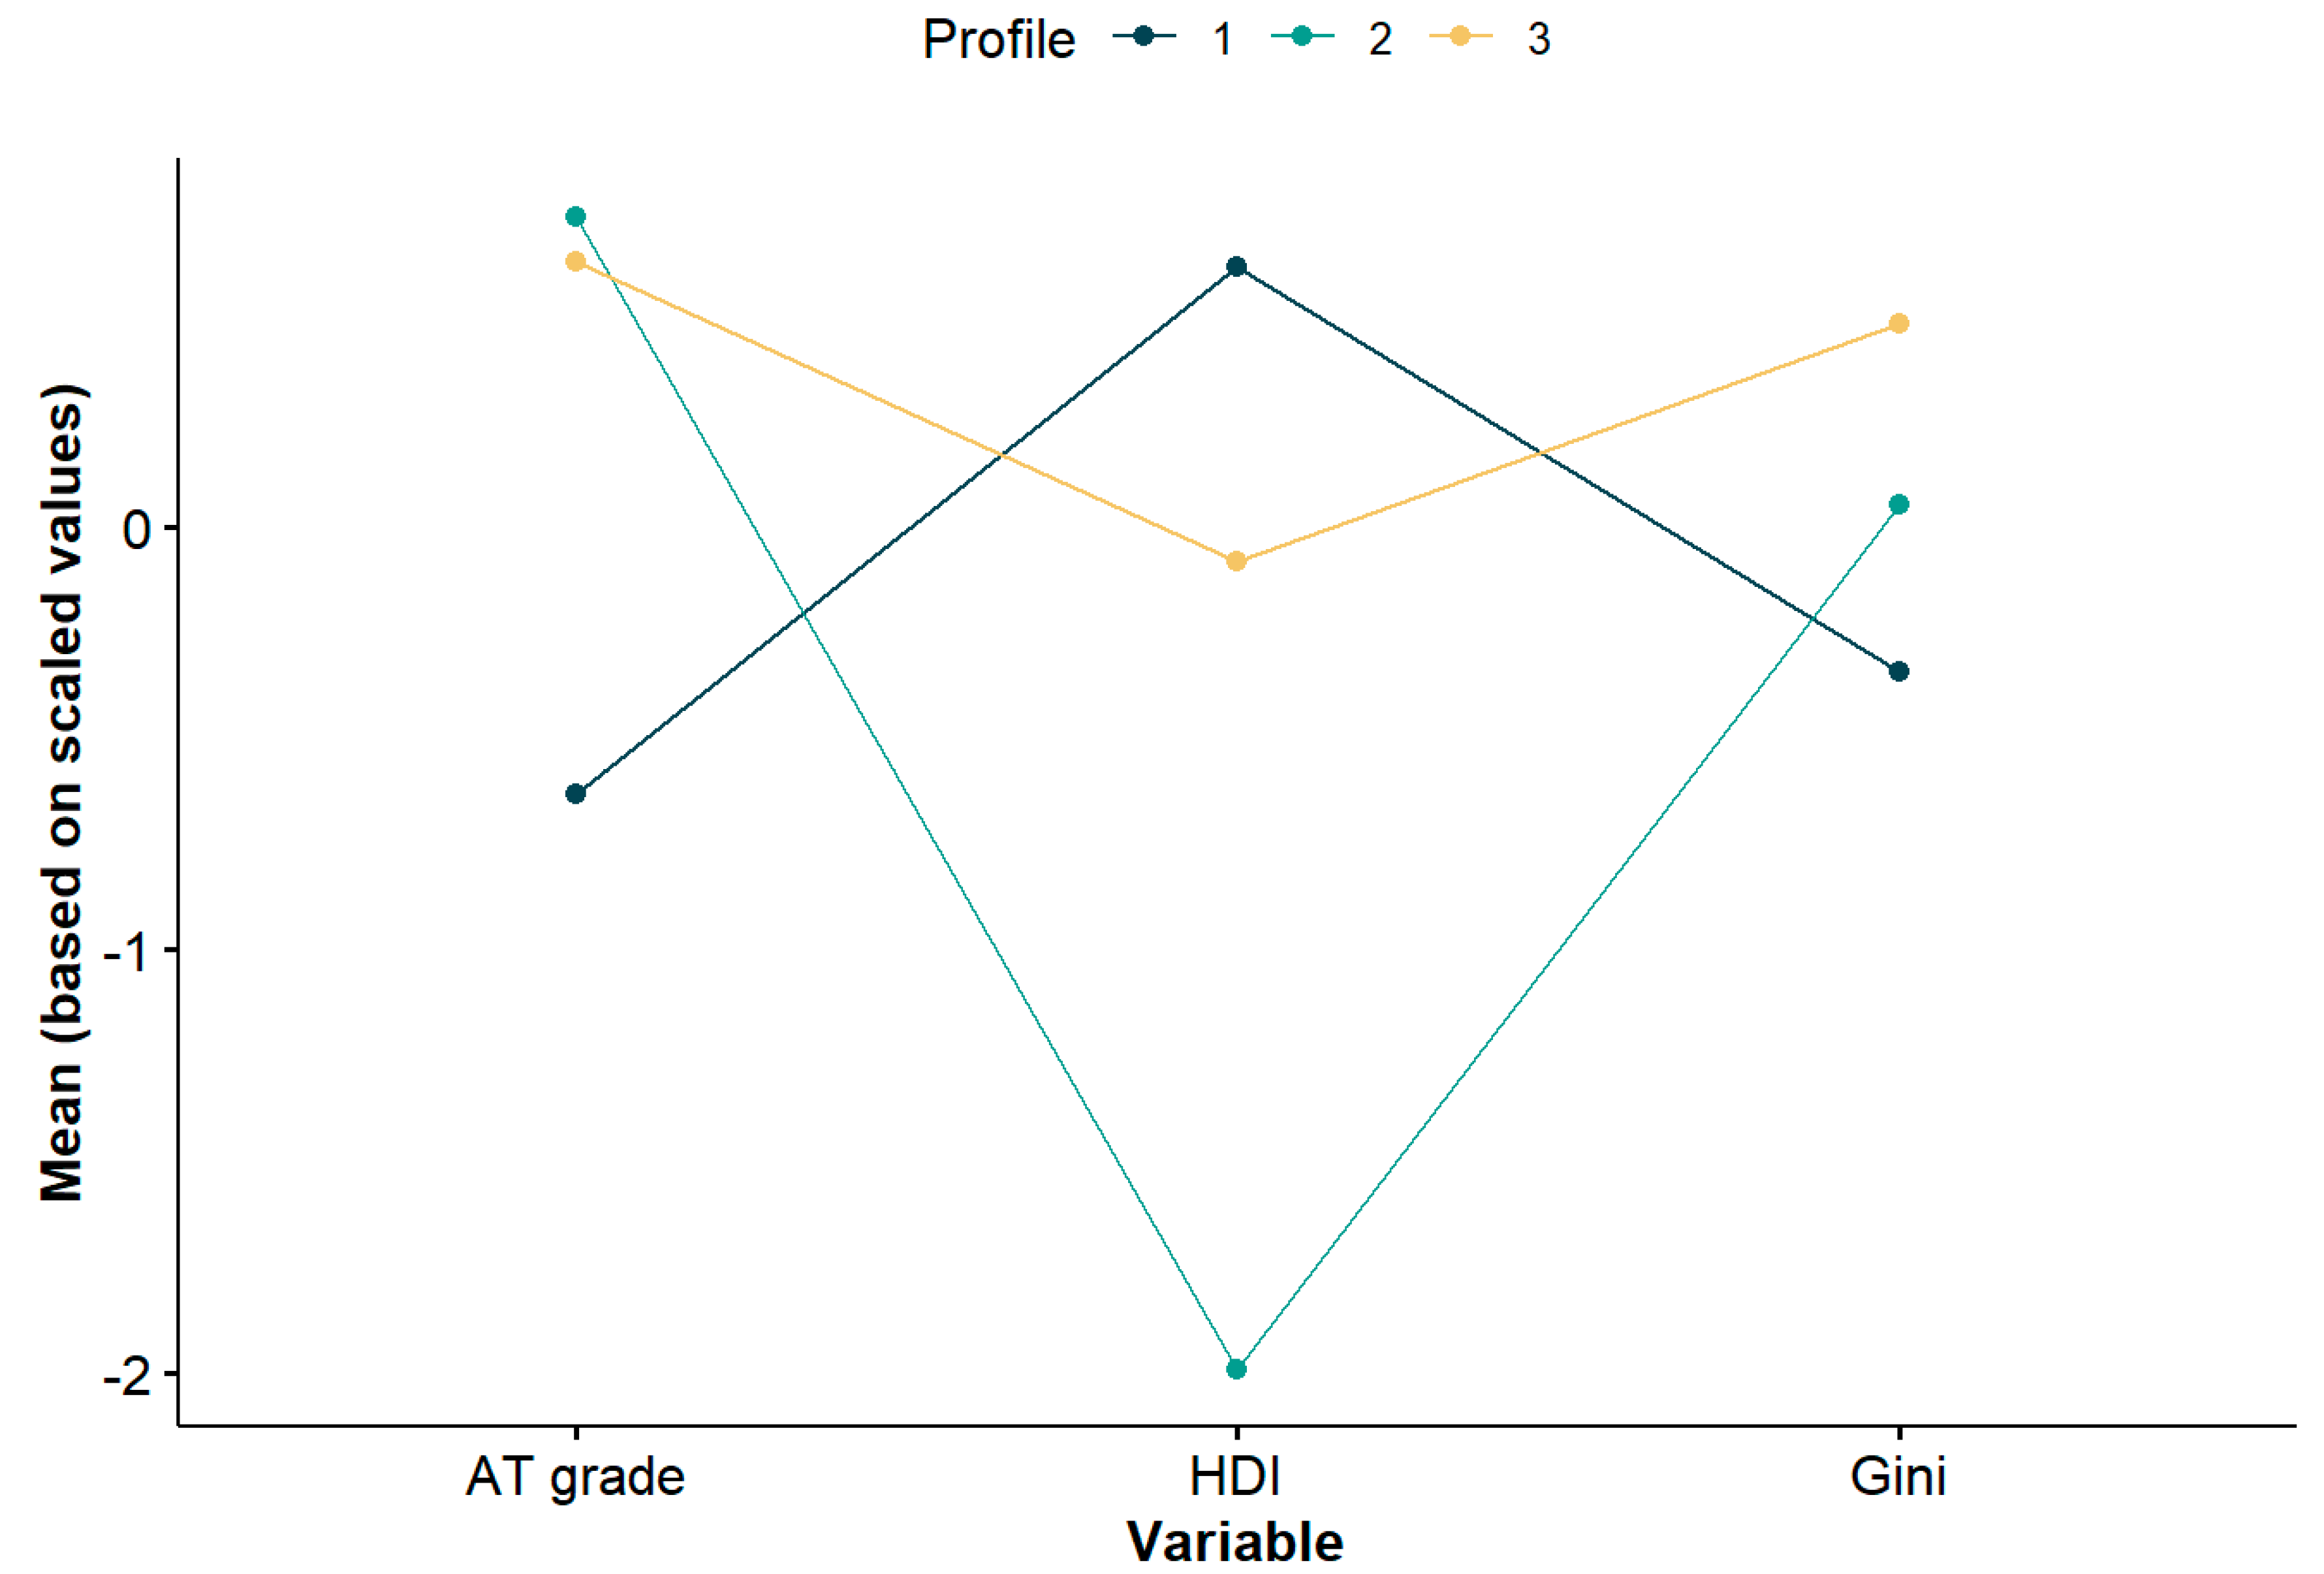
4.2. Country Profiles for Active Transportation and Sociodemographic Variables
4.3. Strengths and Limitations of the Study
5. Conclusions
Author Contributions
Funding
Acknowledgments
Conflicts of Interest
References
- Sallis, J.F.; Bull, F.; Guthold, R.; Heath, G.W.; Inoue, S.; Kelly, P.; Oyeyemi, A.L.; Perez, L.G.; Richards, J.; Hallal, P.C. Progress in physical activity over the Olympic quadrennium. Lancet 2016, 388, 1325–1336. [Google Scholar] [CrossRef]
- Ikeda, E.; Hinckson, E.; Witten, K.; Smith, M. Assessment of direct and indirect associations between children active school travel and environmental, household and child factors using structural equation modelling. Int. J. Behav. Nutr. Phys. Act. 2019, 16, 1–17. [Google Scholar] [CrossRef] [PubMed] [Green Version]
- Larouche, R.; Saunders, T.J.; Faulkner, G.E.J.; Colley, R.; Tremblay, M. Associations between active school transport and physical activity, body composition, and cardiovascular fitness: A systematic review of 68 studies. J. Phys. Act. Health 2014, 11, 206–227. [Google Scholar] [CrossRef]
- Centers for Disease Control and Prevention (CDC) Transportation Health Impact Assessment Toolkit. Available online: https://www.cdc.gov/healthyplaces/transportation/promote_strategy.htm (accessed on 20 August 2019).
- Lubans, D.R.; Boreham, C.A.; Kelly, P.; Foster, C.E. The relationship between active travel to school and health-related fitness in children and adolescents: A systematic review. Int. J. Behav. Nutr. Phys. Act. 2011, 8, 5. [Google Scholar] [CrossRef] [PubMed] [Green Version]
- Andersen, L.B.; Wedderkopp, N.; Kristensen, P.; Moller, N.C.; Froberg, K.; Cooper, A.R. Cycling to school and cardiovascular risk factors: A longitudinal study. J. Phys. Act. Health 2011, 8, 1025–1033. [Google Scholar] [CrossRef] [Green Version]
- Sun, Y.; Liu, Y.; Tao, F.B. Associations between active commuting to school, body fat, and mental well-being: Population-based, cross-sectional study in China. J. Adolesc. Health 2015, 57, 679–685. [Google Scholar] [CrossRef]
- Ruiz-Ariza, A.; de la Torre-Cruz, M.J.; Redecillas-Peiró, M.T.; Martínez-López, E.J. Influencia del desplazamiento activo sobre la felicidad, el bienestar, la angustia psicológica y la imagen corporal en adolescentes. Gac. Sanit. 2015, 29, 454–457. [Google Scholar] [CrossRef] [Green Version]
- Fusco, C.; Moola, F.; Richichi, V. Toward an understanding of children’s perceptions of their transport geographies: (non)active school travel and visual representations of the built environment. J. Transp. Geogr. 2012, 20, 62–70. [Google Scholar] [CrossRef]
- Marshall, J.D.; Wilson, R.D.; Meyer, K.L.; Rajangam, S.K.; McDonald, N.C.; Wilson, E.J. Vehicle Emissions during Children’s School Commuting: Impacts of Education Policy. Environ. Sci. Technol. 2010, 44, 1537–1543. [Google Scholar] [CrossRef]
- Larouche, R. Last Child Walking?-Prevalence and Trends in Active Transportation. In Children’s Active Transportation; Larouche, R., Ed.; Elsevier Inc.: Cambridge, UK, 2018; pp. 53–71. ISBN 978-0-12-811931-0. [Google Scholar]
- Larouche, R.; Sarmiento, O.L.; Broyles, S.T.; Denstel, K.D.; Church, T.S.; Barreira, T.V.; Chaput, J.-P.; Fogelholm, M.; Hu, G.; Kuriyan, R.; et al. Are the correlates of active school transport context-specific? Int. J. Obes. Suppl. 2015, 5, S89–S99. [Google Scholar] [CrossRef]
- Guthold, R.; Cowan, M.J.; Autenrieth, C.S.; Kann, L.; Riley, L.M. Physical activity and sedentary behavior among schoolchildren: A 34-country comparison. J. Pediatr. 2010, 157, 43–49.e1. [Google Scholar] [CrossRef] [PubMed]
- Aubert, S.; Barnes, J.D.; Abdeta, C.; Abi Nader, P.; Adeniyi, A.F.; Aguilar-Farias, N.; Andrade Tenesaca, D.S.; Bhawra, J.; Brazo-Sayavera, J.; Cardon, G.; et al. Global Matrix 3.0 Physical Activity Report Card Grades for Children and Youth: Results and Analysis From 49 Countries. J. Phys. Act. Health 2018, 15, S251–S273. [Google Scholar] [CrossRef] [PubMed] [Green Version]
- Aubert, S.; Barnes, J.D.; Forse, M.L.; Turner, E.; González, S.A.; Kalinowski, J.; Katzmarzyk, P.T.; Lee, E.Y.; Ocansey, R.; Reilly, J.J.; et al. The international impact of the active healthy kids global alliance physical activity report cards for children and youth. J. Phys. Act. Health 2019, 16, 679–697. [Google Scholar] [CrossRef] [PubMed]
- United Nations Development Programme. Human Development Report 2016 “Human Development for Everyone”; United Nations Development Programme: New York, NY, USA, 2016. [Google Scholar]
- The World Bank Gini index (World Bank Estimate). Available online: https://datacatalog.worldbank.org/gini-index-world-bank-estimate-1 (accessed on 25 December 2019).
- Lee, R.J.; Sener, I.N.; Jones, S.N. Understanding the role of equity in active transportation planning in the United States. Transp. Rev. 2017, 37, 211–226. [Google Scholar] [CrossRef]
- Elgar, F.J.; Pförtner, T.K.; Moor, I.; De Clercq, B.; Stevens, G.W.J.M.; Currie, C. Socioeconomic inequalities in adolescent health 2002–2010: A time-series analysis of 34 countries participating in the Health Behaviour in School-aged Children study. Lancet 2015, 385, 2088–2095. [Google Scholar] [CrossRef] [Green Version]
- Stanley, L.; Kellermanns, F.W.; Zellweger, T.M. Latent Profile Analysis: Understanding Family Firm Profiles. Fam. Bus. Rev. 2017, 30, 84–102. [Google Scholar] [CrossRef]
- Rosenberg, J.M.; Beymer, P.N.; Anderson, D.J.; Schmidt, J.A. tidyLPA: An R Package to Easily Carry Out Latent Profile Analysis (LPA) Using Open-Source or Commercial Software. J. Open Source Softw. 2018, 3, 978. [Google Scholar] [CrossRef] [Green Version]
- World Health Organization Global School-Based Student Health Survey (GSHS). Available online: https://www.who.int/ncds/surveillance/gshs/en/ (accessed on 15 August 2020).
- Roberts, C.; Freeman, J.; Samdal, O.; Schnohr, C.W.; de Looze, M.E.; Nic Gabhainn, S.; Iannotti, R.; Rasmussen, M. International HBSC Study Group The Health Behaviour in School-aged Children (HBSC) study: Methodological developments and current tensions. Int. J. Public Health 2009, 54 (Suppl. 2), 140–150. [Google Scholar] [CrossRef] [Green Version]
- Nylund, K.L.; Asparouhov, T.; Muthén, B.O. Deciding on the number of classes in latent class analysis and growth mixture modeling: A Monte Carlo simulation study. Struct. Equ. Model. 2007, 14, 535–569. [Google Scholar] [CrossRef]
- Sasakawa Sports Foundation. The 2015 SSF National Sports-Life Survey of Children and Young People. Executive Summary; Sasakawa Sports Foundation: Tokyo, Japan, 2015. [Google Scholar]
- Paudel, S.; Subedi, N.; Mehata, S. Physical activity level and associated factors among higher secondary school students in banke, Nepal: A cross-sectional study. J. Phys. Act. Health 2016, 13, 168–176. [Google Scholar] [CrossRef]
- Makaza, D.; Khumalo, B.; Makoni, P.; Mazulu, M.; Dlamini, K.; Tapera, E.; Banda, M.; Mlalazi, T.; Gundani, P.; Chaibva, C. Nutritional Status and Physical Fitness Profiles, Knowledge, Attitudes, Nutritional and Physical Activity Practices of Zimbabwean Primary School Children: The Zimbabwe Baseline Study. Unpublished manuscript. National University of Science and Technology: Bulawayo, Zimbabwe, 2015. [Google Scholar]
- Sithole, E. Global School-Based Health Survey Zimbabwe, Unpublished Report; Harare, Zimbabwe, 2003.
- Pilgaard, M.; Rask, S. Danskernes Motions- og Sportsvaner. 2016. Available online: https://www.idan.dk/vidensbank/downloads/danskernes-motions-og-sportsvaner-2016/9a94e44b-4cf5-4fbe-ac89-a696011583d5 (accessed on 15 August 2020).
- Kokko, S.; Mehtälä, A.; Villberg, J.; Ng, K.; Hämylä, R. The Physical Activity Behaviours of Children and Adolescents in Finland. Results of the LIITU Study; Kokko, S., Mehtäla, A., Eds.; National Sports Council: Helsinki, Finland, 2016. [Google Scholar]
- Huang, W.Y.; Wong, S.H.; He, G. Is a change to active travel to school an important source of physical activity for Chinese children? Pediatr. Exerc. Sci. 2017, 29, 161–168. [Google Scholar] [CrossRef] [PubMed]
- Korea Centers for Disease Control and Prevention. The Seventh Korea National Health and Nutrition Examination Survey (KNHANES VII-1). User Guide; Korea Centers for Disease Control and Prevention: Chung-cheonbuk-do, Korea, 2018.
- Instituto Colombiano del Bienestar Familiar; Instituto Nacional de Salud; Ministerio de la Protección Social. Encuesta Nacional de la Situación Nutricional en Colombia 2015 ENSIN; Instituto Colombiano de Bienestar Familiar: Bogotá, Colombia, 2018.
- Usman Ahmadu, B.; Maigana Usiju, N.; Ibrahim, A.; Adamu Adiel, A.; Tumba, D.; Rimamchika, M.; Solomon, J.D. Lingering hunger among primary school pupils residing in rural areas of Borno State, North-Eastern Nigeria: Implication for education and food supplementation programs. Glob. Adv. Res. J. Food Sci. Technol. 2012, 1, 093–097. [Google Scholar]
- Adeomi, A.A.; Adeoye, O.A.; Bamidele, J.O.; Abodunrin, O.L.; Odu, O.; Adeomi, O.A. Pattern and determinants of the weight status of school-age children from rural and urban communities of Osun state, Nigeria: A comparative study. J. Med. Nutr. Nutraceuticals 2015, 4, 107. [Google Scholar] [CrossRef]
- BG Be Active. First Bulgarian Report Card 2018 Active Healthy Kids; BG Be Active: Plovdiv, Bulgaria, 2018. [Google Scholar]
- Mohan, A.; Harish, R. Be Activ Chennai Study. Madras Diabetes Research Foundation, Chennai, India. Unpublished Work. 2018. [Google Scholar]
- Ghattu, K.; Kalyanaraman, K. Mysuru Study. CSI Holdsworth Memorial Hospital, Mysuru, India. Unpublished Work. 2018. [Google Scholar]
- Tetali, S.; Edwards, P.; Roberts, G.V.S.M.I. How do children travel to school in urban India? A cross-sectional study of 5842 children in Hyderabad. BMC Public Health 2016, 16, 1–7. [Google Scholar] [CrossRef] [PubMed] [Green Version]
- Dandona, R.; Anil Kumar, G.; Ameratunga, S.; Dandona, L. Road use pattern and risk factors for non-fatal road traffic injuries among children in urban India. Injury 2011, 42, 97–103. [Google Scholar] [CrossRef] [PubMed] [Green Version]
- Anitha Rani, M.; Sathiyasekaran, B.W.C. Behavioural determinants for obesity: A cross-sectional study among urban adolescents in India. J. Prev. Med. Public Health 2013, 46, 192–200. [Google Scholar] [CrossRef] [Green Version]
- Dutch National Institute for Public Health and the Environment (RIVM) Leefstijlmonitor. Available online: https://www.rivm.nl/leefstijlmonitor (accessed on 15 August 2020).
- Ministerio de Sanidad Servicios Sociales e Igualdad Estudio ALADINO 2015: Estudio de Vigilancia del Crecimiento, Alimentación, Actividad Física, Desarrollo Infantil y Obesidad en España 2015; Agencia Española de Consumo, Seguridad Alimentaria y Nutrición: Madrid, Spain, 2016.
- Direcció General de Planificació en Salut; Departament de Salut; Institut d’Estadística de Catalunya Enquesta de Salut de la Població, Estadística Oficial Prevista al Pla estadístic de Catalunya Vigent. Available online: https://salutweb.gencat.cat/ca/el_departament/estadistiques_sanitaries/enquestes/esca/ (accessed on 15 August 2020).
- Méndez-pérez, B.; Martín-rojo, J.; Castro, V.; Herrera-cuenca, M.; Landaeta-jiménez, M.; Ramírez, G.; Vásquez, M.; Rivas, P.H.; Rosalía, C. Estudio Venezolano de Nutrición y Salud : Perfil antropométrico y patrón de actividad física. Grupo del Estudio Latinoamericano de Nutrición y Salud. The Venezuelan Study of Nutrition and Health : Anthropometric profile and pattern of physical activity. Venez Nutr. 2017, 30, 53–67. [Google Scholar]
- Bel, S.; Van den Abeele, S.; Lebacq, T.; Ost, C.; Brocatus, L.; Stiévenart, C.; Teppers, E.; Tafforeau, J.; Cuypers, K. Protocol of the Belgian food consumption survey 2014: Objectives, design and methods. Arch. Public Health 2016, 74, 1–11. [Google Scholar] [CrossRef] [Green Version]
- Chen, P. Physical activity, physical fitness, and body mass index in the Chinese child and adolescent populations: An update from the 2016 Physical Activity and Fitness in China—The Youth Study. J. Sport Health Sci. 2017, 6, 381–383. [Google Scholar] [CrossRef]
- Pavelka, J.; Sigmundová, D.; Hamřík, Z.; Kalman, M.; Sigmund, E.; Mathisen, F. Trends in Active Commuting to School among Czech Schoolchildren from 2006 to 2014. Cent. Eur. J. Public Health 2017, 25 (Suppl. 1), S21–S25. [Google Scholar] [CrossRef] [Green Version]
- Vorlíček, M.; Rubín, L.; Dygrýn, J.; Mitáš, J. Pomáhá aktivní docházka/dojížd’ka českým adolescentům plnit zdravotní doporučení pro pohybovou aktivitu? Tělesná Kult. 2018, 40, 112–116. [Google Scholar] [CrossRef]
- Instituto Nacional de Estadística y Geografía-INEGI Encuesta Intercensal. Available online: http://www.inegi.org.mx/est/contenidos/Proyectos/encuestas/hogares/especiales/ei2015/ (accessed on 28 March 2020).
- Romero-Martínez, M.; Shamah-Levy, T.; Cuevas-Nasu, L.; Gómez-Humarán, I.M.; Gaona-Pineda, E.B.; Gómez-Acosta, L.M.; Rivera-Dommarco, J.Á.; Hernández-ávila, M. Diseño metodológico de la encuesta nacional de salud y nutrición de medio camino 2016. Salud Publica Mex. 2017, 59, 299–305. [Google Scholar] [CrossRef] [PubMed] [Green Version]
- Ferrari, G.L.D.M.; De Victo, E.R.; Ferrari, T.K.; Solé, D. Active transportation to school for children and adolescents from Brazil: A systematic review. Rev. Bras. Cineantropometria Desempenho Hum. 2018, 20, 406–414. [Google Scholar] [CrossRef]
- Mazur, J.; Oblacińska, A.; Jodkowska, M. Physical Activity of School Children Aged 9–17; Institute of Mother and Child: Warsaw, Poland, 2013. [Google Scholar]
- Wojtyła-Buciora, P.; Bołdowski, T.; Wojtyła, C.; Żukiewicz-Sobczak, W.; Juszczak, K.; Łabędzka-Gardy, M.; Wojtyła, A.; Krauss, H. An all-Poland survey of physical activity and sedentary lifestyles for middle school, high school and university students. J. Health Inequalities 2017, 1, 70–77. [Google Scholar] [CrossRef]
- Riley, R.; Mohun, R. Travel to School in Scotland. Hands Up Scotland Survey 2016: National Summary Report; Sustrans: Bristol, England, 2017. [Google Scholar]
- Transport Scotland. Transport and Travel in Scotland 2016; National Statistics: Edinburgh, Scotland, 2017. [Google Scholar]
- Jurak, G.; Kovač, M.; Starc, G. The ACDSi 2013-the analysis of children’s development in slovenia 2013: Study protocol. Anthropol. Noteb. 2013, 19, 123–143. [Google Scholar]
- Starc, G.; Kovač, M.; Strel, J.; Pajek, M.B.; Golja, P.; Robič, T.; Kotnik, K.Z.; Grum, D.K.; Filipčič, T.; Sorí, M.; et al. The ACDSi 2014—A decennial study on adolescents’ somatic, motor, psychosocial development and healthy lifestyle: Study protocol. Anthropol. Noteb. 2015, 21, 107–123. [Google Scholar]
- Statistics South Africa General Household Survey 2013; Statistics South Africa: Pretoria, South Africa, 2015.
- Simons, A.; Koekemoer, K.; van Niekerk, A.; Govender, R. Parental supervision and discomfort with children walking to school in low-income communities in Cape Town, South Africa. Traffic Inj. Prev. 2018, 19, 391–398. [Google Scholar] [CrossRef]
- Koekemoer, K.; Van Gesselleen, M.; Van Niekerk, A.; Govender, R.; Van As, A.B. Child pedestrian safety knowledge, behaviour and road injury in Cape Town, South Africa. Accid. Anal. Prev. 2017, 99, 202–209. [Google Scholar] [CrossRef]
- Swedish Transport Administration Children’s Routes to School, TRV 2013/54076; Swedish Transport Administration: Borlänge, Sweden, 2015.
- Amornsriwatanakul, A.; Bull, F.; Rosenberg, M. Thailand Physical Activity Children Survey; Thailand Physical Activity Research Centre and University of Western Australia: Perth, Australia, 2015. [Google Scholar]
- World Health Organization Global School-Based Student Health Survey (GSHS)-Datasets. Available online: https://www.who.int/ncds/surveillance/gshs/datasets/en/ (accessed on 15 August 2020).
- World Health Organization 2014 Global School-based Student Health Survey (GSHS) results: Bangladesh Survey. 2014. Available online: https://www.who.int/ncds/surveillance/gshs/BDH2014_public_use_codebook.pdf?ua=1 (accessed on 16 August 2020).
- Department of Transport National Travel Survey: England 2016. Statistical Release. 2016. Available online: https://assets.publishing.service.gov.uk/government/uploads/system/uploads/attachment_data/file/633077/national-travel-survey-2016.pdf (accessed on 16 August 2020).
- NatCen Social Research; University College London. Department of Epidemiology and Public Health Health Survey for England, 2015; UK Data Service: Colchester, England, 2017. [Google Scholar]
- Department for Transport Walking and Cycling Statistics, England. 2016. Available online: https://assets.publishing.service.gov.uk/government/uploads/system/uploads/attachment_data/file/674503/walking-and-cycling-statistics-england-2016.pdf (accessed on 16 August 2020).
- Agence Nationale de Sécurité Sanitaire ANSES. Étude Individuelle Nationale des Consommations Alimentaires 3. 2017. Available online: https://www.anses.fr/fr/system/files/NUT2014SA0234Ra.pdf (accessed on 16 August 2020).
- Équipe de Surveillance et D’épidémiologie Nutritionnelle (Esen) Étude de Santé sur L’environnement, la Biosurveillance, L’activité Physique et la Nutrition (Esteban) 2014–2016; Volet Nutrition, Chapitre Activité Physique et Sédentarité; Santé Publique France: Saint Maurice, Switzerland, 2017.
- Emeljanovas, A.; Gruodyte–Raciene, R.; Sukys, S.; Mieziene, B.; Rutkauskaite, R.; Trinkuniene, L.; Fatkulina, N.; Gerulskiene, I.; Balsyte, V.; Zabolotnaja, T.; et al. The Lithuanian Physical Activity Report Card for Children and Youth; Lithuanian Sports University: Kaunas, Lithuania, 2018. [Google Scholar]
- Wijnhoven, T.M.A.; Van Raaij, J.M.A.; Yngve, A.; Sjöberg, A.; Kunešová, M.; Duleva, V.; Petrauskiene, A.; Rito, A.I.; Breda, J. WHO European childhood obesity surveillance initiative: Health-risk behaviours on nutrition and physical activity in 6-9-year-old schoolchildren. Public Health Nutr. 2015, 18, 3108–3124. [Google Scholar] [CrossRef] [Green Version]
- Meškaitė, A.; Dadelienė, R.; Kowalski, I.M.; Burokienė, S.; Doveikienė, J.; Juocevičius, A.; Raistenskis, J. 11-15 Metų Mokinių Fizinio Aktyvumo Ir. Sveik. Moksl. 2012, 22, 49–53. [Google Scholar]
- Žaltauskė, V. Lietuvos 7–8 metų Vaikų Fizinis Aktyvumas ir jo Sąsajos su Individualiais, Šeimos ir Mokyklos Aplinkos Veiksniais. 2017. Available online: https://193.219.163.160/cris/handle/20.500.12512/95687 (accessed on 16 August 2020).
- European Comission Special Eurobarometer 472. Report Sport and Physical Activity; European Union. 2018. Available online: https://ec.europa.eu/commfrontoffice/publicopinion/index.cfm/ResultDoc/download/DocumentKy/82432 (accessed on 16 August 2020).
- Ministry of Health Annual Update of Key Results 2016/17: New Zealand Health Survey 2017. Available online: https://www.health.govt.nz/publication/annual-update-key-results-2016-17-new-zealand-health-survey (accessed on 16 August 2020).
- Sport New Zealand Active NZ and Active NZ Young People; Sport New Zealand: Wellington, New Zealand, 2018.
- Health Promotion Agency. 2016 Health and Lifestyles Survey: Methodology Report; Health Promotion Agency: Wellington, New Zealand, 2017. [Google Scholar]
- Ministry of Transport. Household Travel Survey; Ministry of Transport: Wellington, New Zealand, 2018.
- Morton, S.M.B.; Carr, P.E.A.; Bandara, D.K. Growing Up in New Zealand: A Longitudinal Study of New Zealand Children and Their Families; Report 1: Before We Are Born; University of Auckland: Auckland, New Zealand, 2010. [Google Scholar]
- Pizarro, A.N.; Santos, M.P.; Ribeiro, J.C.; Mota, J. Physical activity and active transport are predicted by adolescents’ different built environment perceptions. J. Public Health 2012, 20, 5–10. [Google Scholar] [CrossRef]
- Administração Regional de Saúde do Alentejo (ARSA) Estudo de Saúde da População Infantil da Região Alentejo–Relatório; Núcleo Regional do Alentejo da Plataforma Contra a Obesidade da ARSA: Évora, Portugal, 2012.
- Ministry of Education. Report of Student Participation in Physical Activity School Year 2015–2016; Sports Administration, Ministry of Education: Taipei City, Taiwan, 2017.
- Health Promotion Administration. Report of Health Behavior Survey in Junior High School Students 2016; Ministry of Health and Welfare: Taipei City, Taiwan, 2017.
- Cancer Council Victoria National Secondary Students’ Diet and Activity (NaSSDA) survey 2012–2013. Available online: http://www.cancer.org.au/news/media-releases/increase-in-teenagers-screen-use-a-new-threat-to-long-term-health.html (accessed on 6 March 2020).
- Epidemiology Section ACT Health Year 6 ACT Physical Activity and Nutrition Survey; ACTdata Collection; Epidemiology Section: Canberra, Australia, 2015.
- Centre for Epidemiology and Evidence NSW Ministry of Health. Child Population Health Survey; Centre for Epidemiology and Evidence: New South Wales, Australia, 2015. [Google Scholar]
- Queensland Health. Queensland Child Preventive Health Survey 2018, Report of the Chief Health Officer Queensland; Brisbane, QLD, Australia, 2018.
- Hardy, L.; Mihrshahi, S.; Drayton, B.; Bauman, A. NSW Schools Physical Activity and Nutrition Survey (SPANS) 2015; Full Report; NSW Department of Health: Sydney, NSW, Australia, 2016. [Google Scholar]
- Department of Education and Early Childhood Development. Victorian Child Health and Wellbeing Survey (VCHWS); Department of Education and Early Childhood Development: Victoria, Australia, 2013. [Google Scholar]
- Scriven, J.; Morris, S.; Irving, P.; Sheehan, D. Evaluating physical literacy levels of KS1 children in Jersey, Channel Islands Poster. Presented at UKSCA National Conference, Leicester, UK, 4–6 August 2017. [Google Scholar]
- Welsh Government National survey for Wales 2016/17 2017. Available online: https://gov.wales/national-survey-wales-april-2016-march-2017 (accessed on 16 August 2020).
- Hewitt, G.; Anthony, R.; Moore, G.; Melendez-Torres, G.; Murphy, S. Student Health and Wellbeing In Wales: Report of the 2017/18 Health Behaviour in School-aged Children Survey and School Health Research Network Student Health and Wellbeing Survey; Cardiff University: Cardiff, UK, 2019. [Google Scholar]
- Research Group of Physical Activity for Health Children’s Physical Activity Study 2015 and Schools in Motion Survey 2018; University of Tartu, Institute of Sport Sciences and Physiotherapy: Tartu, Estonia, 2018.
- States of Guernsey Guernsey Young People’s Survey 2016/2017. 2016. Available online: https://www.gov.gg/ypsurveyarchive (accessed on 18 August 2020).
- World Health Organization NCDs: Lebanon Global School-Based Student Health Survey (GSHS) Implementation. 2017. Available online: https://www.who.int/ncds/surveillance/gshs/lebanon/en/ (accessed on 16 August 2020).
- Canadian Fitness and Lifestyle Research Institute Bulletin 5: Active Transportation Among Children and Youth; Canadian Fitness and Lifestyle Research Institute: Ottawa, ON, Canada, 2018.
- National Center for Health Statistics. National Health and Nutrition Examination Survey; U.S. Department of Health and Human Services, CDC, National Center for Health Statistics: Hyattsville, MD, USA, 2016. [Google Scholar]
- Ministerio de Salud de Chile Encuesta Nacional de Calidad de Vida 2015–2016 (ENCAVI). 2017. Available online: http://www.sochmet.cl/wp-content/uploads/2017/06/Resultados_Abril2017_ENCAVI_2015-16_Depto_Epidemiolog%C3%ADa_MINSAL.pdf (accessed on 16 August 2020).
- Ministerio de Vivienda y Urbanismo Encuesta de Percepción de Calidad de Vida Urbana (EPCVU 2015). 2016. Available online: http://calidaddevida.colabora.minvu.cl/doc2016/Resultados%20Encuesta%20Percepci%C3%B3n%20de%20Calidad%20de%20Vida%20Urbana%202015.pdf (accessed on 16 August 2020).
- García-Hermoso, A.; Saavedra, J.M.; Olloquequi, J.; Ramírez-Vélez, R. Associations between the duration of active commuting to school and academic achievement in rural Chilean adolescents. Environ. Health Prev. Med. 2017, 22, 31. [Google Scholar] [CrossRef] [PubMed] [Green Version]
- Rodríguez-Rodríguez, F.; Cristi-Montero, C.; Celis-Morales, C.; Escobar-Gómez, D.; Chillón, P. Impact of distance on mode of active commuting in Chilean children and adolescents. Int. J. Environ. Res. Public Health 2017, 14, 1334. [Google Scholar] [CrossRef] [PubMed] [Green Version]
- Mori, N.; Armada, F.; Willcox, D.C. Walking to school in Japan and childhood obesity prevention: New lessons from an old policy. Am. J. Public Health 2012, 102, 2068–2073. [Google Scholar] [CrossRef] [PubMed]
- Tanaka, C.; Tanaka, S.; Inoue, S.; Miyachi, M.; Suzuki, K.; Abe, T.; Reilly, J.J. Results from the Japan’s 2018 report card on physical activity for children and youth. J. Exerc. Sci. Fit. 2019, 17, 20–25. [Google Scholar] [CrossRef]
- Munambah, N.; Matsungo, T.; Makaza, D.; Mahachi, C.; Mlalazi, T.; Masocha, V.; Makoni, P.; Khumalo, B.; Rutsate, S.; Mandaza, D.; et al. Physical Activity and the Nutritional Status of School-Aged Children in Zimbabwe: Current Research Evidence and Policy Implications; Active Health Kids Zimbabwe: Harare, Zimbabwe, 2018. [Google Scholar]
- Tammelin, T.; Kämppi, K.; Aalto-Nevalainen, P.; Aira, A.; Halme, N.; Husu, P.; Inkinen, V.; Joensuu, L.; Kokko, S.; Korsberg, M.; et al. Finland’s Report Card 2018–Physical Activity for Children and Youth; The LIKES Research Centre for Physical Activity and Health: Jyväskylä, Finland, 2018. [Google Scholar]
- Wong, S.H.S.; Huang, W.Y.J.; Sit, C.H.P.; Wong, M.C.S.; Sum, R.K.M.; Wong, S.W.S. The 2018 Active Healthy Kids Hong Kong Report Card on Physical Activity for Children and Youth; The Chinese University of Hong Kong: Hong Kong, China, 2018. [Google Scholar]
- Huang, W.Y.; Wong, S.H.S.; Sit, C.H.P.; Wong, M.C.S.; Sum, R.K.W.; Wong, S.W.S.; Yu, J.J. Results from the Hong Kong’s 2018 report card on physical activity for children and youth. J. Exerc. Sci. Fit. 2019, 17, 14–19. [Google Scholar] [CrossRef]
- Gonzalez, S.A.; Triana, C.A.; Garcia, J.; Sarmiento, O.L. Report Card on Physical Activity of Children and Youth —Colombia 2018–2019; Universidad de los Andes: Bogota, Colombia, 2018. [Google Scholar]
- Hidalgo, D.; Miranda, L.; Lleras, N.; Ríos, J. Al Colegio en Bici: Bike-to-School Program in Bogotá, Colombia. Transp. Res. Rec. J. Transp. Res. Board 2016, 2581, 66–70. [Google Scholar] [CrossRef]
- Sarmiento, O.; Torres, A.; Jacoby, E.; Pratt, M.; Schmid, T.L.; Stierling, G. The Ciclovía-Recreativa: A Mass-Recreational Program With Public Health Potential. J. Phys. Act. Health 2010, 7, 163–180. [Google Scholar] [CrossRef] [Green Version]
- Triana, C.A.; Sarmiento, O.L.; Bravo-Balado, A.; González, S.A.; Bolívar, M.A.; Lemoine, P.; Meisel, J.D.; Grijalba, C.; Katzmarzyk, P.T. Active streets for children: The case of the Bogotá Ciclovía. PLoS ONE 2019, 14, e0207791. [Google Scholar] [CrossRef] [Green Version]
- Congreso de la República de Colombia Ley 1811 de 2016 por la cual se Otorgan Incentivos Para Promover el uso de la Bicicleta en el Territorio Nacional y se Modifica el Código Nacional de Tránsito. 2016. Available online: https://dapre.presidencia.gov.co/normativa/normativa/LEY%201811%20DEL%2021%20DE%20OCTUBRE%20DE%202016.pdf (accessed on 16 August 2020).
- Akinroye, K.K.; Adeniyi, A.F.; Odukoya, O.O.; Adedoyin, R.A.; Odior, S.; Oyeyemi, A.L.; Metseagharun, E.; Fawehinmi, O.S.; Ezeigwe, N.; Ayorinde, R.O. 2018 Nigerian Report Card on Physical Activity for Children and Youth; Nigerian Heart Foundation: Ibadan, Nigeria, 2018. [Google Scholar]
- FIA Foundation Walking the Talk: Supporting Nigeria to Adopt Policies for Active Mobility-FIA Foundation. Available online: https://www.fiafoundation.org/blog/2017/november/walking-the-talk-supporting-nigeria-to-adopt-policies-for-active-mobility (accessed on 10 February 2020).
- Lagos State Ministry of Transportation; Lagos Metropolitan Area Transport Authority; United Nations Environment Programme; Institute for Transportation and Development Policy. Lagos Non-Motorised Transport Policy Empowering Pedestrians and Cyclists for a Better City; Institute for Transportation and Development Policy: Lagos, Nigeria, 2018. [Google Scholar]
- Nyawornota, V.K.; Luguterah, A.; Sofo, S.; Aryeetey, R.; Badasu, M.; Nartey, J.; Assasie, E.; Donkor, S.K.; Dougblor, V.; Williams, H.; et al. Results from Ghana’s 2018 Report Card on Physical Activity for Children and Youth. J. Phys. Act. Health 2018, 15, S366–S367. [Google Scholar] [CrossRef] [Green Version]
- Galaviz, K.; Argumedo García, G.; Gaytán-González, A.; González-Casanova, I.; González Villalobos, M.; Jáuregui, A.; Jáuregui Ulloa, E.; Medina, C.; Pacheco Miranda, Y.; Pérez Rodríguez, M.; et al. Mexican Report Card on Physical Activity of Children and Youth 2018; Universidad de Guadalajara: Guadalajara, Jal, Mexico, 2018. [Google Scholar]
- Silva, D.A.S.; Christofaro, D.G.D.; Ferrari, G.L.D.M.; da Silva, K.S.; Nardo, N., Jr.; Silva, R.J.D.S.; Fernandes, R.A.; Barbosa Filho, V.C. Report Card Brazil 2018: It’s Time to Take Care of Children and Teenagers! Report on Physical Activity in Brazilian Children and Adolescents; Federal University of Santa Catarina: Florianopolis, Santa Catarina, Brazil, 2018. [Google Scholar]
- Abdeta, C.; Teklemariam, Z.; Deksisa, A.; Abera, E. Ethiopia’s 2018 Report Card on Physical Activity for Children and Youth; Active Healthy Kids Ethiopia: Harar, Ethiopia, 2018. [Google Scholar]
- Active Healthy Kids Scotland. Active Healthy Kids Scotland Report Card 2018; University of Strathclyde: Glasgow, Scotland, 2018. [Google Scholar]
- Delisle Nyström, C.; Larsson, C.; Alexandrou, C.; Ehrenblad, B.; Eriksson, U.; Friberg, M.; Hagströmer, M.; Lindroos, A.K.; Nyberg, G.; Löf, M. Active Healthy Kids Sweden 2018; Karolinska Insitutet: Huddinge, Sweden, 2018. [Google Scholar]
- Ministry of Enterprise and Innovation. A National Cycling Strategy for More and Safer Cycling; Government Offices of Sweden: Stockholm, Sweden, 2017.
- Andrade, S.; Ochoa-Aviles, A.; Freire, W.; Romero-Sandoval, N.; Orellana, D.; Contreras, T.; Pillco, J.L.; Sacta, J.; Andrade Muñoz, D.; Ramírez, P.; et al. Results from Ecuador’s 2018 Report Card on Physical Activity for Children and Youth. J. Phys. Act. Health 2018, 15, S344–S346. [Google Scholar] [CrossRef] [PubMed]
- Aubert, S.; Aucouturier, J.; Vanhelst, J.; Fillon, A.; Genin, P.; Ganière, C.; Praznoczy, C.; Larras, B.; Schipman, J.; Duclos, M.; et al. France’s 2018 Report Card on Physical Activity for Children and Youth: Results and International Comparisons. J. Phys. Act. Health 2020, 1–8. [Google Scholar] [CrossRef] [PubMed]
- Smith, M.; Ikeda, E.; Hinckson, E.; Duncan, S.; Maddison, R.; Meredith-Jones, K.; Walker, C.; Mandic, S. New Zealand’s 2018 Report Card on Physical Activity for Children and Youth; The University of Auckland: Auckland, New Zealand, 2018. [Google Scholar]
- Smith, M.; Ikeda, E.; Duncan, S.; Maddison, R.; Hinckson, E.; Meredith-Jones, K.; Walker, C.; Mandic, S. Trends and measurement issues for active transportation in New Zealand’s physical activity report cards for children and youth: NZ child/youth active transport trends. J. Transp. Health 2019, 15, 100789. [Google Scholar] [CrossRef]
- Chang, C.-K.; Wu, C.-L.; Chen, L.-J.; Fang, S.-H.; Hung, C.-W.; Jiang, R.-S.; Lee, P.-C.; Wang, W.-Y.; Wu, C.-M. The Active Healthy Kids Taiwan Report Card 2018 on Physical Activity for Children and Youth; National Taiwan University of Sport: Taichung, Taiwan, 2018. [Google Scholar]
- Active Healthy Kids Australia. Muscular Fitness: It’s Time for a Jump Start. The 2018 Active Healthy Kids Australia Report Card on Physical Activity for Children and Young People; Active Healthy Kids Australia: Adelaide, Australia, 2018. [Google Scholar]
- Sustrans Active Journeys. Getting Young People Active on the Journey to School; Sustrans: Bristol, England, 2019. [Google Scholar]
- Living Streets. Walk to School with Living Streets; Living Streets: London, UK, 2019. [Google Scholar]
- Stratton, G.; Edwards, L.; Tyler, R.; Blain, D.; Bryant, A. Active Healthy Kids Wales 2018 Report Card; Active Healthy Kids Wales: Wales, UK, 2018. [Google Scholar]
- Williams, A.; Whitman, L.; Page, Y.L.; Page, C.L.; Chester, G.; Sebire, S.J. Results from the Bailiwick of Guernsey’s 2018 Report Card on Physical Activity for Children and Youth. J. Phys. Act. Health 2018, 15, S368–S369. [Google Scholar] [CrossRef] [PubMed] [Green Version]
- The States of Deliberation of the Island of Guernsey. The On-Island Integrated Transport Strategy-First Periodic Review; Committee for the Environment & Infrastructure: St. Martin, Guernsey, 2019. [Google Scholar]
- Abi Nader, P.; Majed, L.; Sayegh, S.; Hadla, R.; Borgi, C.; Hawa, Z.; Mattar, L.; Fares, E.-J.; Chamieh, M.C.; Habib-Mourad, C.; et al. Results from Lebanon’s 2018 Report Card on Physical Activity for Children and Youth. J. Phys. Act. Health 2018, 15. in press. [Google Scholar] [CrossRef]
- Nader, P.A.; Majed, L.; Sayegh, S.; Mattar, L.; Hadla, R.; Chamieh, M.C.; Mourad, C.H.; Fares, E.J.; Hawa, Z.; Bélanger, M. First physical activity report card for children and youth in Lebanon. J. Phys. Act. Health 2019, 16, 385–396. [Google Scholar] [CrossRef]
- ParticipACTION. The Brain + Body Equation: Canadian Kids Need Active Bodies to Build Their Best Brains. The 2018 ParticipACTION Report Card on Physical Activity for Children and Youth; ParticipACTION: Toronto, ON, Canada, 2018. [Google Scholar]
- Ontario Active School Travel Steps to Success-Ontario Active School Travel. Available online: https://ontarioactiveschooltravel.ca/steps-to-success-the-5-es/#fivees%7C4 (accessed on 14 February 2020).
- Safe Routes Partnership Safe Routes to School|Safe Routes Partnership. Available online: https://www.saferoutespartnership.org/safe-routes-school (accessed on 15 February 2020).
- National Physical Activity Plan Alliance. The 2018 United States Report Card on Physical Activity for Children and Youth; National Physical Activity Plan Alliance: Washington, DC, USA, 2018. [Google Scholar]
- Aubert, S.; Barnes, J.D.; Aguilar-Farias, N.; Cardon, G.; Chang, C.-K.; Delisle Nyström, C.; Demetriou, Y.; Edwards, L.; Emeljanovas, A.; Gába, A.; et al. Report Card Grades on the Physical Activity of Children and Youth Comparing 30 Very High Human Development Index Countries. J. Phys. Act. Health 2018, 15, S298–S314. [Google Scholar] [CrossRef] [Green Version]
- González, S.A.; Barnes, J.D.; Abi Nader, P.; Susana Andrade Tenesaca, D.; Brazo-Sayavera, J.; Galaviz, K.I.; Herrera-Cuenca, M.; Katewongsa, P.; López-Taylor, J.; Liu, Y.; et al. Report Card Grades on the Physical Activity of Children and Youth From 10 Countries With High Human Development Index: Global Matrix 3.0. J. Phys. Act. Health 2018, 15, S284–S297. [Google Scholar] [CrossRef] [Green Version]
- Manyanga, T.; Barnes, J.D.; Abdeta, C.; Adeniyi, A.F.; Bhawra, J.; Draper, C.E.; Katapally, T.R.; Khan, A.; Lambert, E.; Makaza, D.; et al. Indicators of Physical Activity Among Children and Youth in 9 Countries With Low to Medium Human Development Indices: A Global Matrix 3.0 Paper. J. Phys. Act. Health 2018, 15, S274–S283. [Google Scholar] [CrossRef] [Green Version]
- Whitfield, G.P.; Paul, P.; Wendel, A.M. Active Transportation Surveillance—United States, 1999–2012. MMWR. Surveill. Summ. 2015, 64, 1–17. [Google Scholar] [CrossRef] [Green Version]
- Manyanga, T.; Munambah, N.E.; Mahachi, C.B.; Makaza, D.; Mlalazi, T.F.; Masocha, V.; Makoni, P.; Sithole, F.; Khumalo, B.; Rutsate, S.H.; et al. Results from Zimbabwe’s 2018 Report Card on Physical Activity for Children and Youth. J. Phys. Act. Health 2018, 15, s433–s435. [Google Scholar] [CrossRef] [PubMed] [Green Version]
- Tladi, D.M.; Monnaatsie, M.; Shaibu, S.; Sinombe, G.; Mokone, G.G.; Gabaitiri, L.; Malete, L.; Omphile, H. Results from Botswana’s 2018 Report Card on Physical Activity for Children and Youth. J. Phys. Act. Health 2018, 15, s320–s322. [Google Scholar] [CrossRef] [PubMed] [Green Version]
- Brazo-Sayavera, J.; Del Campo, C.; Rodríguez, M.J.; da Silva, I.C.M.; Merellano-Navarro, E.; Olivares, P.R. Results from Uruguay’s 2018 Report Card on Physical Activity for Children and Youth. J. Phys. Act. Health 2018, 15, s425–s426. [Google Scholar] [CrossRef] [PubMed]
- Larouche, R.; Sarmiento, O.L.; Stewart, T. Active Transportation—Is the School Hiding the Forest. In Children’s Active Transportation; Elsevier: Amsterdam, The Netherlands, 2018; pp. 243–258. [Google Scholar]
- Williams, G.C.; Borghese, M.M.; Janssen, I. Objectively measured active transportation to school and other destinations among 10–13 year olds. Int. J. Behav. Nutr. Phys. Act. 2018, 15. [Google Scholar] [CrossRef] [PubMed] [Green Version]
- Herrador-Colmenero, M.; Pérez-García, M.; Ruiz, J.R.; Chillón, P. Assessing modes frequency of commuting to school in youngsters: A systematic review. Pediatr. Exerc. Sci. 2014, 26, 291–341. [Google Scholar] [CrossRef]
- Oberski, D. Mixture Models: Latent Profile and Latent Class Analysis. In Modern Statistical Methods for HCI; Robertson, J., Kaptein, M., Eds.; Human–Computer Interaction Series; Springer: Cham, Switzerland, 2016; pp. 275–287. [Google Scholar]
- Lee, C.; Zhu, X.; Yoon, J.; Varni, J.W. Beyond distance: Children’s school travel mode choice. Ann. Behav. Med. 2013, 45. [Google Scholar] [CrossRef]
- McDonald, N.C.; Aalborg, A.E. Why Parents Drive Children to School: Implications for Safe Routes to School Programs. J. Am. Plan. Assoc. 2009, 75, 331–342. [Google Scholar] [CrossRef]
- Faulkner, G.E.; Richichi, V.; Buliung, R.N.; Fusco, C.; Moola, F. What’s “quickest and easiest?”: Parental decision making about school trip mode. Int. J. Behav. Nutr. Phys. Act. 2010, 7, 62. [Google Scholar] [CrossRef] [Green Version]
- Pucher, J.; Buehler, R. Making cycling irresistible: Lessons from the Netherlands, Denmark and Germany. Transp. Rev. 2008, 28, 495–528. [Google Scholar] [CrossRef]
- Pucher, J.; Dijkstra, L. Making Walking and Cycling Safer: Lessons from Europe. Transp. Q. 2000, 54, 25–50. [Google Scholar]
- Larouche, R.; Oyeyemi, A.L.; Prista, A.; Onywera, V.; Akinroye, K.K.; Tremblay, M.S. A systematic review of active transportation research in Africa and the psychometric properties of measurement tools for children and youth. Int. J. Behav. Nutr. Phys. Act. 2014, 11, 1–18. [Google Scholar] [CrossRef] [PubMed] [Green Version]
- Oyeyemi, A.L.; Larouche, R. Prevalence and Correlates of Active Transportation in Developing Countries. In Children’s Active Transportation; Elsevier: Amsterdam, The Netherlands, 2018; pp. 173–191. [Google Scholar]
- Salvo, D.; Reis, R.S.; Sarmiento, O.L.; Pratt, M. Overcoming the challenges of conducting physical activity and built environment research in Latin America: IPEN Latin America. Prev. Med. (Baltim.) 2014, 69, S86–S92. [Google Scholar] [CrossRef] [PubMed] [Green Version]
- Katzmarzyk, P.T.; Mason, C. The physical activity transition. J. Phys. Act. Health 2009, 6, 269–280. [Google Scholar] [CrossRef] [PubMed]
- Broberg, A.; Sarjala, S. School travel mode choice and the characteristics of the urban built environment: The case of Helsinki, Finland. Transp. Policy 2015, 37, 1–10. [Google Scholar] [CrossRef]
- Sarmiento, O.L.; Lemoine, P.; Gonzalez, S.A.; Broyles, S.T.; Denstel, K.D.; Larouche, R.; Onywera, V.; Barreira, T.V.; Chaput, J.-P.; Fogelholm, M.; et al. Relationships between active school transport and adiposity indicators in school-age children from low-, middle- and high-income countries. Int. J. Obes. Suppl. 2015, 5, S107–S114. [Google Scholar] [CrossRef] [PubMed] [Green Version]
- Arango, C.M.; Parra, D.C.; Eyler, A.; Sarmiento, O.; Mantilla, S.C.; Gomez, L.F.; Lobelo, F. Walking or bicycling to school and weight status among adolescents from Montería, Colombia. J. Phys. Act. Health 2011, 8 (Suppl. 2), S171–S177. [Google Scholar] [CrossRef]
- Herrera-Cuenca, M.; Méndez-Pérez, B.; Landaeta-Jiménez, M.; Marcano, X.; Guilart, E.; Sotillé, L.; Romero, R. Results from Venezuela’s 2018 Report Card on Physical Activity for Children and Youth. J. Phys. Act. Health 2018, 15, s427–s429. [Google Scholar] [CrossRef] [Green Version]
- Jáuregui, A.; Medina, C.; Salvo, D.; Barquera, S.; Rivera-Dommarco, J.A. Active Commuting to School in Mexican Adolescents: Evidence From the Mexican National Nutrition and Health Survey. J. Phys. Act. Health 2015, 12, 1088–1095. [Google Scholar] [CrossRef]
- Torres, A.; Sarmiento, O.L.; Stauber, C.; Zarama, R. The Ciclovia and Cicloruta programs: Promising interventions to promote physical activity and social capital in Bogotá, Colombia. Am. J. Public Health 2013, 103, e23–e30. [Google Scholar] [CrossRef]
- Clark, H.; Coll-Seck, A.M.; Banerjee, A.; Peterson, S.; Dalglish, S.L.; Ameratunga, S.; Balabanova, D.; Bhan, M.K.; Bhutta, Z.A.; Borrazzo, J.; et al. A future for the world’s children? A WHO–UNICEF–Lancet Commission. Lancet 2020, 395, 605–658. [Google Scholar] [CrossRef] [Green Version]
- Sims, R.; Schaeffer, R.; Creutzig, F.; Cruz-Núñez, X.; D’Agosto, M.; Dimitriu, D.; Figueroa Meza, M.J.; Fulton, L.; Kobayashi, S.; Lah, O.; et al. Transport. In Climate Change 2014: Mitigation of Climate Change. Contribution of Working Group III to the Fifth Assessment Report of the Intergovernmental Panel on Climate Change; Edenhofer, O., Pichs-Madruga, R., Sokona, Y., Farahani, E., Kadner, S., Seyboth, K., Adler, A., Baum, I., Brunner, S., Eickemeier, P., et al., Eds.; Cambridge University Press: Cambridge, UK; New York, NY, USA, 2014; pp. 599–670. [Google Scholar]
- Peralta, M.; Henriques-Neto, D.; Bordado, J.; Loureiro, N.; Diz, S.; Marques, A. Active Commuting to School and Physical Activity Levels among 11 to 16 Year-Old Adolescents from 63 Low- and Middle-Income Countries. Int. J. Environ. Res. Public Health 2020, 17, 1276. [Google Scholar] [CrossRef] [PubMed] [Green Version]
- Aguilar-Farias, N.; Martino-Fuentealba, P.; Carcamo-Oyarzun, J.; Cortínez-O’Ryan, A.; Cristi-Montero, C.; Von Oetinger, A.; Sadarangani, K.P. A regional vision of physical activity, sedentary behaviour and physical education in adolescents from Latin America and the Caribbean: Results from 26 countries. Int. J. Epidemiol. 2018, 47, 976–986. [Google Scholar] [CrossRef] [PubMed] [Green Version]
- Tremblay, M.S.; Gray, C.E.; Akinroye, K.; Harrington, D.M.; Katzmarzyk, P.T.; Lambert, E.V.; Liukkonen, J.; Maddison, R.; Ocansey, R.T.; Onywera, V.O.; et al. Physical Activity of Children: A Global Matrix of Grades Comparing 15 Countries. J. Phys. Act. Health 2014, 11, S113–S125. [Google Scholar] [CrossRef] [PubMed]


| Grade | Interpretation a | Numerical Equivalents b |
|---|---|---|
| A+ | 94–100% | 15 |
| A | We are succeeding with a large majority of children and youth (87–93%) | 14 |
| A− | 80–86% | 13 |
| B+ | 74–79% | 12 |
| B | We are succeeding with well over half of children and youth (67–73%) | 11 |
| B− | 60–66% | 10 |
| C+ | 54–59% | 9 |
| C | We are succeeding with about half of children and youth (47–53%) | 8 |
| C− | 40–46% | 7 |
| D+ | 34–39% | 6 |
| D | We are succeeding with less than half but some children and youth (27–33%) | 5 |
| D− | 20–26% | 4 |
| F | We are succeeding with very few children and youth (<20%) | 2 |
| INC c | Incomplete—insufficient or inadequate information to assign a grade |
| Country | Active Transport Grade | Active Transport Numerical Grade | Human Development Index (HDI) a | HDI Classification | Gini Index b |
|---|---|---|---|---|---|
| Australia | D+ | 6 | 0.939 | Very high | 34.7 |
| Bangladesh | C− | 7 | 0.579 | Low to medium | 32.4 |
| Belgium (Flanders) | C+ | 9 | 0.896 | Very high | 27.7 |
| Botswana | C | 8 | 0.698 | Low to medium | 60.5 |
| Brazil | C | 8 | 0.754 | High | 51.3 |
| Bulgaria | B− | 10 | 0.794 | High | 37.4 |
| Canada | D− | 4 | 0.920 | Very high | 34.0 |
| Chile | F | 2 | 0.847 | Very high | 47.7 |
| China | C+ | 9 | 0.738 | High | 42.2 |
| Colombia | B | 11 | 0.727 | High | 50.8 |
| Czech Republic | C+ | 9 | 0.878 | Very high | 25.9 |
| Denmark | B+ | 12 | 0.925 | Very high | 28.2 |
| Ecuador | C− | 7 | 0.739 | High | 45.0 |
| England | C− | 7 | 0.909 | Very high | 33.2 |
| Estonia | D | 5 | 0.865 | Very high | 32.7 |
| Ethiopia | C | 8 | 0.448 | Low to medium | 39.1 |
| Finland | B+ | 12 | 0.895 | Very high | 27.1 |
| France | C− | 7 | 0.897 | Very high | 32.7 |
| Germany | C− | 7 | 0.926 | Very high | 31.7 |
| Ghana | C+ | 9 | 0.579 | Low to medium | 42.4 |
| Guernsey Channel Islands | D | 5 | 0.975 | Very high | 40.0 |
| Hong Kong | B+ | 12 | 0.917 | Very high | N/A |
| India | B− | 10 | 0.624 | Low to medium | 35.1 |
| Japan | A− | 13 | 0.903 | Very high | 32.1 |
| Jersey | D+ | 6 | 0.985 | Very high | 41.0 |
| Lebanon | D | 5 | 0.763 | High | 31.8 |
| Lithuania | C− | 7 | 0.848 | Very high | 37.4 |
| Mexico | C+ | 9 | 0.762 | High | 43.4 |
| Nepal | A− | 13 | 0.558 | Low to medium | 32.8 |
| Netherlands | B− | 10 | 0.924 | Very high | 29.3 |
| New Zealand | C− | 7 | 0.915 | Very high | N/A |
| Nigeria | B | 11 | 0.527 | Low to medium | 43.0 |
| Poland | C | 8 | 0.855 | Very high | 31.8 |
| Portugal | C− | 7 | 0.843 | Very high | 35.5 |
| Qatar | N/A | N/A | 0.856 | Very high | N/A |
| Scotland | C | 8 | 0.909 | Very high | 33.2 |
| Slovenia | C | 8 | 0.890 | Very high | 25.4 |
| South Africa | C | 8 | 0.666 | Low to medium | 63.0 |
| South Korea | B+ | 12 | 0.901 | Very high | 31.6 |
| Spain | B− | 10 | 0.884 | Very high | 36.2 |
| Sweden | C | 8 | 0.913 | Very high | 29.2 |
| Taiwan | C− | 7 | 0.885 | Very high | 33.6 |
| Thailand | C | 8 | 0.740 | High | 37.8 |
| United Arab Emirates | INC | N/A | 0.840 | Very high | N/A |
| United States | D− | 4 | 0.920 | Very high | 41.5 |
| Uruguay | C | 8 | 0.795 | High | 39.7 |
| Venezuela | B− | 10 | 0.767 | High | 46.9 |
| Wales | D+ | 6 | 0.909 | Very high | 33.2 |
| Zimbabwe | A− | 13 | 0.516 | Low to medium | 43.2 |
| Global average | C | 8.29 | NA | NA | NA |
| Low to medium HDI countries | C+ | 9.67 | NA | NA | NA |
| High HDI countries | C | 8.5 | NA | NA | NA |
| Very high HDI counties | C− | 7.78 | NA | NA | NA |
| Grade | Country | Rationale | Gender | Age | Destination and Direction | Frequency | Source of Information and Year | Profile |
|---|---|---|---|---|---|---|---|---|
| A− | Japan | 86% of students used active transportation to school from home. | Not reported | 6–17 years | To school | On a regular basis | The National Sports-Life Survey of Young People (SSF), 2015 [25] | 3 |
| A− | Nepal | 86% of children and youth of 15–20 years used active transportation to get to and from places. | Not reported | 15–20 years | Not specified | Not clear | Physical Activity Level and Associated Factors Among Higher Secondary School Students in Banke, Nepal: A Cross-Sectional Study, 2013 [26] | 2 |
| A− | Zimbabwe | Over 80% of children and adolescents used active transport to and from school, with variation between provinces as well as between rural and urban areas. | 82% of girls and 79% of boys engaged in active transport to and from school | 8–16 years | To and from School | Not clear | The Zimbabwe Baseline [27] and Global school-based health survey (GSHS) Zimbabwe 2003 [28] | 2 |
| B+ | Denmark | 78% of children and adolescents reported cycling, walking, or using children’s scooters as transport (e.g., to school) at least two times per week. | Not reported | 7–15 years | To school | At least two times per week | Danish Sports Habits Study 2016 [29] | 3 |
| B+ | Finland | 77% of children and adolescents actively commuted to school, on foot or by bike. | 9 years old 79% of boys, 81% of girls 11 years old 85% of boys, 81% of girls 13 years old 80% of boys, 77% of girls 15 years old 59% of boys, 63% of girls | 9–15 years | To school | Not clear | National Physical Activity Behaviour Study for Children and Adolescents 2016 (LIITU) [30] | 3 |
| B+ | Hong Kong | 80% of the adolescent males and 77% of the adolescent females actively travelled to school at least once per week. 52% of primary school children used active travel to/from school at least 5 times per week. | 80% adolescent males and 77% adolescent females | Primary and secondary | To and from school | At least 5 times per week and at least once per week | Understanding Children’s Activity and Nutrition (UCAN) study, 2011–2012 [31] | 3 |
| B+ | South Korea | 79.4% of children and adolescents reported walking or cycling to/from places, with an average duration of 39 min per day. | 84.3% of boys and 73.8% of girls took active modes of transport | 12–17 years | Not specified | Not clear | Korea National Health and Nutrition Examination Survey, 2016 [32] | 3 |
| B | Colombia | 71.7% of children and adolescents in Colombia reported walking or biking as their main mode of transport to or from school in the previous week. | Not reported | 6–17 years | To and from school | Main mode during the last 7 days | National Survey of Nutrition (ENSIN) 2015 [33] | 3 |
| B | Nigeria | The majority (61% to 80%) of Nigerian children and adolescents engage in some form of active transportation, mostly walking to and from school. | Not reported | 5–13 years | To and from school | Not clear | 2 different studies on rural and urban populations in Nigeria, conducted in 2011 [34] and 2013 [35] | 2 |
| B− | Bulgaria | 64% of children and youth reported walking, biking, or skating, etc. to go to school and back. | Not reported | Not specified | To and from school | Not clear | Bulgarian Active Kids survey, 2016 [36] | 3 |
| B− | India | Approximately 65% of children/adolescents (weighted average) reported walking or cycling to school on a regular basis. | Not reported | 5–17 years | To school | On a regular basis | 7 different studies at the national and local level conducted between 2005 and 2018 [12,13,37,38,39,40,41] | 2 |
| B− | Netherlands | 90% of the adolescents commute actively to school. 36% of the children commute actively to school | Not reported | Not specified | To school | At least three days per week | Lifestyle monitor National Survey, 2017 [42] | 1 |
| B− | Spain | 55% and 56.9% of children between 6 and 9 years old walked to and from school, respectively. In Catalonia, 61.3% of children between 3 to 14 years old walked to and from school. | Not reported | 3–14 years | To and from school | Not clear | Food, Physical Activity, Child developmentand Obesity study (ALADINO) 2011 [43], and the Catalan Health Survey (ESCA) 2016 [44] | 3 |
| B− | Venezuela | 63% of adolescents might walk at least 10 min to move from one place to another. | Not reported | Not specified | Not specified | Not clear | Venezuelan Study of Nutrition and Health [45] | 3 |
| C+ | Belgium (Flanders) | 55.5% of parents of 6-to 9-year old children reported that their child uses active transportation, and 58.9% of 10- to 17-year-olds adolescents reported to mainly use active transportation to travel to school. | Not reported | 6 to 9 and 10 to 17 | To school | Not clear | Belgian National Food Consumption Survey 2014 [46] | 1 |
| C+ | China | 56.3% of Chinese children (aged 6–18 years) reported going to and from school by walk or bicycle. | Not reported | 9 to 17 years | To and from school | Daily | Physical Activity and Fitness in China—The Youth Study (PAFCTYS), 2016 [47] | 3 |
| C+ | Czech Republic | On average, 57% (weighted mean: 59%) of children and adolescents reported using active transport to get to and from school. | Not reported | 9–17 years | To and from school | Not clear | Health Behaviour in School-aged Children Study (HBSC)2006, 2010, and 2014 [48] and International Physical Activity and Environment Network Study (IPEN), 2013–2015 [49] | 1 |
| C+ | Ghana | About 54% of children and youth especially those in the rural areas walk to school and back home covering about 2 km. | Not reported | Not specified | To and from school | Not clear | Not specified | 2 |
| C+ | Mexico | 54.8% of children 3 years and older walked to school and 1.5% rode bicycles. 69% of 10–14-year-olds walked or rode a bicycle to school. | Not reported | 3 years and older | To school | Not clear | Intercensal Survey of the National Institute of Statistics and Geography (INEGI), 2015 [50] and the National Health and Nutrition Survey 2016 (ENSANUT) [51] | 3 |
| C | Botswana | 49% of 13–15-year-olds walked or rode a bike to and from school at least one day during the past 7 days. | Not reported | 13–15 | To and from school | At least one of the last 7 days | 2005 Botswana School-based Student Health Survey (GSHS) [13] | 3 |
| C | Brazil | 55.0% of children and youth in Brazil used active transportation to get to and from school. | Not reported | 6 to 21 | To and from school | Not clear | 18 different national and regional studies conducted between 2008 and 2017 [52] | 3 |
| C | Ethiopia | Approximately 48% of children and youth (31% in urban and 65% rural) walked to and from school. | Not reported | Not specified | To and from school | Not clear | Experts’ opinion | 2 |
| C | Poland | 47.4% of 10- to 17-year-olds reported walking to school and 52.3% walking from school. 5.5% and 5.2% travel to and from school by bicycle, respectively. 41% and 5% of lower-secondary students walk and cycle to school, respectively. While 36% and 3% of upper-secondary school students walk and cycle to school, respectively. | Not reported | 10–19 years | To and from school | Not clear | Study of Physical Activity of School Children Aged 9–17 by the Institute of Mother and Child, 2013 [53] and the All-Poland survey of physical activity and sedentary lifestyles for middle school, high school and university students, 2011 [54] | 1 |
| C | Scotland | 51% and 52% of school age children and adolescents, respectively, actively commuted to school (walking, cycling, skating or using scooter). | Not reported | 4–18 years | To school | Not clear | Hands up Scotland Survey (HUS) 2016 [55], Transport and Travel in Scotland (TATiS) 2016 [56] | 1 |
| C | Slovenia | Almost 49% of children commute actively to and from school and additional 12% commute actively from school only. | 52% of boys and 50% of girls commute actively to school | 5–15 years | To and from school | Not clear | Analysis of Children’s Development in Slovenia study (ACDSi) 2013–16 [57,58] | 1 |
| C | South Africa | 63% of school-aged children walk to school. 81% of children and adolescents in Cape Town walk to school without adult supervision in low-income settings, and 61% of parents reported concerns about their children safety. | Not reported | 6–15 years | To school | Not clear | General Household Survey, 2013 [59] and two local studies conducted in Cape Town, 2016 [60,61] | 3 |
| C | Sweden | 48% and 57% of children and adolescents used active transportation to and from school in the winter and summer months, respectively. | Not reported | 6–15 years | To and from school | Not clear | Children’s Routes to School Survey 2015–16 [62] | 1 |
| C | Thailand | 53.4% children and adolescents used active transportation (walking, cycling, using a wheelchair, in-line skating or skateboarding) to get to and from places. | 54.7% of girls and 52.4% of boys used active transportation | 6–17 years | Not specified | Not clear | Thailand Physical Activity ChildrenSurvey (TPACS) 2015 [63] | 3 |
| C | Uruguay | 51.2% of adolescents between 13 and 15 years old went to the school walking or bicycling 4 or more days per week. | Not reported | 13–15 years | To school | 4 or more days per week | Global School-Based Student Health Survey (GSHS) 2012 [64] | 3 |
| C− | Bangladesh | 41.1% students aged 13–17 years used active transport to commute to or from school at all seven days prior to the survey. | Not reported | 13–17 years | To and from school | Last 7 days | Bangladesh School-based Student Health Survey (GSHS), 2014 [65] | 2 |
| C− | Ecuador | 42.7% of 5–17 years-old children reported going to school or work by foot or bike. | Boys: 42% Girls: 41% | 5–17 years | To school, work or other destinations | Not clear | Not specified | 3 |
| C− | England | On average, 42.5% of children and adolescents used active modes of transport to school everyday. | Not reported | 5–16 years | To school | Every day | National Travel Survey 2016 [66], Health Survey for England 2015 [67] and Walking and Cycling Statistics 2016 [68] | 1 |
| C− | France | 44% of the 3–10 years old and 43% of the 11–14 years old used active transportation to go to school according to the National Study of Individual Nutritional Consumption 2014–2015. And 41% of the 6–10-year-olds reported using active transportation to school according to the Health Study of the Environment, Biosurveillance, Physical Activity, and Nutrition 2015. | Not reported | 3–14 years | To school | Not clear | National Study of Individual Nutritional Consumption (INCA) 2014–2015 [69] and the Health Study of the Environment, Biosurveillance, Physical Activity and Nutrition (ESTEBAN) 2015 [70] | 1 |
| C− | Germany | Approximately 40% of the children and adolescents commute actively to school. | Not reported | Not specified | To school | Not clear | Not specified | 1 |
| C− | Lithuania | 45% of 7–8 aged children used active transport to school and 57.9% used active transport from school to home. 84% of children and adolescents (11–13 year) walked to/from school. 12% of youths and adolescents (15–24 year) reported to engage regularly in cycling from one point to another. | Not reported | 7–24 years | To and from school | Not clear | 4 different studies and one special report Eurobarometer on Sport and Physical Activity, between 2012 and 2017 [71,72,73,74,75] | 1 |
| C− | New Zealand | 45% of children and adolescents aged 5–14 years usually used active transport to school according to the NZ Health Survey, 43% of children and youth aged 5–17-year-olds usually used active transport to and from school according to the Active NZ Survey. 30% of children aged 5–12 years and 31% of adolescents aged 13–17 years used active transport to school according to the Health and Lifestyles Survey and the NZ Household Travel Survey, respectively. 24% of 6-year-olds in a longitudinal cohort study usually used active transport to get to and from school. | Not reported | 5–17 years | To and from school | Not clear | New Zealand Health Survey 2016/2017 [76], Active NZ Survey 2018 [77], Health and Lifestyles Survey 2016 [78], NZ Household Travel Survey 2015–2018 [79], and the Growing Up in New Zealand study 2010 [80] | 1 |
| C− | Portugal | A study with urban school-aged children showed that 45% of participants commuted actively to and from school. Another study in the countryside region found that 30% of the participants (aged 7 to 8 years) commuted either by foot or cycling on a regular basis during school days (ARSA 2012). | Not reported | 7–8 years and 15–24 years | To and from school | Not clear | A study in public schools from the Porto area [81] and the Health Study of the Child Population of the Alentejo Region, 2012 [82] | 1 |
| C− | Taiwan | 33–46% of children and adolescents reported walking or cycling to school most of the days. | Not reported | 7–18 years | To school | Most of the days | Student Participation in Physical Activity Survey, 2015 [83] and Health Behaviour Survey in Junior High School Students, 2016 [84] | 1 |
| D+ | Australia | National data shows that 43% of 12–17 year-olds usually travel to/from school using active transport, other state and regional studies shows that 37% of primary students and 36% of secondary students use active transport as their usual mode to get to school. | Not reported | 12–17 years | To school | Usual mode—each week (Usual defined as at least 5 trips out of 10 or on at least 2.5 school days) | National Secondary Students Diet and Activity Survey 2012–2013 [85], ACT Year 6 Physical Activity and Nutrition Survey 2015 [86], Child Population Health Survey [87], Queensland Child Preventive Health Survey 2018 [88], NSW School Physical Activity and Nutrition Survey 2015 [89], Victorian Child Health and Wellbeing survey 2016 [90] | 1 |
| D+ | Jersey | 37% of 10–15-year-olds traveled to school by active modes. | Not reported | 10–15 years | To school | Not clear | Health Related Behaviour Questionnaire 2014 [91] | 1 |
| D+ | Wales | 44% primary school children and 34% secondary school pupils traveled actively to school. In another survey, 33.8% and 36.1% of children and young people aged 11–16 years walked/cycled to and from school, respectively. | Not reported | 11–16 years | To and from school | Not clear | National Survey for Wales (2016–17) [92] and The Health Behaviour of School-aged Children (HBSC)/School Health Research Network (SHRN) Survey 2017 [93] | 1 |
| D | Estonia | The percentage of use of active transport varied between 36–56%. Specifically, 35% of children walked to school and back home, while 14% of children rode a bike to go to school. The grading process took into account the number of subjects, age range and used methodology of different studies. | Not reported | 7–17 years | To and from school | Not clear | Children’s Physical Activity Study 2015 and Schools in Motion Survey 2018 [94] | 1 |
| D | Guernsey Channel Islands | On average, 31% of children and adolescents reported active travel (walking, bicycle or scooter) to school on the day of the survey (43% of primary school pupils and 25% of secondary pupils. | Not reported | Primary and secondary (grades 6, 8 and 10) | To school | On the day of the survey | Guernsey Young People Survey 2016–2017 [95] | 1 |
| D | Lebanon | 36.8% of Lebanese adolescents between the ages of 13 and 18 reported walking or biking to school. | Not reported | 13–17 years | To school | Not clear | Global School-Based Student Health Survey 2016 (GSHS) [96] | 1 |
| D− | Canada | 21% of 5- to 19-year-olds in Canada typically use active modes of transportation (e.g., walk, bike), and 16% use a combination of active and inactive modes of transportation to travel to and from school (2014–16 CANPLAY, CFLRI). | Not reported | 5 to 19 | To and from school | Typical use | Kids CANPLAY 2014–2016 [97] | 1 |
| D− | United States | 38% of adolescents walked or used a bicycle for at least 10 min continuously once or more in a typical week to get to and from places, and 23% of youth actively commuted 5–7 days per week. | 45% of boys and 32% of girls reported any active transportation in a typical week | 12–19 years | To and from multiple places | 5 to 7 days on a typical week | National Health and Nutrition Examination Survey (NHANES 2015–16) [98] | 1 |
| F | Chile | 15% of children and youth (weighted average) rode a bike or walked to and from school (ranging from 0.29% to 32.2% in different samples and regions). | Not reported | Not specified | To and from school | Not clear | National Survey of Quality of life 2015–2016 (ENCAVI) [99], Survey of Urban Quality of Life Perception 2015 (EPCVU) [100], a cross-sectional study of seventh grade students in the Maule region 2014 [101], and a cross-sectional study in Valparaiso 2017 [102] | 1 |
| INC | United Arab Emirates | There was no current data available to grade this indicator. | NA | NA | NA | NA | NA | 1 |
| N/A | Qatar | Active transportation indicator is excluded from the report according to stakeholders’ group recommendation. This indicator is still not applicable in Qatar due to unsafe roads and the hot climate during most times of the year. | N/A | N/A | N/A | N/A | N/A | 1 |
| Profile (% of Countries) | Active Transportation Grade | Human Development Index | Gini Index | |||||||||
|---|---|---|---|---|---|---|---|---|---|---|---|---|
| Mean | SD | Min | Max | Mean | SD | Min | Max | Mean | SD | Min | Max | |
| 1 n = 25 (51%) | 6.08 | 2.55 | 0.00 | 10.00 | 0.89 | 0.05 | 0.763 | 0.985 | 33.78 | 5.29 | 25.44 | 47.70 |
| 2 n = 7 (14.3%) | 10.14 | 2.34 | 7.00 | 13.00 | 0.55 | 0.06 | 0.448 | 0.624 | 38.29 | 4.81 | 32.40 | 43.20 |
| 3 n = 17 (34.7%) | 9.82 | 1.88 | 7.00 | 13.00 | 0.80 | 0.09 | 0.666 | 0.925 | 42.08 | 10.58 | 27.10 | 63.0 |
| Grade | Country | Profile | Policies/Practices | How to Improve the Grade | Gaps |
|---|---|---|---|---|---|
| A− | Japan | 3 | Since 1953 Japan has a “walking to school practice” resulting from the implementation of the article 49 of the School Education Act, which regulates the siting of public schools in urban areas of Japan. This article establishes that the commuting distances are 4 km for elementary schools and 6 km for junior high schools. Based on these, the boards of education must ensure that children attend to schools located within those distances to allow children to walk to school [14,103,104]. | Not reported | Research on active transportation to destinations other than schools (e.g., going shopping, going to the park, sports clubs or cram schools) [104]. |
| A− | Zimbabwe | 2 | Not reported | 1. Through public health messages to highlight the benefits of active transportation and reduce the prestige/status symbol associated with motorized transportation. 2. Implementing policies that encourage and provide safe and walkable neighborhoods and bike lanes, etc. [105]. | There is a need of data reporting the time invested in active transportation and distance to and from school, as well as research data on the correlates of active transportation, and more recent data is required [105]. |
| B+ | Finland | 3 | Not reported | Not reported | There is no comparable published data available about active school commutes for upper secondary students when the distance between home and school is less than 5 km. More information is needed about active transportation to other destinations [106]. |
| B+ | Hong Kong | 3 | The high density of Hong Kong could be one of the factors facilitating active transportation to school. Since most districts in Hong Kong are highly self-contained, children can attend schools located at walkable distance from their home [107,108]. | 1. Encouraging active travel to destinations other than school may provide additional health benefits for children and adolescents. 2. Promoting cycling to and from school and other destinations in districts with a bicycle track [107,108]. | Data about active transportation to destinations other than school, as well as the relationship between active transportation, physical activity and health-related outcomes. Also, data on the duration of active travel trips is required [107,108]. |
| B | Colombia | 3 | In Bogota, the capital city of Colombia, the program “Bike to school” is implemented in public schools to promote cycling as a sustainable mode of transportation to school and other destinations in the city. The program was created in order to address the barriers to access to education and to decrease the dropout rates. Bike to school program includes the following strategies: (a) bicycle loan, (b) workshops on skills and abilities to ride a bicycle, (c) basic mechanics and road safety education, (d) participatory mapping of safe routes, (e) daily trips from a meeting point to school with adult supervision, and (f) extracurricular activities to develop responsible behaviours in the roads and to visit other destinations of interest in the city [109,110]. Another promising practice to encourage walking and cycling, but with recreational purposes, are the Open Streets programs, or Ciclovias. Colombia currently has 67 of these programs that close main roads to motorized vehicles and open them for leisure activities on Sundays and holidays [109,111]. Walking and cycling are the main activities performed by children who attend Ciclovia in Bogota [112]. Also, Colombia has a specific law to support the use of bicycles as the main mode of transport at the national level (Law 1811 of 2016). This law establishes the responsibility of public transportation systems to allow multi-modal trips through the provision of bike-supporting infrastructure, and encourages schools to implement programs to promote cycling [113]. | 1. Improving safety conditions and infrastructure to keep promoting and maintaining active transportation as a desirable behaviour since early ages [109]. | Not reported |
| B | Nigeria | 2 | The National Transport Policy in Nigeria is under review with the aim to strengthen the inclusion of non-motorized transport infrastructure and to create better non-motorized transport options for urban residents. This review is the result of a workshop on streets design led by the Federal Ministry of Transport in 2017 and is a good example of the concerted efforts to improve the conditions for active transportation in Nigeria [114,115]. Another example is the Non-Motorized Transport Policy developed in Lagos, which aims to prioritize walking, cycling and public transportation as the main modes of transport [114]. This policy specifically addresses active transportation to school through two strategies: (a) public awareness through the creation of a curriculum about road safety and benefits of active transportation for primary and secondary school students. And (b) regulations that include the creation of route plans for students to go to school, and the implementation of access and safety measures such as speed limits, traffic calming infrastructure and school zone signaling [116]. | Not reported | Not reported |
| C+ | Ghana | 2 | The Community Day Senior High Schools, built in various districts in Ghana, seem to be encouraging active transportation to school. The students who attend to this schools usually walk to and from school every day, some of them covering more than two kilometers [117]. | Not reported | Not reported |
| C+ | Mexico | 3 | Not reported | 1. Promoting active transportation among Mexican children and adolescents. 2. Communities and governments should provide appropriate safety conditions on streets, sidewalks and neighborhoods to promote walking and cycling among children and adolescents [118]. | Data on all age groups and stratified by age group and sex is desirable for future surveys [118]. |
| C | Brazil | 3 | Not reported | Local authorities should be encouraged to create a monitoring system to generate standardized and detailed reports on active transportation to school to support planning and evaluation of public policies [119]. | Data on time invested in active transportation, the distance to the school and other environmental and mobility-related factors such as bike paths, traffic and conditions of the city is lacking [52]. |
| C | Ethiopia | 2 | Not reported | 1. Building sidewalks to encourage active transportation in all cities in Ethiopia. 2. Encouraging and supporting children and adolescents to travel to and from school through active transportation [120]. | Active transportation specific studies in Ethiopia are required [120]. |
| C | Scotland | 1 | Not reported | Not reported | No data available on active commuting to and from places other than school [121]. |
| C | Sweden | 1 | A national cycling strategy has been adopted in Sweden to improve safety and increase cycling [122]. The strategy aims to increase cycling through five action lines: (a) creating more bicycle-friendly municipalities, (b) focusing on various types of cyclists (where children are highlighted as a population of interest), (c) giving higher priority to bicycle traffic in community planning, (d) building more functional and user-friendly cycling infrastructure and (e) strengthening research an innovation on cycling [123]. | Not reported | Not reported |
| C | Uruguay | 3 | Not reported | Creating policies to encourage the creation of cycle lanes and safe sidewalks. | Data on active transportation in a wider age range and to locations other than school. |
| C− | Ecuador | 3 | Not reported | Reinforcing programs aiming to promote active transportation [124]. | Not reported |
| C− | France | 1 | Not reported | Not reported | Research is needed on the characteristics of active transportation of children and adolescents (frequency, mode, distance covered) and on the potential barriers to this in order to develop effective promotion program [125]. |
| C− | Lithuania | 1 | Not reported | 1. Promoting and facilitating safe active transport to get to school and other destinations. 2. Prioritizing active transportation promotion as a key factor at schools and communities. 3. Involving parents, schools, community and policy makers in the promotion of active transportation [71]. | 1. Research on the prevalence and trends of active transport in Lithuania, considering the most popular modes of active transportation used to get to/from different points or destinations (e.g., parks, shops, sport fields) among children and adolescents as well as studying the role of active transport in achieving recommended levels of physical activity. 2. Research on health and social benefits of active transportation is needed. 3. Evaluating the impact of the cycling paths and interventions at the school, community and municipality levels. 4. Examining the potential moderators and mediators of active transport behaviour change to help refine interventions [71]. |
| C− | New Zealand | 1 | Not reported. | Strategies to encourage active travel to school are needed, especially for girls, younger children, and older adolescents [126]. This strategies should have a multi-sectoral y culturally appropriate approach, including urban planning, initiatives a the school and community level, social marketing campaigns and family support [127]. | Nationally representative data on active transportation to school and other destinations that is comparable between countries and across time is desirable [127]. |
| C− | Taiwan | 1 | Not reported | Local governments and schools should work together to create a safe and convenient environment for active transportation [128]. | Research on the contribution of active transportation to overall physical activity in children and adolescents, and about motivations and barriers for active transportation is needed [128]. |
| D+ | Australia | 1 | The Australian Capital Territory has implemented the Ride or Walk to School program since 2012 aiming to build the capacity of primary schools to support and promote active travel to and from school. The program was designed with a participatory approach including students and different stakeholders. The strategies of the program include: (a) resources for teachers and students, (b) provision of bikes and helmets, (c) safe routes maps, (d) workshops to increase skills, and (e) four annual active travel events. This program was expanded to high schools since 2016 [129]. In Western Australia, the Department of Transport implemented the program “Your Move Schools”. This is a community-focused program that promotes active and sustainable transportation providing: (a) teaching resources, (b) expert advice and (c) access to funding (up to $5000 AUD) to promote active transportation through bike education workshops, wayfinding, bike supporting infrastructure like bike shelters, bike repair stations, bike skills tracks and bicycle parkings [129]. | 1. Encouraging families to active commute at least part of the way, promoting the use of park and walk/ride/scoot zones away from school grounds to reduce traffic. 2. Creating and promoting safe routes to schools and engage schools to promote their use. 3. Creating greater awareness of actual distances between home and school and the travel time for active modes. 4. Highlighting the benefit of students travelling to school carrying their school bags as an opportunity to be active while carrying a load, which could contribute to improve their muscular fitness [129]. | 1. Nationally representative data for primary and secondary students. 2. Data on the use of active transportation to other destinations. 3. Data on the use of multi-modal transport combining active transport with public transport. 4. Research about how far families and children are willing to travel using active transportation [129]. |
| In the Northern Territory, the Nightcliff Walk and Wheel initiative is aimed at encouraging students to walk and cycle to school. This is a local project in two dense suburbs lead by principals and parents from four schools. The project has a focus on roads safety for children and has implemented activities such as the Ride2School days, increasing cycling to school [129]. | |||||
| D+ | Wales | 1 | The report card mentioned the following initiatives led by charities to promote active travel to school: 1. Active Journeys—Sustrans School active travel program promotes active transportation through different actions like: (a) providing support to schools to develop active travel plans, (b) delivering activities and lessons, (c) offering free incentives to promote active travel, (d) providing resources and online travel challenges for the school community, and (e) rewarding schools with the School Mark award for achieving excellence in active and sustainable travel [130]. 2. Living Streets Walking initiatives: This charity has two main strategies for schools, the WOW Year-Round Walk to School challenge and the Five-Days Walking challenge. Both of these aim to engage primary and secondary students to walk to school encouraging them with an interactive travel tracker and the provision of incentives at the end of the challenge. This charity also encourages the celebration of the Walk to School Week in May every year [131]. | Not reported | More research is needed on how children and young people travel to other places including shops, parks and friends’ or relatives’ houses [132]. |
| D | Guernsey Channel Islands | Guernsey has an integrated transport strategy in place that promotes active travel with the aim of having a positive impact on the environment and the population’s health [133]. The On-island Integrated Transport Strategy aims to encourage active travel, followed by the use of public transport and to reduce the use of private motor vehicles. This strategy was initially planned to progressively advance to a taxation policy for high emission vehicles to support the promotion of active travel. | Through the implementation of the integrated transport initiative that supports active travel [133]. | Not reported | |
| However, there are other actions in this strategy aimed at increasing active travel to school, such as: (a) Bikeability training at primary schools, (b) increasing the investments in walking and cycling infrastructure to improve safety for active commuters, (c) revising the speed limits to enhance the safety of vulnerable populations using active travel, and (d) developing and implementing travel plans for schools [134]. | |||||
| D | Lebanon | 1 | Not reported | Not reported | Nationally representative samples for children and adolescents and on all active transportation means are required to gain a better understanding of this indicator [135,136]. |
| D− | Canada | 1 | In Ontario, the Minister of Education expanded the funding for initiatives that improve the cognitive, physical, social and emotional well-being of students. Specifically walking school buses and biking-to-school programs have benefited from this increase in the funding [137]. These initiatives are part of the Ontario Active School Travel program (formerly Active & Safe Routes to School) which comprise five components: (a) education activities to foster the skills, confidence, and awareness such as workshops and route mapping. (b) Encouragement activities to inspire students, parents and school staff to try active travel modes. For example, walk and wheel seasonal events or walking school buses. (c) Engineering actions to create safe and accessible school sites, neighbourhoods and routes to school, such as school siting, signaling, parking restrictions, crosswalk improvements or crossing guards. (d) Enforcement of traffic policies to improve safety around schools. (e) Evaluations to measure the measure success, and demonstrate impact of the actions [138]. | 1. Creating a culture of active transportation, to make active transportation the norm. 2. Establishing lower speed limits in school areas. 3. Implementing traffic-calming devices (e.g., speed bumps/humps, chicanes, narrower intersections) to enhance compliance with speed limits, mainly in low-income areas, where more children engage in active transportation. 4. Hiring more crossing guards at busy intersections near schools. 5. Considering more progressive policies for low-income areas, to access to funding for active transportation interventions. 6. Considering children’s active transportation when planning schools and recreation facilities. | 1. Research on activetransportation to destinations such as parks, stores, recreation facilities and other places. 2. Studies on children’s preferences for cycling and how to harness them in interventions. 3. More research is needed on how to facilitate children’s independent mobility. 4. More research is needed on the use of mixed modes of transportation to and from destinations [137]. |
| In 2017, three organizations in Canada (Canada Bikes, Green Communities Canada and the National Active and Safe Routes to School Working Group) created an active transportation alliance to advocate for the adoption and funding of a national active transportation strategy [137]. However, this strategy is not yet in place. | 7. Encouraging schools to implement “drop-off spots” from which driven children could safely walk to school in groups [137]. | ||||
| D− | United States | 1 | Safe Routes to School is a movement with initiatives at the regional, state and local levels that aims to promote walking and bicycling to school, improving safety, health and physical activity levels. Actions at the local level incorporate the six E’s integrated approach: (a) education through the provision of training in skills and knowledge to walk and bicycle safely and teaching the benefits of active transportation. (b) Encouragement to motivate children to travel actively through events and activities. (c) Engineering to improve streets and neighborhoods in order to make them more convenient for walking and bicycling. (d) Enforcement of safety regulation. (e) Evaluation of the success and opportunities to improve the initiatives in place. And (f) equity to ensure that the program benefits all demographic groups. Actions at the regional and state level are focused on finding funding and ensuring the proper use of the resources invested in the program. At the federal level, the Safe Routes Partnership advocates for policy and funding support and provides expert help, ideas and resources for the leaders at all levels [139]. | 1. Investing in infrastructure, programs, and policies that promote active transportation to and from school. 2. Allocating funding to provide and improve infrastructure to encourage active transportation (e.g., sidewalks, crosswalks, bike lanes, trails, etc.). 3. Encouraging children at home to use active transportation to school and other neighborhood locations. 4. Investing in infrastructure and policies such as Safe Routes to School and walking school buses. 5. Informing parents (at all income levels) about the benefits of active transportation [140]. | 1. The study of locations where children and adolescents walk and bike, duration and distance of trips as well as the main reasons for not engaging in active transportation. 2. Surveillance systems should include children under 12 years old [140]. |
© 2020 by the authors. Licensee MDPI, Basel, Switzerland. This article is an open access article distributed under the terms and conditions of the Creative Commons Attribution (CC BY) license (http://creativecommons.org/licenses/by/4.0/).
Share and Cite
González, S.A.; Aubert, S.; Barnes, J.D.; Larouche, R.; Tremblay, M.S. Profiles of Active Transportation among Children and Adolescents in the Global Matrix 3.0 Initiative: A 49-Country Comparison. Int. J. Environ. Res. Public Health 2020, 17, 5997. https://0-doi-org.brum.beds.ac.uk/10.3390/ijerph17165997
González SA, Aubert S, Barnes JD, Larouche R, Tremblay MS. Profiles of Active Transportation among Children and Adolescents in the Global Matrix 3.0 Initiative: A 49-Country Comparison. International Journal of Environmental Research and Public Health. 2020; 17(16):5997. https://0-doi-org.brum.beds.ac.uk/10.3390/ijerph17165997
Chicago/Turabian StyleGonzález, Silvia A., Salomé Aubert, Joel D. Barnes, Richard Larouche, and Mark S. Tremblay. 2020. "Profiles of Active Transportation among Children and Adolescents in the Global Matrix 3.0 Initiative: A 49-Country Comparison" International Journal of Environmental Research and Public Health 17, no. 16: 5997. https://0-doi-org.brum.beds.ac.uk/10.3390/ijerph17165997