Burden of Mesothelioma Deaths by National Income Category: Current Status and Future Implications

 , , ,
, , , 
Abstract
:1. Introduction
2. Materials and Methods
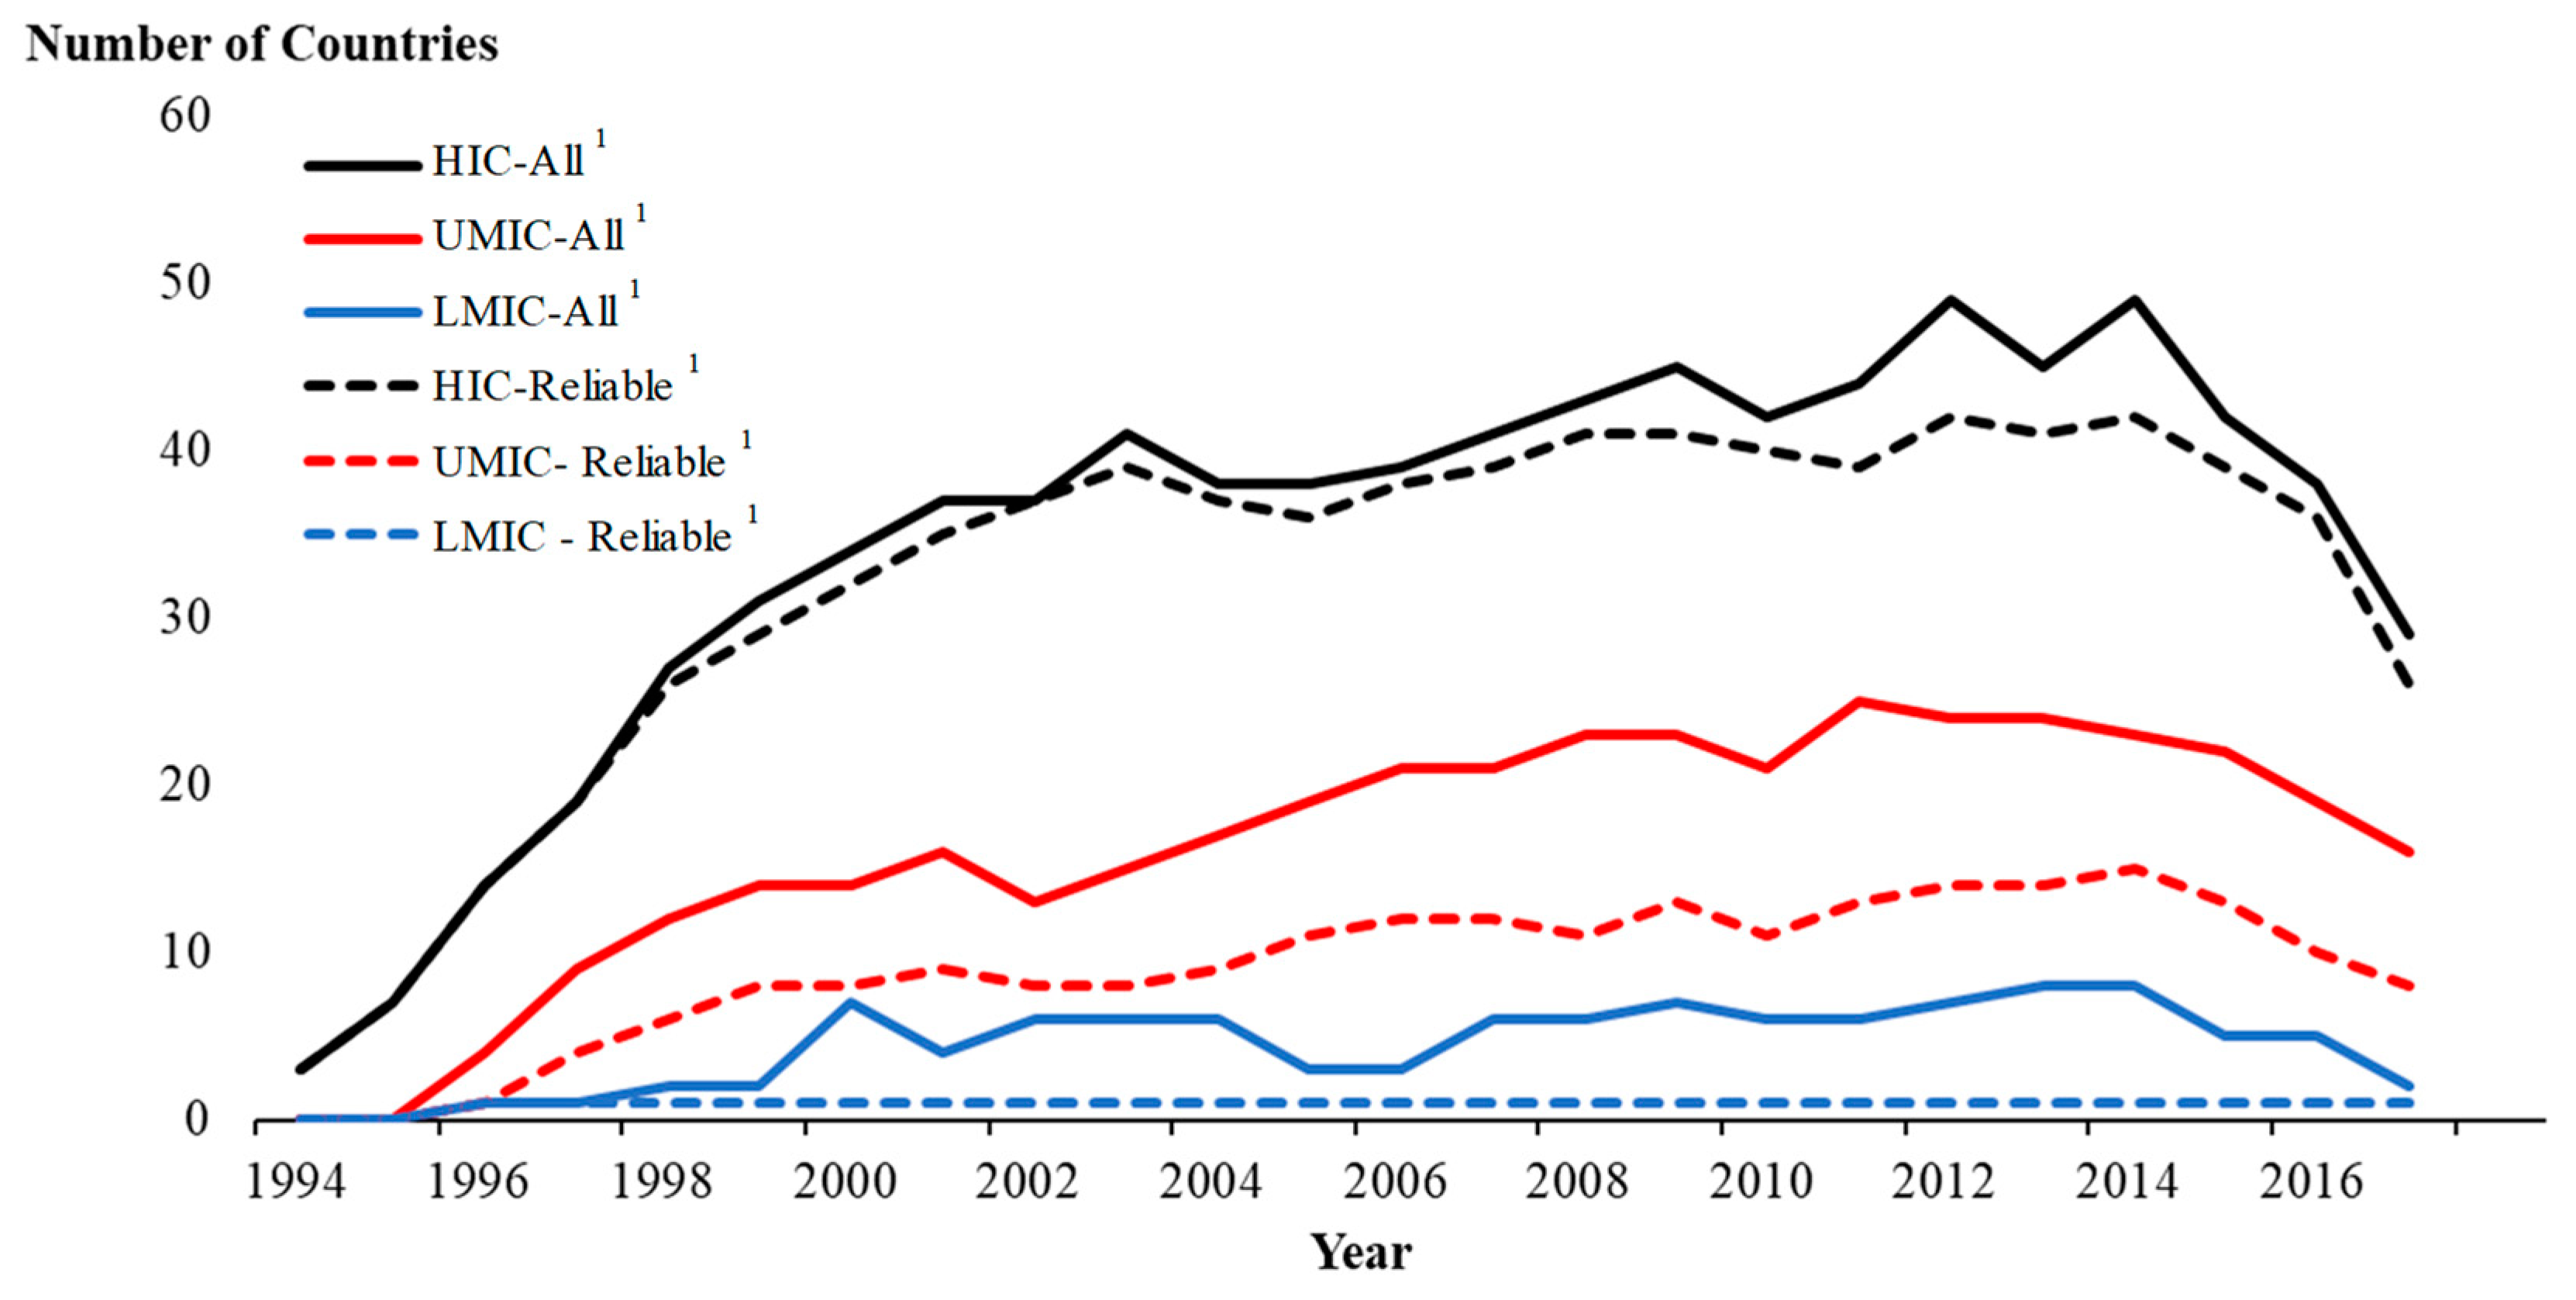
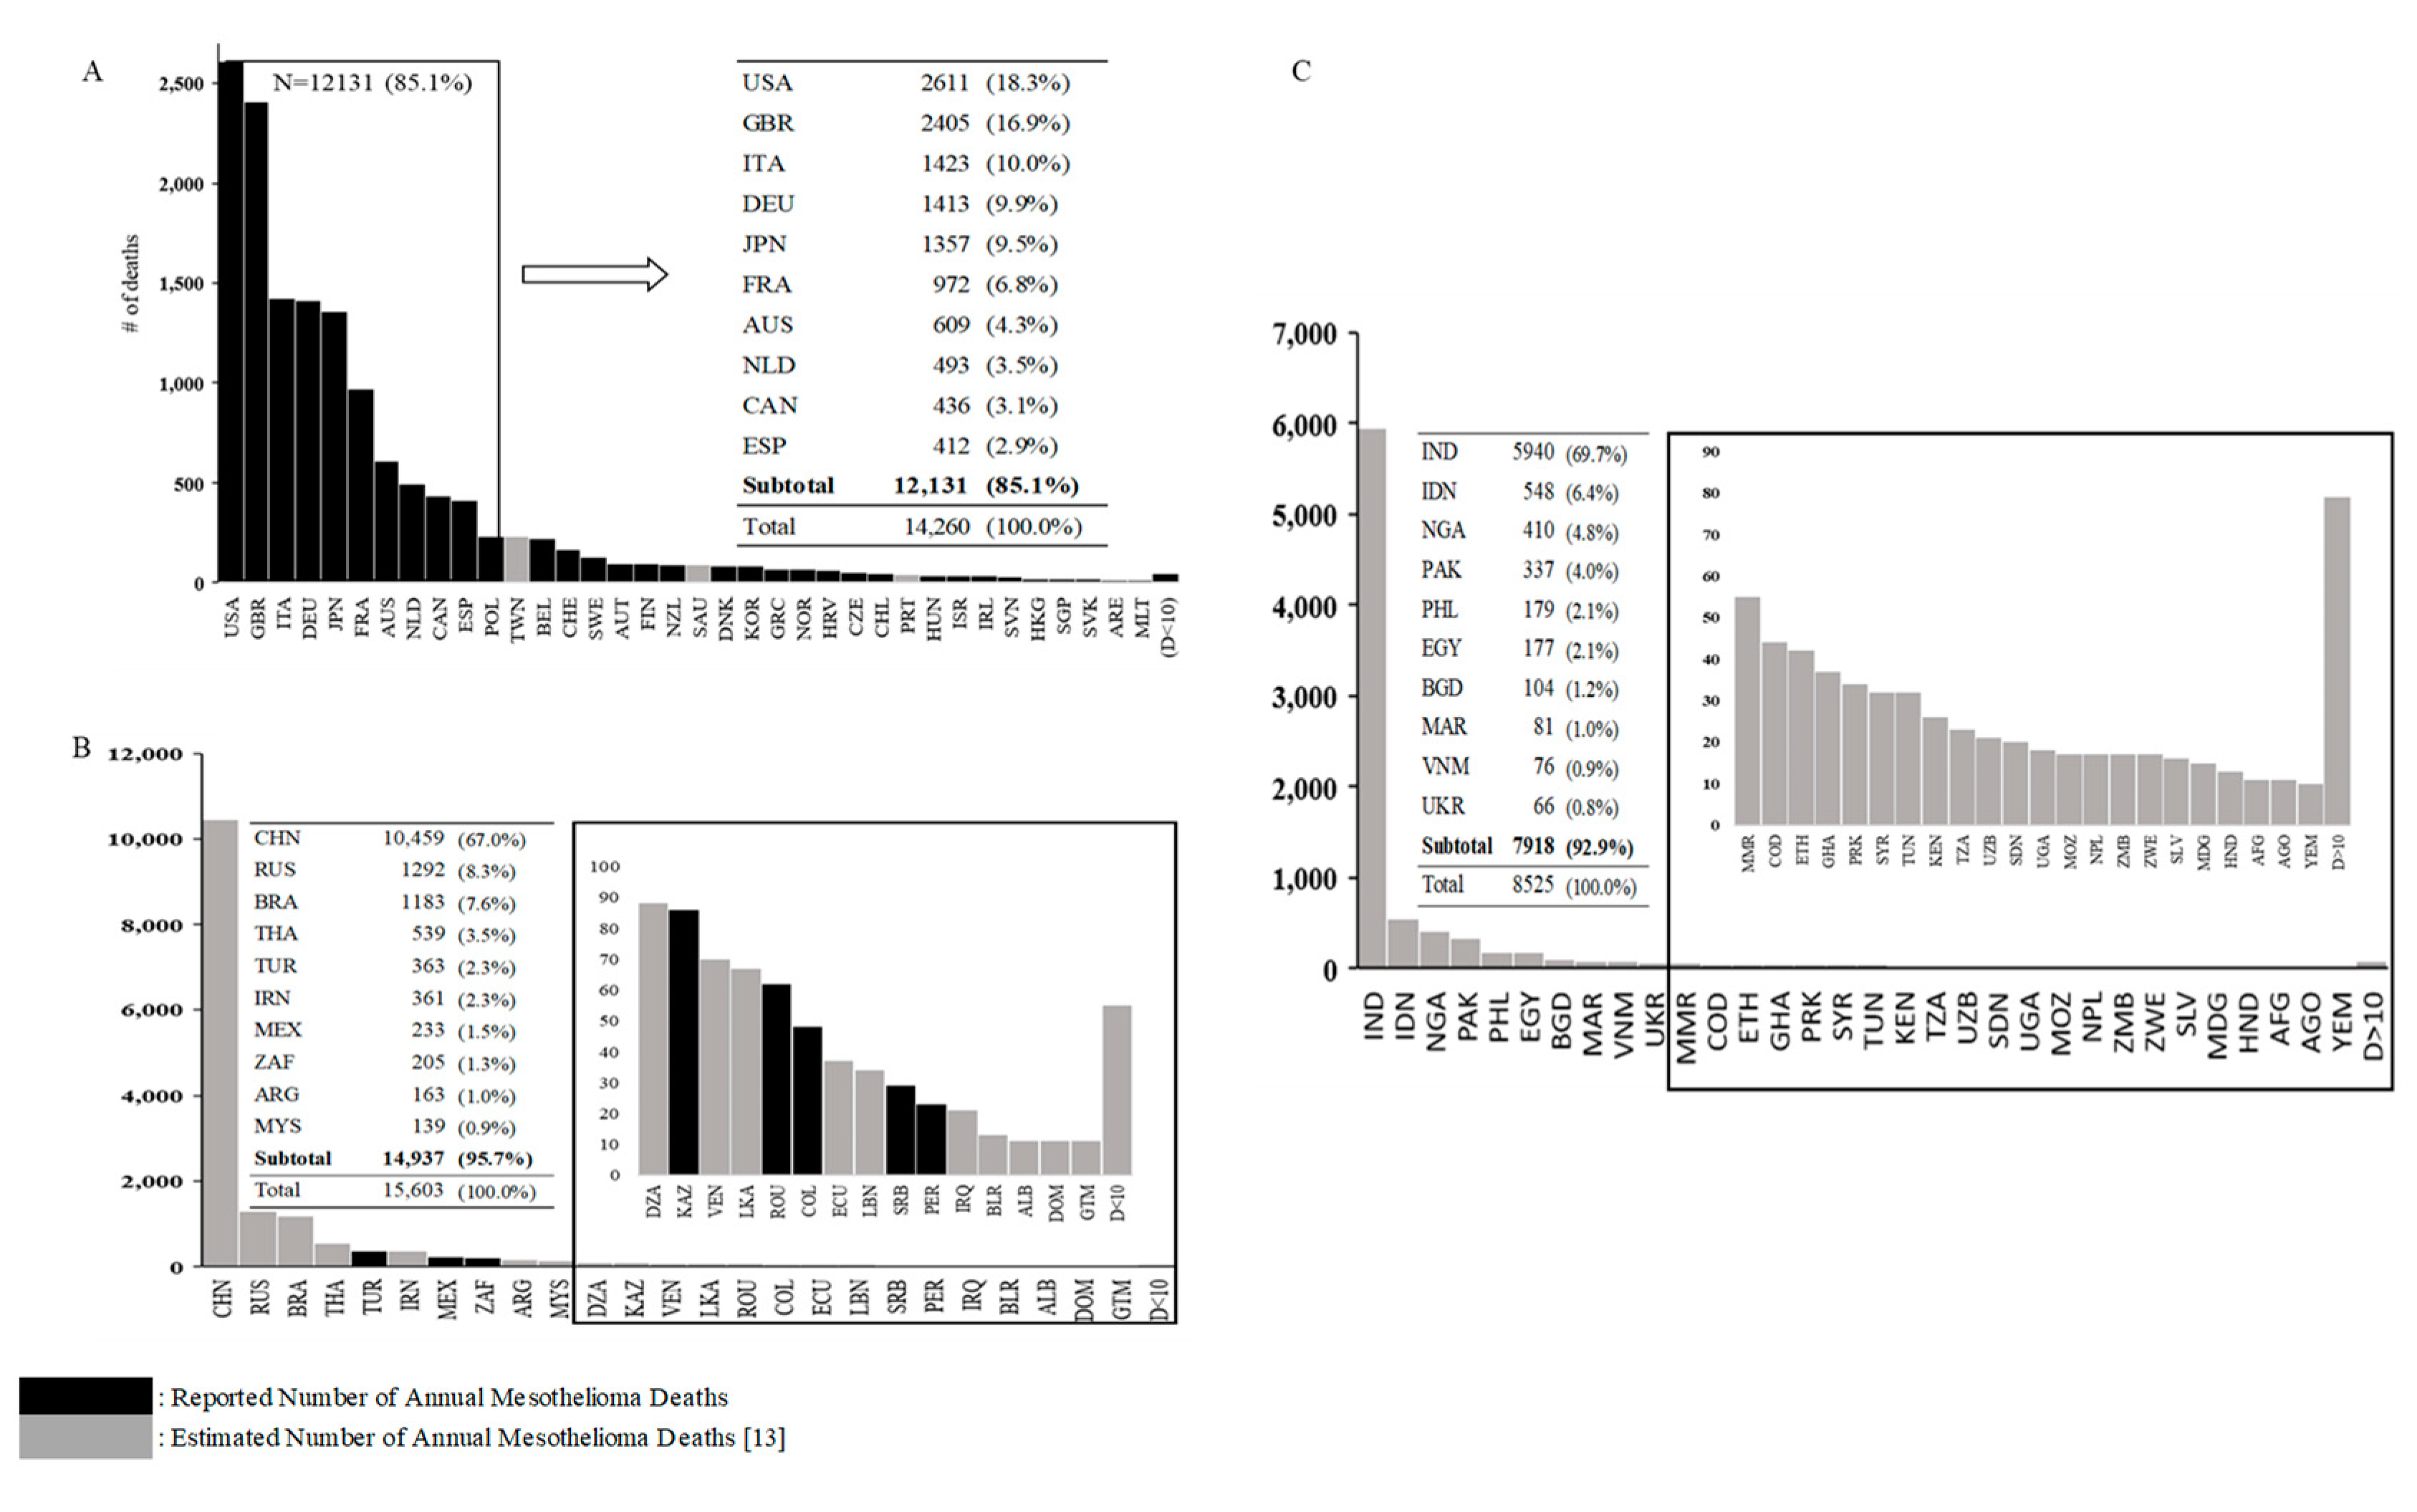
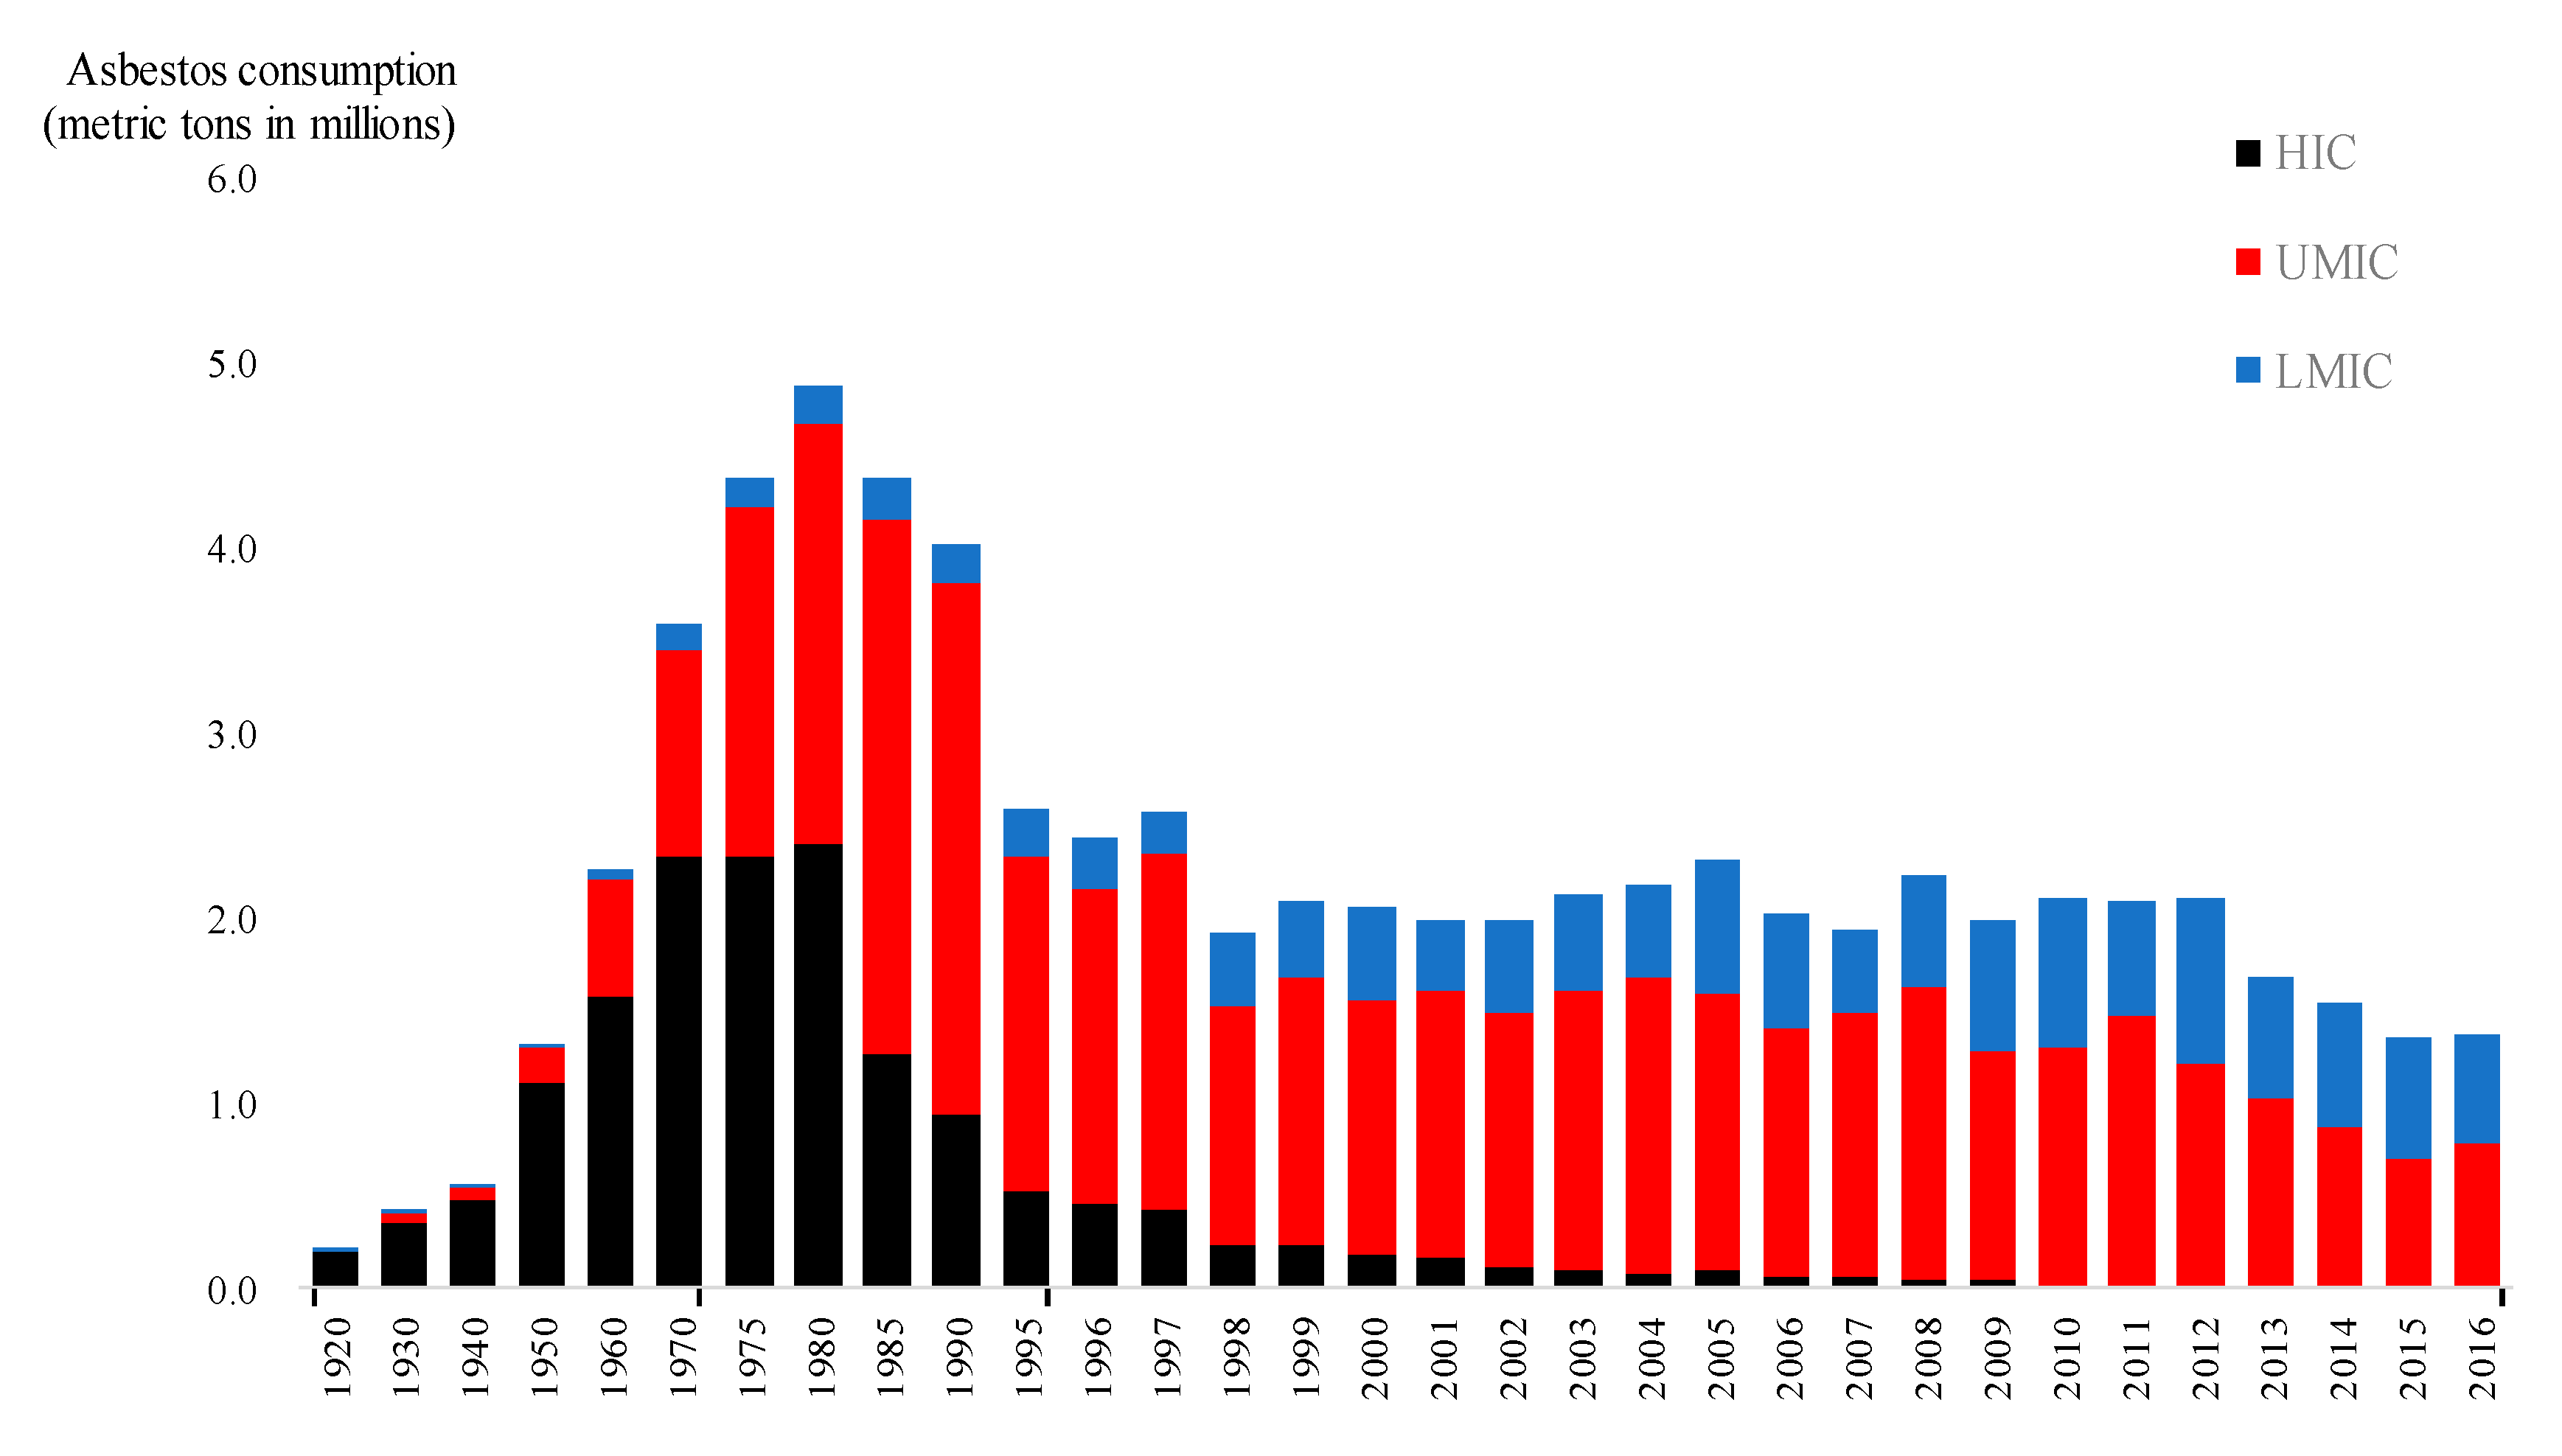
3. Results
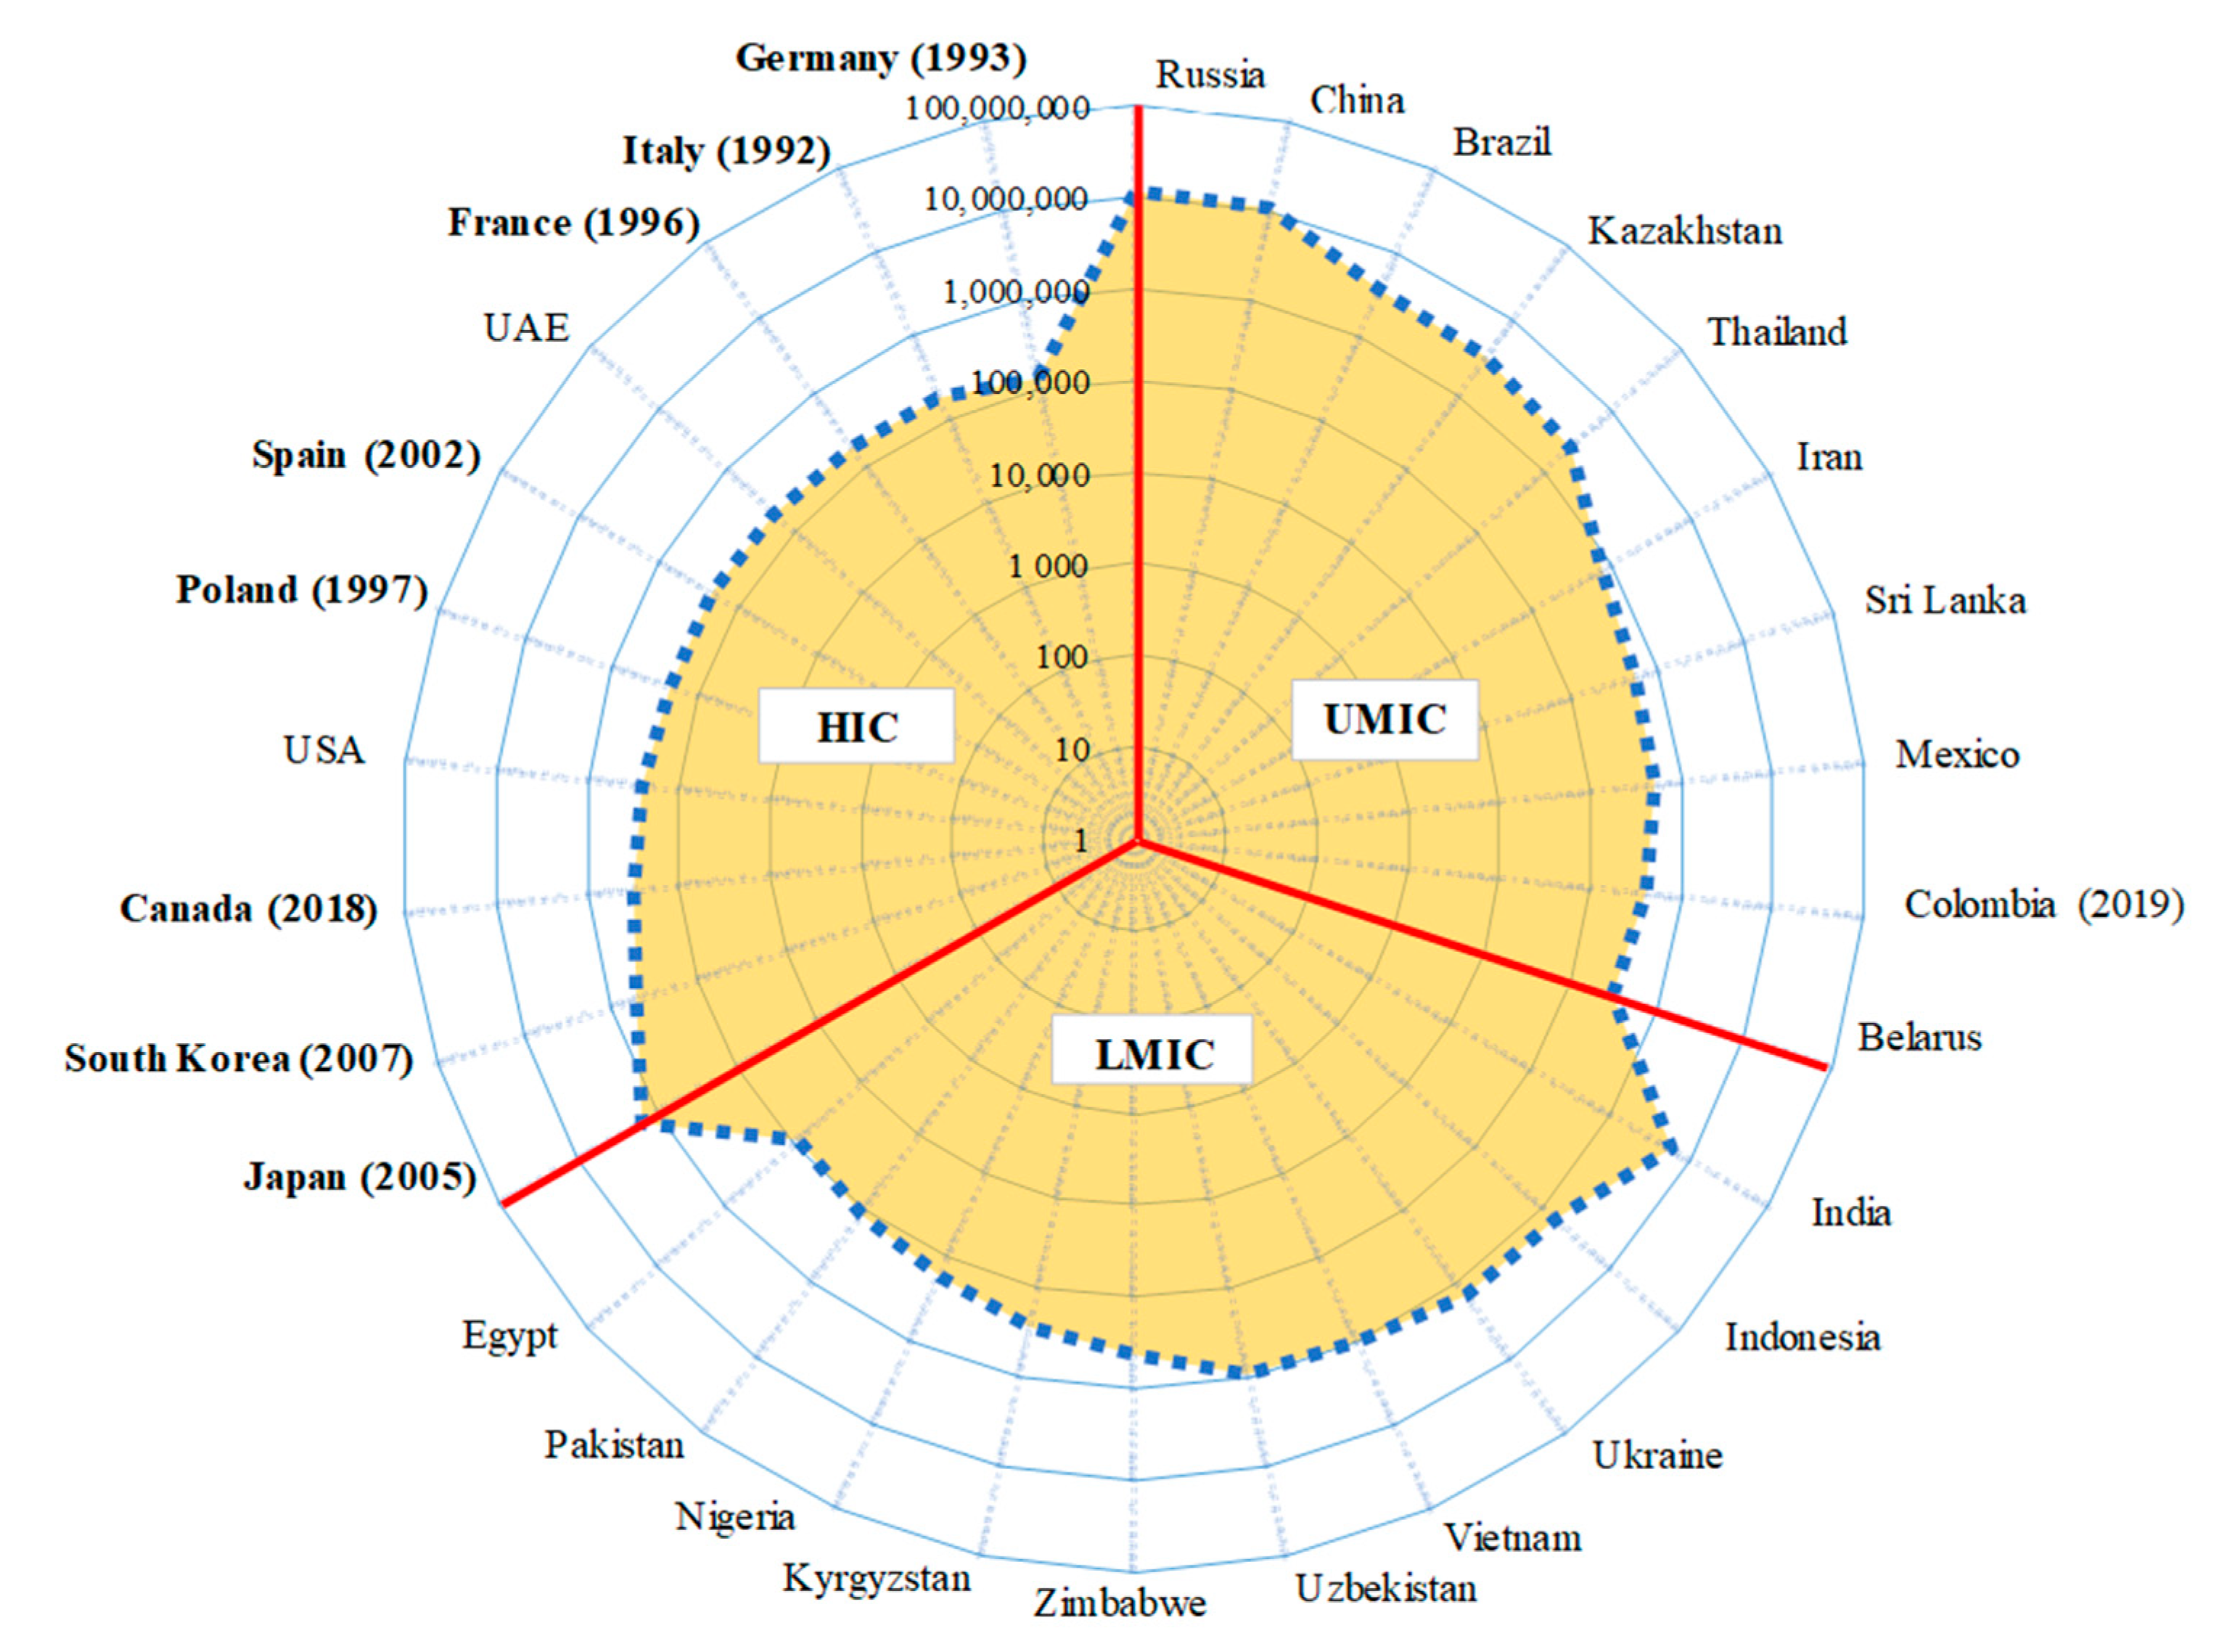
4. Discussion
5. Conclusions
Supplementary Materials
Author Contributions
Funding
Conflicts of Interest
References
- Takahashi, K.; Landrigan, P.J.; Ramazzini, C. The Global Health Dimensions of Asbestos and Asbestos-Related Diseases. Ann Glob. Health 2016, 82, 209. [Google Scholar] [CrossRef]
- Furuya, S.; Chimed-Ochir, O.; Takahashi, K.; David, A.; Takala, J. Global Asbestos Disaster. Int. J. Environ. Res. Public Health. 2018, 15, 1000. [Google Scholar] [CrossRef] [Green Version]
- Mott, F.E. Mesothelioma: A review. Ochsner. J. 2012, 12, 70–79. [Google Scholar]
- Delgermaa, V.; Takahashi, K.; Park, E.K.; Le, G.V.; Hara, T.; Sorahan, T. Global mesothelioma deaths reported to the World Health Organization between 1994 and 2008. Bull World Health Organ. 2011, 89, 716–724. [Google Scholar] [CrossRef]
- Carbone, M.; Adusumilli, P.S.; Alexander, H.R.; Jr, B.P.; Bardelli, F.; Bononi, A.; Bueno, R.; Felley-Bosco, E.; Galateau-Salle, F.; Jablons, D.; et al. Mesothelioma: Scientific clues for prevention, diagnosis, and therapy. CA. Cancer J. Clin. 2019, 69, 402–429. [Google Scholar] [CrossRef] [PubMed] [Green Version]
- Kameda, T.; Takahashi, K.; Kim, R.; Jiang, Y.; Movahed, M.; Park, E.K.; Rantanen, J. Asbestos: Use, bans and disease burden in Europe. Bull. World Health Organ. 2014, 92, 790–797. [Google Scholar] [CrossRef] [PubMed]
- LE, G.V.; Takahashi, K.; Park, E.K.; Delgermaa, V.; Oak, C.; Qureshi, A.M.; Aljunid, S.M. Asbestos use and asbestos-related diseases in Asia: Past, present and future. Respirology. 2011, 16, 767–775. [Google Scholar] [CrossRef]
- Soeberg, M.J.; Leigh, J.; Zandwijk, N.V. Malignant mesothelioma in Australia 2015: Current incidence and asbestos exposure trends. J. Toxicol. Environ. Heal. Part B. 2016, 19, 173–189. [Google Scholar] [CrossRef] [PubMed]
- Chouaid, C.; Assié, J.B.; Andujar, P.; Blein, C.; Tournier, C.; Vainchtock, A.; Scherpereel, A.; Monnet, I.; Pairon, J.C. Determinants of malignant pleural mesothelioma survival and burden of disease in France: A national cohort analysis. Cancer Med. 2018, 7, 1102–1109. [Google Scholar] [CrossRef] [PubMed]
- GBD 2016 Occupational Carcinogens Collaborators. Global and regional burden of cancer in 2016 arising from occupational exposure to selected carcinogens: A systematic analysis for the Global Burden of Disease Study 2016. Occup. Environ. Med. 2020, 77, 151–159. [Google Scholar] [CrossRef] [PubMed]
- GBD 2016 Occupational Chronic Respiratory Risk Factors Collaborators, & GBD 2016 occupational chronic respiratory risk factors collaborators. Global and regional burden of chronic respiratory disease in 2016 arising from non-infectious airborne occupational exposures: A systematic analysis for the Global Burden of Disease Study 2016. Occup. Environ. Med. 2020, 77, 142–150. [Google Scholar] [CrossRef] [PubMed] [Green Version]
- GBD 2017 Causes of Death Collaborators. Global, regional, and national age-sex-specific mortality for 282 causes of death in 195 countries and territories, 1980–2017: A systematic analysis for the Global Burden of Disease Study 2017. Lancet. 2018, 392, 1736–1788. [Google Scholar] [CrossRef] [Green Version]
- Odgerel, C.O.; Takahashi, K.; Sorahan, T.; Driscoll, T.; Fitzmaurice, C.; Yoko, O.M.; Sawanyawisuth, K.; Furuya, S.; Tanaka, F.; Horie, S.; et al. Estimation of the global burden of mesothelioma deaths from incomplete national mortality data. Occup. Environ. Med. 2017, 74. [Google Scholar] [CrossRef] [PubMed] [Green Version]
- The World Bank. World Bank Country and Lending Groups. 2019. Available online: https://databank.worldbank.org/data/download/site-content/CLASS.xls (accessed on 10 June 2020).
- WHO. WHO Mortality Database. 2019. Available online: https://www.who.int/healthinfo/statistics/mortality_rawdata/en/ (accessed on 20 February 2020).
- Hillerdal, G. Mesothelioma: Cases associated with non-occupational and low dose exposures. Occup. Environ. Med. 1999, 56, 505–513. [Google Scholar] [CrossRef] [PubMed]
- Robinson, B.W.; Musk, A.W.; Lake, R.A. Malignant mesothelioma. Lancet. 2005, 366, 397–408. [Google Scholar] [CrossRef]
- Institute for Health Metrics and Evaluation (IHME). GLobal Heath Data Exchange. Available online: http://ghdx.healthdata.org/gbd-results-tool (accessed on 9 February 2020).
- Virta, R.L. Worldwide Asbestos Supply and Consumption Trends from 1900 through 2003; U.S. Geological Survey: Reston, VA, USA, 2006. [Google Scholar] [CrossRef]
- Virta, R.L. Worldwide asbestos supply and consumption trends from 2003 through 2007. Circular 1298, U.S. Geological Survey: Reston, VA, USA. 2009. Available online: https://s3-us-west-2.amazonaws.com/prd-wret/assets/palladium/production/mineral-pubs/asbestos/mis-2007-asbes.pdf (accessed on 10 June 2020).
- Virta, R.L. 2012 Minerals Yearbook Asbestos, U.S. Geological Survey: Reston, VA, USA 2016. Available online: https://s3-us-west-2.amazonaws.com/prd-wret/assets/palladium/production/mineral-pubs/asbestos/myb1-2012-asbes.pdf (accessed on 10 June 2020).
- Park, E.K.; Takahashi, K.; Hoshuyama, T.; Cheng, T.J.; Delgermaa, V.; Le, G.V.; Sorahan, T. Global Magnitude of Reported and Unreported Mesothelioma. Environ. Health Perspect. 2011, 119, 514–518. [Google Scholar] [CrossRef] [Green Version]
- WHO. International Statistical Classification of Diseases and Related Health Problems 10th Revision (ICD-10). Available online: https://icd.who.int/browse10/2019/en#/C45-C49 (accessed on 10 June 2020).
- GBD 2015 Mortality and Causes of Death Collaborators. Global, regional, and national life expectancy, all-cause mortality, and cause-specific mortality for 249 causes of death, 1980–2015: A systematic analysis for the Global Burden of Disease Study 2015, Lancet. 2016, 388, 1459–1544. [CrossRef] [Green Version]
- Driscoll, T.; Nelson, D.I.; Steenland, K.; Leigh, J.; Concha-Barrientos, M.; Fingerhut, M.; Prüss-Ustün, A. The global burden of non-malignant respiratory disease due to occupational airborne exposures. Am. J. Ind. Med. 2005, 48, 432–445. [Google Scholar] [CrossRef]
- WHO. International Program on Chemical Safety: Elimination of asbestos-related diseases. Available online: https://www.who.int/ipcs/assessment/public_health/Elimination_asbestos-related_diseases_EN.pdf?ua = 1 (accessed on 15 June 2020).
- Diandini, R.; Takahashi, K.; Park, E.K.; Jiang, Y.; Movahed, M.; Le, G.V.; Lee, L.J.; Delgermaa, V.; Kim, R. Potential years of life lost (PYLL) caused by asbestos-related diseases in the world. Am. J. Ind. Med. 2013, 56, 993–1000. [Google Scholar] [CrossRef]
- WHO. Mesothelioma. 2018. Available online: https://gco.iarc.fr/today/data/factsheets/cancers/18-Mesothelioma-fact-sheet.pdf (accessed on 16 June 2020).
- Chan, M.; Kazatchkine, M.; Lob-Levyt, J.; Obaid, T.; Schweizer, J.; Sidibe, M.; Veneman, A.; Yamada, T. Meeting the Demand for Results and Accountability: A Call for Action on Health Data from Eight Global Health Agencies. PLoS Med. 2010, 7, e1000223. [Google Scholar] [CrossRef] [Green Version]
- WHO. Monitoring the Building Blocks of Health Systems: A Handbook of Indicators and Their Measurement Strategies; WHO: Geneva, Switzerland, 2010. Available online: https://www.who.int/healthinfo/systems/WHO_MBHSS_2010_full_web.pdf?ua=1. (accessed on 12 June 2020).
- Herzog, T.N.; Scheuren, F.J.; Winkler, W.E. Data Quality and Record Linkage Techniques; Springer Science & Business Media: New York, NY, USA, 2007; pp. 1–224. [Google Scholar] [CrossRef]
- Takeshima, Y.; Inai, K.; Amatya, V.J.; Gemba, K.; Aoe, K.; Fujimoto, N.; Kato, K.; Kishimoto, T. Accuracy of pathological diagnosis of mesothelioma cases in Japan: Clinicopathological analysis of 382 cases. Lung Cancer 2009, 66, 191–197. [Google Scholar] [CrossRef] [PubMed]
- Chen, Z.; Gaudino, G.; Pass, H.I.; Carbone, M.; Yang, H. Diagnostic and prognostic biomarkers for malignant mesothelioma: An update. Transl. Lung Cancer Res. 2017, 6, 259–269. [Google Scholar] [CrossRef] [PubMed] [Green Version]
- Husain, A.N.; Colby, T.; Ordonez, N.; Krausz, T.; Attanoos, R.; Beasley, M.B.; Borczuk, A.C.; Butnor, K.; Cagle, P.T.; Chirieac, L.R.; et al. Guidelines for Pathologic Diagnosis of Malignant Mesothelioma: 2012 Update of the Consensus Statement from the International Mesothelioma Interest Group. Arch. Pathol. Lab. Med. 2013, 137, 647–667. [Google Scholar] [CrossRef] [PubMed]
- Lin, R.T.; Soeberg, M.J.; Chien, L.C.; Fisher, S.; Takala, J.; Lemen, R.; Driscoll, T.; Takahashi, K. Bibliometric analysis of gaps in research on asbestos-related diseases: Declining emphasis on public health over 26 years. BMJ Open. 2018, 8, e022806. [Google Scholar] [CrossRef] [PubMed]
- Chen, T.; Sun, X.M.; Wu, L. High Time for Complete Ban on Asbestos Use in Developing Countries. JAMA Oncol. 2019, 5, 779. [Google Scholar] [CrossRef]
- Järvholm, B.; Burdorf, A. Emerging evidence that the ban on asbestos use is reducing the occurrence of pleural mesothelioma in Sweden. Scand. J. Public Health 2015, 43, 875–881. [Google Scholar] [CrossRef] [Green Version]
- Nishikawa, K.; Takahashi, K.; Karjalainen, A.; Wen, C.P.; Furuya, S.; Hoshuyama, T.; Todoroki, M.; Kiyomoto, Y.; Wilson, D.; Higashi, T. Recent Mortality from Pleural Mesothelioma, Historical Patterns of Asbestos Use, and Adoption of Bans: A Global Assessment. Environ. Health Perspect. 2008, 116, 1675–1680. [Google Scholar] [CrossRef]
- Mao, W.; Zhang, X.; Guo, Z.; Gao, Z.; Pass, H.I.; Yang, H.; Carbone, M. Association of Asbestos Exposure With Malignant Mesothelioma Incidence in Eastern China. JAMA Oncol. 2017, 3, 562. [Google Scholar] [CrossRef] [Green Version]
- Luo, S. Asbestos related diseases from environmental exposure to crocidolite in Da-yao, China. I. Review of exposure and epidemiological data * COMMENTARY. Occup. Environ. Med. 2003, 60, 35–42. [Google Scholar] [CrossRef] [Green Version]
- Zhou, M.; Wang, H.; Zhu, J.; Chen, W.; Wang, L.; Liu, S.; Li, Y.; Wang, L.; Liu, Y.; Yin, P. Cause-specific mortality for 240 causes in China during 1990–2013: A systematic subnational analysis for the Global Burden of Disease Study 2013. Lancet 2016, 387, 251–272. [Google Scholar] [CrossRef]
- Ministry of Health of Russian Federation. Cancers in Russia 2018 (Incidence and mortality). Moscow. 2018. Available online: https://oncology-association.ru/files/medstat/2018.pdf. (accessed on 12 June 2020).
- Lazarev, A.F.; Grigoruk, O.G.; Bazulina, L.M.; Muzalevskiy, P.N.; Kravtsov, V.Y. Pleural mesothelioma: Etiology, incidence, diagnosis, treatment and survival. Russ. Oncol. J. 2013, 5, 15–20. [Google Scholar]
- Yablonskii, P.K.; Petrov, A.S. Pleural mesothelioma. Pract. Oncol. 2006, T7, 179–188. [Google Scholar]
- Burki, T. Health experts concerned over India’s asbestos industry. Lancet 2010, 375, 626–627. [Google Scholar] [CrossRef]


| Data Sources | Mesothelioma Deaths | Implications for Future Projections |
|---|---|---|
| Journal Articles | ||
| Driscoll (2005) [25] | 43,000 annual deaths in the world | Not applicable |
| Delgermaa (2011) [4] | 92,253 reported deaths in 83 WHO member states (during 1994–2008) | “Since asbestos use has recently increased in developing countries, a corresponding shift in disease occurrence is anticipated in developing countries” |
| Park (2011) [22] | 38,900 estimated deaths in 33 countries (during 1994–2008) | “Particularly since 1970 onward, these countries should anticipate the need to deal with a very high burden of mesothelioma in the immediate decades ahead” |
| Diandini (2013) [27] | 11,884 reported annual deaths in 82 countries (1994–2010) | Not applicable |
| Odgerel (2017) [13] | 38,400 annual deaths (sum of estimated and reported) in the world (during 2008 and 2014) | “The estimation of the global mesothelioma burden will naturally improve as more countries report quality data and fewer countries require estimates to be made” |
| Global Burden of Disease (GBD) estimation | ||
| GBD (1990) [24] | 18,213 estimated annual deaths in the world | Not applicable |
| GBD (1995) [24] | 19,318 estimated annual deaths in the world | Not applicable |
| GBD (2000) [24] | 21,367 estimated annual deaths in the world | Not applicable |
| GBD (2005) [24] | 23,193 estimated annual deaths in the world | Not applicable |
| GBD (2010) [24] | 27,849 estimated annual deaths in the world | Not applicable |
| GBD (2015) [24] | 32,372 estimated annual deaths in the world | Not applicable |
| GBD (2017) [12] | 29,908 estimated annual deaths in the world | Not applicable |
| Global Databases | ||
| WHO MDB (2019) [15] | 13,993 deaths in 104 WHO member states | Not applicable |
| WHO Globocan (2018) [26] | 25,576 deaths in 130 UN Member States | Not applicable |
| Countries Grouped by National Income Category 1 | Reporting 2,3 | Nonreporting 2 | Total | |||
|---|---|---|---|---|---|---|
| High income (HI) | 54 | (52%) | 26 | (23%) | 80 | (37%) |
| [68%] | [32%] | [100%] | ||||
| Upper middle income (UMI) | 39 | (38%) | 21 | (18%) | 60 | (28%) |
| [65%] | [35%] | [100%] | ||||
| Low middle income (LMI) 4 | 11 | (10%) | 67 | (59%) | 78 | (35%) |
| [14%] | [86%] | [100%] | ||||
| Total | 104 | (100%) | 114 | (100%) | 218 | (100%) |
| [48%] | [52%] | [100%] | ||||
| Source | HI | UMI | LMI | Total | ||||
|---|---|---|---|---|---|---|---|---|
| GBD (2017) [12] | 17,460 | (58%) | 7358 | (25%) | 5090 | (17%) | 29,908 | (100%) |
| Odgerel (2017) [18] | 14,251 | (37%) | 15,603 | (41%) | 8534 | (22%) | 38,388 | (100%) |
| [100%] | [100%] | [100%] | [100%] | |||||
| Reported to the WHO | 13,920 | (92%) | 1252 | (8%) | 4 | (0%) | 15,176 | (100%) |
| [98%] | [8%] | [0.1%] | [40%] | |||||
| Estimated | 331 | (1%) | 14,351 | (62%) | 8530 | (37%) | 23,212 | (100%) |
| [2%] | [92%] | [99.9%] | [60%] | |||||
© 2020 by the authors. Licensee MDPI, Basel, Switzerland. This article is an open access article distributed under the terms and conditions of the Creative Commons Attribution (CC BY) license (http://creativecommons.org/licenses/by/4.0/).
Share and Cite
Chimed-Ochir, O.; Arachi, D.; Driscoll, T.; Lin, R.-T.; Takala, J.; Takahashi, K. Burden of Mesothelioma Deaths by National Income Category: Current Status and Future Implications. Int. J. Environ. Res. Public Health 2020, 17, 6900. https://0-doi-org.brum.beds.ac.uk/10.3390/ijerph17186900
Chimed-Ochir O, Arachi D, Driscoll T, Lin R-T, Takala J, Takahashi K. Burden of Mesothelioma Deaths by National Income Category: Current Status and Future Implications. International Journal of Environmental Research and Public Health. 2020; 17(18):6900. https://0-doi-org.brum.beds.ac.uk/10.3390/ijerph17186900
Chicago/Turabian StyleChimed-Ochir, Odgerel, Diana Arachi, Tim Driscoll, Ro-Ting Lin, Jukka Takala, and Ken Takahashi. 2020. "Burden of Mesothelioma Deaths by National Income Category: Current Status and Future Implications" International Journal of Environmental Research and Public Health 17, no. 18: 6900. https://0-doi-org.brum.beds.ac.uk/10.3390/ijerph17186900