Hypoxic Pilates Intervention for Obesity: A Randomized Controlled Trial


Abstract
:1. Introduction
2. Materials and Methods
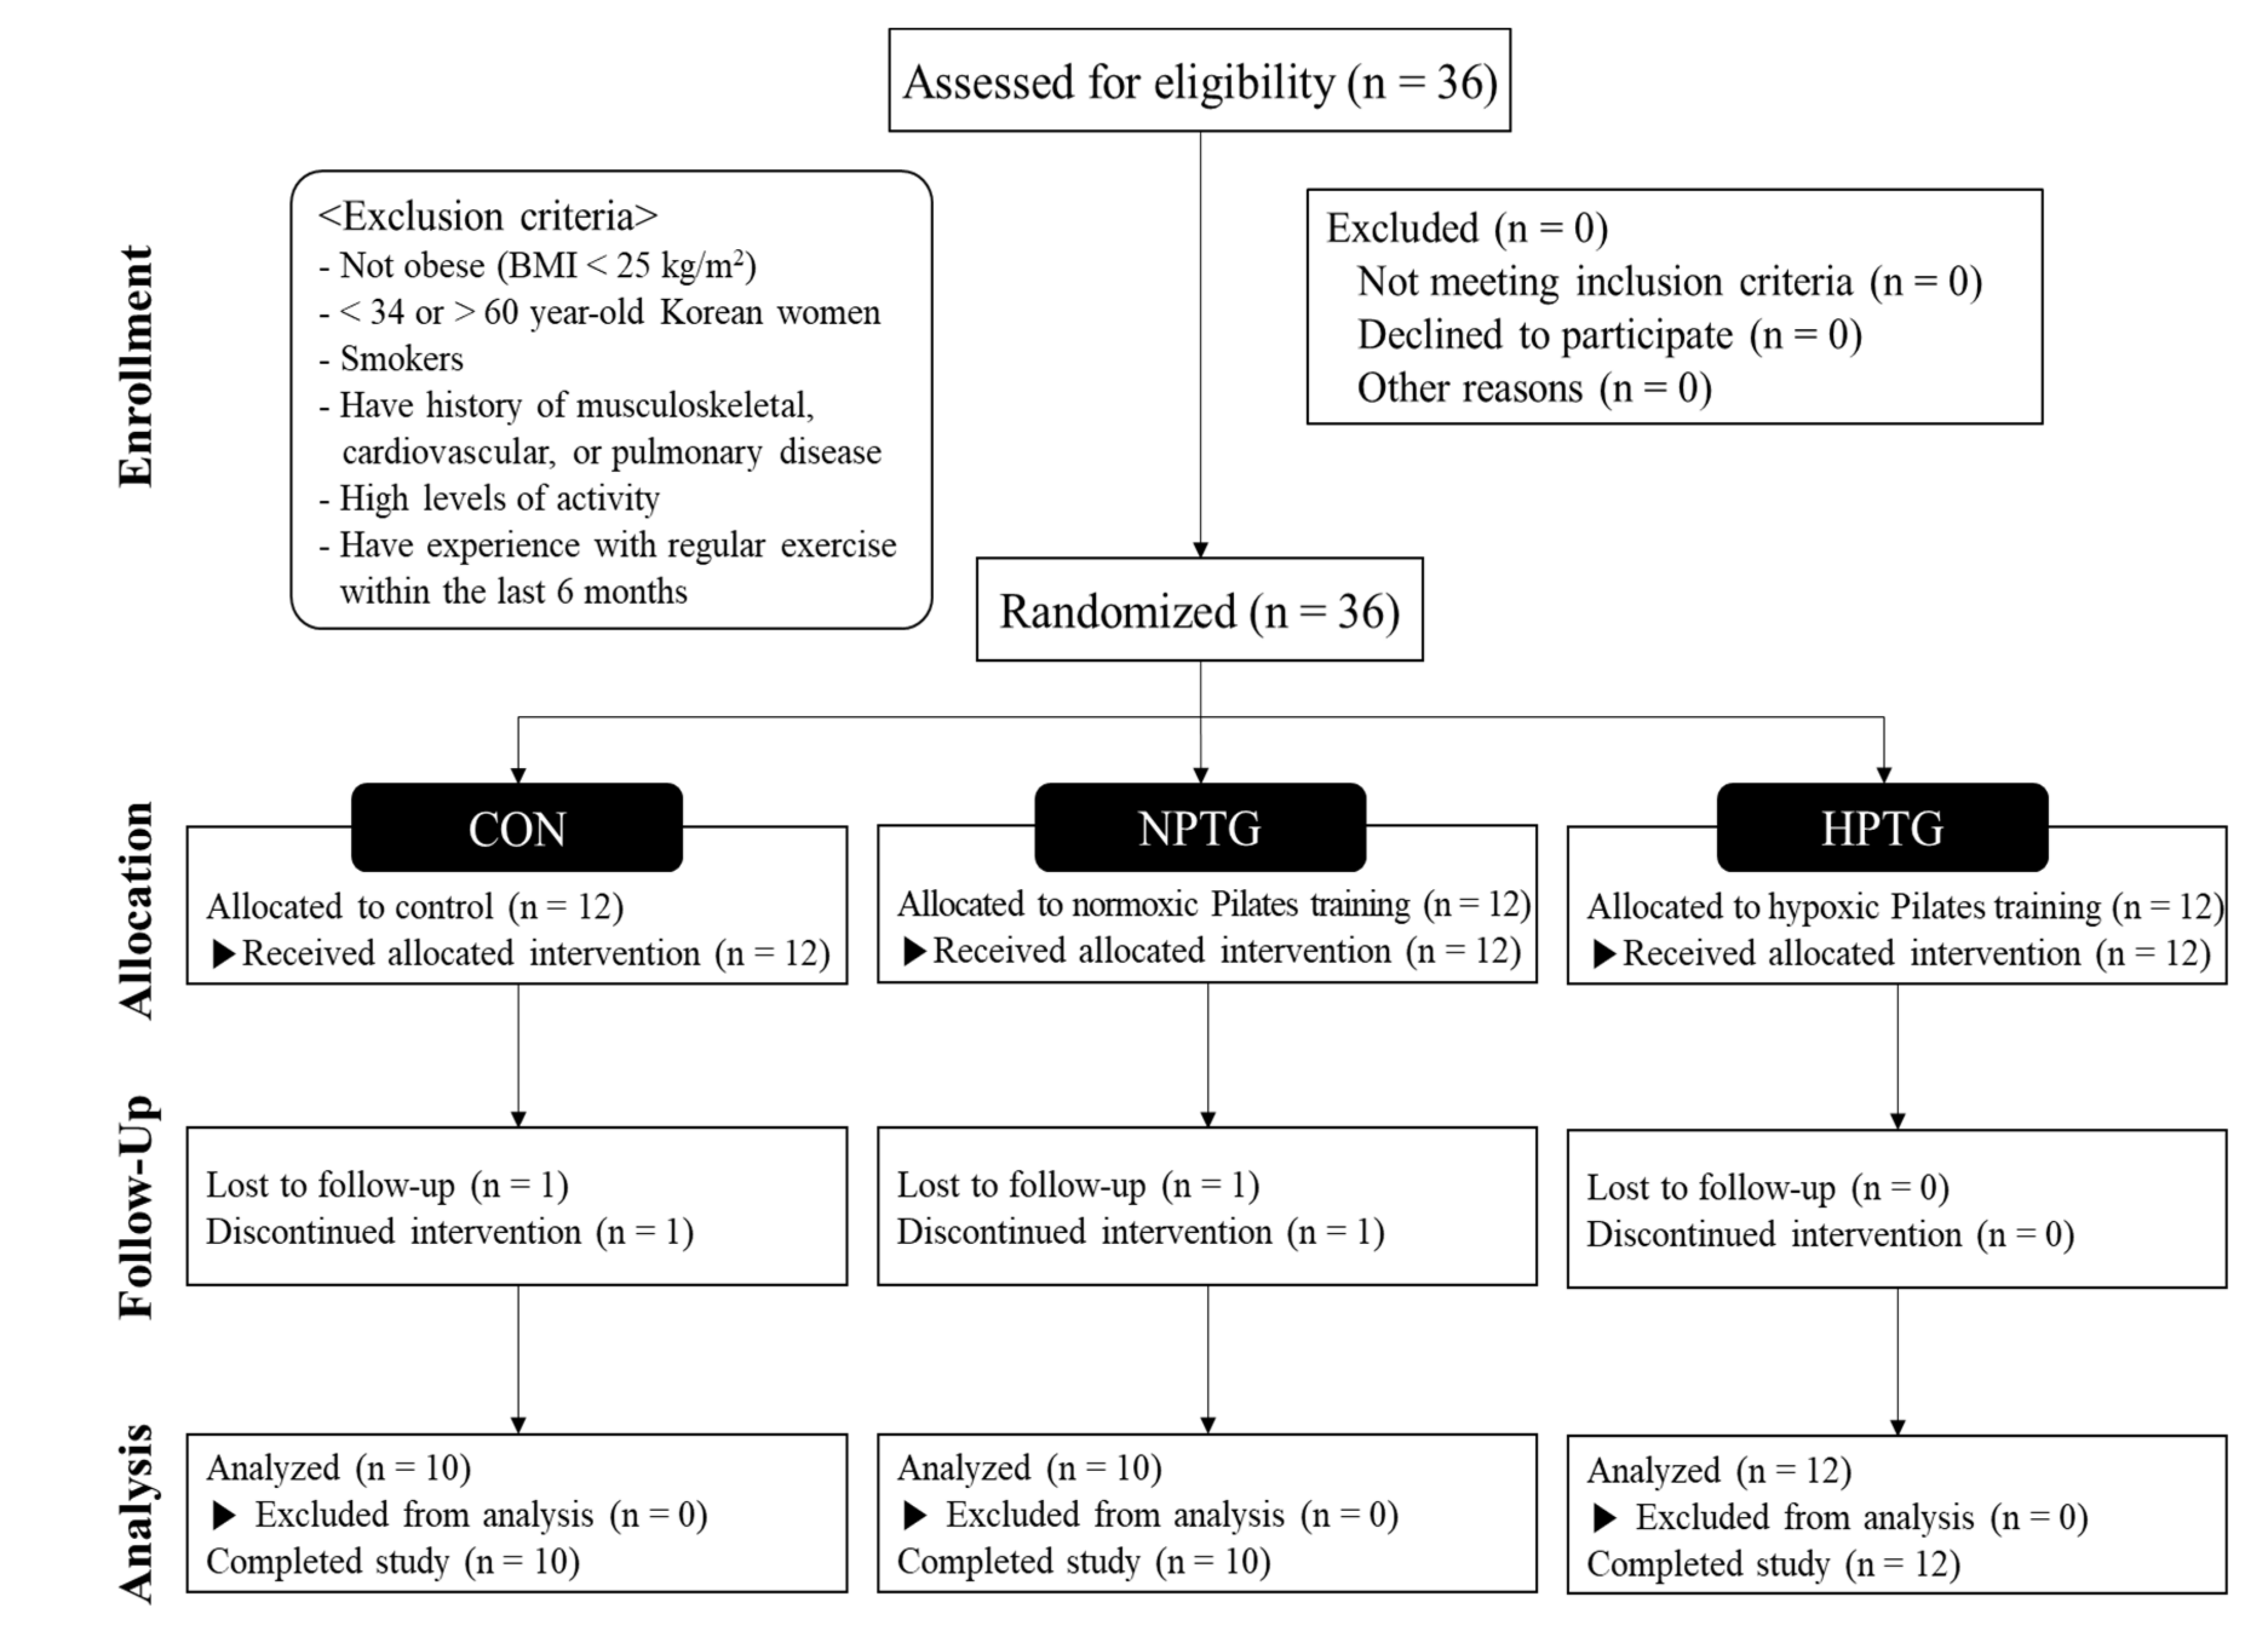
2.1. Subjects
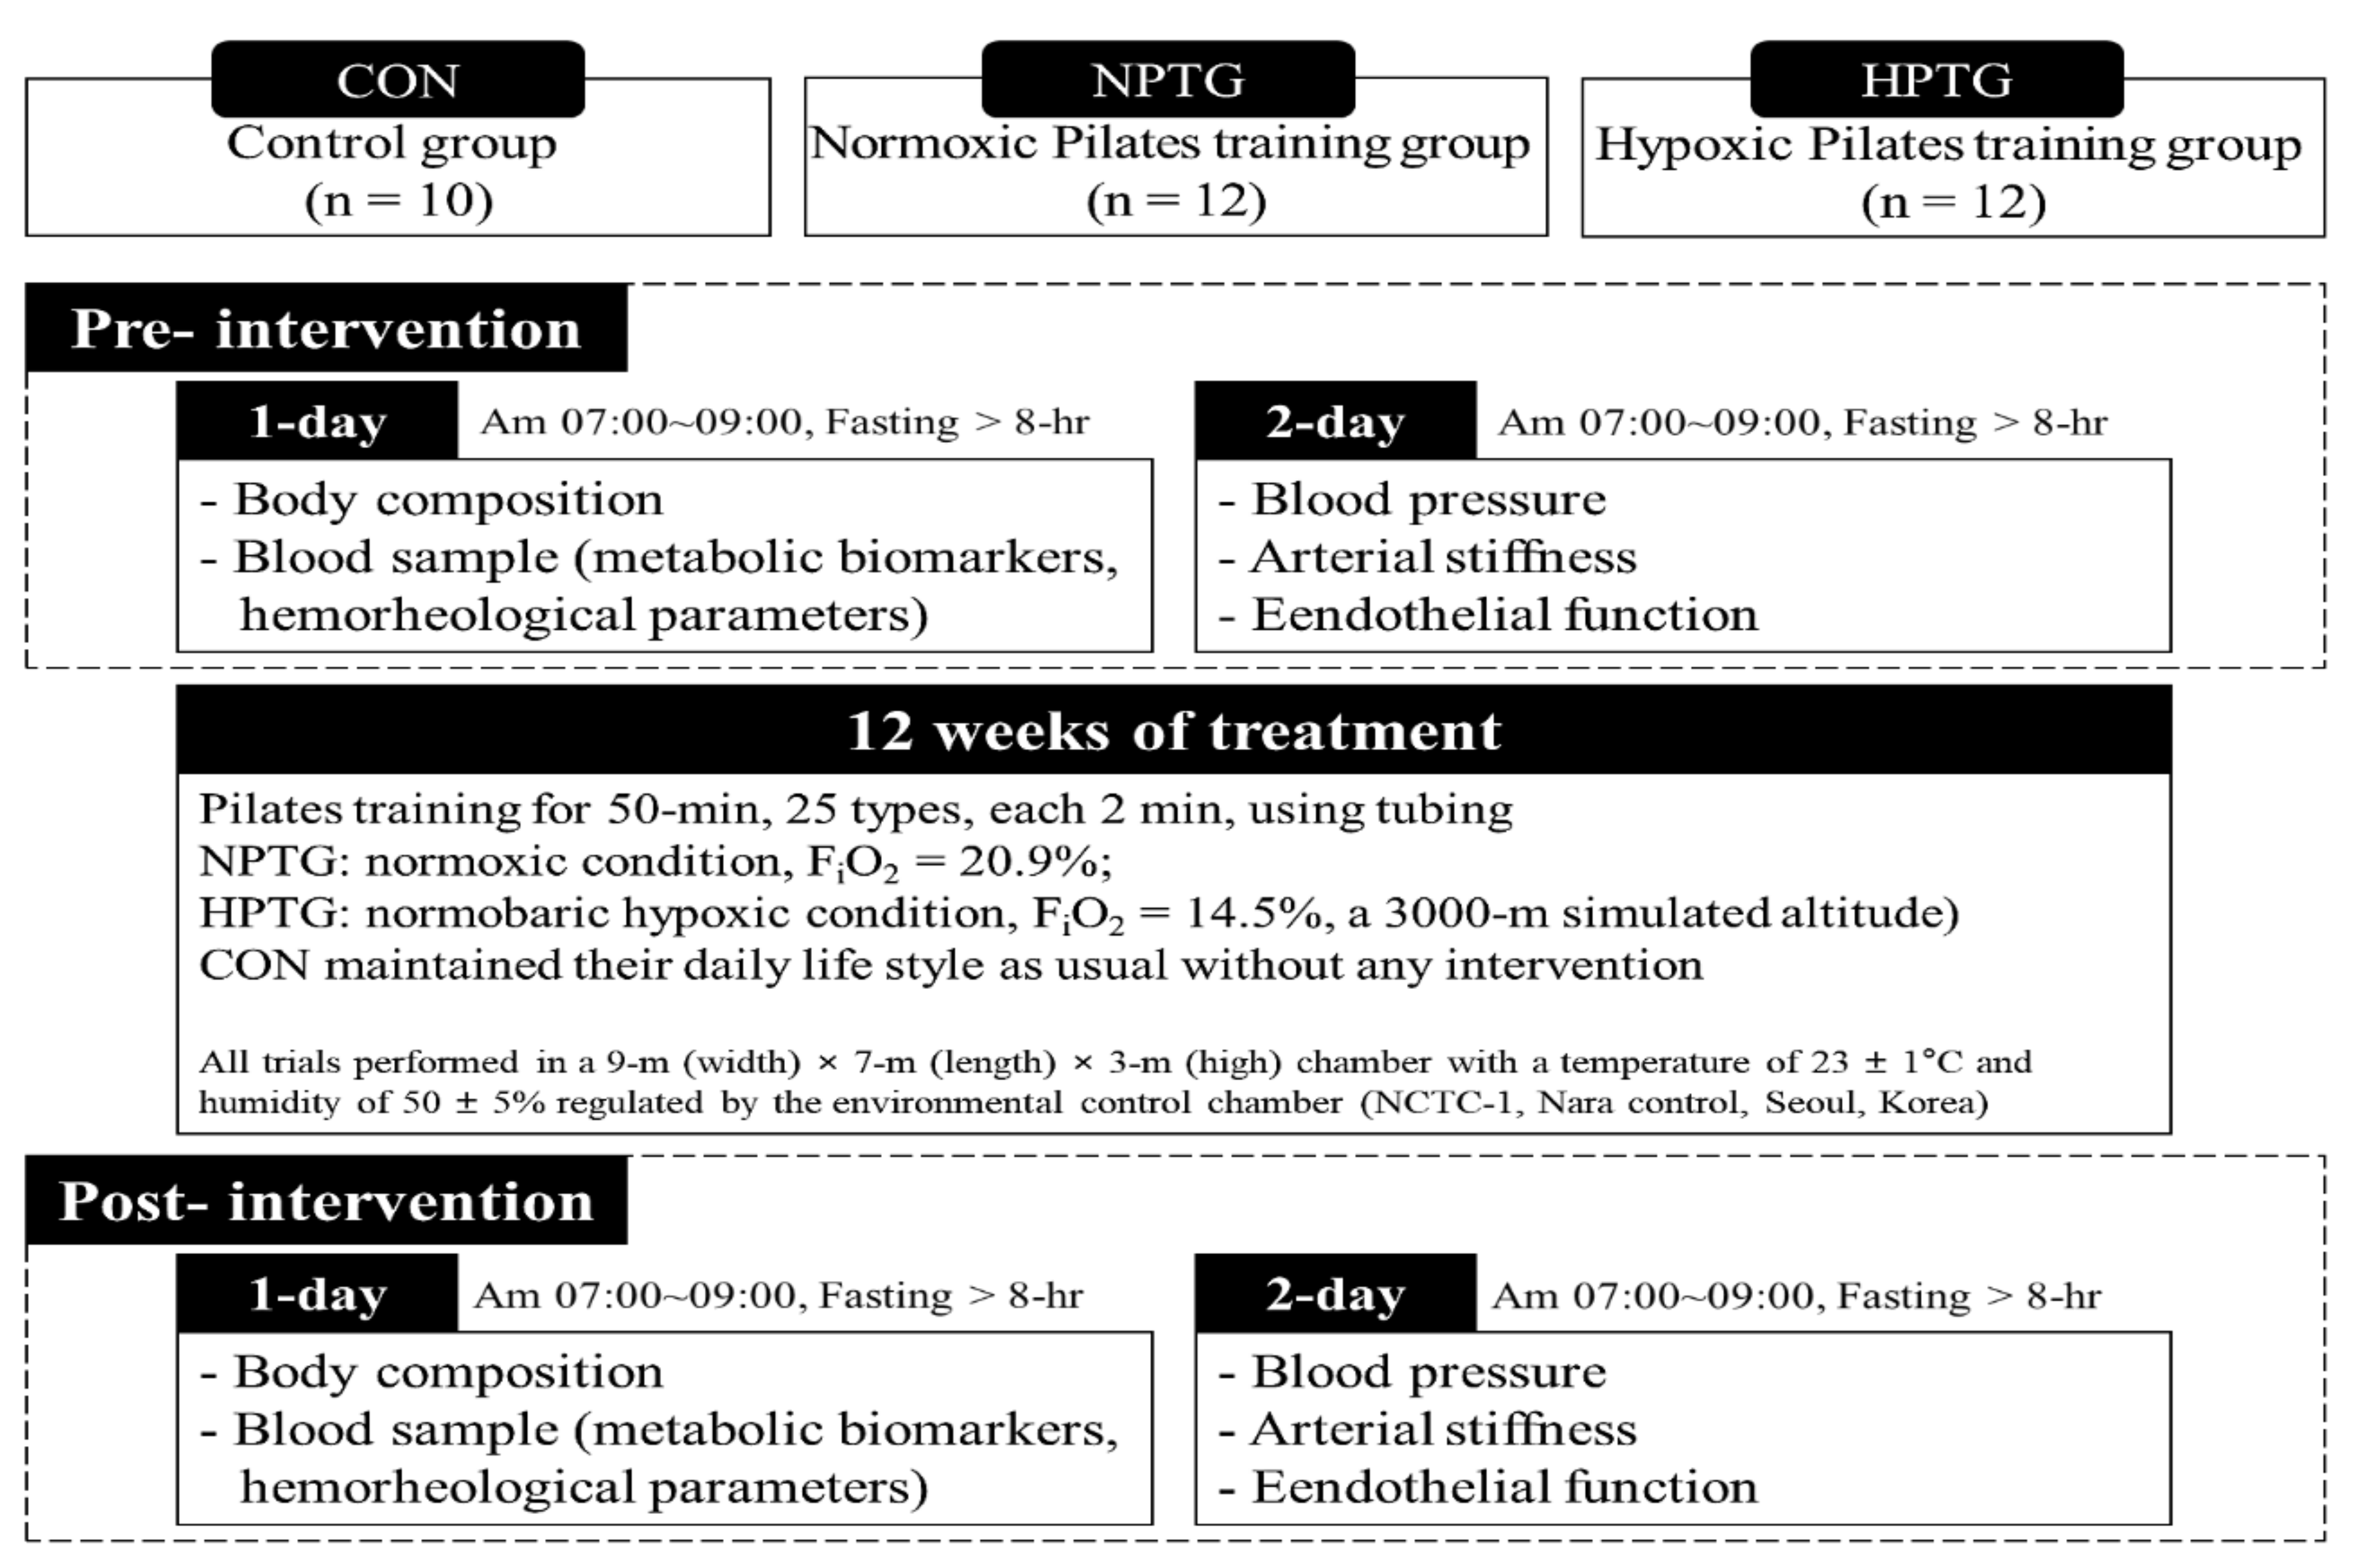
2.2. Study Design
2.3. Body Composition
2.4. Blood Pressure
2.5. Arterial Stiffness
2.6. Vascular Endothelial Function
2.7. Cardiometabolic Biomarkers
2.8. Hemorheological Function
2.9. Aerobic Performance
2.10. Statistical Analysis
3. Results
3.1. Pre- and Post-Intervention Data for Body Composition Measures with the Main Analysis of Covariance Results
3.2. Pre- and Post-Intervention Data for Blood Pressure and Brachial-Ankle Pulse Wave Velocity Measures with the Main Analysis of Covariance Results
3.3. Pre- and Post-Intervention Data for Cardiometabolic Biomarker Measures with the Main Analysis of Covariance Results
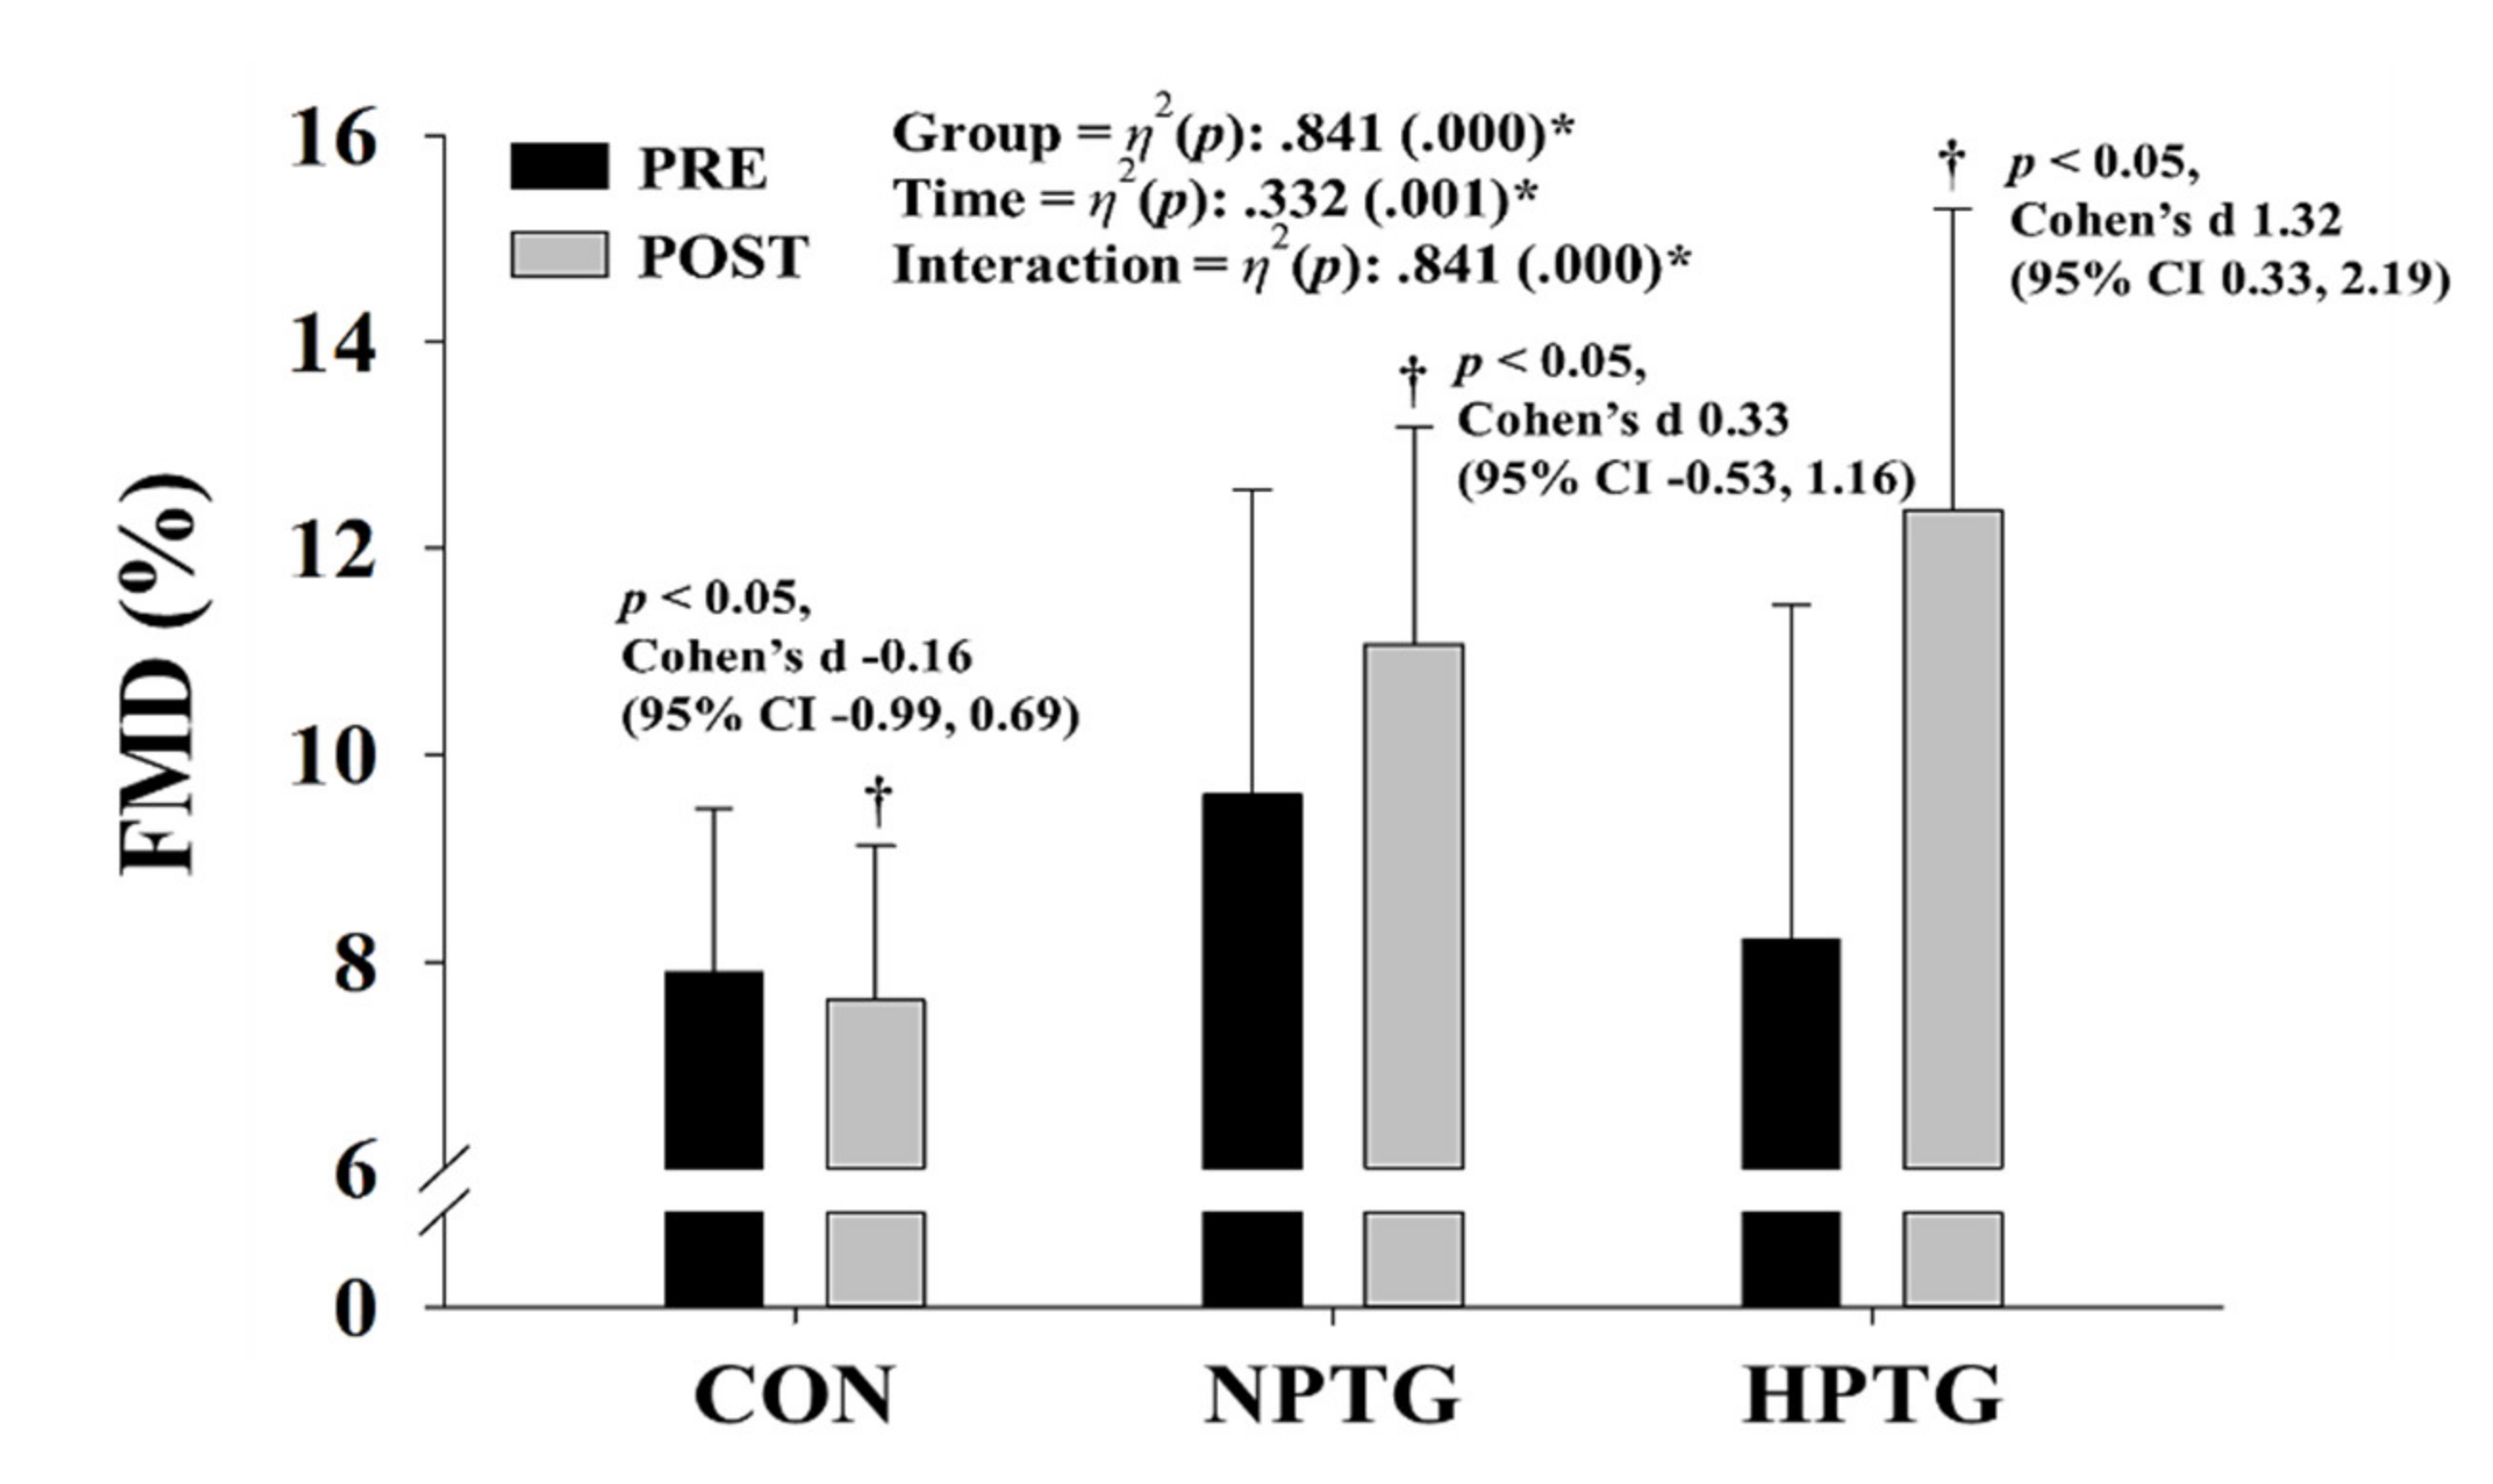
3.4. Pre- and Post-Intervention Measures of the Endothelial Function Parameters with the Main Analysis of Covariance Results
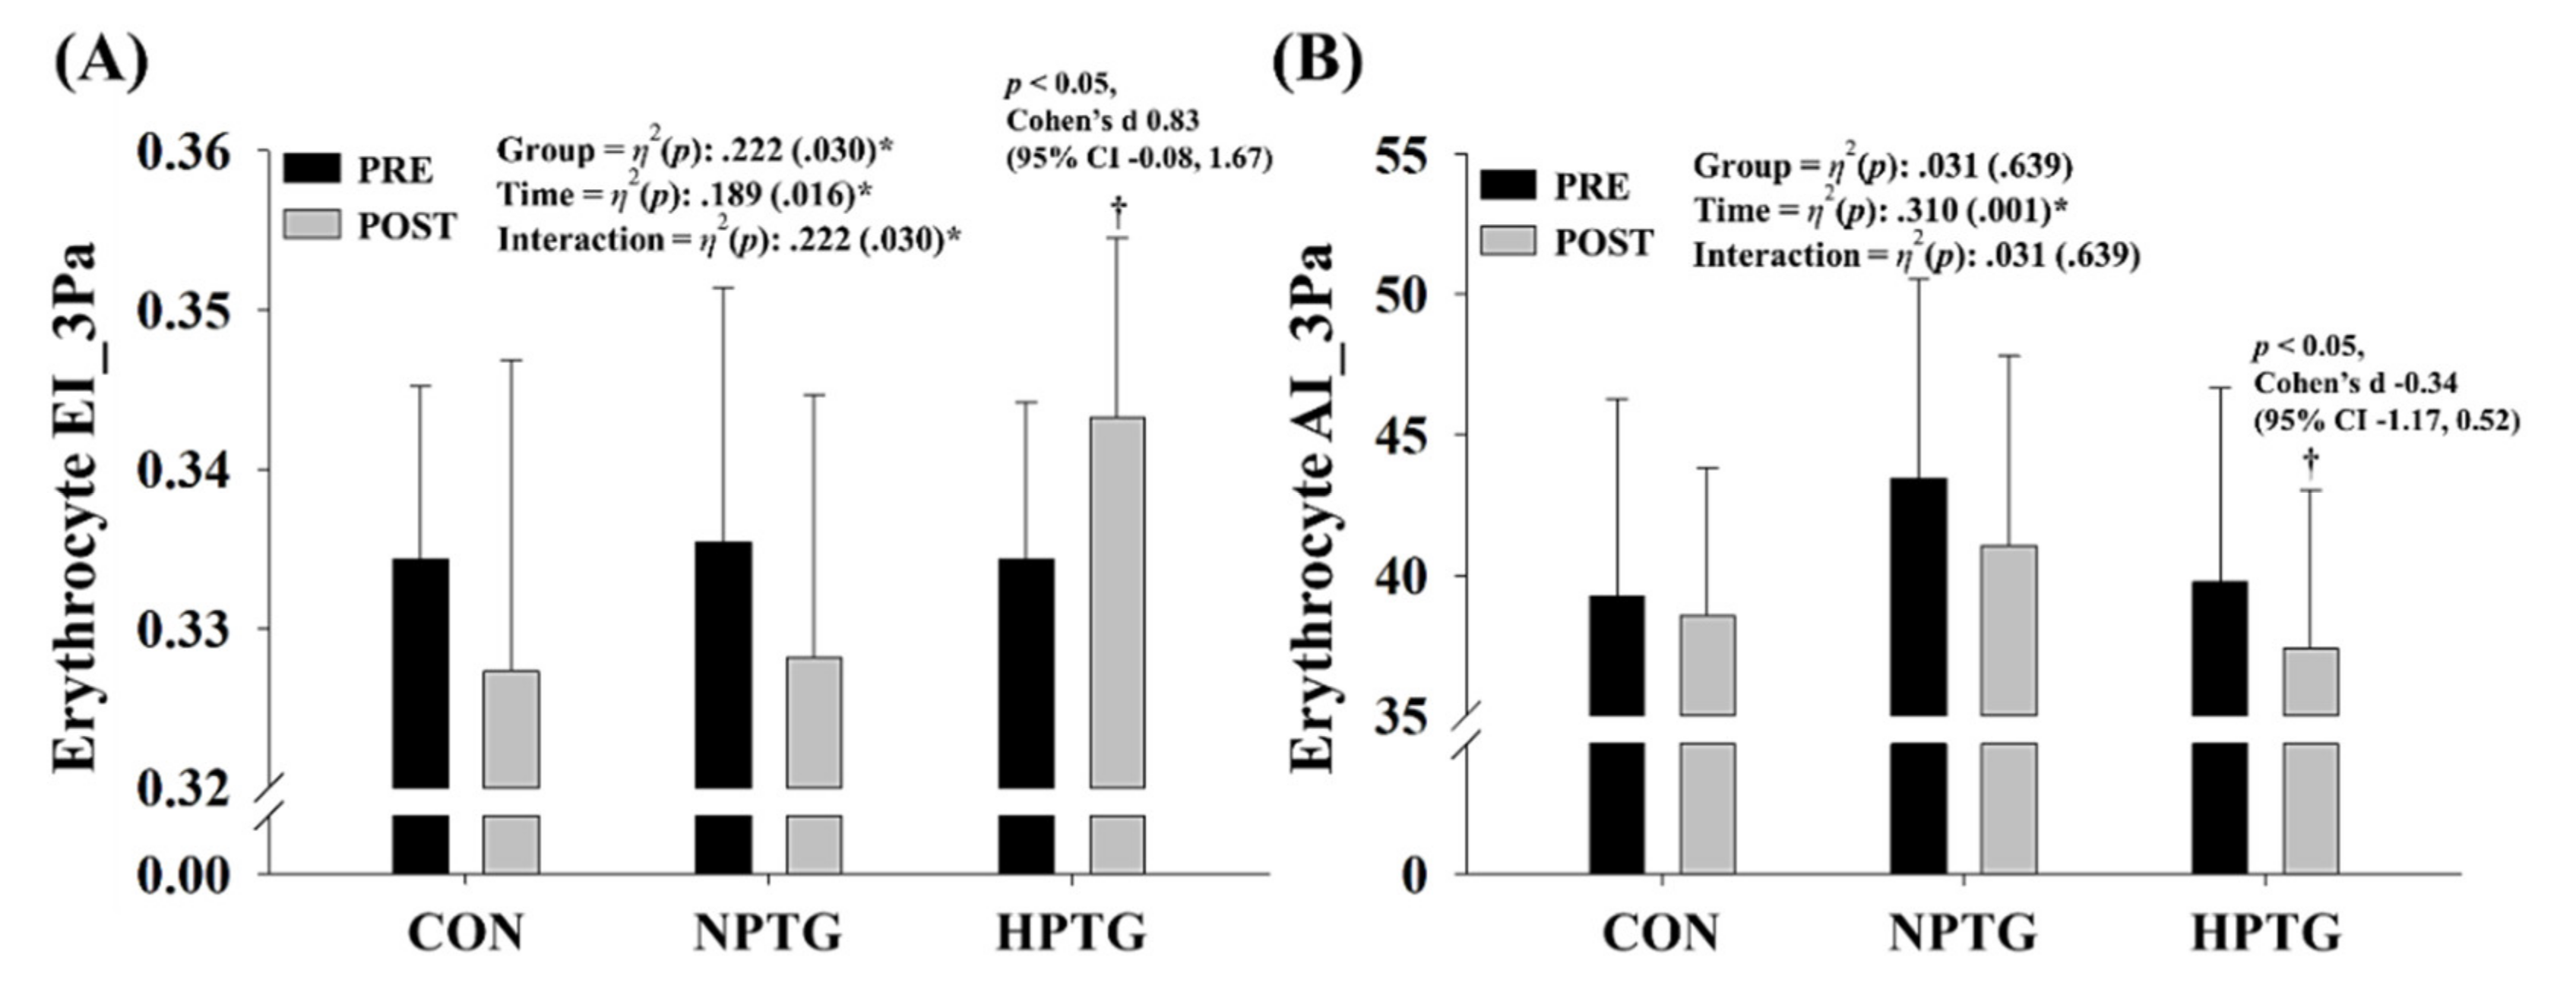
3.5. Pre- and Post-Intervention Measures of the Hemorheological Function Parameters with the Main Analysis of Covariance Results
3.6. Pre- and Post-Intervention Data for Aerobic Performance Measures with the Main Analysis of Covariance Results
4. Discussion
5. Limitation
6. Conclusions
Author Contributions
Funding
Acknowledgments
Conflicts of Interest
References
- Park, H.Y.; Jung, W.S.; Kim, J.; Lim, K. Twelve weeks of exercise modality in hypoxia enhances health-related function in obese older Korean men: A randomized controlled trial. Geriatr. Gerontol. Int. 2019, 19, 311–316. [Google Scholar] [CrossRef] [PubMed]
- World Health Organization. Available online: https://www.who.int/news-room/fact-sheets/detail/obesity-and-overweight (accessed on 1 April 2020).
- Chung, N.; Park, H.-Y.; Park, M.-Y.; Hwang, Y.-Y.; Lee, C.-H.; Han, J.-S.; So, J.; Kim, J.; Park, J.; Lim, K. Association of daily physical activity level with health-related factors by gender and age-specific differences among Korean adults based on the sixth (2014–2015) Korea national health and nutrition examination survey. J. Exerc. Nutr. Biochem. 2017, 21, 30–38. [Google Scholar] [CrossRef] [PubMed]
- Chin, S.; Kahathuduwa, C.; Binks, M. Physical activity and obesity: What we know and what we need to know. Obes. Rev. 2016, 17, 1226–1244. [Google Scholar] [CrossRef] [PubMed]
- Park, H.-Y.; Jung, W.-S.; Kim, J.; Hwang, H.; Lim, K. Changes in the paradigm of traditional exercise in obesity therapy and application of a new exercise modality: A narrative review article. Iran. J. Public Health 2019, 48, 1395–1404. [Google Scholar]
- Girard, O.; Malatesta, D.; Millet, G.P. Walking in hypoxia: An efficient treatment to lessen mechanical constraints and improve health in obese individuals? Front. Physiol. 2017, 8, 73. [Google Scholar] [CrossRef] [PubMed] [Green Version]
- Hwang, Y.; Park, J.; Lim, K. Effects of pilates exercise on salivary secretory immunoglobulin a levels in older women. J. Aging Phys. Act. 2016, 24, 399–406. [Google Scholar] [CrossRef]
- Jago, R.; Jonker, M.L.; Missaghian, M.; Baranowski, T. Effect of 4 weeks of Pilates on the body composition of young girls. Prev. Med. 2006, 42, 177–180. [Google Scholar] [CrossRef]
- Ruiz-Montero, P.J.; Castillo-Rodriguez, A.; Mikalački, M.; Nebojsa, Č.; Korovljev, D. 24-weeks Pilates-aerobic and educative training to improve body fat mass in elderly Serbian women. Clin. Interv. Aging 2014, 9, 243–248. [Google Scholar] [CrossRef] [Green Version]
- Jung, K.; Seo, J.; Jung, W.-S.; Kim, J.; Park, H.-Y.; Lim, K. Effects of an acute Pilates program under hypoxic conditions on vascular endothelial function in Pilates participants: A randomized crossover trial. Int. J. Environ. Res. Public Health 2020, 17, 2584. [Google Scholar] [CrossRef] [Green Version]
- Patterson, R.M.; Stegink Jansen, C.W.; Hogan, H.A.; Nassif, M.D. Material properties of thera-band tubing. Phys. Ther. 2001, 81, 1437–1445. [Google Scholar] [CrossRef]
- Cruz-Ferreira, A.; Fernandes, J.; Laranjo, L.; Bernardo, L.M.; Silva, A. A systematic review of the effects of pilates method of exercise in healthy people. Arch. Phys. Med. Rehabil. 2011, 92, 2071–2081. [Google Scholar] [CrossRef] [PubMed]
- Millet, G.P.; Debevec, T.; Brocherie, F.; Malatesta, D.; Girard, O. Therapeutic use of exercising in hypoxia: Promises and limitations. Front. Physiol. 2016, 7, 224. [Google Scholar] [CrossRef] [PubMed] [Green Version]
- Moon, H.-W.; Shin, S.-H.; Lee, C.-H.; Park, H.-Y.; Sunoo, S.; Nam, S.-S. Effects of various acute hypoxic conditions on the hemorheological response during exercise and recovery 1. Clin. Hemorheol Microcirc. 2016, 63, 451–460. [Google Scholar] [CrossRef] [PubMed]
- Kong, Z.; Zang, Y.; Hu, Y. Normobaric hypoxia training causes more weight loss than normoxia training after a 4-week residential camp for obese young adults. Sleep Breath. 2014, 18, 591–597. [Google Scholar] [CrossRef]
- Park, H.-Y.; Jung, W.-S.; Kim, J.; Hwang, H.; Kim, S.-W.; An, Y.; Lee, H.; Jeon, S.; Lim, K. Effects of 2-week exercise training in hypobaric hypoxic conditions on exercise performance and immune function in Korean national cycling athletes with disabilities: A case report. Int. J. Environ. Res. Public Health 2020, 17, 861. [Google Scholar] [CrossRef] [PubMed] [Green Version]
- Jung, W.-S.; Kim, S.-W.; Park, H.-Y. Interval hypoxic training enhances athletic performance and does not adversely affect immune function in middle-and long-distance runners. Int. J. Environ. Res. Public Health 2020, 17, 1934. [Google Scholar] [CrossRef] [PubMed] [Green Version]
- Kim, S.-W.; Jung, S.-W.; Seo, M.-W.; Park, H.-Y.; Song, J.-K. Effects of bone-specific physical activity on body composition, bone mineral density, and health-related physical fitness in middle-aged women. J. Exerc. Nutr. Biochem. 2019, 23, 36–42. [Google Scholar] [CrossRef]
- Uyuklu, M.; Cengiz, M.; Ulker, P.; Hever, T.; Tripette, J.; Connes, P.; Nemeth, N.; Meiselman, H.J.; Baskurt, O.K. Effects of storage duration and temperature of human blood on red cell deformability and aggregation. Clin. Hemorheol. Microcirc. 2009, 41, 269–278. [Google Scholar] [CrossRef]
- Kim, S.-W.; Jung, W.-S.; Park, W.; Park, H.-Y. Twelve weeks of combined resistance and aerobic exercise improves cardiometabolic biomarkers and enhances red blood cell hemorheological function in obese older men: A randomized controlled trial. Int. J. Environ. Res. Public Health 2019, 16, 5020. [Google Scholar] [CrossRef] [Green Version]
- Baskurt, O.K.; Meiselman, H.J. Analyzing shear stress–elongation index curves: Comparison of two approaches to simplify data presentation. Clin. Hemorheol. Microcirc. 2004, 31, 23–30. [Google Scholar]
- Miyashita, M.; Mutoh, Y.; Yoshika, Y.; Sadamoto, T. Effects of physical training. Med. Sci. Sports. 1985, 10, 3–5. [Google Scholar]
- Millet, G.P.; Faiss, R.; Brocherie, F.; Girard, O. Hypoxic training and team sports: A challenge to traditional methods? Br. J. Sports Med. 2013, 47, 6–7. [Google Scholar] [CrossRef] [PubMed] [Green Version]
- Park, H.-Y.; Lim, K. Effects of hypoxic training versus normoxic training on exercise performance in competitive swimmers. J. Sports Sci. Med. 2017, 16, 480–488. [Google Scholar] [PubMed]
- Park, H.-Y.; Shin, C.; Lim, K. Intermittent hypoxic training for 6 weeks in 3000 m hypobaric hypoxia conditions enhances exercise economy and aerobic exercise performance in moderately trained swimmers. Biol. Sport 2018, 35, 49–56. [Google Scholar] [CrossRef] [PubMed]
- Park, H.-Y.; Park, W.; Lim, K. Living high-training low for 21 days enhances exercise economy, hemodynamic function, and exercise performance of competitive runners. J. Sports Sci. Med. 2019, 18, 427–437. [Google Scholar]
- Urdampilleta, A.; González-Muniesa, P.; Portillo, M.P.; Martínez, J.A. Usefulness of combining intermittent hypoxia and physical exercise in the treatment of obesity. J. Physiol. Biochem. 2012, 68, 289–304. [Google Scholar] [CrossRef] [PubMed] [Green Version]
- Hamad, N.; Travis, S.P. Weight loss at high altitude: Pathophysiology and practical implications. Eur. J. Gastroenterol. Hepatol. 2006, 18, 5–10. [Google Scholar] [CrossRef]
- Vogt, M.; Puntschart, A.; Geiser, J.; Zuleger, C.; Billeter, R.; Hoppeler, H. Molecular adaptations in human skeletal muscle to endurance training under simulated hypoxic conditions. J. Appl. Physiol. 2001, 91, 173–182. [Google Scholar] [CrossRef]
- Kayser, B.; Verges, S. Hypoxia, energy balance and obesity: From pathophysiological mechanisms to new treatment strategies. Obes. Rev. 2013, 14, 579–592. [Google Scholar] [CrossRef]
- Hwang, H.; Mizuno, S.; Kasai, N.; Kojima, C.; Sumi, D.; Hayashi, N.; Goto, K. Muscle oxygenation, endocrine and metabolic regulation during low-intensity endurance exercise with blood flow restriction. Phys. Act. Nutr. 2020, 24, 30–37. [Google Scholar] [CrossRef]
- Wiesner, S.; Haufe, S.; Engeli, S.; Mutschler, H.; Haas, U.; Luft, F.C.; Jordan, J. Influences of normobaric hypoxia training on physical fitness and metabolic risk markers in overweight to obese subjects. Obesity 2010, 18, 116–120. [Google Scholar] [CrossRef] [PubMed]
- Kelly, L.P.; Basset, F.A. Acute normobaric hypoxia increases post-exercise lipid oxidation in healthy males. Front. Physiol. 2017, 8, 293. [Google Scholar] [CrossRef] [PubMed] [Green Version]
- Verges, S.; Chacaroun, S.; Godin-Ribuot, D.; Baillieul, S. Hypoxic conditioning as a new therapeutic modality. Front. Pediatr. 2015, 3, 58. [Google Scholar] [CrossRef] [PubMed] [Green Version]
- Park, Y.; Jang, I.; Park, H.-Y.; Kim, J.; Lim, K. Hypoxic exposure can improve blood glycemic control in high-fat diet-induced obese mice. J. Exerc. Nutr. Biochem. 2020, 24, 19–23. [Google Scholar] [CrossRef] [PubMed]
- Haufe, S.; Wiesner, S.; Engeli, S.; Luft, F.C.; Jordan, J. Influences of normobaric hypoxia training on metabolic risk markers in human subjects. Med. Sci. Sports Exerc. 2008, 40, 1939–1944. [Google Scholar] [CrossRef]
- Serebrovska, T.; Serebrovska, Z.; Egorov, E. Fitness and therapeutic potential of intermittent hypoxia training: A matter of dose. Fiziol. Zh. 2016, 62, 78–91. [Google Scholar] [CrossRef] [PubMed]
- Muangritdech, N.; Hamlin, M.J.; Sawanyawisuth, K.; Prajumwongs, P.; Saengjan, W.; Wonnabussapawich, P.; Manimmanakorn, N.; Manimmanakorn, A. Hypoxic training improves blood pressure, nitric oxide and hypoxia-inducible factor-1 alpha in hypertensive patients. Eur. J. Appl. Physiol. 2020, 120, 1–12. [Google Scholar] [CrossRef]
- Nishiwaki, M.; Kawakami, R.; Saito, K.; Tamaki, H.; Takekura, H.; Ogita, F. Vascular adaptations to hypobaric hypoxic training in postmenopausal women. J. Physiol. Sci. 2011, 61, 83–91. [Google Scholar] [CrossRef]
- Park, H.-Y.; Jung, W.-S.; Kim, J.; Hwang, H.; Lim, K. Twelve weeks of aerobic exercise at the lactate threshold improves autonomic nervous system function, body composition, and aerobic performance in women with obesity. J. Obes. Metab. Syndr. 2020, 29, 67–75. [Google Scholar] [CrossRef] [Green Version]


| Variables | Groups | F-Value | η2(p) Value | ||
|---|---|---|---|---|---|
| CON (n = 10) | NPTG (n = 10) | HPTG (n = 12) | |||
| Age (years) | 51.6 ± 6.5 | 43.8 ± 8.6 | 47.2 ± 6.4 | 2.962 | 0.170 (0.068) |
| Height (cm) | 155.7 ± 4.8 a | 162.1 ± 5.6 b | 158.5 ± 5.4 ab | 3.625 | 0.200 (0.039) * |
| Weight (kg) | 60.5 ± 6.8 | 65.8 ± 11.0 | 67.9 ± 11.0 | 1.513 | 0.094 (0.237) |
| BMI (kg/m2) | 25.2 ± 2.0 | 25.1 ± 3.3 | 27.1 ± 4.3 | 1.266 | 0.080 (0.297) |
| FFM (kg) | 38.9 ± 4.5 | 43.2 ± 5.5 | 41.3 ± 3.9 | 0.791 | 0.052 (0.463) |
| Percent body fat (%) | 37.0 ± 4.4 | 37.8 ± 5.0 | 40.2 ± 6.4 | 1.051 | 0.068 (0.363) |
| Variables | Groups | Pre-Test | Post-Test | Cohen′s d (95% CI) | η2 (p) Value | |
|---|---|---|---|---|---|---|
| Weight (kg) | CON | 61.1 ± 6.8 | 61.0 ± 7.1 | −0.01 (−0.85, 0.83) | Group | 0.031 (0.643) |
| NPTG | 66.3 ± 11.0 | 65.8 ± 11.5 | −0.04 (−0.87, 0.81) | Time | 0.154 (0.032) * | |
| HPTG | 68.0 ± 10.1 | 68.0 ± 11.4 | −0.00 (−0.84, 0.84) | Interaction | 0.031 (0.643) | |
| BMI (kg/m2) | CON | 25.2 ± 2.0 | 25.1 ± 2.0 | −0.03 (−0.87, 0.81) | Group | 0.007 (0.902) |
| NPTG | 25.1 ± 3.3 | 25.0 ± 3.5 | −0.04 (−0.88, 0.80) | Time | 0.173 (0.022) * | |
| HPTG | 27.1 ± 4.3 | 27.1 ± 4.9 | −0.00 (−0.84, 0.84) | Interaction | 0.007 (0.902) | |
| FFM (kg) | CON | 38.9 ± 4.5 | 38.9 ± 4.9 | 0.08 (−0.76, 0.92) | Group | 0.035 (0.606) |
| NPTG | 43.2 ± 5.5 | 43.5 ± 5.5 | 0.03 (−0.81, 0.87) | Time | 0.001 (862) | |
| HPTG | 41.3 ± 3.9 | 40.8 ± 4.0 | −0.01 (−0.85, 0.83) | Interaction | 0.035 (0.606) | |
| Percent Body Fat (%) | CON | 37.0 ± 4.4 | 37.4 ± 5.1 | 0.06 (−0.79, 0.89) | Group | 0.055 (0.451) |
| NPTG | 37.8 ± 5.0 | 38.0 ± 5.7 | 0.05 (−0.79, 0.89) | Time | 0.093 (0.102) | |
| HPTG | 40.2 ± 6.4 | 40.1 ± 6.9 | −0.03 (−0.87, 0.81) | Interaction | 0.055 (0.451) | |
| BMD (g/cm2) | CON | 1.12 ± 0.12 | 1.13 ± 0.12 | −0.02 (−0.85, 0.83) | Group | 0.062 (406) |
| NPTG | 1.09 ± 0.10 | 1.10 ± 0.09 | 0.05 (−0.79, 0.89) | Time | 0.006 (686) | |
| HPTG | 1.12 ± 0.11 | 1.19 ± 0.11 | 0.04 (−0.80, 0.88) | Interaction | 0.062 (406) | |
| BMC (g) | CON | 1986.4 ± 269.8 | 1982.3 ± 274.4 | −0.10 (−0.94, 0.74) | Group | 0.023 (0.724) |
| NPTG | 2117.5 ± 240.2 | 2132.8 ± 259.9 | 0.02 (−0.82, 0.86) | Time | 0.042 (0.278) | |
| HPTG | 2091.1 ± 226.0 | 2100.0 ± 237.1 | 0.12 (−0.73, 0.95) | Interaction | 0.023 (0.724) | |
| Variables | Groups | Before | After | Cohen′s d (95% CI) | η2 (p) Value | ||
|---|---|---|---|---|---|---|---|
| SBP (mmHg) | CON | 118.8 ± 16.8 | 120.0 ± 15.4 | 0.07 (−0.77, 0.91) | Group | 0.089 (0.271) | |
| NPTG | 119.1 ± 9.8 | 120.4 ± 11.1 | 0.12 (−0.73, 0.95) | Time | 0.244 (0.006) * | ||
| HPTG | 122.0 ± 13.1 | 116.3 ± 10.5 | −0.48 (−1.31, 0.39) | Interaction | 0.089 (0.271) | ||
| DBP (mmHg) | CON | 69.9 ± 8.0 | 68.1 ± 8.5 | −0.22 (−1.05, 0.63) | Group | 0.021 (0.739) | |
| NPTG | 72.2 ± 10.3 | 71.2 ± 9.5 | −0.10 (−0.94, 0.74) | Time | 0.326 (0.001) * | ||
| HPTG | 77.3 ± 9.5 | 71.8 ± 6.3 | −0.65 (−1.48, 0.24) | † | Interaction | 0.021 (0.739) | |
| MAP (mmHg) | CON | 86.2 ± 10.4 | 85.4 ± 9.9 | −0.08 (−0.92, 0.76) | Group | 0.040 (0.562) | |
| NPTG | 87.8 ± 9.5 | 87.6 ± 9.2 | −0.03 (−0.87, 0.81) | Time | 0.324 (0.001) * | ||
| HPTG | 92.2 ± 10.5 | 86.6 ± 7.2 | −0.60 (−1.43, 0.28) | Interaction | 0.040 (0.562) | ||
| PP (mmHg) | CON | 48.9 ± 11.5 | 51.9 ± 11.5 | 0.26 (−0.60, 1.09) | Group | 0.075 (0.337) | |
| NPTG | 46.9 ± 7.5 | 49.2 ± 8.9 | 0.26 (−0.59, 1.10) | Time | 0.084 (0.121) | ||
| HPTG | 44.8 ± 5.8 | 44.5 ± 7.0 | −0.04 (−0.88, 0.80) | Interaction | 0.075 (0.337) | ||
| baPWV (cm/s) | CON | 1246.7 ± 177.4 | 1252.2 ± 240.5 | 0.02 (−0.82, 0.86) | Group | 0.058 (0.435) | |
| NPTG | 1189.8 ± 141.5 | 1183.6 ± 98.7 | −0.04 (−0.88, 0.80) | Time | 0.045 (0.258) | ||
| HPTG | 1261.6 ± 148.5 | 1202.1 ± 153.8 | −0.39 (−1.22, 0.47) | Interaction | 0.058 (0.435) | ||
| Variables | Groups | Before | After | Cohen′s d (95% CI) | η2 (p) Value | ||
|---|---|---|---|---|---|---|---|
| Total cholesterol (mg/dL) | CON | 190.7 ± 25.7 | 193.2 ± 22.4 | 0.10 (−0.74, 0.94) | Group | 0.094 (0.253) | |
| NPTG | 191.0 ± 26.7 | 187.2 ± 20.4 | −0.15 (−0.99, 0.70) | Time | 0.390 (0.000) * | ||
| HPTG | 228.4 ± 58.6 | 203.4 ± 45.2 | −0.44 (−1.27, 0.43) | † | Interaction | 0.094 (0.253) | |
| Triglyceride (mg/dL) | CON | 108.6 ± 26.8 | 127.6 ± 28.6 | 0.68 (−0.21, 1.52) | Group | 0.315 (0.005) * | |
| NPTG | 98.4 ± 28.6 | 83.0 ± 18.0 | −0.62 (−1.45, 0.27) | Time | 0.196 (0.014) * | ||
| HPTG | 135.2 ± 41.7 | 114.8 ± 43.5 | −0.48 (−1.31, 0.39) | † | Interaction | 0.315 (0.005) * | |
| HDL-C (mg/dL) | CON | 55.9 ± 11.4 | 55.9 ± 11.5 | 0.00 (−0.84, 0.84) | Group | 0.003 (0.953) | |
| NPTG | 61.3 ± 7.5 | 60.6 ± 11.0 | −0.08 (−0.92, 0.76) | Time | 0.020 (0.459) | ||
| HPTG | 57.5 ± 14.6 | 56.4 ± 15.3 | −0.07 (−0.91, 0.77) | Interaction | 0.003 (0.953) | ||
| LDL-C (mg/dL) | CON | 117.8 ± 22.6 | 114.5 ± 22.0 | −0.15 (−0.98, 0.70) | Group | 0.025 (0.702) | |
| NPTG | 116.9 ± 27.2 | 104.9 ± 17.7 | −0.34 (−1.17, 0.52) | Time | 0.025 (0.401) | ||
| HPTG | 151.7 ± 52.4 | 142.0 ± 61.9 | −0.16 (−1.00, 0.68) | Interaction | 0.025 (0.702) | ||
| Free fatty acid (µEq/L) | CON | 926.7 ± 290.8 | 752.5 ± 343.7 | −0.54 (−1.38, 0.33) | Group | 0.075 (0.337) | |
| NPTG | 854.9 ± 383.6 | 585.6 ± 191.8 | −0.85 (−1.70, 0.06) | Time | 0.429 (0.000) * | ||
| HPTG | 976.7 ± 525.6 | 826.1 ± 421.4 | −0.31 (−1.14, 0.55) | Interaction | 0.075 (0.337) | ||
| Glucose (mg/dL) | CON | 99.0 ± 19.5 | 96.9 ± 18.3 | −0.11 (−0.95, 0.73) | Group | 0.049 (0.494) | |
| NPTG | 86.8 ± 8.5 | 94.6 ± 8.6 | 0.91 (−0.01, 1.75) | † | Time | 0.177 (0.020) * | |
| HPTG | 103.2 ± 17.9 | 101.8 ± 17.3 | −0.08 (−0.92, 0.76) | Interaction | 0.049 (0.494) | ||
| Insulin (mg/dL) | CON | 6.4 ± 3.3 | 7.5 ± 4.5 | 0.25 (−0.60, 1.08) | Group | 0.093 (0.256) | |
| NPTG | 5.4 ± 2.0 | 6.1 ± 2.6 | 0.28 (−0.58, 1.11) | Time | 0.013 (0.549) | ||
| HPTG | 8.0 ± 3.1 | 7.4 ± 2.9 | −0.20 (−1.03, 0.65) | Interaction | 0.093 (0.256) | ||
| HOMA-IR | CON | 1.6 ± 1.0 | 1.9 ± 1.4 | 0.19 (−0.66, 1.03) | Group | 0.101 (0.225) | |
| NPTG | 1.2 ± 0.5 | 1.4 ± 0.7 | 0.40 (−0.47, 1.23) | Time | 0.006 (0.691) | ||
| HPTG | 2.1 ± 1.0 | 1.9 ± 0.9 | −0.19 (−1.02, 0.66) | Interaction | 0.101 (0.225) | ||
| HOMA-β (%) | CON | 70.4 ± 29.4 | 81.0 ± 25.2 | 0.38 (−0.48, 1.21) | Group | 0.117 (0.176) | |
| NPTG | 84.3 ± 20.2 | 71.1 ± 28.3 | −0.52 (−1.35, 0.36) | Time | 0.123 (0.057) | ||
| HPTG | 78.4 ± 28.1 | 75.6 ± 30.9 | −0.10 (−0.93, 0.75) | Interaction | 0.117 (0.176) | ||
| Variable | Groups | Before | After | Cohen′s d (95% CI) | η2 (p) Value | |
|---|---|---|---|---|---|---|
| Estimated VO2max (mL/min/kg) | CON | 23.9 ± 2.6 | 24.6 ± 4.5 | 0.17 (−0.68, 1.00) | Group | 0.065 (0.392) |
| NPTG | 25.2 ± 2.9 | 25.2 ± 2.6 | 0.01 (−0.83, 0.85) | Time | 0.002 (0.814) | |
| HPTG | 24.4 ± 5.3 | 27.1 ± 8.6 | 0.34 (−0.52, 1.18) | Interaction | 0.065 (0.392) | |
© 2020 by the authors. Licensee MDPI, Basel, Switzerland. This article is an open access article distributed under the terms and conditions of the Creative Commons Attribution (CC BY) license (http://creativecommons.org/licenses/by/4.0/).
Share and Cite
Jung, K.; Kim, J.; Park, H.-Y.; Jung, W.-S.; Lim, K. Hypoxic Pilates Intervention for Obesity: A Randomized Controlled Trial. Int. J. Environ. Res. Public Health 2020, 17, 7186. https://0-doi-org.brum.beds.ac.uk/10.3390/ijerph17197186
Jung K, Kim J, Park H-Y, Jung W-S, Lim K. Hypoxic Pilates Intervention for Obesity: A Randomized Controlled Trial. International Journal of Environmental Research and Public Health. 2020; 17(19):7186. https://0-doi-org.brum.beds.ac.uk/10.3390/ijerph17197186
Chicago/Turabian StyleJung, Kyounghwa, Jisu Kim, Hun-Young Park, Won-Sang Jung, and Kiwon Lim. 2020. "Hypoxic Pilates Intervention for Obesity: A Randomized Controlled Trial" International Journal of Environmental Research and Public Health 17, no. 19: 7186. https://0-doi-org.brum.beds.ac.uk/10.3390/ijerph17197186