Vigorous-Intensity Physical Activities Are Associated with High Brown Adipose Tissue Density in Humans

 , and
, and
Abstract
:1. Introduction
2. Materials and Methods
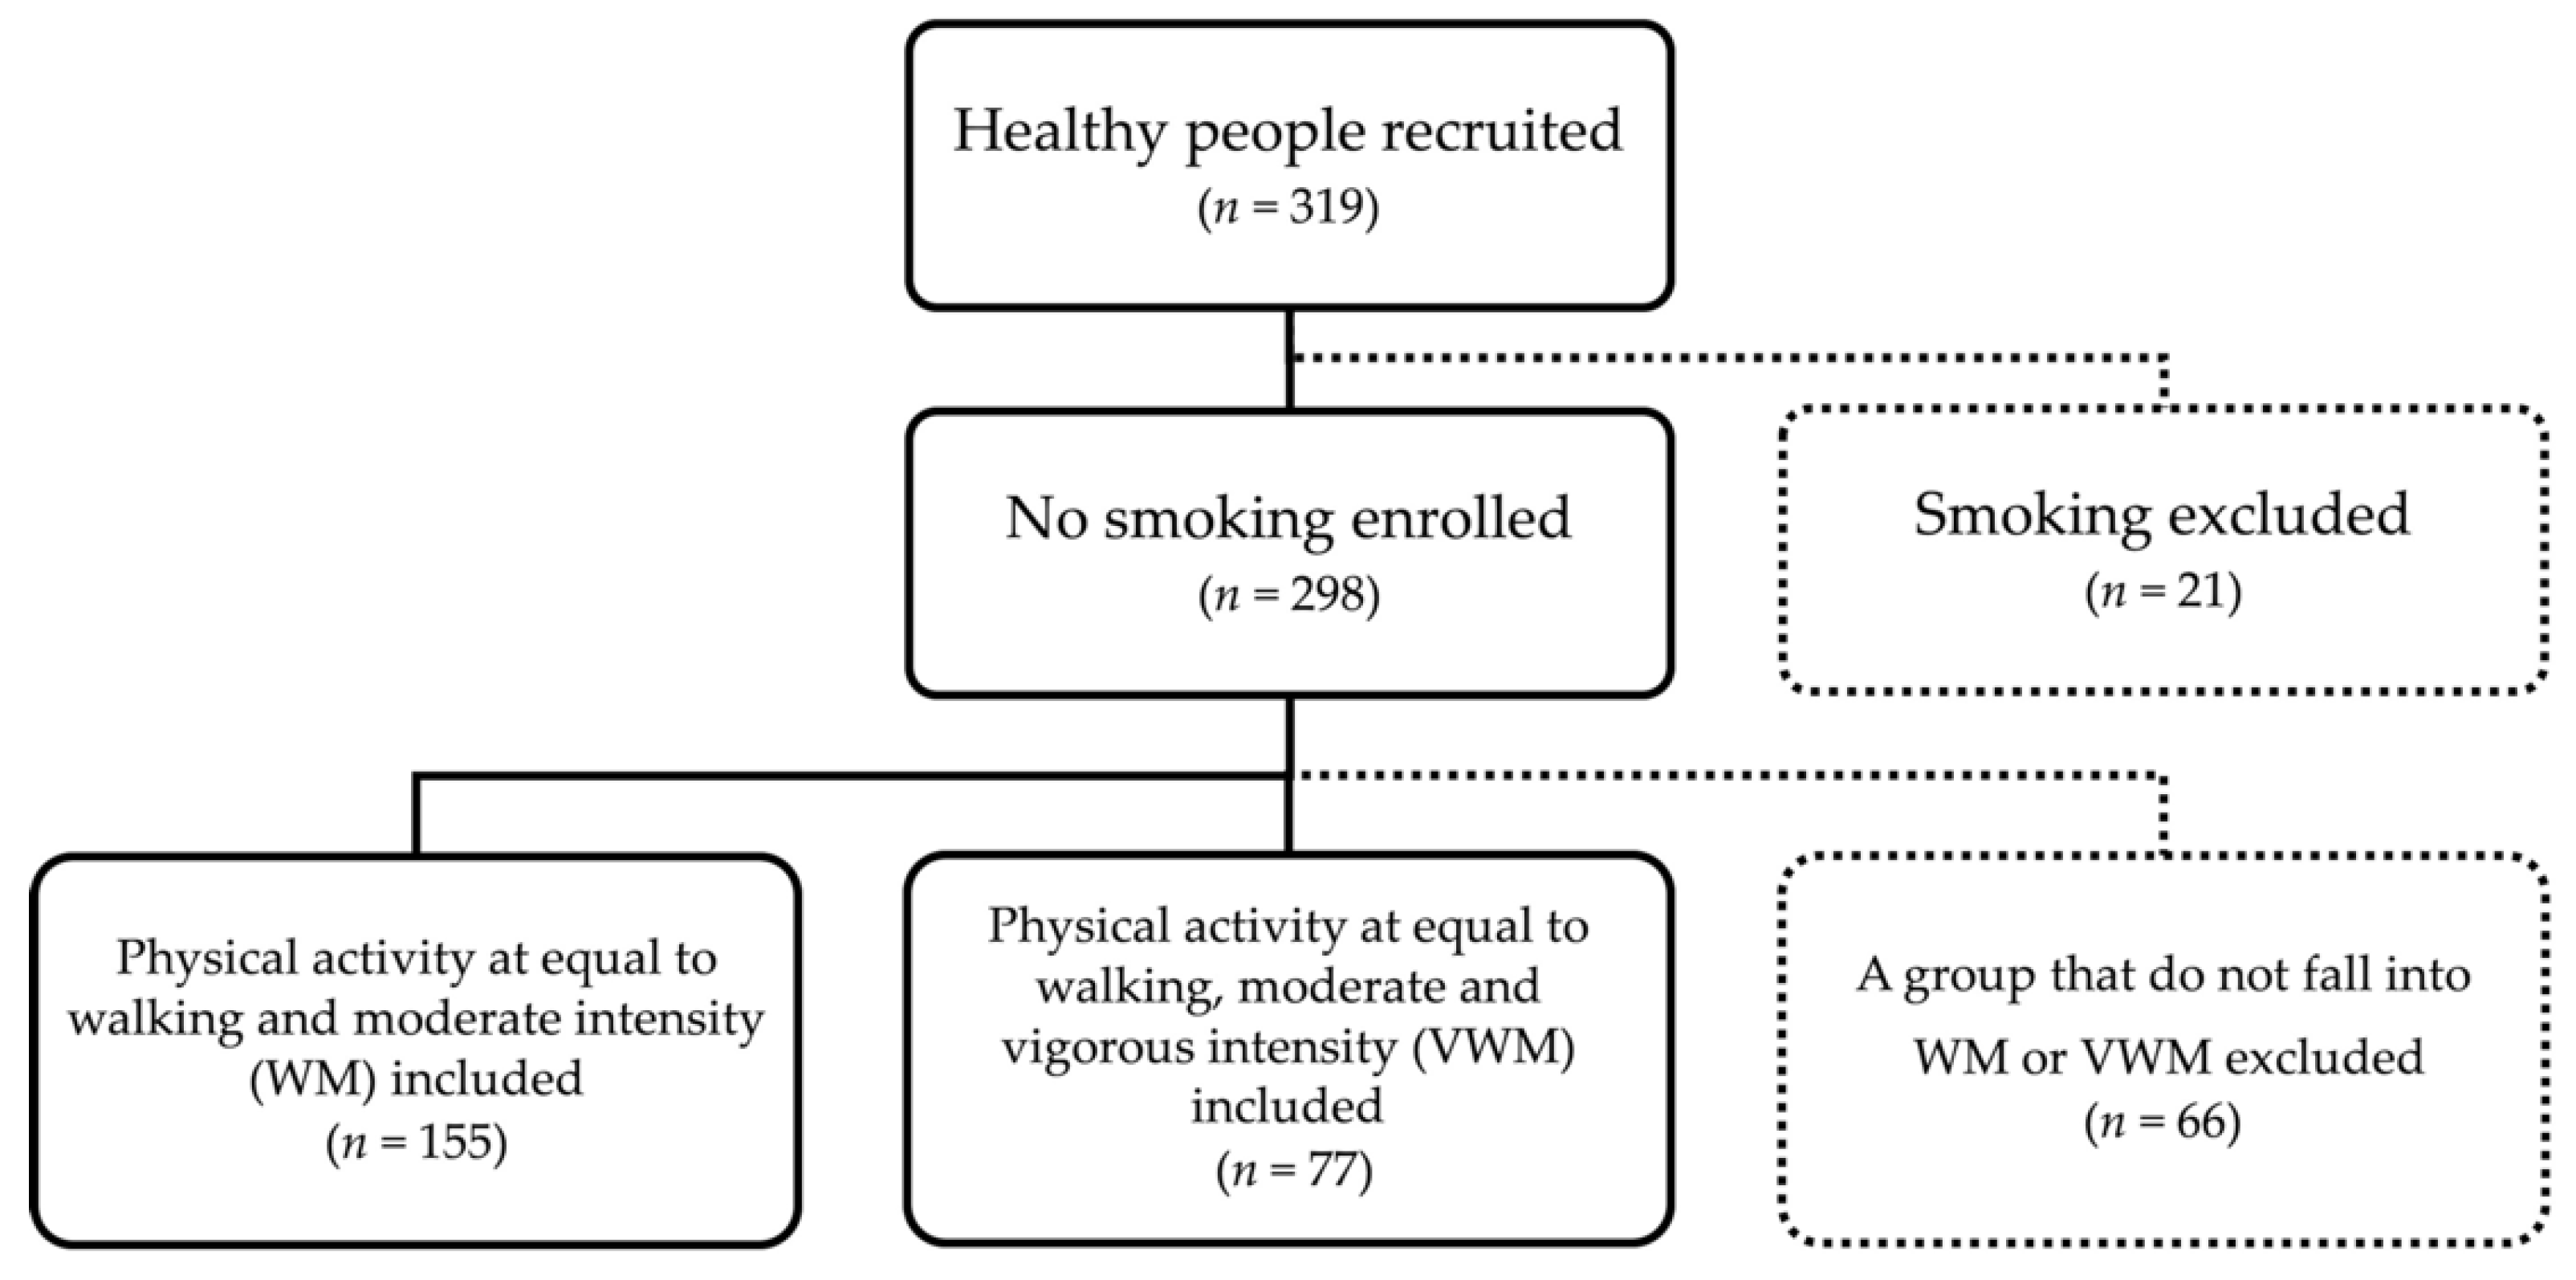
2.1. Participants and Study Design
2.2. Brown Adipose Tissue Density
2.3. Physical Activity Level
2.4. Measurement of Anthropometric and Circulatory Parameters
2.5. Statistical Analysis
3. Results
3.1. Participant Characteristics
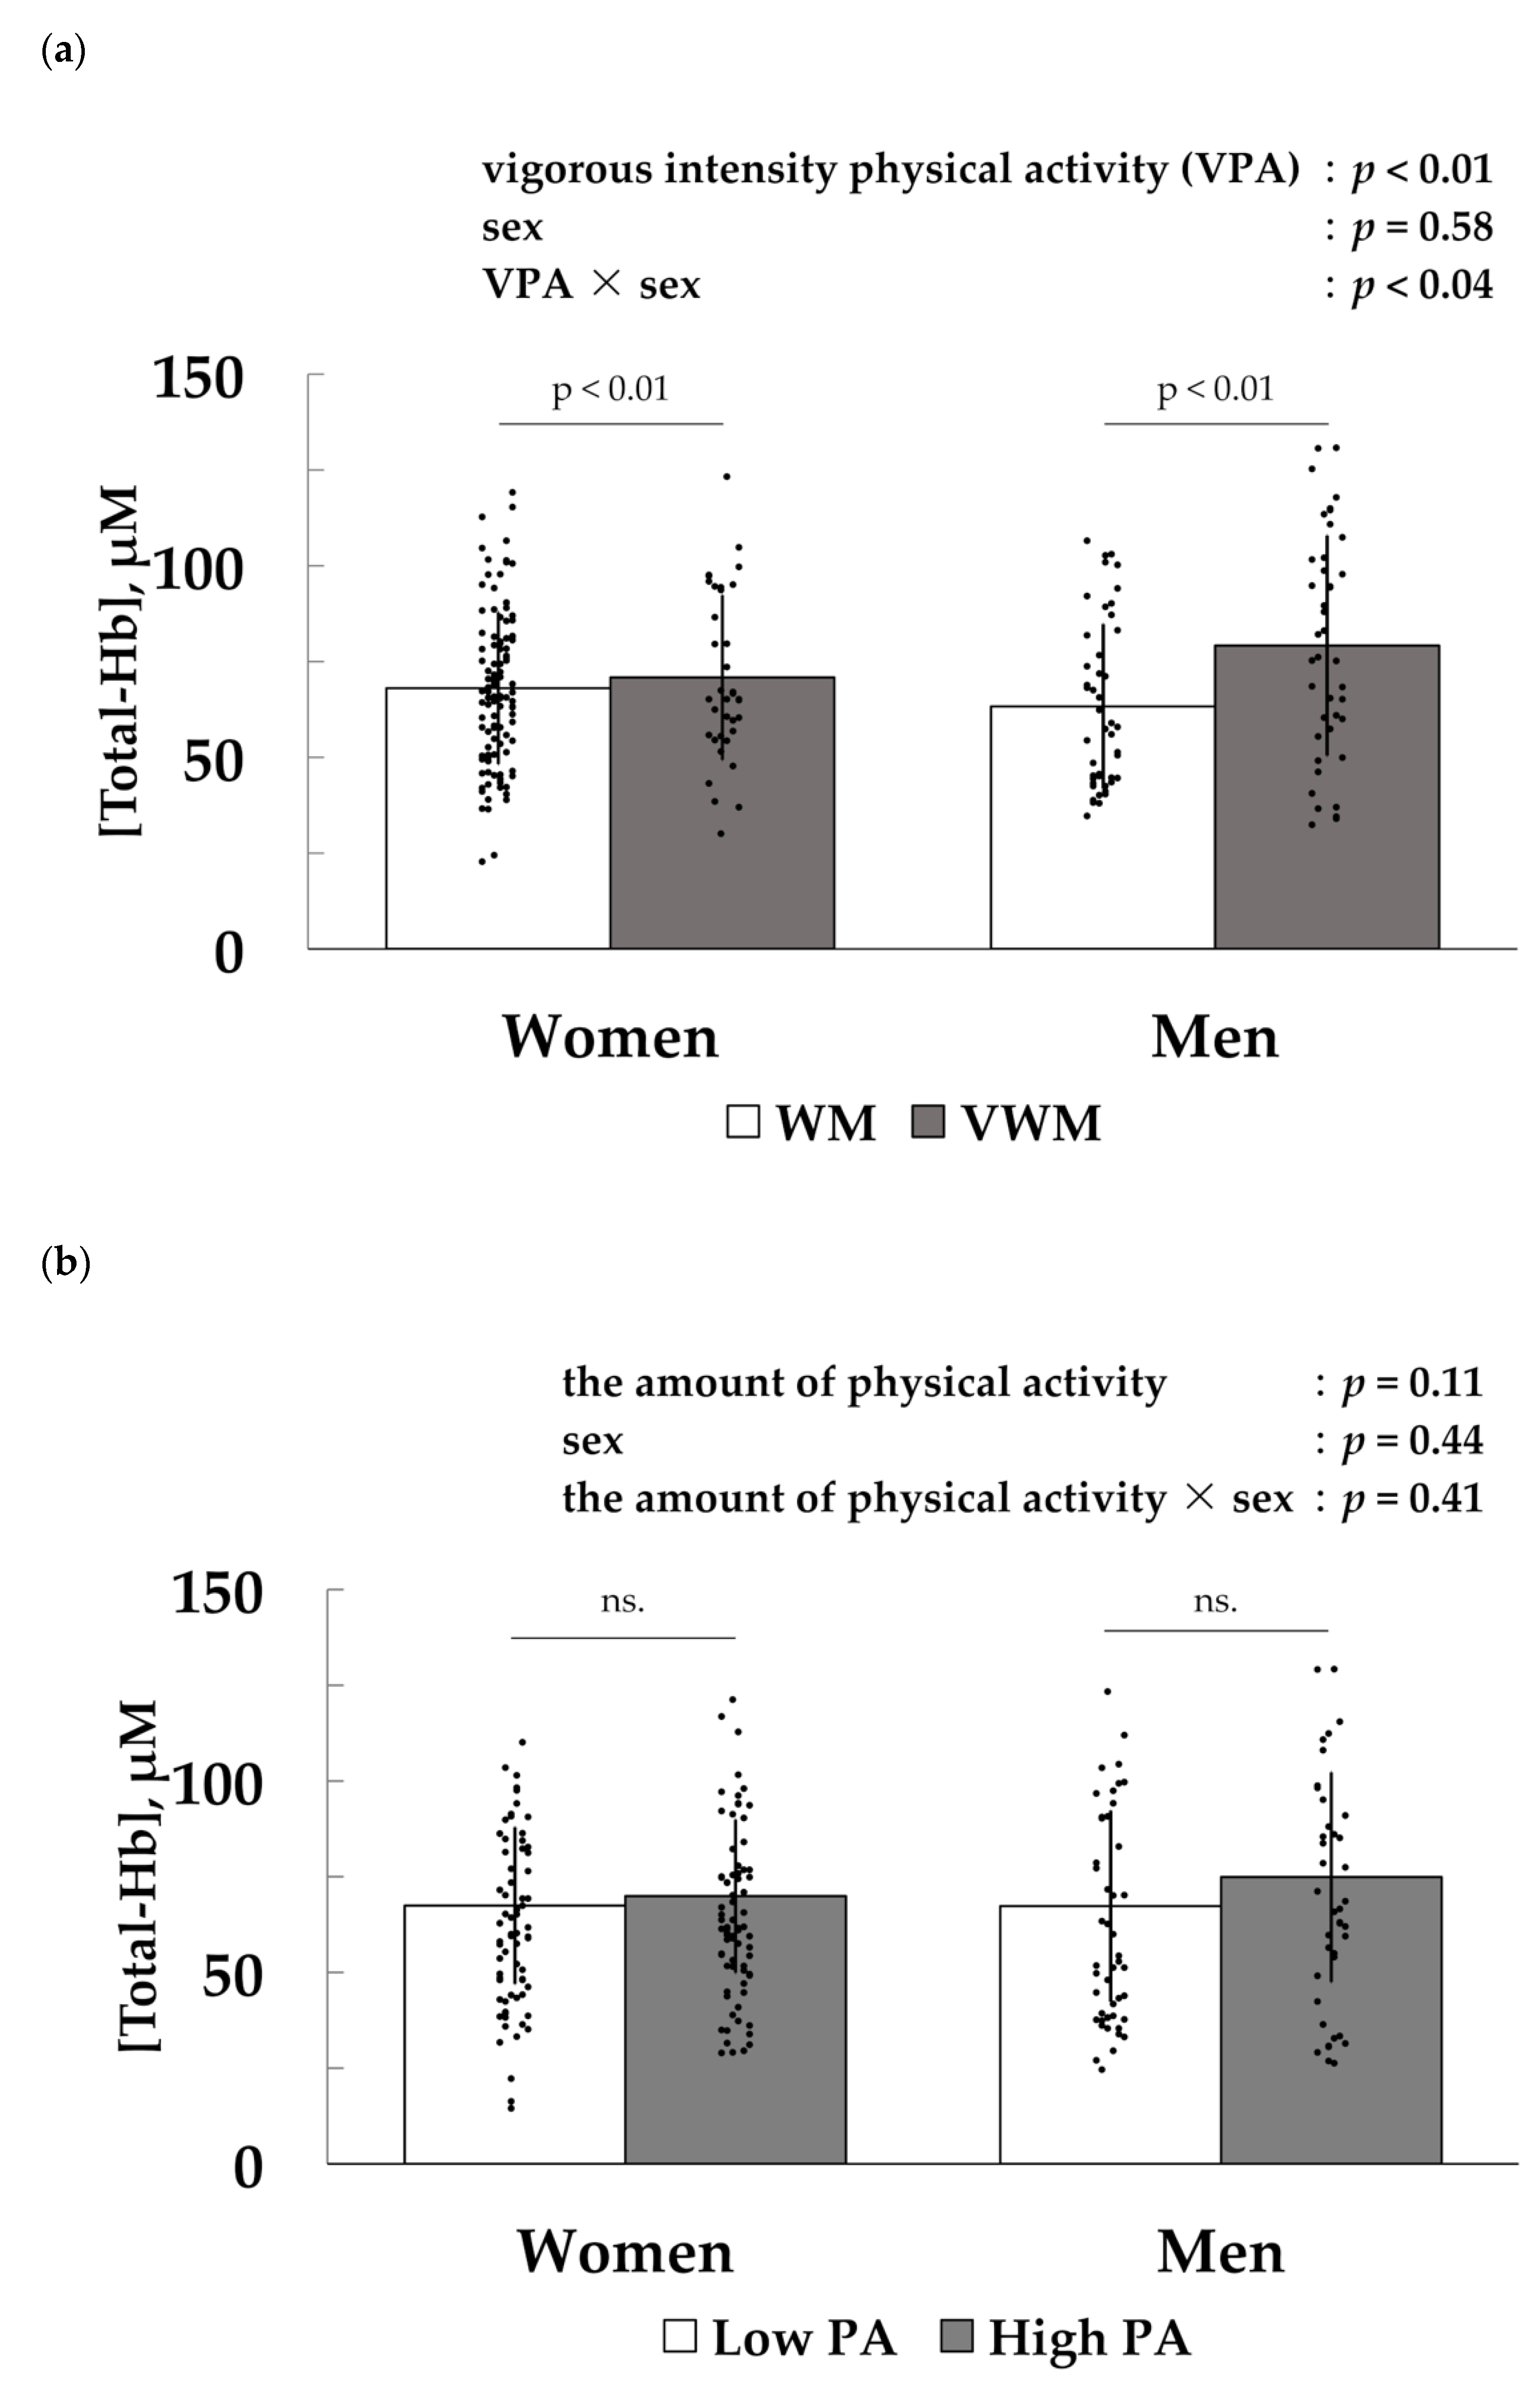
3.2. Association between Vigorous-Intensity Physical Activity and [Total-Hb] in the Supraclavicular Region, an Index of Brown Adipose Tissue Density
3.3. Factors Associated with [Total-Hb] in the Supraclavicular Region, an Index of Brown Adipose Tissue Density
4. Discussion
5. Conclusions
Author Contributions
Funding
Acknowledgments
Conflicts of Interest
References
- Sidossis, L.; Kajimura, S. Brown and beige fat in humans: Thermogenic adipocytes that control energy and glucose homeostasis. J. Clin. Investig. 2015, 125, 478–486. [Google Scholar] [CrossRef] [PubMed]
- Ikeda, K.; Maretich, P.; Kajimura, S. The Common and Distinct Features of Brown and Beige Adipocytes. Trends Endocrinol. Metab. 2018, 29, 191–200. [Google Scholar] [CrossRef] [PubMed] [Green Version]
- Van Marken Lichtenbelt, W.D.; Vanhommerig, J.W.; Smulders, N.M.; Drossaerts, J.M.A.F.L.; Kemerink, G.J.; Bouvy, N.D.; Schrauwen, P.; Teule, G.J.J. Cold-activated brown adipose tissue in healthy men. N. Engl. J. Med. 2009, 360, 1500–1508. [Google Scholar] [CrossRef] [PubMed] [Green Version]
- Hanssen, M.J.W.; Van Der Lans, A.A.J.J.; Brans, B.; Hoeks, J.; Jardon, K.M.C.; Schaart, G.; Mottaghy, F.M.; Schrauwen, P.; Van Marken Lichtenbelt, W.D. Short-term cold acclimation recruits brown adipose tissue in obese humans. Diabetes 2016, 65, 1179–1189. [Google Scholar] [CrossRef] [PubMed] [Green Version]
- Blondin, D.P.; Daoud, A.; Taylor, T.; Tingelstad, H.C.; Bézaire, V.; Richard, D.; Carpentier, A.C.; Taylor, A.W.; Harper, M.E.; Aguer, C.; et al. Four-week cold acclimation in adult humans shifts uncoupling thermogenesis from skeletal muscles to brown adipose tissue. J. Physiol. 2017, 595, 2099–2113. [Google Scholar] [CrossRef]
- Hibi, M.; Oishi, S.; Matsushita, M.; Yoneshiro, T.; Yamaguchi, T.; Usui, C.; Yasunaga, K.; Katsuragi, Y.; Kubota, K.; Tanaka, S.; et al. Brown adipose tissue is involved in diet-induced thermogenesis and whole-body fat utilization in healthy humans. Int. J. Obes. 2016, 40, 1655–1661. [Google Scholar] [CrossRef] [Green Version]
- Carpentier, A.C.; Blondin, D.P.; Virtanen, K.A.; Richard, D.; Haman, F.; Turcotte, É.E. Brown adipose tissue energy metabolism in humans. Front. Endocrinol. 2018, 9, 447. [Google Scholar] [CrossRef] [Green Version]
- Fedorenko, A.; Lishko, P.V.; Kirichok, Y. Mechanism of fatty-acid-dependent UCP1 uncoupling in brown fat mitochondria. Cell 2012, 151, 400–413. [Google Scholar] [CrossRef] [Green Version]
- Bouillaud, F.; Ricquier, D.; Thibault, J.; Weissenbach, J. Molecular approach to thermogenesis in brown adipose tissue: cDNA cloning of the mitochondrial uncoupling protein. Proc. Natl. Acad. Sci. USA 1985, 82, 445–448. [Google Scholar] [CrossRef] [Green Version]
- Yoneshiro, T.; Aita, S.; Matsushita, M.; Kayahara, T.; Kameya, T.; Kawai, Y.; Iwanaga, T.; Saito, M. Recruited brown adipose tissue as an antiobesity agent in humans. J. Clin. Investig. 2013, 123, 3404–3408. [Google Scholar] [CrossRef] [Green Version]
- Yoneshiro, T.; Matsushita, M.; Saito, M. Translational aspects of brown fat activation by food-derived stimulants. In Handbook of Experimental Pharmacology; Springer: Cham, Switzerland, 2019; Volume 251, pp. 359–379. [Google Scholar]
- Bartness, T.J.; Vaughan, C.H.; Song, C.K. Sympathetic and sensory innervation of brown adipose tissue. Int. J. Obes. 2010, 34, S36–S42. [Google Scholar] [CrossRef] [PubMed] [Green Version]
- Jimenez, M.; Léger, B.; Canola, K.; Lehr, L.; Arboit, P.; Seydoux, J.; Russell, A.P.; Giacobino, J.P.; Muzzin, P.; Preitner, F. Β1/Β2/Β3-Adrenoceptor Knockout Mice Are Obese and Cold-Sensitive But Have Normal Lipolytic Responses To Fasting. FEBS Lett. 2002, 530, 37–40. [Google Scholar] [CrossRef] [Green Version]
- Lowell, B.B.; Bachman, E.S. β-Adrenergic receptors, diet-induced thermogenesis, and obesity. J. Biol. Chem. 2003, 278, 29385–29388. [Google Scholar] [CrossRef] [PubMed] [Green Version]
- Bachman, E.S.; Dhillon, H.; Zhang, C.Y.; Cinti, S.; Bianco, A.C.; Kobilka, B.K.; Lowell, B.B. βAR signaling required for diet-induced thermogenesis and obesity resistance. Science 2002, 297, 843–845. [Google Scholar] [CrossRef] [Green Version]
- Collins, S.; Cao, W.; Robidoux, J. Learning new tricks from old dogs: β-adrenergic receptors teach new lessons on firing up adipose tissue metabolism. Mol. Endocrinol. 2004, 18, 2123–2131. [Google Scholar] [CrossRef] [Green Version]
- Lean, M. Brown adipose tissue in humans. Proc. Nutr. Soc. 1989, 48, 243–257. [Google Scholar] [CrossRef]
- Osuna-Prieto, F.J.; Martinez-Tellez, B.; Sanchez-Delgado, G.; Aguilera, C.M.; Lozano-Sánchez, J.; Arráez-Román, D.; Segura-Carretero, A.; Ruiz, J.R. Activation of human brown adipose tissue by capsinoids, catechins, ephedrine, and other dietary components: A systematic review. Adv. Nutr. 2019, 10, 291–302. [Google Scholar] [CrossRef]
- Ruiz, J.R.; Martinez-Tellez, B.; Sanchez-Delgado, G.; Osuna-Prieto, F.J.; Rensen, P.C.N.; Boon, M.R. Role of Human Brown Fat in Obesity, Metabolism and Cardiovascular Disease: Strategies to Turn Up the Heat. Prog. Cardiovasc. Dis. 2018, 61, 232–245. [Google Scholar] [CrossRef]
- Yoneshiro, T.; Aita, S.; Matsushita, M.; Okamatsu-Ogura, Y.; Kameya, T.; Kawai, Y.; Miyagawa, M.; Tsujisaki, M.; Saito, M. Age-related decrease in cold-activated brown adipose tissue and accumulation of body fat in healthy humans. Obesity 2011, 19, 1755–1760. [Google Scholar] [CrossRef]
- Froy, O.; Garaulet, M. The circadian clock in white and brown adipose tissue: Mechanistic, endocrine, and clinical aspects. Endocr. Rev. 2018, 39, 261–273. [Google Scholar] [CrossRef]
- Scheele, C.; Nielsen, S. Metabolic regulation and the anti-obesity perspectives of human brown fat. Redox Biol. 2017, 12, 770–775. [Google Scholar] [CrossRef] [PubMed]
- Vosselman, M.J.; Hoeks, J.; Brans, B.; Pallubinsky, H.; Nascimento, E.B.M.; Van Der Lans, A.A.J.J.; Broeders, E.P.M.; Mottaghy, F.M.; Schrauwen, P.; Van Marken Lichtenbelt, W.D. Low brown adipose tissue activity in endurance-trained compared with lean sedentary men. Int. J. Obes. 2015, 39, 1696–1702. [Google Scholar] [CrossRef] [PubMed] [Green Version]
- Singhal, V.; Maffazioli, G.D.; Ackerman, K.E.; Lee, H.; Elia, E.F.; Woolley, R.; Kolodny, G.; Cypess, A.M.; Misra, M. Effect of chronic athletic activity on brown fat in young women. PLoS ONE 2016, 11, 1–12. [Google Scholar]
- Motiani, P.; Virtanen, K.A.; Motiani, K.K.; Eskelinen, J.J.; Middelbeek, R.J.; Goodyear, L.J.; Savolainen, A.M.; Kemppainen, J.; Jensen, J.; Din, M.U.; et al. Decreased insulin-stimulated brown adipose tissue glucose uptake after short-term exercise training in healthy middle-aged men. Diabetes Obes. Metab. 2017, 19, 1379–1388. [Google Scholar] [CrossRef] [PubMed] [Green Version]
- De Matteis, R.; Lucertini, F.; Guescini, M.; Polidori, E.; Zeppa, S.; Stocchi, V.; Cinti, S.; Cuppini, R. Exercise as a new physiological stimulus for brown adipose tissue activity. Nutr. Metab. Cardiovasc. Dis. 2013, 23, 582–590. [Google Scholar] [CrossRef]
- Aldiss, P.; Betts, J.; Sale, C.; Pope, M.; Budge, H.; Symonds, M.E. Exercise-induced ‘browning’ of adipose tissues. Metabolism 2018, 81, 63–70. [Google Scholar] [CrossRef] [Green Version]
- Peppler, W.T.; Townsend, L.K.; Knuth, C.M.; Foster, M.T.; Wright, D.C. Subcutaneous inguinal white adipose tissue is responsive to, but dispensable for, the metabolic health benefits of exercise. Am. J. Physiol. Endocrinol. Metab. 2018, 314, E66–E77. [Google Scholar] [CrossRef]
- Saito, M.; Okamatsu-Ogura, Y.; Matsushita, M.; Watanabe, K.; Yoneshiro, T.; Nio-Kobayashi, J.; Iwanaga, T.; Miyagawa, M.; Kameya, T.; Nakada, K.; et al. High incidence of metabolically active brown adipose tissue in healthy adult humans: Effects of cold exposure and adiposity. Diabetes 2009, 58, 1526–1531. [Google Scholar] [CrossRef] [Green Version]
- Lee, P.; Smith, S.; Linderman, J.; Courville, A.B.; Brychta, R.J.; Dieckmann, W.; Werner, C.D.; Chen, K.Y.; Celi, F.S. Temperature-acclimated brown adipose tissue modulates insulin sensitivity in humans. Diabetes 2014, 63, 3686–3698. [Google Scholar] [CrossRef] [Green Version]
- Yeung, H.W.D.; Grewal, R.K.; Gonen, M.; Schöder, H.; Larson, S.M. Patterns of 18F-FDG uptake in adipose tissue and muscle: A potential source of false-positives for PET. J. Nucl. Med. 2003, 44, 1789–1796. [Google Scholar]
- Martinez-Tellez, B.; Sanchez-Delgado, G.; Garcia-Rivero, Y.; Alcantara, J.M.A.; Martinez-Avila, W.D.; Muñoz-Hernandez, M.V.; Olza, J.; Boon, M.R.; Rensen, P.C.N.; Llamas-Elvira, J.M.; et al. A new personalized cooling protocol to activate brown adipose tissue in young adults. Front. Physiol. 2017, 8, 1–10. [Google Scholar] [CrossRef] [PubMed] [Green Version]
- Martinez-Tellez, B.; Nahon, K.J.; Sanchez-Delgado, G.; Abreu-Vieira, G.; Llamas-Elvira, J.M.; Van Velden, F.H.P.; Pereira Arias-Bouda, L.M.; Rensen, P.C.N.; Boon, M.R.; Ruiz, J.R. The impact of using BARCIST 1.0 criteria on quantification of BAT volume and activity in three independent cohorts of adults. Sci. Rep. 2018, 8, 1–8. [Google Scholar] [CrossRef] [PubMed] [Green Version]
- Borga, M.; Virtanen, K.A.; Romu, T.; Leinhard, O.D.; Persson, A.; Nuutila, P.; Enerbäck, S. Brown adipose tissue in humans: Detection and functional analysis using PET (positron emission tomography), MRI (magnetic resonance imaging), and DECT (dual energy computed tomography). Methods Enzymol. 2014, 537, 141–159. [Google Scholar] [PubMed] [Green Version]
- Nirengi, S.; Fuse, S.; Amagasa, S.; Homma, T.; Kime, R.; Kuroiwa, M.; Endo, T.; Sakane, N.; Matsushita, M.; Saito, M.; et al. Applicability of supraclavicular oxygenated and total hemoglobin evaluated by near-infrared time-resolved spectroscopy as indicators of brown adipose tissue density in humans. Int. J. Mol. Sci. 2019, 20, 2214. [Google Scholar] [CrossRef] [PubMed] [Green Version]
- Lee, P.; Swarbrick, M.M.; Ho, K.K.Y. Brown adipose tissue in adult humans: A metabolic renaissance. Endocr. Rev. 2013, 34, 413–438. [Google Scholar] [CrossRef] [PubMed] [Green Version]
- Wang, W.; Seale, P. Control of brown and beige fat development. Nat. Rev. Mol. Cell Biol. 2016, 17, 691–702. [Google Scholar] [CrossRef]
- Cinti, S. Symposium on “new perspectives on adipose tissue function”: The adipose organ: Morphological perspectives of adipose tissues. Proc. Nutr. Soc. 2001, 60, 319–328. [Google Scholar] [CrossRef] [Green Version]
- Nirengi, S.; Yoneshiro, T.; Sugie, H.; Saito, M.; Hamaoka, T. Human brown adipose tissue assessed by simple, noninvasive near-Infrared time-resolved spectroscopy. Obesity 2015, 23, 973–980. [Google Scholar] [CrossRef]
- Nirengi, S.; Homma, T.; Inoue, N.; Sato, H.; Yoneshiro, T.; Matsushita, M.; Kameya, T.; Sugie, H.; Tsuzaki, K.; Saito, M.; et al. Assessment of human brown adipose tissue density during daily ingestion of thermogenic capsinoids using near-infrared time-resolved spectroscopy. J. Biomed. Opt. 2016, 21, 091305. [Google Scholar] [CrossRef] [Green Version]
- Nirengi, S.; Amagasa, S.; Homma, T.; Yoneshiro, T.; Matsumiya, S.; Kurosawa, Y.; Sakane, N.; Ebi, K.; Saito, M.; Hamaoka, T. Daily ingestion of catechin-rich beverage increases brown adipose tissue density and decreases extramyocellular lipids in healthy young women. Springerplus 2016, 5, 1363. [Google Scholar] [CrossRef] [Green Version]
- Nirengi, S.; Sakane, N.; Amagasa, S.; Wakui, S.; Homma, T.; Kurosawa, Y.; Hamaoka, T. Seasonal differences in brown adipose tissue density and pulse rate variability in a thermoneutral environment. J. Physiol. Anthropol. 2018, 37, 6. [Google Scholar] [CrossRef]
- Katayama, K.; Saito, M. Muscle sympathetic nerve activity during exercise. J. Physiol. Sci. 2019, 69, 589–598. [Google Scholar] [CrossRef] [PubMed]
- Robinson, B.F.; Epstein, S.E.; Beiser, G.D.; Braunwald, E. Control of heart rate by the autonomic nervous system. Studies in man on the interrelation between baroreceptor mechanisms and exercise. Circ. Res. 1966, 19, 400–411. [Google Scholar] [CrossRef] [PubMed] [Green Version]
- Zouhal, H.; Jacob, C.; Delamarche, P.; Gratas-Delamarche, A. Catecholamines and the effects of exercise, training and gender. Sport. Med. 2008, 38, 401–423. [Google Scholar] [CrossRef] [PubMed]
- Christensen, N.J.; Galbo, H.; Hansen, J.F.; Hesse, B.; Richter, E.A.; Trap-Jensen, J. Catecholamines and exercise. Diabetes 1979, 28, 58–62. [Google Scholar] [CrossRef] [PubMed]
- Saito, M.; Tsukanaka, A.; Yanagihara, D.; Mano, T. Muscle sympathetic nerve responses to graded leg cycling. J. Appl. Physiol. 1993, 75, 663–667. [Google Scholar] [CrossRef]
- Sanchez-Delgado, G.; Martinez-Tellez, B.; Olza, J.; Aguilera, C.M.; Gil, Á.; Ruiz, J.R. Role of exercise in the activation of brown adipose tissue. Ann. Nutr. Metab. 2015, 67, 21–32. [Google Scholar] [CrossRef]
- Flouris, A.D.; Dinas, P.C.; Valente, A.; Andrade, C.M.B.; Kawashita, N.H.; Sakellariou, P. Exercise-induced effects on UCP1 expression in classical brown adipose tissue: A systematic review. Horm. Mol. Biol. Clin. Investig. 2017, 31, 1–13. [Google Scholar] [CrossRef]
- Lehnig, A.C.; Stanford, K.I. Exercise-induced adaptations to white and brown adipose tissue. J. Exp. Biol. 2018, 221, jeb161570. [Google Scholar] [CrossRef] [Green Version]
- Pagnotti, G.M.; Styner, M. Exercise regulation of marrow adipose tissue. Front. Endocrinol. 2016, 7, 94. [Google Scholar] [CrossRef] [Green Version]
- Stanford, K.I.; Middelbeek, R.J.W.; Goodyear, L.J. Exercise effects on white adipose tissue: Beiging and metabolic adaptations. Diabetes 2015, 64, 2361–2368. [Google Scholar] [CrossRef] [PubMed] [Green Version]
- Dinas, P.C.; Lahart, I.M.; Timmons, J.A.; Svensson, P.A.; Koutedakis, Y.; Flouris, A.D.; Metsios, G.S. Effects of physical activity on the link between PGC-1a and FNDC5 in muscle, circulating Ιrisin and UCP1 of white adipocytes in humans: A systematic review. F1000Research 2017, 6, 286. [Google Scholar] [CrossRef] [PubMed]
- Marlatt, K.L.; Ravussin, E. Brown Adipose Tissue: An Update on Recent Findings. Curr. Obes. Rep. 2017, 6, 389–396. [Google Scholar] [CrossRef] [PubMed]
- Dewal, R.S.; Stanford, K.I. Effects of exercise on brown and beige adipocytes. Biochim. Biophys. Acta Mol. Cell Biol. Lipids 2019, 1864, 71–78. [Google Scholar] [CrossRef] [PubMed]
- Fuse, S.; Nirengi, S.; Amagasa, S.; Homma, T.; Kime, R.; Endo, T.; Sakane, N.; Matsushita, M.; Saito, M.; Yoneshiro, T.; et al. Brown adipose tissue density measured by near-infrared time-resolved spectroscopy in Japanese, across a wide age range. J. Biomed. Opt. 2018, 23, 1. [Google Scholar] [CrossRef] [PubMed]
- Gunadi, S.; Leung, T.S.; Elwell, C.E.; Tachtsidis, I. Spatial sensitivity and penetration depth of three cerebral oxygenation monitors. Biomed. Opt. Express 2014, 5, 2896. [Google Scholar] [CrossRef] [Green Version]
- Flynn, A.; Li, Q.; Panagia, M.; Abdelbaky, A.; Macnabb, M.; Samir, A.; Cypess, A.M.; Weyman, A.E.; Tawakol, A.; Scherrer-Crosbie, M. Contrast-Enhanced Ultrasound: A Novel Noninvasive, Nonionizing Method for the Detection of Brown Adipose Tissue in Humans. J. Am. Soc. Echocardiogr. 2015, 28, 1247–1254. [Google Scholar] [CrossRef] [Green Version]
- Niwayama, M.; Hamaoka, T.; Lin, L.; Shao, J.; Kudo, N.; Katoh, C.; Yamamoto, K. Quantitative muscle oxygenation measurement using NIRS with correction for the influence of a fat layer: Comparison of oxygen consumption rates with measurements by other techniques. Biomed. Diagnostic Guid. Surg. Syst. 2000, 3911, 256–265. [Google Scholar]
- IPAQ (2005) Guidelines for Data Processing and Analysis of the International Physical Activity Questionnaire (IPAQ)—Short and Long Forms, revised on November 2005. Ipaq 2005. Available online: https://www.researchgate.net/file.PostFileLoader.html?id=5641f4c36143250eac8b45b7&assetKey=AS%3A294237418606593%401447163075131 (accessed on 17 April 2020).
- Ministry of Health, Labour and Welfare (Japan). Report of the review meeting on revision of exercise standards and exercise guidelines; 2013. Available online: https://www.mhlw.go.jp/content/000306883.pdf (accessed on 17 April 2020).
- Lee, S.Y.; Ahn, S.; Kim, Y.J.; Ji, M.J.; Kim, K.M.; Choi, S.H.; Jang, H.C.; Lim, S. Comparison between dual-energy x-ray absorptiometry and bioelectrical impedance analyses for accuracy in measuring whole body muscle mass and appendicular skeletal muscle mass. Nutrients 2018, 10, 738. [Google Scholar] [CrossRef] [Green Version]
- Sullivan, P.A.; Still, C.D.; Jamieson, S.T.; Dixon, C.B.; Irving, B.A.; Andreacci, J.L. Evaluation of multi-frequency bioelectrical impedance analysis for the assessment of body composition in individuals with obesity. Obes. Sci. Pract. 2019, 5, 141–147. [Google Scholar] [CrossRef] [PubMed]
- Martinez-Tellez, B.; Sanchez-Delgado, G.; Amaro-Gahete, F.J.; Acosta, F.M.; Ruiz, J.R. Relationships between cardiorespiratory fitness/muscular strength and 18F-fluorodeoxyglucose uptake in brown adipose tissue after exposure to cold in young, sedentary adults. Sci. Rep. 2019, 9, 11314. [Google Scholar] [CrossRef] [Green Version]
- Quarta, C.; Mazza, R.; Pasquali, R.; Pagotto, U. Role of sex hormones in modulation of brown adipose tissue activity. J. Mol. Endocrinol. 2012, 49, 1–7. [Google Scholar] [CrossRef] [Green Version]
- Adler, E.S.; Hollis, J.H.; Clarke, I.J.; Grattan, D.R.; Oldfield, B.J. Neurochemical characterization and sexual dimorphism of projections from the brain to abdominal and subcutaneous white adipose tissue in the rat. J. Neurosci. 2012, 32, 15913–15921. [Google Scholar] [CrossRef] [PubMed] [Green Version]
- Uchida, K.; Sun, W.; Yamazaki, J.; Tominaga, M. Role of thermo-sensitive transient receptor potential channels in brown adipose tissue. Biol. Pharm. Bull. 2018, 41, 1135–1144. [Google Scholar] [CrossRef] [PubMed] [Green Version]
- Morrison, S.F.; Nakamura, K. Central Mechanisms for Thermoregulation. Annu. Rev. Physiol. 2019, 81, 285–308. [Google Scholar] [CrossRef] [PubMed]
- Nakamura, K.; Morrison, S.F. A thermosensory pathway that controls body temperature. Nat. Neurosci. 2008, 11, 62–71. [Google Scholar] [CrossRef]
- Nakamura, K.; Morrison, S.F. A thermosensory pathway mediating heat-defense responses. Proc. Natl. Acad. Sci. USA 2010, 107, 8848–8853. [Google Scholar] [CrossRef] [Green Version]
- Spranger, M.D.; Krishnan, A.C.; Levy, P.D.; O’Leary, D.S.; Smith, S.A. Blood flow restriction training and the exercise pressor reflex: A call for concern. Am. J. Physiol. Heart Circ. Physiol. 2015, 309, H1440–H1452. [Google Scholar] [CrossRef]
- Fischer, C.P. Interleukin-6 in acute exercise and training: What is the biological relevance? Exerc. Immunol. Rev. 2006, 12, 6–33. [Google Scholar]
- Yamagata, K.; Matsumura, K.; Inoue, W.; Shiraki, T.; Suzuki, K.; Yasuda, S.; Sugiura, H.; Cao, C.; Watanabe, Y.; Kobayashi, S. Coexpression of microsomal-type prostaglandin E synthase with cyclooxygenase-2 in brain endothelial cells of rats during endotoxin-induced fever. J. Neurosci. 2001, 21, 2669–2677. [Google Scholar] [CrossRef]
- Nakamura, K. Central circuitries for body temperature regulation and fever. Am. J. Physiol. Regul. Integr. Comp. Physiol. 2011, 301, R1207–R1228. [Google Scholar] [CrossRef] [PubMed] [Green Version]
- Boström, P.; Wu, J.; Jedrychowski, M.P.; Korde, A.; Ye, L.; Lo, J.C.; Rasbach, K.; Boström, E.A.; Choi, J.H.; Long, J.Z.; et al. A PGC1a dependent myokine that derives browning of white fat and thermogenesis. Nature 2012, 481, 463–468. [Google Scholar] [CrossRef] [PubMed]
- Kim, H.J.; Lee, H.J.; So, B.; Son, J.S.; Yoon, D.; Song, W. Effect of aerobic training and resistance training on circulating irisin level and their association with change of body composition in overweight/obese adults: A pilot study. Physiol. Res. 2016, 65, 271–279. [Google Scholar] [CrossRef]
- Otero-Díaz, B.; Rodríguez-Flores, M.; Sánchez-Muñoz, V.; Monraz-Preciado, F.; Ordoñez-Ortega, S.; Becerril-Elias, V.; Baay-Guzmán, G.; Obando-Monge, R.; García-García, E.; Palacios-González, B.; et al. Exercise Induces White Adipose Tissue Browning Across the Weight Spectrum in Humans. Front. Physiol. 2018, 9, 1781. [Google Scholar] [CrossRef]
- Malo, A.; Puerta, M. Oestradiol and progesterone change β3-adrenergic receptor affinity and density in brown adipocytes. Eur. J. Endocrinol. 2001, 145, 87–91. [Google Scholar] [CrossRef] [Green Version]
- Monjo, M.; Rodríguez, A.M.; Palou, A.; Roca, P. Direct Effects of Testosterone, 17β-Estradiol, and Progesterone on Adrenergic Regulation in Cultured Brown Adipocytes: Potential Mechanism for Gender-Dependent Thermogenesis. Endocrinology 2003, 144, 4923–4930. [Google Scholar] [CrossRef] [Green Version]
- Yamamoto, Y.; Hughson, R.L.; Nakamura, Y. Autonomic nervous system responses to exercise in relation to ventilatory threshold. Chest 1992, 101, 206S–210S. [Google Scholar] [CrossRef] [Green Version]
- Nakamura, Y.; Yamamoto, Y.; Muraoka, I. Autonomic control of heart rate during physical exercise and fractal dimension of heart rate variability. J. Appl. Physiol. 1993, 74, 875–881. [Google Scholar] [CrossRef]
- Fuse, S.; Hamaoka, T.; Kuroiwa, M.; Kime, R.; Endo, T.; Tanaka, R.; Amagasa, S.; Kurosawa, Y. Identification of human brown/beige adipose tissue using near-infrared time-resolved spectroscopy. In Proceedings of the SPIE; Available online: https://www.spiedigitallibrary.org/conference-proceedings-of-spie/11237/2545273/Identification-of-human-brown-beige-adipose-tissue-using-near-infrared/10.1117/12.2545273.short?SSO=1 (accessed on 17 April 2020).


| All | WM (n = 155) | VWM (n = 77) | p-Value |
|---|---|---|---|
| [Total-Hb] (μM) | 66.6 ± 20.5 | 75.3 ± 26.1 | <0.05 |
| Age (years) | 40.8 ± 11.7 | 42.2 ± 13.6 | 0.40 |
| Height (cm) | 161.9 ± 8.2 | 166.0 ± 8.4 | <0.01 |
| Weight (kg) | 58.7 ± 11.0 | 62.0 ± 10.6 | <0.05 |
| BMI (kg/m2) | 22.3 ± 3.1 | 22.4 ± 2.5 | 0.85 |
| Skeletal muscle mass (kg) | 23.5 ± 5.0 | 27.0 ± 6.0 | <0.01 |
| Skeletal muscle percentage (%) | 40.1 ± 4.2 | 43.3 ± 4.8 | <0.01 |
| Body fat mass (kg) | 15.7 ± 5.9 | 13.5 ± 4.8 | <0.01 |
| Fat percentage (%) | 26.5 ± 7.0 | 22.0 ± 7.3 | <0.01 |
| Waist circumference (cm) | 43.0 ± 8.0 | 48.5 ± 9.8 | <0.01 |
| Visceral fat area (cm2) | 79.3 ± 8.9 | 79.9 ± 7.3 | 0.60 |
| Fat-free mass (kg) | 61.1 ± 37.6 | 62.1 ± 37.2 | 0.86 |
| Body temperature (°C) | 36.3 ± 0.4 | 36.3 ± 0.4 | 0.50 |
| Heart rate (bpm) | 71.7 ± 9.7 | 69.4 ± 11.9 | 0.14 |
| Systolic blood pressure (mmHg) | 111.7 ± 14.7 | 116.7 ± 14.9 | <0.05 |
| Diastolic blood pressure (mmHg) | 71.0 ± 11.2 | 73.3 ± 10.3 | 0.14 |
| Energy expenditure by physical activity (kcal/week) 1 | 1950 (1231–3651) | 4420 (2183–7883) | <0.01 |
| Physical activity time at vigorous-intensity (min/week) 1 | 0 | 180 (60–360) | <0.01 |
| Physical activity time at moderate-intensity min/week) 1 | 210 (100–510) | 180 (93–470) | 0.49 |
| Physical activity time at intensity of equal to walking (min/week) 1 | 250 (120–480) | 350 (188–660) | <0.05 |
| Women | WM (n = 109) | VWM (n = 36) | p-Value |
|---|---|---|---|
| [Total-Hb] (μM) | 68.1 ± 19.9 | 70.9 ± 21.8 | 0.48 |
| Age (years) | 41.2 ± 12.8 | 45.4 ± 15.7 | 0.15 |
| Height (cm) | 158.2 ± 5.9 | 158.9 ± 5.4 | 0.51 |
| Weight (kg) | 54.2 ± 8.1 | 53.3 ± 4.5 | 0.42 |
| BMI (kg/m2) | 21.6 ± 2.9 | 21.1 ± 1.8 | 0.21 |
| Skeletal muscle mass (kg) | 20.8 ± 2.3 | 21.5 ± 2.8 | 0.10 |
| Skeletal muscle percentage (%) | 38.7 ± 3.6 | 40.4 ± 4.0 | <0.05 |
| Body fat mass (kg) | 15.6 ± 5.7 | 13.9 ± 3.6 | <0.05 |
| Fat percentage (%) | 28.2 ± 6.5 | 26.0 ± 6.0 | 0.08 |
| Waist circumference (cm) | 38.5 ± 3.9 | 39.4 ± 4.2 | 0.26 |
| Visceral fat area (cm2) | 76.7 ± 8.0 | 76.0 ± 5.9 | 0.59 |
| Fat-free mass (kg) | 47.7 ± 26.7 | 42.4 ± 18.5 | 0.27 |
| Body temperature (°C) | 36.3 ± 0.4 | 36.3 ± 0.4 | 0.35 |
| Heart rate (bpm) | 72.2 ± 9.4 | 68.5 ± 10.7 | 0.06 |
| Systolic blood pressure (mmHg) | 108.3 ± 14.4 | 112.8 ± 16.9 | 0.13 |
| Diastolic blood pressure (mmHg) | 68.2 ± 10.9 | 70.4 ± 10.1 | 0.30 |
| Energy expenditure by physical activity (kcal/week) 1 | 2073 (1292–3725) | 4288 (2086–7052) | <0.01 |
| Physical activity time at vigorous-intensity (min/week) 1 | 0 | 160 (60–345) | <0.01 |
| Physical activity time at moderate-intensity min/week) 1 | 240 (95–630) | 255 (120–638) | 0.49 |
| Physical activity time at intensity of equal to walking (min/week) 1 | 280 (128–555) | 350 (165–743) | <0.05 |
| Men | WM (n = 46) | VWM (n = 41) | p-Value |
|---|---|---|---|
| [Total-Hb] (μM) | 63.3 ±21.8 | 79.2 ±29.1 | < 0.01 |
| Age (years) | 39.9 ±8.6 | 39.4 ±10.9 | 0.83 |
| Height (cm) | 170.8 ±5.5 | 172.3 ±4.8 | 0.18 |
| Weight (kg) | 69.5 ±9.2 | 69.7 ±8.2 | 0.92 |
| BMI (kg/m2) | 23.8 ±3.1 | 23.4 ±2.5 | 0.53 |
| Skeletal muscle mass (kg) | 30.0 ±3.1 | 31.8 ±3.1 | <0.01 |
| Skeletal muscle percentage (%) | 43.5 ±3.7 | 45.9 ±3.9 | <0.01 |
| Body fat mass (kg) | 16.0 ±6.3 | 13.2 ±5.7 | <0.05 |
| Fat percentage (%) | 22.5 ±6.4 | 18.5 ±6.6 | <0.01 |
| Waist circumference (cm) | 53.5 ±5.0 | 56.5 ±5.1 | 0.83 |
| Visceral fat area (cm2) | 85.5 ±7.8 | 83.3 ±6.8 | 0.18 |
| Fat-free mass (kg) | 93.5 ±40.6 | 79.3 ±40.9 | 0.92 |
| Body temperature (°C) | 36.2 ±0.4 | 36.3 ±0.4 | 0.53 |
| Heart rate (bpm) | 70.5 ±10.4 | 70.1 ±12.9 | <0.01 |
| Systolic blood pressure (mmHg) | 120.1 ±11.6 | 120.2 ±12.0 | <0.01 |
| Diastolic blood pressure (mmHg) | 77.8 ±9.1 | 75.9 ±9.8 | <0.05 |
| Energy expenditure by physical activity (kcal/week) 1 | 1806 (1061–3539) | 4876 (2530–8629) | <0.01 |
| Physical activity time at vigorous-intensity (min/week) 1 | 0 | 180 (60–360) | <0.01 |
| Physical activity time at moderate-intensity min/week) 1 | 155 (93–308) | 130 (60–300) | 0.93 |
| Physical activity time at intensity of equal to walking (min/week) 1 | 213 (104–360) | 340 (200–585) | <0.01 |
| [Total-Hb] | Univariate Regression | Multivariate Regression | ||
|---|---|---|---|---|
| All | r | p | Standardized β | p |
| Age (years) | −0.07 | 0.16 | - | - |
| BF (%) | −0.50 | <0.01 | −0.39 | <0.01 |
| VFA (cm2) | −0.46 | <0.01 | −0.33 | <0.01 |
| WM-VWM | 0.18 | <0.01 | - | - |
| R2 = 0.34 | ||||
| Women | ||||
| Age (years) | −0.03 | 0.34 | - | - |
| BF (%) | −0.47 | <0.01 | −0.47 | <0.01 |
| VFA (cm2) | −0.44 | <0.01 | - | - |
| WM-VWM | 0.06 | 0.24 | - | - |
| R2 = 0.22 | ||||
| Men | ||||
| Age (years) | −0.12 | 0.13 | - | - |
| BF (%) | −0.64 | <0.01 | - | - |
| VFA (cm2) | −0.66 | <0.01 | −0.62 | <0.01 |
| WM-VWM | 0.32 | <0.01 | 0.21 | <0.05 |
| R2 = 0.47 | ||||
© 2020 by the authors. Licensee MDPI, Basel, Switzerland. This article is an open access article distributed under the terms and conditions of the Creative Commons Attribution (CC BY) license (http://creativecommons.org/licenses/by/4.0/).
Share and Cite
Tanaka, R.; Fuse, S.; Kuroiwa, M.; Amagasa, S.; Endo, T.; Ando, A.; Kime, R.; Kurosawa, Y.; Hamaoka, T. Vigorous-Intensity Physical Activities Are Associated with High Brown Adipose Tissue Density in Humans. Int. J. Environ. Res. Public Health 2020, 17, 2796. https://0-doi-org.brum.beds.ac.uk/10.3390/ijerph17082796
Tanaka R, Fuse S, Kuroiwa M, Amagasa S, Endo T, Ando A, Kime R, Kurosawa Y, Hamaoka T. Vigorous-Intensity Physical Activities Are Associated with High Brown Adipose Tissue Density in Humans. International Journal of Environmental Research and Public Health. 2020; 17(8):2796. https://0-doi-org.brum.beds.ac.uk/10.3390/ijerph17082796
Chicago/Turabian StyleTanaka, Riki, Sayuri Fuse, Miyuki Kuroiwa, Shiho Amagasa, Tasuki Endo, Akira Ando, Ryotaro Kime, Yuko Kurosawa, and Takafumi Hamaoka. 2020. "Vigorous-Intensity Physical Activities Are Associated with High Brown Adipose Tissue Density in Humans" International Journal of Environmental Research and Public Health 17, no. 8: 2796. https://0-doi-org.brum.beds.ac.uk/10.3390/ijerph17082796