
Effects of Ultratrail Running on Neuromuscular Function, Muscle Damage and Hydration Status. Differences According to Training Level

 ,
,  ,
,  , and
, and 
Abstract
:1. Introduction
2. Materials and Methods
2.1. Participants
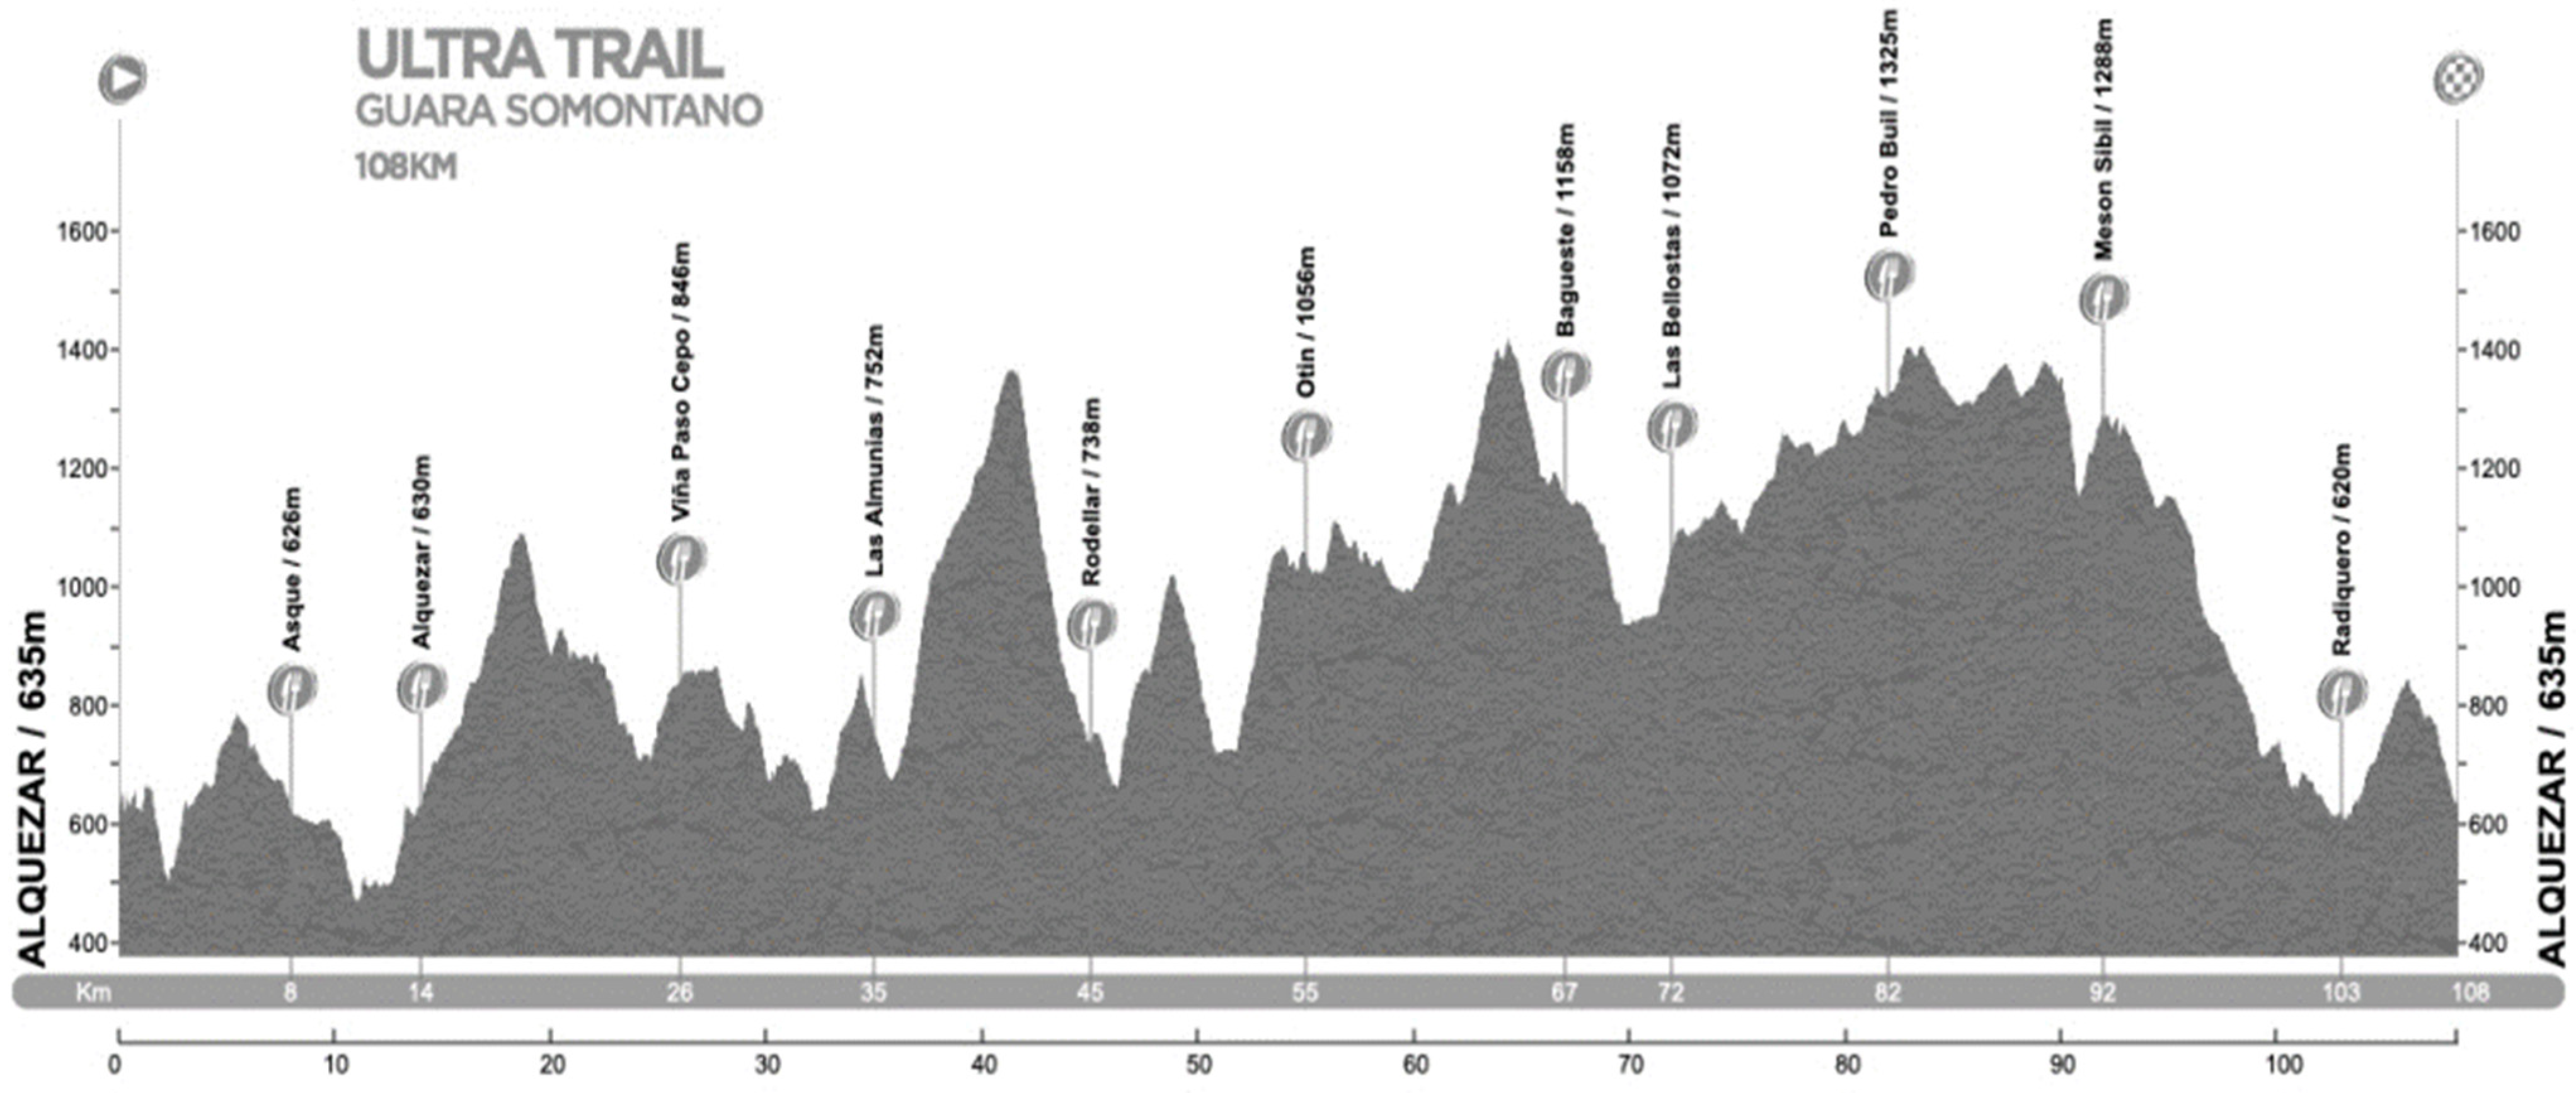
2.2. Procedures
2.3. Anthropometric Measurements
2.4. Physical Performance Evaluation
2.5. Neuromuscular Function
2.6. Blood Samples
2.7. Determining Muscle Damage Markers and Hydration Status
2.8. Statistical Analysis
3. Results
4. Discussion
5. Conclusions
Author Contributions
Funding
Institutional Review Board Statement
Informed Consent Statement
Data Availability Statement
Acknowledgments
Conflicts of Interest
References
- Knechtle, B.; Nikolaidis, P.T. Physiology and Pathophysiology in Ultra-Marathon Running. Front. Physiol. 2018, 9, 634. [Google Scholar] [CrossRef] [PubMed] [Green Version]
- Garbisu-Hualde, A.; Santos-Concejero, J. What are the Limiting Factors During an Ultra-Marathon? A Systematic Review of the Scientific Literature. J. Hum. Kinet. 2020, 72, 129–139. [Google Scholar] [CrossRef] [Green Version]
- Millet, G.P.; Millet, G.Y. Ultramarathon is an outstanding model for the study of adaptive responses to extreme load and stress. BMC Med. 2012, 10, 77. [Google Scholar] [CrossRef] [Green Version]
- Rochat, N.; Gesbert, V.; Seifert, L.; Hauw, D. Enacting Phenomenological Gestalts in Ultra-Trail Running: An Inductive Analysis of Trail Runners’ Courses of Experience. Front. Psychol. 2018, 9, 2038. [Google Scholar] [CrossRef] [PubMed] [Green Version]
- Vernillo, G.; Savoldelli, A.; Zignoli, A.; Trabucchi, P.; Pellegrini, B.; Millet, G.P.; Schena, F. Influence of the world’s most challenging mountain ultra-marathon on energy cost and running mechanics. Graefe’s Arch. Clin. Exp. Ophthalmol. 2014, 114, 929–939. [Google Scholar] [CrossRef] [PubMed]
- Hoffman, M.D.; Ong, J.C.; Wang, G. Historical Analysis of Participation in 161 km Ultramarathons in North America. Int. J. Hist. Sport 2010, 27, 1877–1891. [Google Scholar] [CrossRef]
- Perić, M.; Slavić, N. Event sport tourism business models: The case of trail running. Sport Bus. Manag. Int. J. 2019, 9, 164–184. [Google Scholar] [CrossRef]
- Peter, L.; Rust, C.; Knechtle, B.; Rosemann, T.; Lepers, R. Sex differences in 24 hour ultra-marathon performance—A retrospective data analysis from 1977 to 2012. Clinics 2014, 69, 38–46. [Google Scholar] [CrossRef]
- Urbaneja, J.S.; Torbidoni, E.I.F. EI Trail running in Spain. Origin, evolution and current situation. Retos Nuevas Tend. Educ. Física Deport. Recreación 2018, 33, 123–128. [Google Scholar]
- Scheer, V. Participation Trends of Ultra Endurance Events. Sports Med. Arthrosc. Rev. 2019, 27, 3–7. [Google Scholar] [CrossRef]
- Fornasiero, A.; Savoldelli, A.; Fruet, D.; Boccia, G.; Pellegrini, B.; Schena, F. Physiological intensity profile, exercise load and performance predictors of a 65 km mountain ultra-marathon. J. Sports Sci. 2017, 36, 1287–1295. [Google Scholar] [CrossRef] [Green Version]
- Clemente-Suárez, V.J. Psychophysiological response and energy balance during a 14 h ultraendurance mountain running event. Appl. Physiol. Nutr. Metab. 2015, 40, 269–273. [Google Scholar] [CrossRef]
- Ramos-Campo, D.J.; Ávila-Gandía, V.; Alacid, F.; Soto-Méndez, F.; Alcaraz, P.E.; López-Román, F.J.; Rubio-Arias, J. Ángel Muscle damage, physiological changes, and energy balance in ultra-endurance mountain-event athletes. Appl. Physiol. Nutr. Metab. 2016, 41, 872–878. [Google Scholar] [CrossRef] [Green Version]
- Linderman, J.K.; Laubach, L.L. Energy balance during 24 hours of treadmill running. J. Exerc. Physiol. Online 2004, 7, 37–44. [Google Scholar]
- Clemente, V.J. Modificaciones de parámetros bioquímicos después de una maratón de montaña. Eur. J. Hum. Mov. 2011, 27, 75–83. [Google Scholar]
- Jeukendrup, A.E.; Moseley, L.; Mainwaring, G.I.; Samuels, S.; Perry, S.; Mann, C.H. Exogenous carbohydrate oxidation during ultraendurance exercise. J. Appl. Physiol. 2006, 100, 1134–1141. [Google Scholar] [CrossRef]
- Townshend, A.D.; Worringham, C.J.; Stewart, I.B. Spontaneous Pacing during Overground Hill Running. Med. Sci. Sports Exerc. 2010, 42, 160–169. [Google Scholar] [CrossRef] [PubMed] [Green Version]
- Born, D.-P.; Stöggl, T.; Swarén, M.; Björklund, G. Near-Infrared Spectroscopy: More Accurate Than Heart Rate for Monitoring Intensity in Running in Hilly Terrain. Int. J. Sports Physiol. Perform. 2017, 12, 440–447. [Google Scholar] [CrossRef] [PubMed]
- Rojas-Valverde, D.; Sánchez-Ureña, B.; Pino-Ortega, J.; Gómez-Carmona, C.; Gutiérrez-Vargas, R.; Timón, R.; Olcina, G. External Workload Indicators of Muscle and Kidney Mechanical Injury in Endurance Trail Running. Int. J. Environ. Res. Public Health 2019, 16, 3909. [Google Scholar] [CrossRef] [Green Version]
- Carmona, G.; Roca, E.; Guerrero, M.; Cussó, R.; Irurtia, A.; Nescolarde, L.; Brotons, D.; Bedini, J.L.; Cadefau, J.A. Sarcomere Disruptions of Slow Fiber Resulting From Mountain Ultramarathon. Int. J. Sports Physiol. Perform. 2015, 10, 1041–1047. [Google Scholar] [CrossRef] [PubMed] [Green Version]
- Saugy, J.; Place, N.; Millet, G.Y.; Degache, F.; Schena, F.; Millet, G.P. Alterations of Neuromuscular Function after the World’s Most Challenging Mountain Ultra-Marathon. PLoS ONE 2013, 8, e65596. [Google Scholar] [CrossRef] [PubMed] [Green Version]
- Millet, G.Y.; Tomazin, K.; Verges, S.; Vincent, C.; Bonnefoy, R.; Boisson, R.-C.; Gergelé, L.; Féasson, L.; Martin, V. Neuromuscular Consequences of an Extreme Mountain Ultra-Marathon. PLoS ONE 2011, 6, e17059. [Google Scholar] [CrossRef] [Green Version]
- Judelson, D.A.; Maresh, C.M.; Farrell, M.J.; Yamamoto, L.M.; Armstrong, L.E.; Kraemer, W.J.; Volek, J.S.; Spiering, B.A.; Casa, D.J.; Anderson, J.M. Effect of Hydration State on Strength, Power, and Resistance Exercise Performance. Med. Sci. Sports Exerc. 2007, 39, 1817–1824. [Google Scholar] [CrossRef] [PubMed]
- Murray, B. Hydration and Physical Performance. J. Am. Coll. Nutr. 2007, 26, 542S–548S. [Google Scholar] [CrossRef]
- Campa, F.; Piras, A.; Raffi, M.; Trofè, A.; Perazzolo, M.; Mascherini, G.; Toselli, S. The Effects of Dehydration on Metabolic and Neuromuscular Functionality during Cycling. Int. J. Environ. Res. Public Health 2020, 17, 1161. [Google Scholar] [CrossRef] [Green Version]
- Castro Sepúlveda, M.; Cerda Kohler, H.; Pérez Luco, C.; Monsalves, M.; Andrade, D.C.; Hermann, Z.F.; Báez San Martín, E.; Ramírez Campillo, R. Hydration status after exercise affect resting metabolic rate and heart rate variability. Nutr. Hosp. 2014, 17, 1273–1277. [Google Scholar]
- Barley, O.R.; Chapman, D.W.; Blazevich, A.J.; Abbiss, C.R. Acute Dehydration Impairs Endurance Without Modulating Neuromuscular Function. Front. Physiol. 2018, 9, 1562. [Google Scholar] [CrossRef] [PubMed]
- Casa, D.J.; Stearns, R.L.; Lopez, R.M.; Ganio, M.S.; McDermott, B.P.; Yeargin, S.W.; Yamamoto, L.M.; Mazerolle, S.M.; Roti, M.W.; Armstrong, L.E.; et al. Influence of Hydration on Physiological Function and Performance During Trail Running in the Heat. J. Athl. Train. 2010, 45, 147–156. [Google Scholar] [CrossRef] [PubMed]
- Judelson, D.A.; Maresh, C.M.; Anderson, J.M.; Armstrong, L.E.; Casa, D.J.; Kraemer, W.J.; Volek, J.S. Hydration and Muscular Performance. Sports Med. 2007, 37, 907–921. [Google Scholar] [CrossRef] [PubMed]
- Rojas-Valverde, D.; Sánchez-Ureña, B.; Crowe, J.; Timón, R.; Olcina, G.J. Exertional rhabdomyolysis and acute kidney injury in endurance sports: A systematic review. Eur. J. Sport Sci. 2021, 21, 261–274. [Google Scholar] [CrossRef] [PubMed]
- Collado Andrés, C.; Hernando, B.; Hernando, C.; Martínez-Cadenas, C. ¿ Qué repercusión a nivel fisiológico puede tener realizar una carrera de ultratrail? Ágora Salut. 2020, 7, 57–66. [Google Scholar] [CrossRef]
- Khodaee, M.; Spittler, J.; VanBaak, K.; Changstrom, B.; Hill, J. Effects of Running an Ultramarathon on Cardiac, Hematologic, and Metabolic Biomarkers. Int. J. Sports Med. 2015, 36, 867–871. [Google Scholar] [CrossRef] [PubMed]
- Oliveira-Rosado, J.; Duarte, J.P.; Sousa-E.-Silva, P.; Costa, D.C.; Martinho, D.V.; Sarmento, H.; Valente-Dos-Santos, J.; Rama, L.M.; Tavares, Ó.M.; Conde, J.; et al. Physiological profile of adult male long-distance trail runners: Variations according to competitive level (national or regional). Einstein (São Paulo) 2020, 18, eAO5256. [Google Scholar] [CrossRef] [PubMed]
- Hohl, R.; de Rezende, F.N.; Millet, G.Y.; da Mota, G.R.; Marocolo, M. Blood cardiac biomarkers responses are associated with 24 h ultramarathon performance. Heliyon 2019, 5, e01913. [Google Scholar] [CrossRef] [PubMed] [Green Version]
- Porta, J.; Galiano, D.; Tejedo, A.; González, J.M. Valoración de la composición corporal. Utopías y realidades. In Manual de Cineantropometría; Esparza Ros, F., Ed.; Ágora para la Educación Física y el Deporte: Madrid, Spain, 1993; pp. 113–170. [Google Scholar]
- Lee, R.C.; Wang, Z.; Heo, M.; Ross, R.; Janssen, I.; Heymsfield, S.B. Total-body skeletal muscle mass: Development and cross-validation of anthropometric prediction models. Am. J. Clin. Nutr. 2000, 72, 796–803. [Google Scholar] [CrossRef] [PubMed]
- Stewart, A.; Marfell-Jones, M. International Society for Advancement of Kinanthropometry International Standards for Anthropometric Assessment; International Society for the Advancement of Kinanthropometry: Lower Hutt, New Zealand, 2011; ISBN 0620362073 9780620362078. [Google Scholar]
- Komi, P.V.; Bosco, C. Utilization of stored elastic energy in leg extensor muscles by men and women. Med. Sci. Sports 1978, 10, 261–265. [Google Scholar] [PubMed]
- Bosco, C.; Luhtanen, P.; Komi, P.V. A simple method for measurement of mechanical power in jumping. Eur. J. Appl. Physiol. Occup. Physiol. 1983, 50, 273–282. [Google Scholar] [CrossRef] [PubMed]
- Rodríguez-Rosell, D.; Mora-Custodio, R.; Franco-Márquez, F.; Yáñez-García, J.M.; González-Badillo, J.J. Traditional vs. Sport-Specific Vertical Jump Tests: Reliability, Validity, and Relationship With the Legs Strength and Sprint Performance in Adult and Teen Soccer and Basketball Players. J. Strength Cond. Res. 2017, 31, 196–206. [Google Scholar] [CrossRef] [PubMed]
- Bosco, C.; Ito, A.; Komi, P.V.; Luhtanen, P.; Rahkila, P.; Rusko, H.; Viitasalo, J.T. Neuromuscular function and mechanical efficiency of human leg extensor muscles during jumping exercises. Acta Physiol. Scand. 1982, 114, 543–550. [Google Scholar] [CrossRef] [PubMed]
- Hopkins, W.G.; Marshall, S.W.; Batterham, A.M.; Hanin, J. Progressive Statistics for Studies in Sports Medicine and Exercise Science. Med. Sci. Sports Exerc. 2009, 41, 3–12. [Google Scholar] [CrossRef] [Green Version]
- Méndez-Alonso, D.; Prieto-Saborit, J.; Bahamonde, J.; Jiménez-Arberás, E. Influence of Psychological Factors on the Success of the Ultra-Trail Runner. Int. J. Environ. Res. Public Health 2021, 18, 2704. [Google Scholar] [CrossRef]
- Suter, D.; Sousa, C.V.; Hill, L.; Scheer, V.; Nikolaidis, P.T.; Knechtle, B. Even Pacing Is Associated with Faster Finishing Times in Ultramarathon Distance Trail Running—The “Ultra-Trail du Mont Blanc” 2008–2019. Int. J. Environ. Res. Public Health 2020, 17, 7074. [Google Scholar] [CrossRef] [PubMed]
- Robert, M.; Stauffer, E.; Nader, E.; Skinner, S.; Boisson, C.; Cibiel, A.; Feasson, L.; Renoux, C.; Robach, P.; Joly, P.; et al. Impact of Trail Running Races on Blood Viscosity and Its Determinants: Effects of Distance. Int. J. Mol. Sci. 2020, 21, 8531. [Google Scholar] [CrossRef] [PubMed]
- Matos, S.; Clemente, F.M.; Silva, R.; Pereira, J.; Carral, J.M.C. Performance and Training Load Profiles in Recreational Male Trail Runners: Analyzing Their Interactions during Competitions. Int. J. Environ. Res. Public Health 2020, 17, 8902. [Google Scholar] [CrossRef]
- Abos, A.; Gonzalez, L.G.; Solana, A.A.; Serrano, J.S.; Sanz, M. RICYDE. Revista internacional de ciencias del deporte. RICYDE. Rev. Int. Cienc. Deport. 2016, 10, 43–56. [Google Scholar] [CrossRef]
- Belli, T.; Macedo, D.V.; De Araújo, G.G.; Dos Reis, I.G.M.; Scariot, P.P.M.; Lazarim, F.L.; Nunes, L.A.S.; Brenzikofer, R.; Gobatto, C.A. Mountain Ultramarathon Induces Early Increases of Muscle Damage, Inflammation, and Risk for Acute Renal Injury. Front. Physiol. 2018, 9, 1368. [Google Scholar] [CrossRef] [PubMed]
- Zanchi, D.; Viallon, M.; Le Goff, C.; Millet, G.P.; Giardini, G.; Croisille, P.; Haller, S. Extreme Mountain Ultra-Marathon Leads to Acute but Transient Increase in Cerebral Water Diffusivity and Plasma Biomarkers Levels Changes. Front. Physiol. 2017, 7, 664. [Google Scholar] [CrossRef] [Green Version]
- Martínez-Navarro, I.; Sanchez-Gómez, J.M.; Aparicio, I.; Priego-Quesada, J.I.; Pérez-Soriano, P.; Collado, E.; Hernando, B.; Hernando, C. Effect of mountain ultramarathon distance competition on biochemical variables, respiratory and lower-limb fatigue. PLoS ONE 2020, 15, e0238846. [Google Scholar] [CrossRef] [PubMed]
- Balducci, P.; Clémençon, M.; Trama, R.; Blache, Y.; Hautier, C. Performance factors in a mountain ultramarathon. Int. J. Sports Med. 2017, 38, 819–826. [Google Scholar] [CrossRef]
- Gatterer, H.; Schenk, K.; Wille, M.; Raschner, C.; Faulhaber, M.; Ferrari, M.; Burtscher, M. Race Performance and Exercise Intensity of Male Amateur Mountain Runners During a Multistage Mountain Marathon Competition Are Not Dependent on Muscle Strength Loss or Cardiorespiratory Fitness. J. Strength Cond. Res. 2013, 27, 2149–2156. [Google Scholar] [CrossRef] [PubMed]
- Rousanoglou, E.N.; Noutsos, K.; Pappas, A.; Bogdanis, G.; Vagenas, G.; Bayios, I.A.; Boudolos, K.D. Alterations of Vertical Jump Mechanics after a Half-Marathon Mountain Running Race. J. Sports Sci. Med. 2016, 15, 277–286. [Google Scholar] [PubMed]
- Giandolini, M.; Gimenez, P.; Temesi, J.; Arnal, P.J.; Martin, V.; Rupp, T.; Morin, J.-B.; Samozino, P.; Millet, G.Y. Effect of the Fatigue Induced by a 110-km Ultramarathon on Tibial Impact Acceleration and Lower Leg Kinematics. PLoS ONE 2016, 11, e0151687. [Google Scholar] [CrossRef]
- Fitts, R.H. Cellular mechanisms of muscle fatigue. Physiol. Rev. 1994, 74, 49–94. [Google Scholar] [CrossRef] [PubMed]
- Urdampilleta, A.; Arribalzaga, S.; Viribay, A.; Castañeda-Babarro, A.; Seco-Calvo, J.; Mielgo-Ayuso, J. Effects of 120 vs. 60 and 90 g/h Carbohydrate Intake during a Trail Marathon on Neuromuscular Function and High Intensity Run Capacity Recovery. Nutrients 2020, 12, 2094. [Google Scholar] [CrossRef] [PubMed]
- Wu, P.P.-Y.; Sterkenburg, N.; Everett, K.; Chapman, D.W.; White, N.; Mengersen, K. Predicting fatigue using countermovement jump force-time signatures: PCA can distinguish neuromuscular versus metabolic fatigue. PLoS ONE 2019, 14, e0219295. [Google Scholar] [CrossRef] [PubMed] [Green Version]
- Jiménez-Reyes, P.; Pareja-Blanco, F.; Cuadrado-Peñafiel, V.; Ortega-Becerra, M.; Párraga, J.; González-Badillo, J.J. Jump height loss as an indicator of fatigue during sprint training. J. Sports Sci. 2017, 37, 1029–1037. [Google Scholar] [CrossRef] [PubMed]
- Watkins, C.M.; Barillas, S.R.; Wong, M.A.; Archer, D.C.; Dobbs, I.J.; Lockie, R.G.; Coburn, J.W.; Tran, T.T.; Brown, L.E. Determination of Vertical Jump as a Measure of Neuromuscular Readiness and Fatigue. J. Strength Cond. Res. 2017, 31, 3305–3310. [Google Scholar] [CrossRef]
- Chambers, C.; Noakes, T.D.; Lambert, E.V.; Lambert, M.I. Time course of recovery of vertical jump height and heart rate versus running speed after a 90-km foot race. J. Sports Sci. 1998, 16, 645–651. [Google Scholar] [CrossRef]
- El-Ashker, S.; Chaabene, H.; Prieske, O.; Abdelkafy, A.; Ahmed, M.A.; Muaidi, Q.I.; Granacher, U. Effects of Neuromuscular Fatigue on Eccentric Strength and Electromechanical Delay of the Knee Flexors: The Role of Training Status. Front. Physiol. 2019, 10, 782. [Google Scholar] [CrossRef] [Green Version]
- Claudino, J.G.; Cronin, J.; Mezêncio, B.; McMaster, D.T.; McGuigan, M.; Tricoli, V.; Amadio, A.C.; Serrão, J.C. The countermovement jump to monitor neuromuscular status: A meta-analysis. J. Sci. Med. Sport 2017, 20, 397–402. [Google Scholar] [CrossRef]
- Da Ponte, A.; Giovanelli, N.; Antonutto, G.; Nigris, D.; Curcio, F.; Cortese, P.; Lazzer, S. Changes in cardiac and muscle biomarkers following an uphill-only marathon. Res. Sports Med. 2017, 26, 100–111. [Google Scholar] [CrossRef] [PubMed]
- Kłapcińska, B.; Waśkiewicz, Z.; Chrapusta, S.J.; Sadowska-Krępa, E.; Czuba, M.; Langfort, J. Metabolic responses to a 48-h ultra-marathon run in middle-aged male amateur runners. Graefe’s Arch. Clin. Exp. Ophthalmol. 2013, 113, 2781–2793. [Google Scholar] [CrossRef] [PubMed] [Green Version]
- Mrakic-Sposta, S.; Gussoni, M.; Moretti, S.; Pratali, L.; Giardini, G.; Tacchini, P.; Dellanoce, C.; Tonacci, A.; Mastorci, F.; Borghini, A.; et al. Effects of Mountain Ultra-Marathon Running on ROS Production and Oxidative Damage by Micro-Invasive Analytic Techniques. PLoS ONE 2015, 10, e0141780. [Google Scholar] [CrossRef] [PubMed] [Green Version]
- Skenderi, K.P.; Kavouras, S.A.; Anastasiou, C.A.; Yiannakouris, N.; Matalas, A.-L. Exertional Rhabdomyolysis during a 246-km Continuous Running Race. Med. Sci. Sports Exerc. 2006, 38, 1054–1057. [Google Scholar] [CrossRef] [Green Version]
- Del Coso, J.; Salinero, J.J.; Abián-Vicen, J.; González-Millán, C.; Garde, S.; Vega, P.; Pérez-González, B. Influence of body mass loss and myoglobinuria on the development of muscle fatigue after a marathon in a warm environment. Appl. Physiol. Nutr. Metab. 2013, 38, 286–291. [Google Scholar] [CrossRef]
- Friden, J.; Sjöström, M.; Ekblom, B. Myofibrillar damage following intense eccentric exercise in man. Int. J. Sports Med. 1983, 4, 170–176. [Google Scholar] [CrossRef]
- Nagel, D.; Seiler, D.; Franz, H.; Jung, K. Ultra-Long-Distance Running and the Liver*. Int. J. Sports Med. 1990, 11, 441–445. [Google Scholar] [CrossRef]
- Prati, D.; Taioli, E.; Zanella, A.; Della Torre, E.; Butelli, S.; Del Vecchio, E.; Vianello, L.; Zanuso, F.; Mozzi, F.; Milani, S.; et al. Updated Definitions of Healthy Ranges for Serum Alanine Aminotransferase Levels. Ann. Intern. Med. 2002, 137, 1–10. [Google Scholar] [CrossRef]
- Wu, H.-J.; Chen, K.-T.; Shee, B.-W.; Chang, H.-C.; Huang, Y.-J.; Yang, R.-S. Effects of 24 h ultra-marathon on biochemical and hematological parameters. World J. Gastroenterol. 2004, 10, 2711–2714. [Google Scholar] [CrossRef]
- De Paz, J.A.; Villa, J.G.; López, P.; González-Gallego, J. Effects of long-distance running on serum bilirubin. Med. Sci. Sports Exerc. 1995, 27, 1590–1594. [Google Scholar] [CrossRef]
- Shin, K.; Jee, H.; Lee, Y.; Kim, T.K.; Kim, H.S.; Park, Y.; Kim, Y. Effects of an extreme endurance ultra-marathon on musculoskeletal and hematologic functions. Gazz. Medica Ital. Arch. Sci. Med. 2014, 173, 283–289. [Google Scholar]
- Jastrzębski, Z.; Żychowska, M.; Jastrzębska, M.; Prusik, K.; Prusik, K.; Kortas, J.; Ratkowski, W.; Konieczna, A.; Radzimiński, Ł. Changes in blood morphology and chosen biochemical parameters in ultra-marathon runners during a 100-km run in relation to the age and speed of runners. Int. J. Occup. Med. Environ. Health 2016, 29, 801–814. [Google Scholar] [CrossRef] [PubMed]
- Witek, K.; Ścisłowska, J.; Turowski, D.; Lerczak, K.; Lewandowska-Pachecka, S.; Pokrywka, A. Total bilirubin in athletes, determination of reference range. Biol. Sport 2017, 1, 45–48. [Google Scholar] [CrossRef]
- Mena, P.; Maynar, M.; Gutiérrez, J.M.; Maynar, J.; Timon, J.; Campillo, J.E. Erythrocyte Free Radical Scavenger Enzymes in Bicycle Professional Racers. Adaptation to Training. Int. J. Sports Med. 1991, 12, 563–566. [Google Scholar] [CrossRef]
- Powers, S.K.; Deminice, R.; Ozdemir, M.; Yoshihara, T.; Bomkamp, M.P.; Hyatt, H. Exercise-induced oxidative stress: Friend or foe? J. Sport Health Sci. 2020, 9, 415–425. [Google Scholar] [CrossRef]
- Žákovská, A.; Knechtle, B.; Chlíbková, D.; Miličková, M.; Rosemann, T.; Nikolaidis, P.T. The Effect of a 100-km Ultra-Marathon under Freezing Conditions on Selected Immunological and Hematological Parameters. Front. Physiol. 2017, 8, 638. [Google Scholar] [CrossRef] [Green Version]
- Rowlands, D.S.; Pearce, E.; Aboud, A.; Gillen, J.B.; Gibala, M.J.; Donato, S.; Waddington, J.M.; Green, J.G.; Tarnopolsky, M.A. Oxidative stress, inflammation, and muscle soreness in an 894-km relay trail run. Graefe’s Arch. Clin. Exp. Ophthalmol. 2012, 112, 1839–1848. [Google Scholar] [CrossRef]
- Wells, C.L.; Stern, J.R.; Hecht, L.H. Hematological changes following a marathon race in male and female runners. Graefe’s Arch. Clin. Exp. Ophthalmol. 1982, 48, 41–49. [Google Scholar] [CrossRef]
- Tossige-Gomes, R.; Ottone, V.; Oliveira, P.; Viana, D.; Araújo, T.; Gripp, F.; Rocha-Vieira, E. Leukocytosis, muscle damage and increased lymphocyte proliferative response after an adventure sprint race. Braz. J. Med. Biol. Res. 2014, 47, 492–498. [Google Scholar] [CrossRef] [Green Version]
- Simpson, R.J.; Kunz, H.; Agha, N.; Graff, R. Exercise and the Regulation of Immune Functions. Prog. Mol. Biol. Transl. Sci. 2015, 135, 355–380. [Google Scholar] [CrossRef] [PubMed]
- Foster, N.K.; Martyn, J.B.; Rangno, R.E.; Hogg, J.C.; Pardy, R.L. Leukocytosis of exercise: Role of cardiac output and catecholamines. J. Appl. Physiol. 1986, 61, 2218–2223. [Google Scholar] [CrossRef] [PubMed]
- Newmark, S.R.; Toppo, F.R.; Adams, G. Fluid and electrolyte replacement in the ultramarathon runner. Am. J. Sports Med. 1991, 19, 389–391. [Google Scholar] [CrossRef] [PubMed]
- Bouscaren, N.; Faricier, R.; Millet, G.; Racinais, S. Heat Acclimatization, Cooling Strategies, and Hydration during an Ultra-Trail in Warm and Humid Conditions. Nutrients 2021, 13, 1085. [Google Scholar] [CrossRef] [PubMed]
- Lipman, G.S.; Krabak, B.J.; Waite, B.L.; Logan, S.B.; Menon, A.; Chan, G.K. A Prospective Cohort Study of Acute Kidney Injury in Multi-stage Ultramarathon Runners: The Biochemistry in Endurance Runner Study (BIERS). Res. Sports Med. 2014, 22, 185–192. [Google Scholar] [CrossRef] [PubMed]
- Kao, W.-F.; Hou, S.-K.; Chiu, Y.-H.; Chou, S.-L.; Kuo, F.-C.; Wang, S.-H.; Chen, J.-J. Effects of 100-km Ultramarathon on Acute Kidney Injury. Clin. J. Sport Med. 2015, 25, 49–54. [Google Scholar] [CrossRef] [PubMed]
- Reid, S.A.; King, M.J. Serum Biochemistry and Morbidity Among Runners Presenting for Medical Care After an Australian Mountain Ultramarathon. Clin. J. Sport Med. 2007, 17, 307–310. [Google Scholar] [CrossRef] [PubMed]
- Chlíbková, D.; Rosemann, T.; Posch, L.; Matoušek, R.; Knechtle, B. Pre- and Post-Race Hydration Status in Hyponatremic and Non-Hyponatremic Ultra-Endurance Athletes. Chin. J. Physiol. 2016, 59, 173–183. [Google Scholar] [CrossRef] [Green Version]
- Cejka, C.; Knechtle, B.; Knechtle, P.; Rüst, C.A.; Rosemann, T. An increased fluid intake leads to feet swelling in 100-km ultra-marathoners—An observational field study. J. Int. Soc. Sports Nutr. 2012, 9, 11. [Google Scholar] [CrossRef] [Green Version]
- Burge, J.; Knechtle, B.; Knechtle, P.; Gnädinger, M.; Rüst, C.A.; Rosemann, T. Maintained Serum Sodium in Male Ultra-Marathoners—The Role of Fluid Intake, Vasopressin, and Aldosterone in Fluid and Electrolyte Regulation. Horm. Metab. Res. 2012, 44, 711. [Google Scholar] [CrossRef] [Green Version]
- Hoffman, M.D.; Stuempfle, K.J.; Fogard, K.; Hew-Butler, T.; Winger, J.; Weiss, R.H. Urine dipstick analysis for identification of runners susceptible to acute kidney injury following an ultramarathon. J. Sports Sci. 2013, 31, 20–31. [Google Scholar] [CrossRef]
- Noakes, T.D.; Carter, J.W. Biochemical parameters in athletes before and after having run 160 kilometres. South. Afr. Med. J. 1976, 50, 1562–1566. [Google Scholar]
- Schutte, J.E.; Longhurst, J.C.; Gaffney, F.A.; Bastian, B.C.; Blomqvist, C.G. Total plasma creatinine: An accurate measure of total striated muscle mass. J. Appl. Physiol. 1981, 51, 762–766. [Google Scholar] [CrossRef] [PubMed]
- Viribay, A.; Arribalzaga, S.; Mielgo-Ayuso, J.; Castañeda-Babarro, A.; Seco-Calvo, J.; Urdampilleta, A. Effects of 120 g/h of Carbohydrates Intake during a Mountain Marathon on Exercise-Induced Muscle Damage in Elite Runners. Nutrients 2020, 12, 1367. [Google Scholar] [CrossRef] [PubMed]


| Parameters | Amateur Level (n = 10) | High Level (n = 10) | p |
|---|---|---|---|
| Age (years) | 43.30 ± 4.52 | 41.40 ± 6.18 | 0.443 |
| Height (m) | 1.77 ± 0.06 | 1.76 ± 0.06 | 0.780 |
| Experience (year) | 5.80 ± 2.52 | 4.60 ± 1.26 | 0.196 |
| Weekly training (h) | 6.50 ± 0.70 | 11.05 ± 2.94 | <0.001 |
| Annual slopes (m) | 33,716.7 ± 4427.7 | 56,426.6 ± 8184.6 | 0.001 |
| Parameters | Amateur Level (n = 10) | High Level (n = 10) | p |
|---|---|---|---|
| Time during the race (h) | 19.87 ± 1.84 | 15.31 ± 0.81 | <0.001 |
| VO2max (L/min) | 4.11 ± 0.37 | 4.46 ± 0.45 | 0.079 |
| HRmax (bpm) | 179.50 ± 7.20 | 177.29 ± 6.76 | 0.605 |
| Maximum speed (km/h) | 15.00 ± 0.81 | 16.40 ± 0.96 | 0.003 |
| Fat mass (%) | 10.72 ± 2.28 | 8.83 ± 1.45 | 0.040 |
| Muscle mass (%) | 43.40 ± 3.65 | 45.07 ± 2.93 | 0.276 |
| Water intake (L) | 9.64 ± 3.08 | 11.17 ± 3.79 | 0.337 |
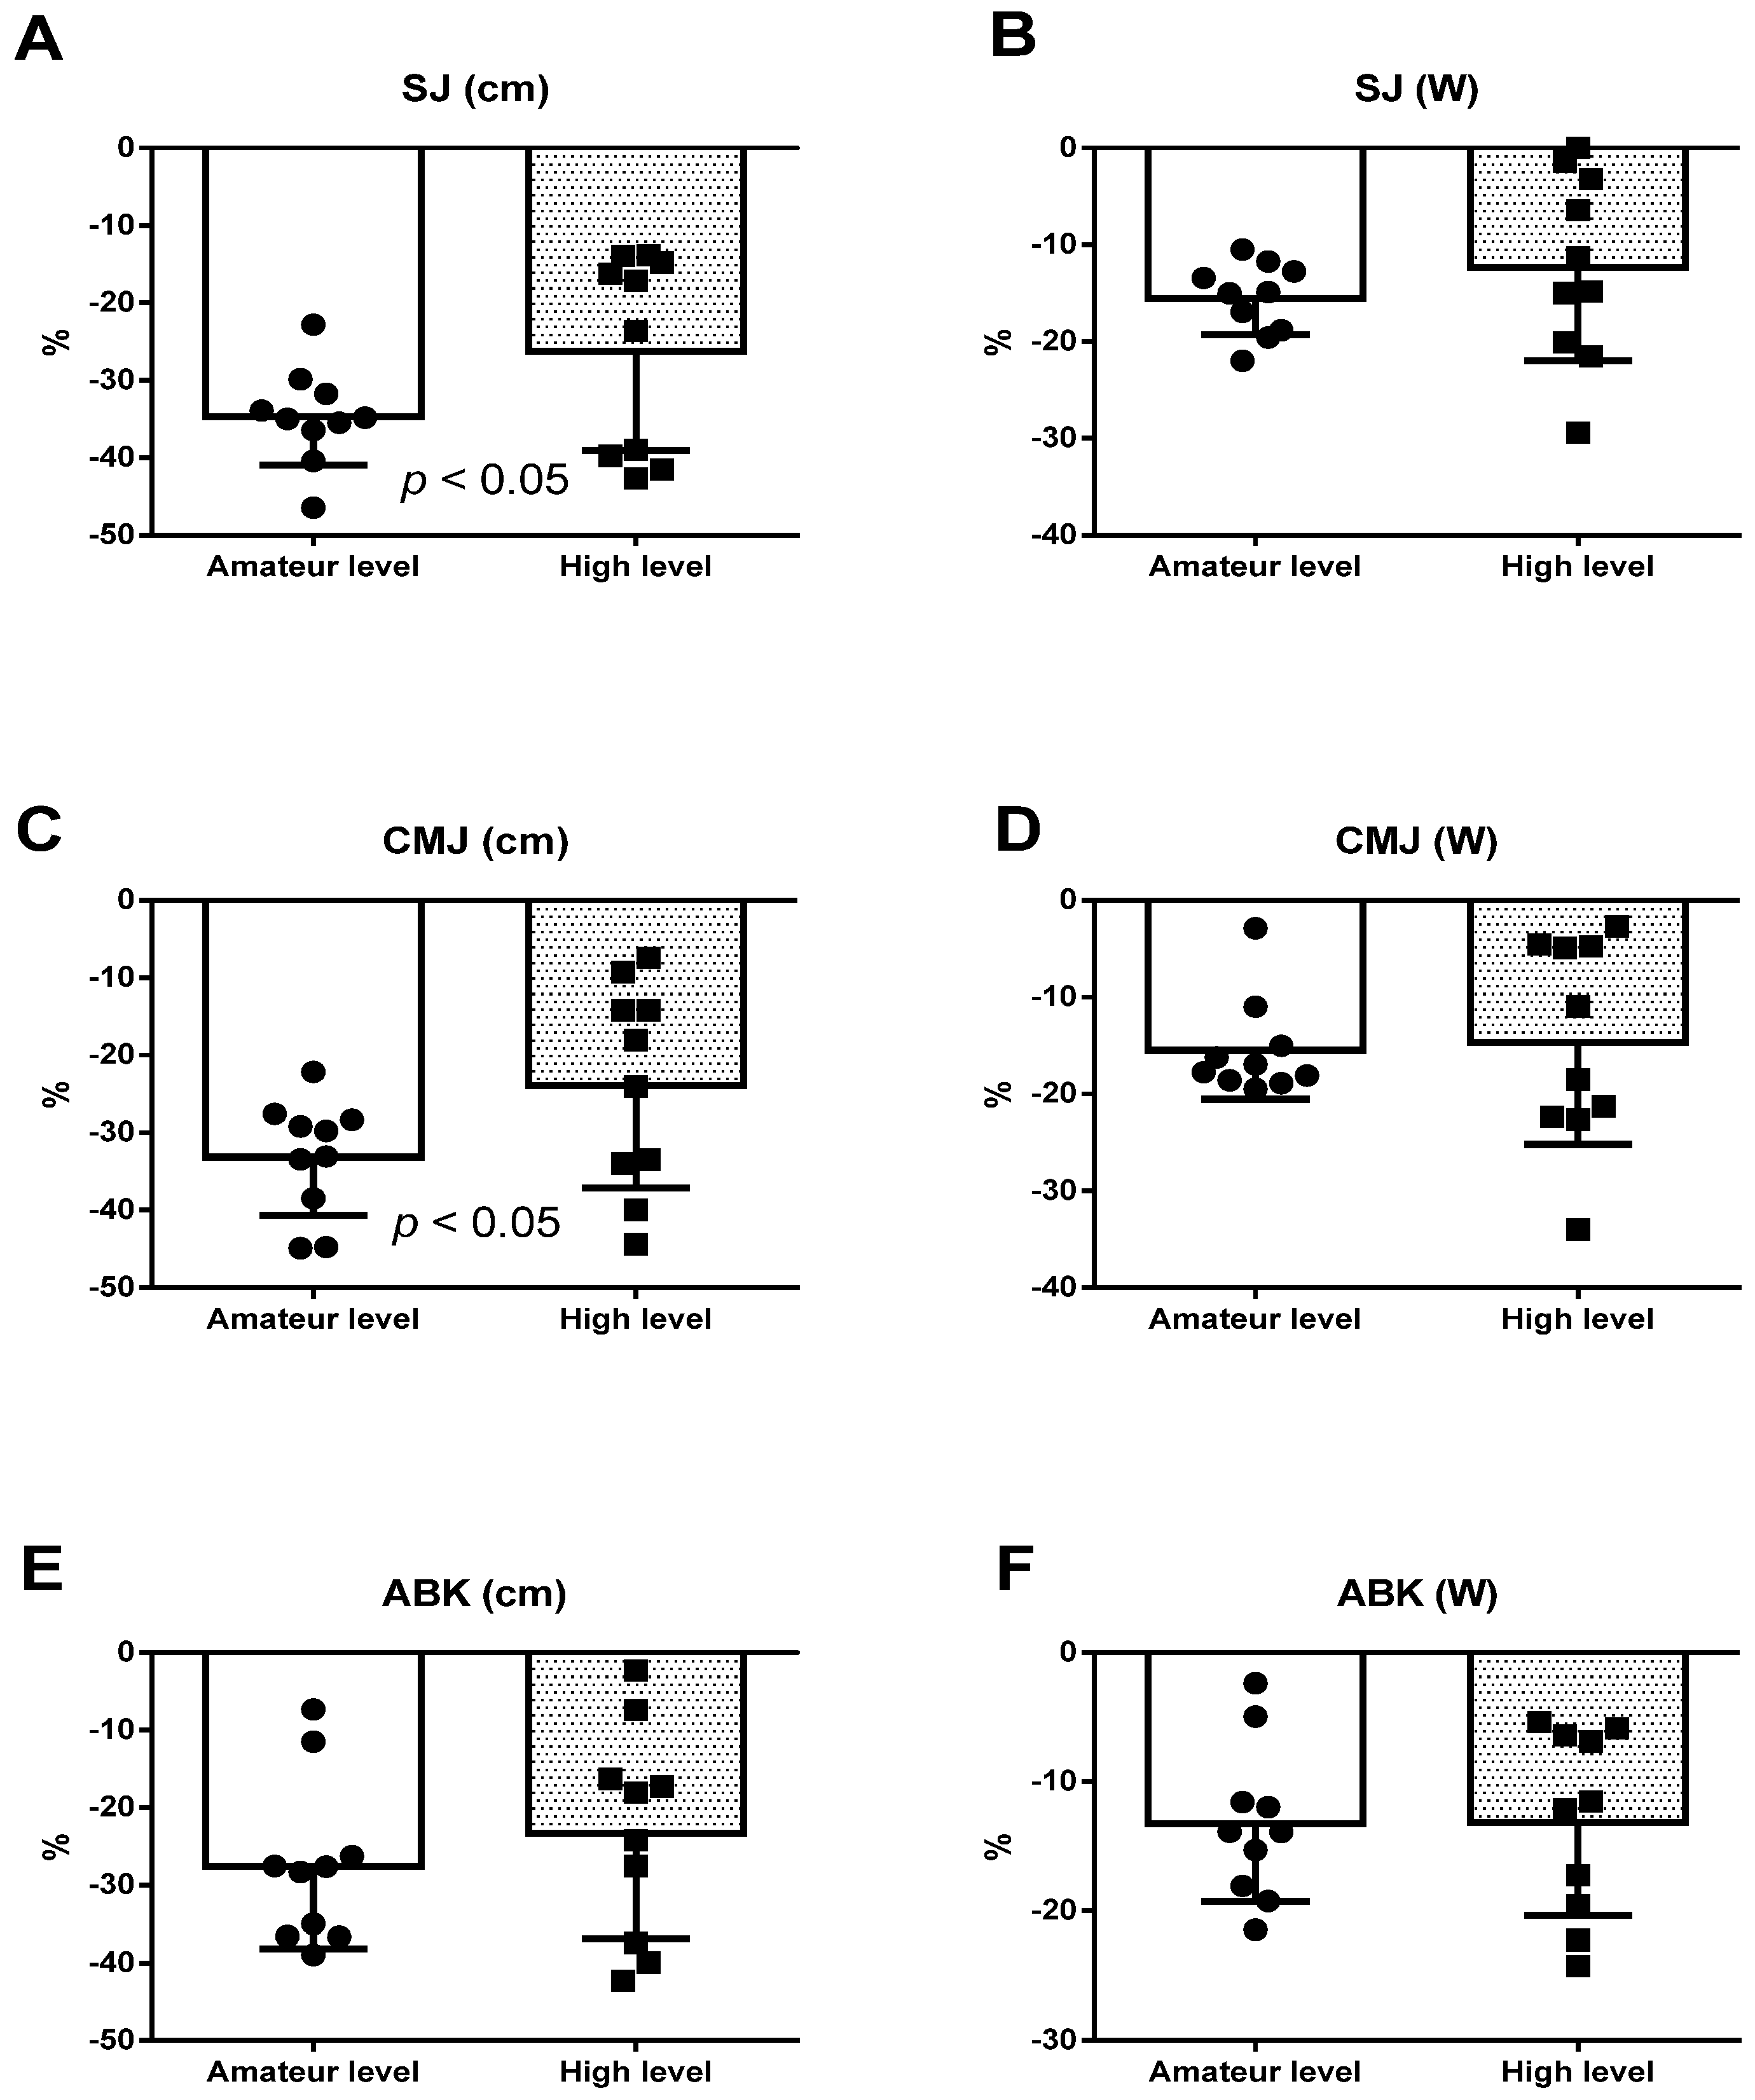
| Parameters | Time | Amateur Level (n = 10) | High Level (n = 10) | Group Effect | η2 | Race Effect | η2 | Group x Race | η2 |
|---|---|---|---|---|---|---|---|---|---|
| SJ (cm) | Pre | 25.50 ± 4.38 | 27.12 ± 5.29 | 0.102 | 0.072 | <0.001 | 0.470 | 0.597 | 0.008 |
| Post | 16.74 ± 3.91 | 19.87 ± 4.31 | |||||||
| CMJ (cm) | Pre | 29.86 ± 5.08 | 31.14 ± 6.33 | 0.182 | 0.049 | <0.001 | 0.430 | 0.554 | 0.010 |
| Post | 20.11 ± 5.01 | 23.39 ± 4.64 | |||||||
| ABK (cm) | Pre | 34.08 ± 6.44 | 36.66 ± 8.93 | 0.189 | 0.047 | <0.001 | 0.360 | 0.922 | 0.000 |
| Post | 24.52 ± 4.88 | 27.51 ± 5.25 | |||||||
| SJ (W) | Pre | 810.80 ± 78.87 | 821.20 ± 91.68 | 0.638 | 0.006 | <0.001 | 0.327 | 0.906 | 0.000 |
| Post | 684.80 ± 71.57 | 702.20 ± 120.62 | |||||||
| CMJ (W) | Pre | 876.90 ± 84.09 | 866.00 ± 107.53 | 0.659 | 0.005 | <0.001 | 0.290 | 0.420 | 0.018 |
| Post | 740.10 ± 71.11 | 777.20 ± 103.15 | |||||||
| ABK (W) | Pre | 935.30 ± 79.98 | 950.20 ± 106.14 | 0.663 | 0.005 | <0.001 | 0.333 | 0.949 | 0.000 |
| Post | 811.80 ± 95.25 | 822.90 ± 90.97 |
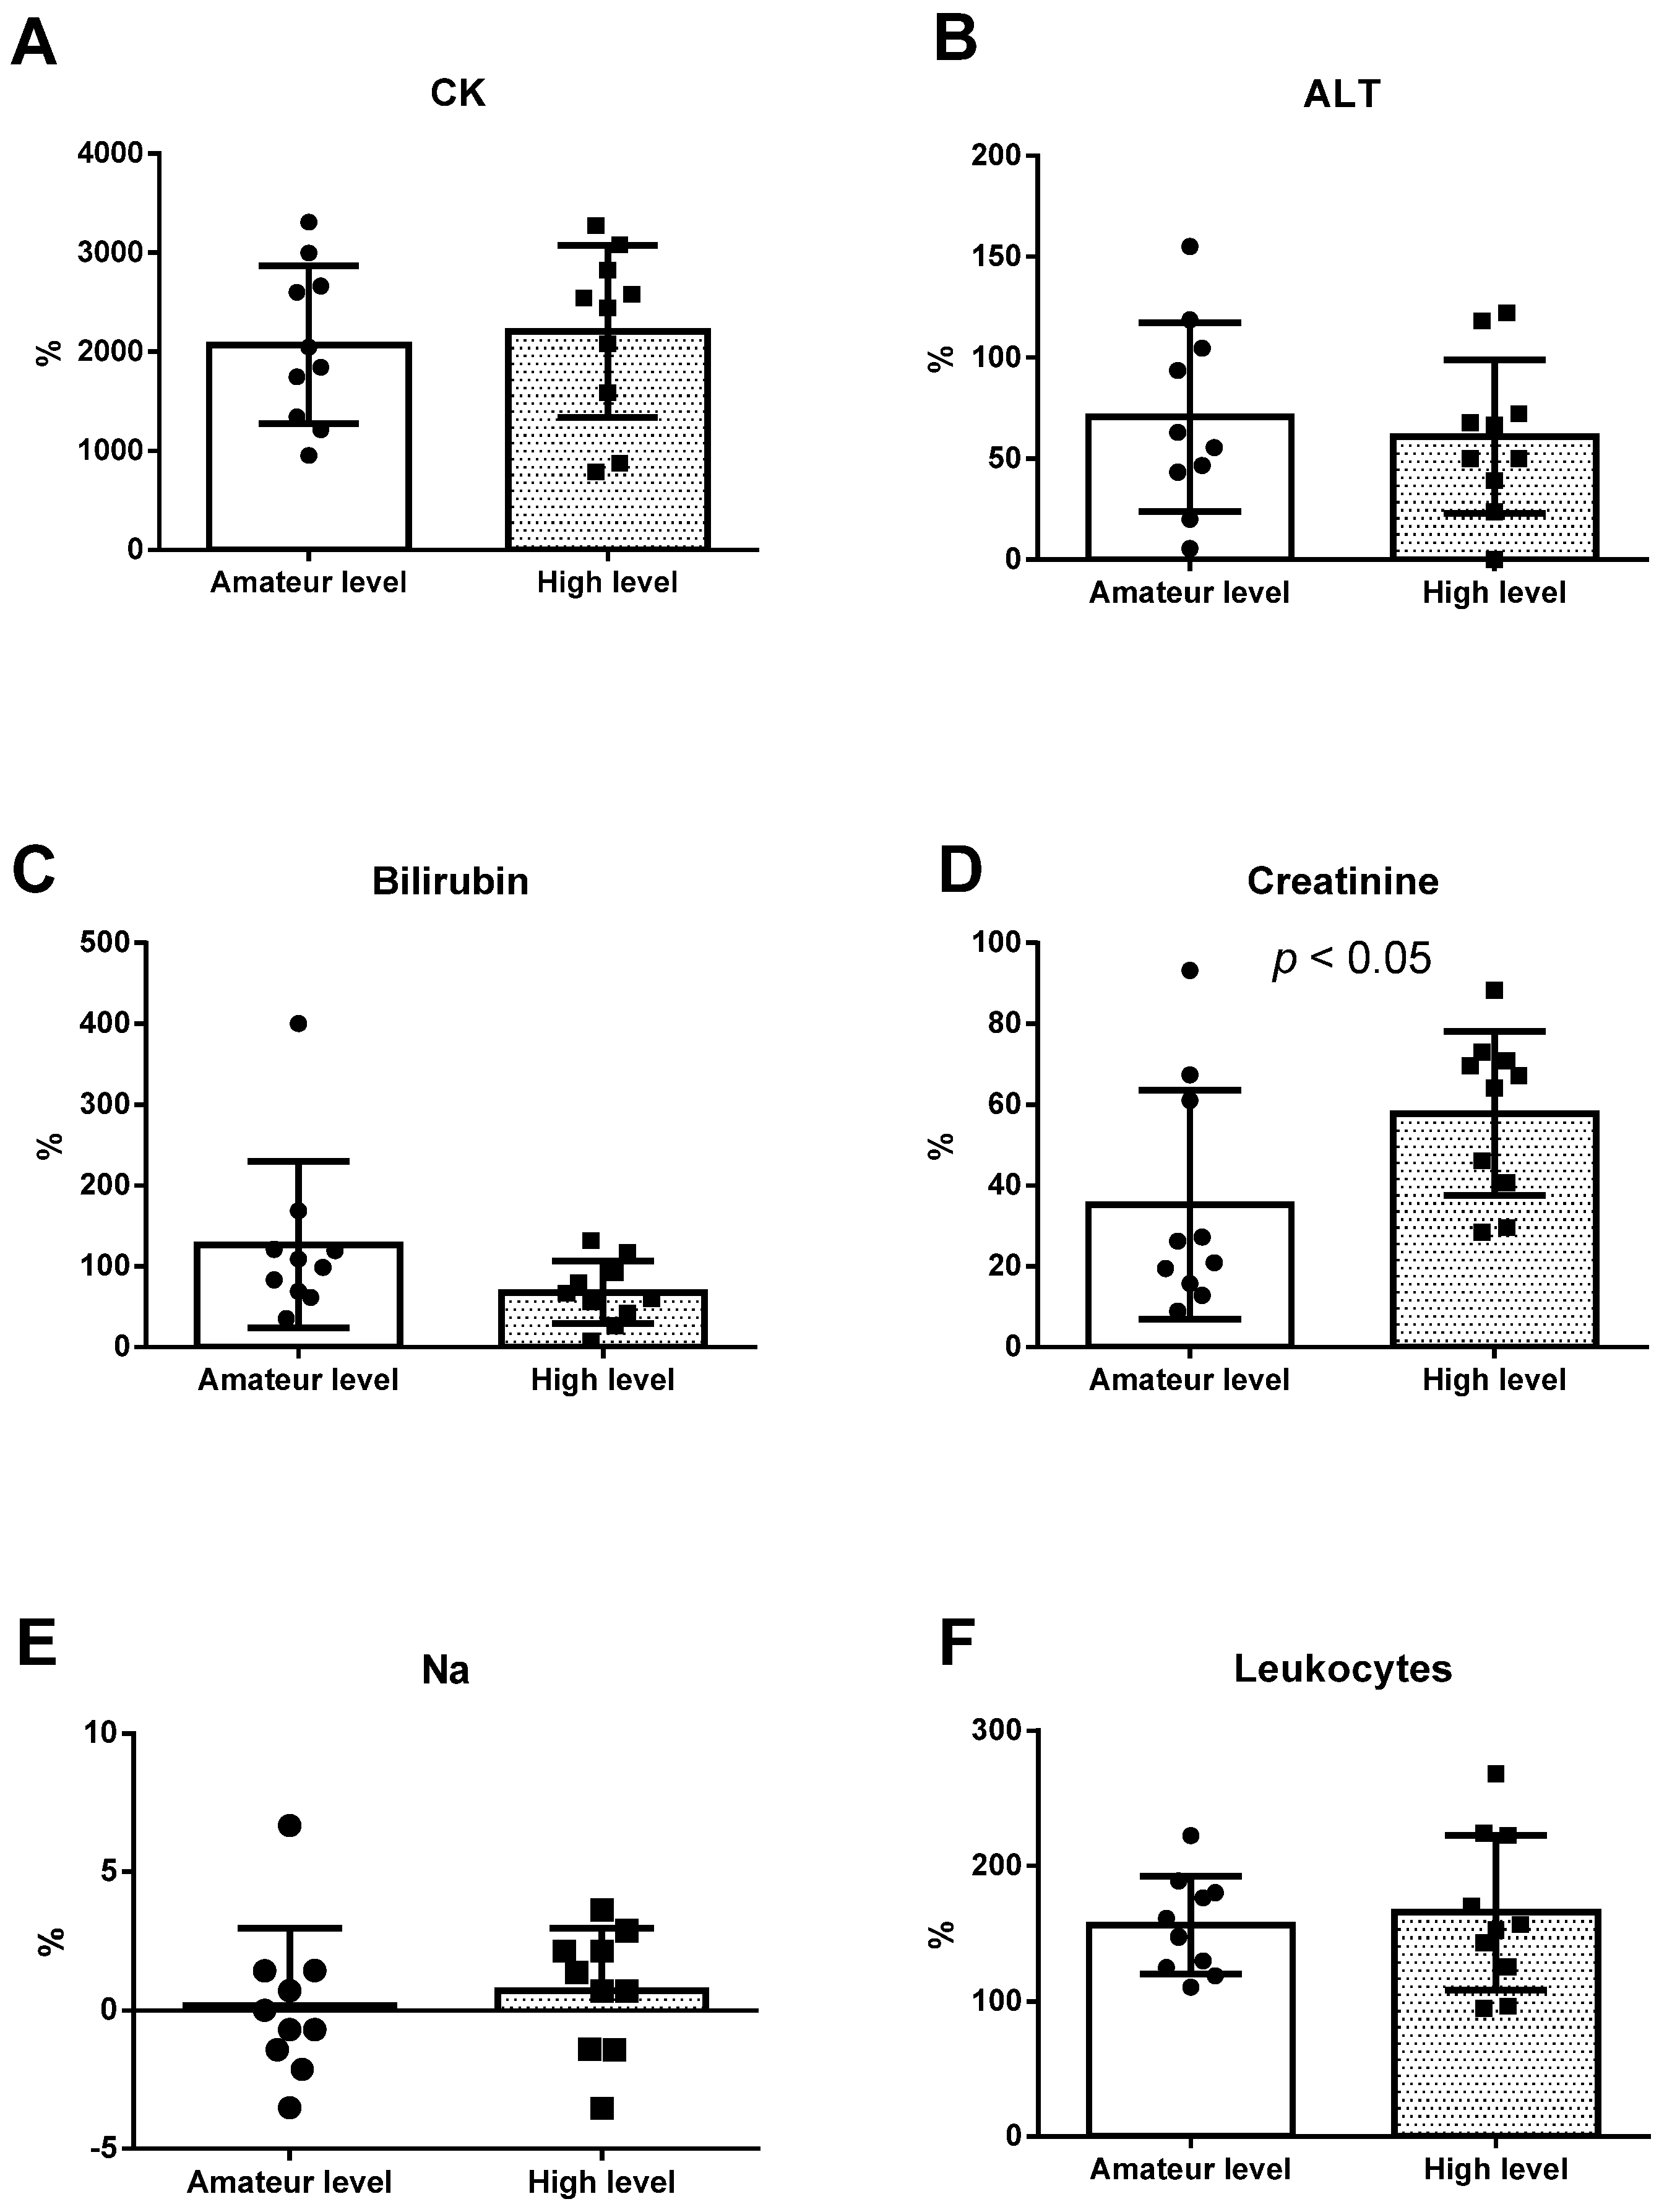
| Parameters | Time | Amateur Level (n = 10) | High Level (n = 10) | Group Effect | η2 | Race Effect | η2 | Group x Race | η2 |
|---|---|---|---|---|---|---|---|---|---|
| Weight (kg) | Pre | 76.01 ± 10.84 | 75.23 ± 6.87 | 0.640 | 0.006 | 0.474 | 0.014 | 0.846 | 0.001 |
| Post | 74.52 ± 10.21 | 73.58 ± 8.56 | |||||||
| CK (U/L) | Pre | 164.30 ± 69.39 | 193.60 ± 42.11 | 0.074 | 0.086 | <0.001 | 0.817 | 0.091 | 0.077 |
| Post | 3251. 60 ± 1011.89 | 4261.50 ± 1469.60 | |||||||
| ALT (U/L) | Pre | 18.60 ± 2.50 | 23.50 ± 3.92 | 0.017 | 0.147 | <0.001 | 0.537 | 0.904 | 0.000 |
| Post | 31.70 ± 9.67 | 37.10 ± 7.46 | |||||||
| BIL (mg/dL) | Pre | 0.597 ± 0.148 | 0.600 ± 0.156 | 0.028 | 0.128 | <0.001 | 0.698 | 0.024 | 0.133 |
| Post | 1.219 ± 0.205 | 0.967 ± 0.169 | |||||||
| Leu (×103/ μL) | Pre | 5.93 ± 1.00 | 5.99 ± 0.93 | 0.589 | 0.008 | <0.001 | 0.843 | 0.650 | 0.006 |
| Post | 15.04 ± 2.29 | 15.72 ± 3.35 | |||||||
| Cr (mg/dL) | Pre | 0.900 ± 0.137 | 0.855 ± 0.101 | 0.380 | 0.021 | <0.001 | 0.634 | 0.081 | 0.082 |
| Post | 1.202 ± 0.239 | 1.335 ± 0.107 | |||||||
| Na (mmol/L) | Pre | 140.10 ± 2.33 | 140.70 ± 1.76 | 0.194 | 0.046 | 0.432 | 0.017 | 0.599 | 0.008 |
| Post | 140.30 ± 2.11 | 141.70 ± 3.12 |
Publisher’s Note: MDPI stays neutral with regard to jurisdictional claims in published maps and institutional affiliations. |
© 2021 by the authors. Licensee MDPI, Basel, Switzerland. This article is an open access article distributed under the terms and conditions of the Creative Commons Attribution (CC BY) license (https://creativecommons.org/licenses/by/4.0/).
Share and Cite
Pradas, F.; Falcón, D.; Peñarrubia-Lozano, C.; Toro-Román, V.; Carrasco, L.; Castellar, C. Effects of Ultratrail Running on Neuromuscular Function, Muscle Damage and Hydration Status. Differences According to Training Level. Int. J. Environ. Res. Public Health 2021, 18, 5119. https://0-doi-org.brum.beds.ac.uk/10.3390/ijerph18105119
Pradas F, Falcón D, Peñarrubia-Lozano C, Toro-Román V, Carrasco L, Castellar C. Effects of Ultratrail Running on Neuromuscular Function, Muscle Damage and Hydration Status. Differences According to Training Level. International Journal of Environmental Research and Public Health. 2021; 18(10):5119. https://0-doi-org.brum.beds.ac.uk/10.3390/ijerph18105119
Chicago/Turabian StylePradas, Francisco, David Falcón, Carlos Peñarrubia-Lozano, Víctor Toro-Román, Luis Carrasco, and Carlos Castellar. 2021. "Effects of Ultratrail Running on Neuromuscular Function, Muscle Damage and Hydration Status. Differences According to Training Level" International Journal of Environmental Research and Public Health 18, no. 10: 5119. https://0-doi-org.brum.beds.ac.uk/10.3390/ijerph18105119