
Effects of Velocity-Based Training on Strength and Power in Elite Athletes—A Systematic Review


Abstract
:1. Introduction
2. Materials and Methods
2.1. Search Strategy
2.2. Data Extraction
2.3. Risk of Bias
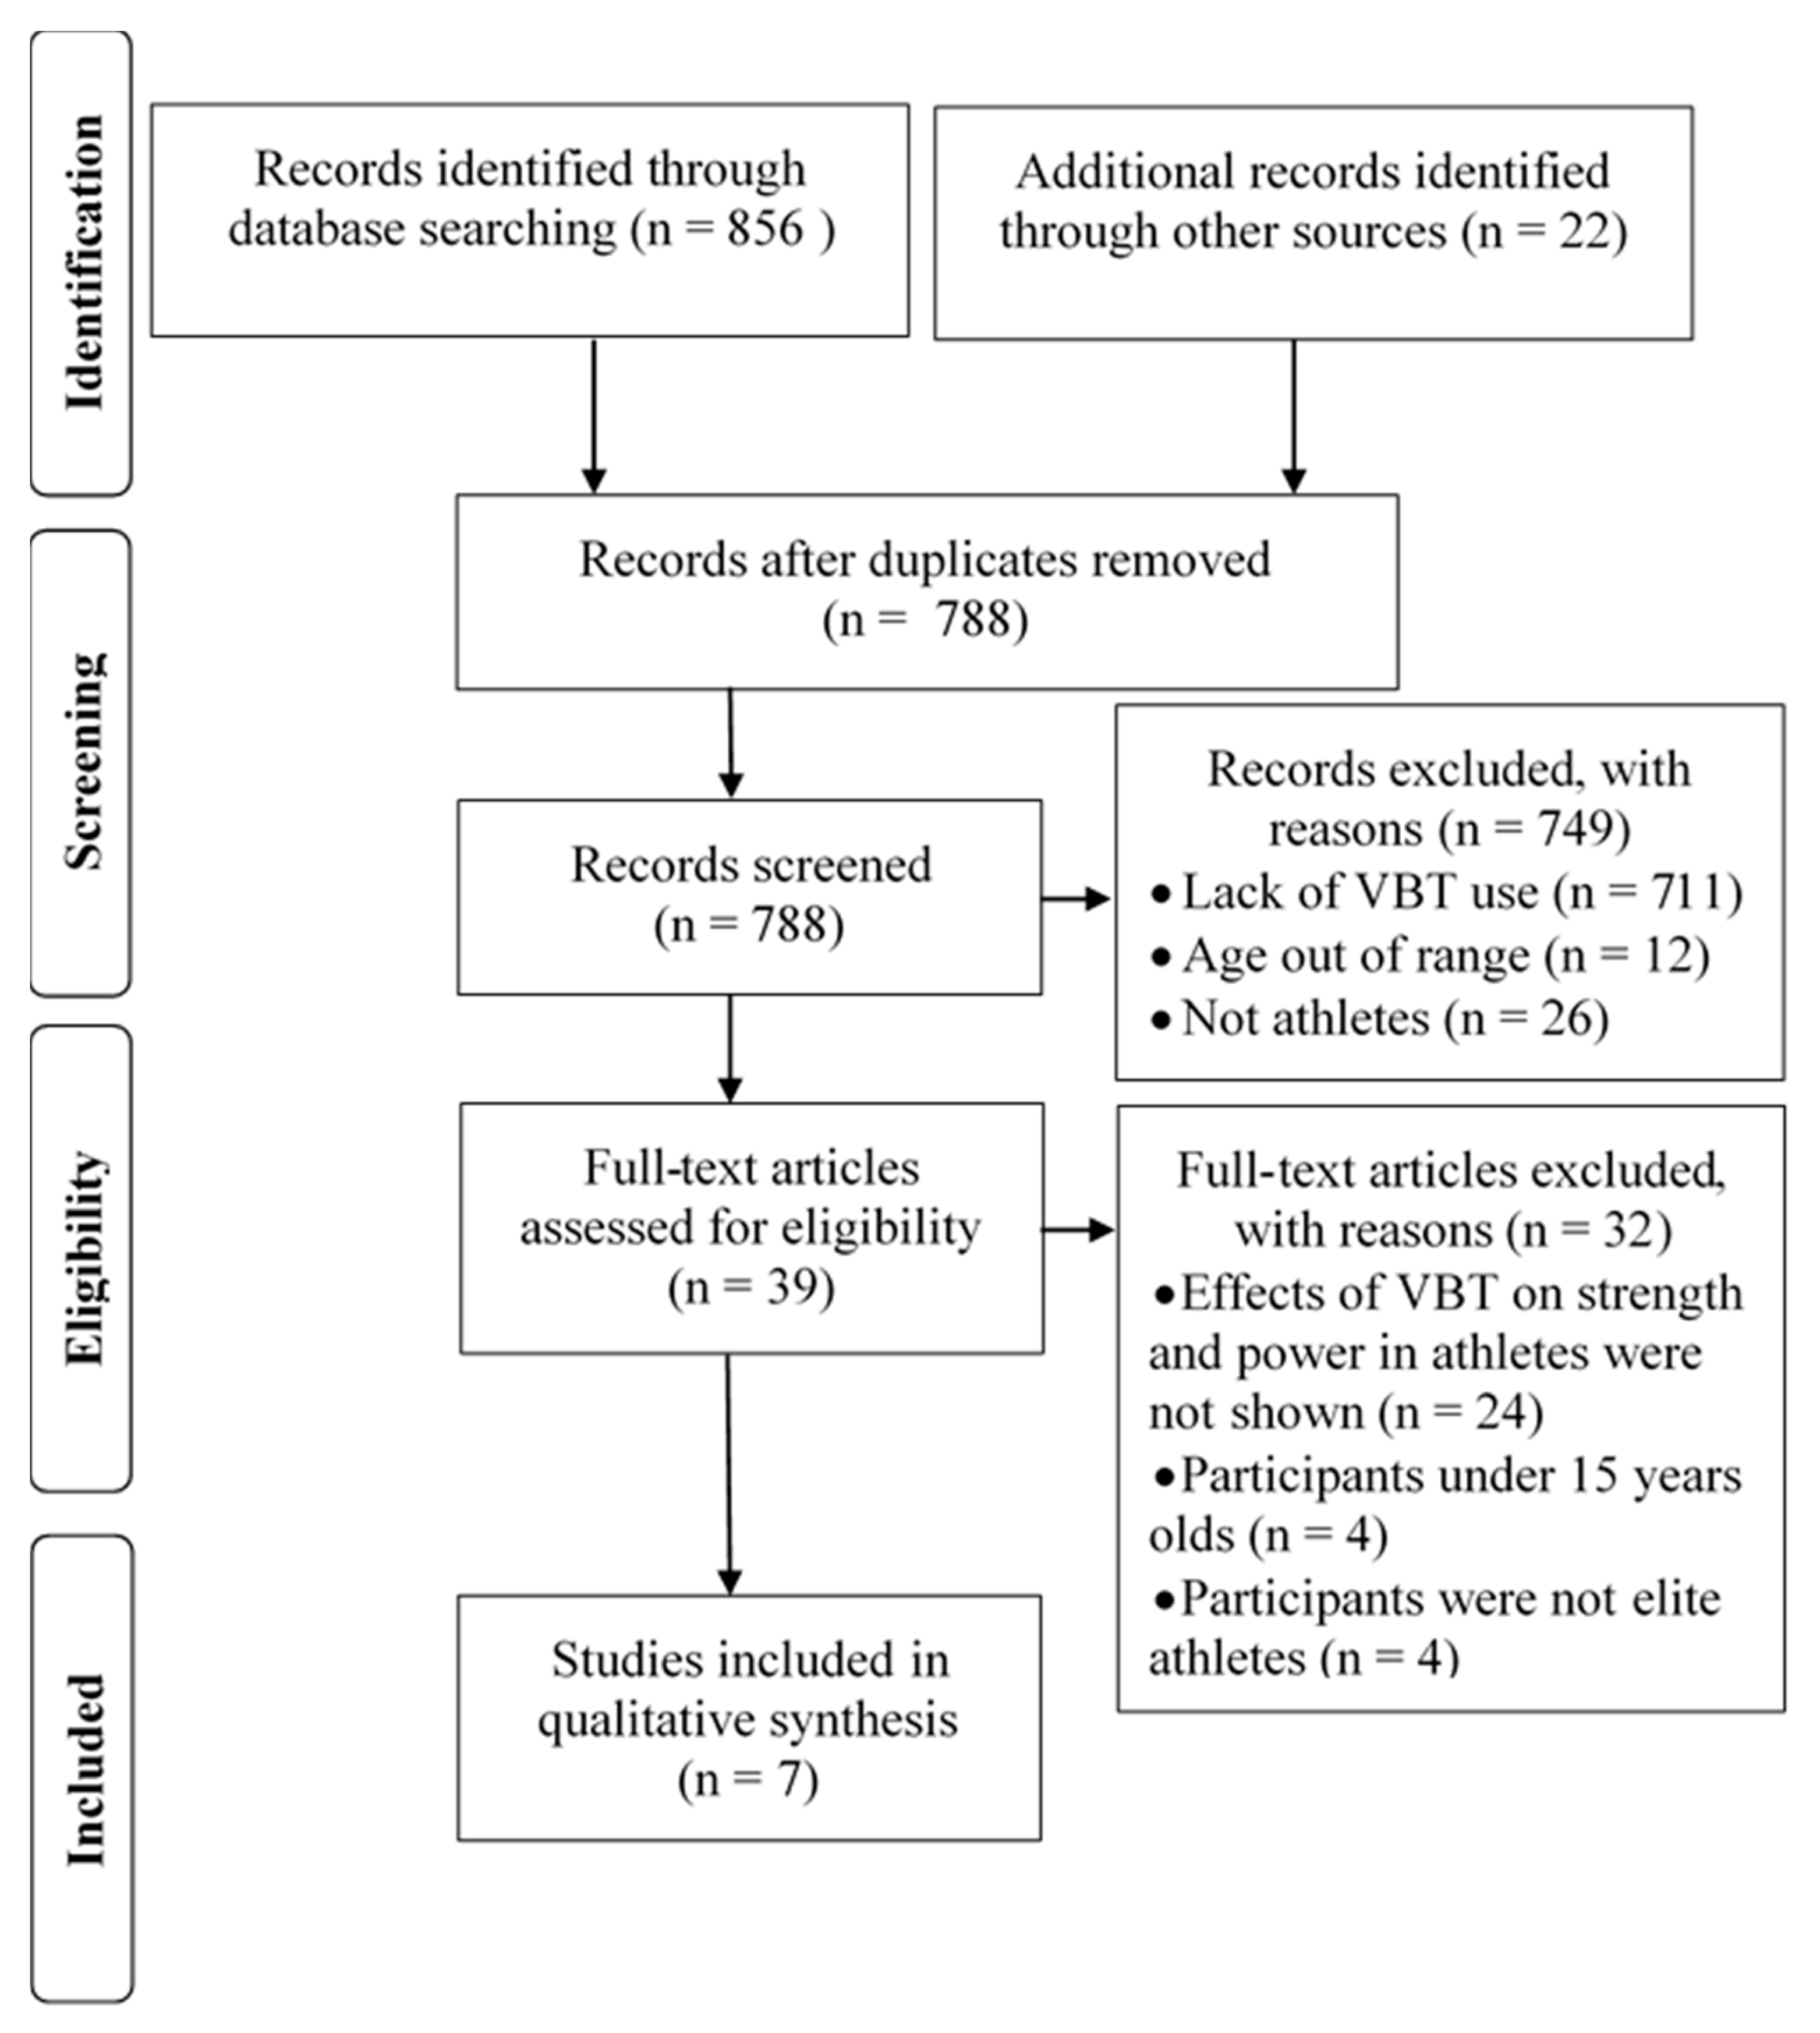
3. Results
3.1. General Characteristics of the Studies
3.2. Velocity Loss Method
3.3. Velocity Zones Method
3.4. Velocity and Feedback
4. Discussion
4.1. Velocity Loss Method
4.2. Velocity Zones Method
4.3. Velocity and Feedback
4.4. Study Limitations
5. Conclusions
Author Contributions
Funding
Institutional Review Board Statement
Informed Consent Statement
Data Availability Statement
Acknowledgments
Conflicts of Interest
References
- Suchomel, T.J.; Nimphius, S.; Bellon, C.R.; Stone, M.H. The importance of muscular strength: Training considerations. Sports Med. 2018, 48, 765–785. [Google Scholar] [CrossRef]
- Conceição, F.; Fernandes, J.; Lewis, M.; González-Badillo, J.J.; Jimenéz-Reyes, P. Movement velocity as a measure of exercise intensity in three lower limb exercises. J. Sports Sci. 2016, 34, 1099–1106. [Google Scholar] [CrossRef] [Green Version]
- González-Badillo, J.J.; Sánchez-Medina, L. Movement velocity as a measure of loading intensity in resistance training. Int. J. Sports Med. 2010, 31, 347–352. [Google Scholar] [CrossRef]
- Bazuelo-Ruiz, B.; Padial Paulino García-Ramos, A.; Morales-Artacho, A.J.; Miranda, M.T.; Feriche, B. Predicting maximal dynamic strength from the load-velocity relationship in squat exercise. J. Strength Cond. Res. 2015, 29, 1999–2005. [Google Scholar] [CrossRef]
- Jovanović, M.; Flanagan, E. Researched applications of velocity based strength training. J. Aust. Strength Cond. 2014, 22, 58–69. [Google Scholar]
- Hackett, D.A.; Davies, T.B.; Orr, R.; Kuang, K.; Halaki, M. Effect of movement velocity during resistance training on muscle-specific hypertrophy: A systematic review. Eur. J. Sport Sci. 2018, 18, 473–482. [Google Scholar] [CrossRef] [PubMed]
- Guerriero, A.; Varalda, C.; Piacentini, M. The role of velocity based training in the strength periodization for modern athletes. J. Funct. Morphol. Kinesiol. 2018, 3, 55. [Google Scholar] [CrossRef] [Green Version]
- Sánchez-Medina, L.; González-Badillo, J.J. Velocity loss as an indicator of neuromuscular fatigue during resistance training. Med. Sci. Sport Exer. 2011, 43, 1725–1734. [Google Scholar] [CrossRef] [PubMed]
- Ramirez, J.M.; Nunez, V.M.; Lancho, C.; Poblador, M.S.; Lancho, J.L. Velocity-based training of lower limb to improve absolute and relative power outputs in concentric phase oof half-squat in soccer players. J. Strength Cond. Res. 2015, 29, 3084–3088. [Google Scholar] [CrossRef]
- Loturco, I.; Pereira, L.A.; Cal Abad, C.C.; Tabares, F.; Moraes, J.E.; Kobal, R.; Kitamura, K.; Nakamura, F.Y. Bar velocities capable of optimising the muscle power in strength-power exercises. J. Sport Sci. 2016, 35, 734–741. [Google Scholar] [CrossRef]
- Mann, J.B.; Thyfault, J.P.; Ivey, P.A.; Sayers, S.P. The effect of autoregulatory progressive resistance exercise vs. linear periodization on strength improvement in college athletes. J. Strength Cond. Res. 2010, 24, 1718–1723. [Google Scholar] [CrossRef] [Green Version]
- Randell, A.D.; Cronin, J.B.; Keogh, J.W.L.; Gill, N.D.; Pederson, M.C. Effect of instantaneous performance feedback during 6 weeks of velocity-based resistance training on sport-specific performance tests. J. Strength Cond. Res. 2011, 25, 87–93. [Google Scholar] [CrossRef]
- Moher, D.; Liberati, A.; Tetzlaff, J.; Altman, D.G.; PRISMA Group. Preferred reporting items for systematic reviews and meta-analyses: The PRISMA Statement. J. Clin. Epidemiol. 2009, 62, 1006–1012. [Google Scholar] [CrossRef] [PubMed]
- Jadad, A.R.; Moore, R.A.; Carroll, D.; Jenkinson, C.; Reynolds, D.J.; Gavaghan, D.J.; McQuay, H.J. Assessing the quality of reports of randomized clinical trials: Is blinding necessary? Control. Clin. Trials 1996, 17, 1–12. [Google Scholar] [CrossRef]
- Garcia-Pallares, J.; Sánchez-Medina, L.; Carrasco, L.; Diaz, A.; Izquierdo, M. Endurance and neuromuscular changes in world-class level kayakers during a periodized training cycle. Eur. J. Appl. Physiol. 2009, 106, 629–638. [Google Scholar] [CrossRef] [PubMed]
- González-Badillo, J.J.; Pareja-Blanco, F.; Rodriguez-Rosell, D.; Abad-Herencia, J.L.; Ojo-López, J.J.; Sánchez-Medina, L. Effects of velocity-based resistance training on young soccer players of different ages. J. Strength Cond. Res. 2015, 29, 1329–1338. [Google Scholar] [CrossRef] [PubMed]
- López-Segovia, M.; Palao Andrés, J.M.; González-Badillo, J.J. Effect of 4 months of training on aerobic power, strength, and acceleration in two under-19 soccer teams. J. Strength Cond. Res. 2010, 24, 2705–2714. [Google Scholar] [CrossRef]
- Pareja-Blanco, F.; Sanchez-Medina, L.; Suarez-Arrones, L.; Gonzalez-Badillo, J.J. Effects of velocity loss during resistance training on performance in professional soccer players. Int. J. Sports Physiol. Perform. 2017, 12, 512–519. [Google Scholar] [CrossRef]
- Rauch, J.T.; Loturco, I.; Cheesman, N.; Thiel, J.; Alvarez, M.; Miller, N.; Carpenter, N.; Barakat, C.; Velsquez, G.; Stanjones, A.; et al. Similar strength and power adaptations between two different velocity-based training regimens in collegiate female volleyball players. Sports 2018, 6, 163. [Google Scholar] [CrossRef] [PubMed] [Green Version]
- Rodriguez-Rosell, D.; Torres-Torrelo, J.; Franco-Márquez, F.; González-Suárez, J.M.; González-Badillo, J.J. Effects of light-load maximal lifting velocity weight training vs. combined weight training and plyometrics on sprint, vertical jump and strength performance in adult soccer players. J. Sci. Med. Sport 2017, 20, 695–699. [Google Scholar] [CrossRef] [PubMed]
- González-Badillo, J.J.; Rodriguez-Rosell, D.; Sánchez-Medina, L.; Ribas, J.; López- López, C.; Mora-Custodio, R.; Janez-Garcia, J.M.; Pareja-Blanco, F. Short-term recovery following resistance exercise leading or not to failure. Int. J. Sports Med. 2015, 37, 295–304. [Google Scholar] [CrossRef] [PubMed] [Green Version]
- González-Badillo, J.J.; Marques, M.C.; Sánchez-Medina, L. The importance of movement velocity as a measure to control resistance training intensity. J. Hum. Kinet. 2011, 29A, 15–19. [Google Scholar] [CrossRef] [PubMed]
- Padulo, J.; Mignogna, P.; Mignardi, S.; Tonni, F.; D’Otavio, S. Effect of different pushing speeds on bench press. Int. J. Sports Med. 2011, 33, 376–380. [Google Scholar] [CrossRef]
- Jandacka, D.; Beremlijski, P. Determination of strength exercise intensities based on the load-power-velocity relationship. J. Hum. Kinet. 2011, 28, 33–44. [Google Scholar] [CrossRef]
- Sánchez-Medina, L.; González-Badillo, J.J.; Pérez, C.E.; Pallarés, J.G. Velocity- and power-load relationships of the bench pull vs. bench press exercises. Int. J. Sports Med. 2013, 35, 209–216. [Google Scholar] [CrossRef] [PubMed]
- Sánchez-Medina, L.; Pallarés, J.G.; Pérez, C.E.; Morán-Navarro, R.; González-Badillo, J.J. Estimation of relative load from bar velocity in the full back squat exercise. Sports Med. Int. Open 2017, 1, E80–E88. [Google Scholar] [CrossRef] [PubMed]
- Rodriguez-Rosell, D.; Franco-Márquez, F.; Pareja-Blanco, F.; Mora-Custodio, R.; Yáñez-García, J.M.; González-Suárez, J.M.; González-Badillo, J.J. Effects of 6-weeks resistance training combined with plyometric and speed exercises on physical performance of pre-peak height velocity soccer players. Int. J. Sports Physiol. Perform. 2016, 11, 240. [Google Scholar] [CrossRef] [PubMed]


| Author | Number of Subjects, Sex, Age (Years) | Training Experience, Sport-Specific Background | Frequency (Sessions/Week) Duration (week) | Purpose of the Study | Use of Velocity in the Training Protocol | Training Effects | Jadad Scale (Points) |
|---|---|---|---|---|---|---|---|
| Garcia-Pallares et al. 2009 [15] | 11M; 26.2 ± 2.8 | World-class, flat-water kayak paddlers; 12.4 ± 2.1 (years) | 3 per week; 12 weeks | Examine the effects brought about by a 12-week periodized program of combined strength and endurance training on selected neuromuscular and cardiovascular parameters | In maximal power training sessions (P3), in BP and PBP exercises, each set was terminated when mean velocity decreased by more than 10% of the best (fastest) repetition’s mean concentric velocity | Significant improvements: 1RM in BP (4.2%) and PBP (5.3%), V45% in BP (14.4%) and PBP (10.0%) were observed from T0 to T3 | 0 |
| Gonzalez-Badillo et al. 2015 [16] | U16 = 17M; 14.9 ± 0.3 U18 = 16M; 17.8 ± 0.4 U21 = 11M; 19.2 ± 1.2 | Soccer players | U16 and U18—2 RT sessions per week; 26 weeks U21—only typical soccer training | Analyze the effect of velocity-based resistance training with moderate loads and few repetitions per set combined with jumps and sprints on physical performance in young soccer players of different ages | Isoinertial progressive loading test were performed to assess V1LOAD for every player; squats load in training program based on V1LOAD | U16 > U18 & U21 in V1LOAD U16 & U18 > U21 in CMJ height U16 > U21 on MAS | 1 |
| Lopez-Segovia et al. 2010 [17] | Team A: 19M; 18.43 ± 0.6 Team B: 18M; 18.08 ± 0.8 | Under-19 Spanish first division soccer players | 1–2 per week; 16 weeks | Assess the effect of the training on aerobic power, strength, and acceleration capacity | The players always work with a load that they were able to lift in a FS at approximately 0.8–1.0 m/s, velocity depends of training week | Team A: ↑ MAS, ↑ CMJ20, ↑ FS20-30-40, ↓ acceleration capacity in all the splits Team B: ↓ MAS, ↑ CMJ20, ↑ FS50-60, ↑ T20-30 | 0 |
| Pareja-Blanco et al. 2016 [18] | 16M; 23.8 ± 3.5 | Highly trained soccer players | 3 per week; 6 weeks | Analyze the effects of two RT programs that used the same relative loading but different repetition volume using the velocity loss during the set: 15% (VL15) vs. 30% (VL30) | Two groups: VL15 & VL30 had identical training session (squat RT program), with the same relative loading magnitude (%1RM), but differed in the max percent velocity loss reached in each exercise set (15% vs. 30%) | CMJ height: VL15 > VL30 VL15: likely/possibly positive effect on 1RM, AMPV, CMJ VL30: possibly/unclear positive effects on 1RM, AMPV; possibly negative effects on CMJ VL15 and VL30: unclear/unlikely effects on T30; most likely/likely positive effects on YYIRT VL15 is effective to induce improvements in neuromuscular performance | 1 |
| Randell et al. 2011 [12] | Feedback group: 7M; 25.7 ± 3.6 Non-feedback group: 6M; 24.2 ± 2.5 | Professional rugby players; Feedback group: 3.7 ± 1.0 (years) Non-feedback group: 3.2 ± 1.2 (years) | 3 per week (squat jumps: 2 per week); 6 weeks | Investigate the effect of instantaneous performance feedback (peak velocity) on sport-specific performance tests | Concentric squat jumps: 3 sets of 3 repetition with feedback and without feedback + typical preseason conditioning program | Small effects, expect for the 30 m sprint performance, which was moderate; feedback group increased the results on sport-specific performance tests more than non-feedback group | 1 |
| Rauch et al. 2018 [19] | 15F; 19.3 ± 1.4 | Collegiate volleyball players | 3 per week; 7 weeks | Investigate the effects of two different VBT regimens on muscular adaptation (PVBT and OTL) | PVBT group: 4-week strength block (0.55–0.70 m/s); 3-week power block (0.85–1.0 m/s); OTL group: 7 weeks of BS (0.85 m/s), BP (0.85 m/s), DL (0.9 m/s); both groups performed accessory exercises in a circuit | BS 1RM: PVBT: ↑ 19.6%, OTL: ↑ 18.3% BP 1RM: PVBT: ↑ 8.5%, OTL: ↑ 10.2% DL 1RM: PVBT: ↑ 10.9, OTL: ↑ 22.9% BS PP: PVBT: ↑ 18.3%, OTL: ↑ 20.1% BP PP: PVBT: ↑ 14.5%, OTL: ↑ 27.9%, DL PP: PVBT:↑ 15.7%, OTL: ↑ 20.1% | 1 |
| Rodriguez-Rosell et al. 2017 [20] | 30M; 24.5 ± 3.4 | Spanish third division semiprofessional soccer players | 2 per week; 6 weeks | Compare the effects of combined light-load maximal lifting velocity weight training and plyometric training with weight training alone on strength, jump and sprint performance | FSG (n = 10): FS only, load progressively increased from ~1.20 m/s (~45%1RM) to ~1.00 m/s (~58%1RM) COM (n = 10): FS combined with jumps, sprints and changes of direction CG (n = 10) | 1RM: ↑ (17.4–13.4%); CMJ: ↑ (7.1–5.2%); Sprint time: ↑ (3.6–0.7%); Force-velocity relationships: ↑ (16.9–6.1%); no significant differences between FSG and COM | 1 |
Publisher’s Note: MDPI stays neutral with regard to jurisdictional claims in published maps and institutional affiliations. |
© 2021 by the authors. Licensee MDPI, Basel, Switzerland. This article is an open access article distributed under the terms and conditions of the Creative Commons Attribution (CC BY) license (https://creativecommons.org/licenses/by/4.0/).
Share and Cite
Włodarczyk, M.; Adamus, P.; Zieliński, J.; Kantanista, A. Effects of Velocity-Based Training on Strength and Power in Elite Athletes—A Systematic Review. Int. J. Environ. Res. Public Health 2021, 18, 5257. https://0-doi-org.brum.beds.ac.uk/10.3390/ijerph18105257
Włodarczyk M, Adamus P, Zieliński J, Kantanista A. Effects of Velocity-Based Training on Strength and Power in Elite Athletes—A Systematic Review. International Journal of Environmental Research and Public Health. 2021; 18(10):5257. https://0-doi-org.brum.beds.ac.uk/10.3390/ijerph18105257
Chicago/Turabian StyleWłodarczyk, Michał, Przemysław Adamus, Jacek Zieliński, and Adam Kantanista. 2021. "Effects of Velocity-Based Training on Strength and Power in Elite Athletes—A Systematic Review" International Journal of Environmental Research and Public Health 18, no. 10: 5257. https://0-doi-org.brum.beds.ac.uk/10.3390/ijerph18105257