
A Latent Class Analysis of Health-Related Quality of Life in Korean Older Adults

Abstract
:1. Introduction
2. Materials and Methods
2.1. Design
2.2. Participants and Data Collection
2.3. Tools
2.3.1. General Characteristics
2.3.2. Physical Health
2.3.3. Mental Health
2.3.4. Social Health
2.3.5. Quality of Life (EQ-5D)
2.4. Data Analysis
3. Results
3.1. Participants’ General Characteristics and Health Issues
3.2. Latent Classes for Health-Related Quality of Life
3.3. Predictors of Each Latent Class of Health-Related Quality of Life
4. Discussion
5. Conclusions
Author Contributions
Funding
Institutional Review Board Statement
Informed Consent Statement
Data Availability Statement
Conflicts of Interest
References
- Korean Statical Information Service. Senior Statistics. 2020. Available online: http://kostat.go.kr/portal/korea/kor_nw/1/1/index.board?bmode=read&aSeq=385322 (accessed on 1 June 2021).
- EuroQol Group. EuroQol—A new facility for the measurement of health-related quality of life. Health Policy 1990, 16, 199–208. [Google Scholar] [CrossRef]
- Calvert, M.J.; Freemantle, N. Use of health-related quality of life in prescribing research. Part 1: Why evaluate health-related quality of life? J. Clin. Pharm. Ther. 2003, 28, 513–521. [Google Scholar] [CrossRef]
- Dirik, A.; Cavlak, U.; Akdag, B. Identifying the relationship among mental status, functional independence and mobility level in Turkish institutionalized elderly: Gender differences. Arch. Gerontol. Geriatr. 2006, 42, 339–350. [Google Scholar] [CrossRef]
- Ingrand, I.; Paccalin, M.; Liuu, E.; Gil, R.; Ingrand, P. Positive perception of aging is a key predictor of quality-of-life in aging people. PLoS ONE 2018, 13, e0204044. [Google Scholar] [CrossRef]
- Halaweh, H.; Willen, C.; Grimby-Ekman, A.; Svantesson, U. Physical activity and health-related quality of life among community dwelling elderly. J. Clin. Med. Res. 2015, 7, 845–852. [Google Scholar] [CrossRef] [Green Version]
- Chin, Y.R.; Lee, I.S.; Lee, H.Y. Effects of hypertension, diabetes, and/or cardiovascular disease on health-related quality of life in elderly Korean individuals: A population-based cross-sectional survey. Asian Nurs. Res. 2014, 8, 267–273. [Google Scholar] [CrossRef] [Green Version]
- Yümin, E.T.; Şimşek, T.T.; Sertel, M.; Öztürk, A.; Yümin, M. The effect of functional mobility and balance on health-related quality of life (HRQoL) among elderly people living at home and those living in nursing home. Arch. Gerontol. Geriatr. 2011, 52, e180–e184. [Google Scholar] [CrossRef] [PubMed]
- Rubenstein, L.Z.; Powers, C.M.; MacLean, C.H. Quality indicators for the management and prevention of falls and mobility problems in vulnerable elders. Ann. Intern. Med. 2011, 135, 686–693. [Google Scholar] [CrossRef] [PubMed] [Green Version]
- Metz, D.H. Mobility of older people and their quality of life. Transp. Policy 2000, 7, 149–152. [Google Scholar] [CrossRef]
- Roehr, S.; Luck, T.; Pabst, A.; Bickel, H.; König, H.H.; Lühmann, D.; Fuchs, A.; Wolfsgruber, S.; Wiese, B.; Weyerer, S.; et al. Subjective cognitive decline is longitudinally associated with lower health-related quality of life. Int. Psychogeriatr. 2017, 29, 1939–1950. [Google Scholar] [CrossRef]
- Yoo, S.W.; Son, S.J.; Bae, H.; Kook, S.D.; Kim, H.S. Depression and Socio-Demographic Characteristics Associated with Quality of Life in the Community-Dwelling Elderly Living Alone. J. Korean Geriatr. Psychiatry 2014, 18, 26–31. [Google Scholar]
- Mura, G.; Carta, M.G. Physical activity in depressed elderly: A systematic review. Clin. Pract. Epidemiol. Ment. Health 2013, 9, 125–135. [Google Scholar] [CrossRef]
- Lok, N.; Lok, S.; Canbaz, M. The effect of physical activity on depressive symptoms and quality of life among elderly nursing home residents: Randomized controlled trial. Arch. Gerontol. Geriatr. 2017, 70, 92–98. [Google Scholar] [CrossRef]
- Jessen, F.; Amariglio, R.E.; Van Boxtel, M.; Breteler, M.; Ceccaldi, M.; Chételat, G.; Dubois, B.; Dufouil, C.; Ellis, K.A.; van der Flier, W.M. A conceptual framework for research on subjective cognitive decline in preclinical Alzheimer’s disease. Alzheimer Dement. 2014, 10, 844–852. [Google Scholar] [CrossRef] [PubMed] [Green Version]
- Mendonça, M.D.; Alves, L.; Bugalho, P. From subjective cognitive complaints to dementia: Who is at risk?: A systematic review. Am. J. Alzheimers Dis Other Demen 2016, 31, 105–114. [Google Scholar] [CrossRef] [PubMed]
- Wicke, F.S.; Guthlin, C.; Mergenthal, K.; Gensichen, J.; Loffler, C.; Bickel, H.; Maier, W.; Riedel-Heller, S.G.; Weyerer, S.; Wiese, B.; et al. Depressive mood mediates the influence of social support on health-related quality of life in elderly, multimorbid patients. BMC Fam. Pract. 2014, 15, 62. [Google Scholar] [CrossRef] [PubMed] [Green Version]
- Lee, Y.G.; Choi, S.I. The Relationship between Social Capital and Quality of Life to the Elderly People Participating in the Elderly Social Activities. Korean Policy Sci. Rev. 2016, 20, 151–180. Available online: http://www.dbpia.co.kr/journal/articleDetail?nodeId=NODE06705349 (accessed on 5 June 2021).
- Tavares, D.M.; Matias, T.G.; Ferreira, P.C.; Pegorari, M.S.; Nascimento, J.S.; Paiva, M.M. Quality of life and self-esteem among the elderly in the community. Cienc. Saude Colet. 2016, 21, 3557–35564. [Google Scholar] [CrossRef] [Green Version]
- Bashkireva, A.S.; Bogdanova, D.Y.; Bilyk, A.Y.; Shishko, A.V.; Kachan, E.Y.; Arutyunov, V.A. Quality of life and physical activity among elderly and old people. Adv. Gerontol. 2018, 31, 743–750. [Google Scholar] [CrossRef]
- Choi, M.Y.; Kwak, H.K.; Park, H.S. The Effect of Community Social Capital on the Elderly’s Subjective Quality of Life: Focusing on the Mediating Effect of the Elderly Depression. Korean J. Soc. Welf. 2014, 66, 307–328. [Google Scholar] [CrossRef]
- Sohn, J.H.; Ahn, S.H.; Cho, S.J.; Seo, H.Y.; Kim, K.N.; Ryu, J.M.; Park, J.E. Living Alone, Social Isolation and Depressive Disorder Among Community-Dwelling Older Adults in an Urban Community in Korea. J. Korean Geriatr. Psychiatry (JKPG) 2019, 23, 58–64. [Google Scholar] [CrossRef]
- Lee, S.H.; Ko, J.E. Ways of Resolving Symptoms of Depression Preferred by Korean Older Adults: A Comparison Between Poor and Non-poor Groups. Korean J. Soc. Welf. 2010, 47, 213–238. [Google Scholar] [CrossRef]
- Kongsted, A.; Nielsen, A.M. Latent Class Analysis in health research. J. Physiother. 2017, 63, 55–58. [Google Scholar] [CrossRef] [PubMed] [Green Version]
- Park, S.J.; Choi, H.R.; Choi, J.H.; Kim, K.W.; Hong, J.P. Reliability and validity of the Korean version of the Patient Health Questionnaire-9 (PHQ-9). Anxiety Mood 2010, 6, 119–124. [Google Scholar]
- Kim, M.H.; Cho, Y.S.; Uhm, W.S.; Kim, S.; Bae, S.C. Cross-cultural adaptation and validation of the Korean version of the EQ-5D in patients with rheumatic diseases. Qual. Life Res. 2005, 14, 1401–1406. [Google Scholar] [CrossRef]
- Nagin, D.S. Analyzing Developmental Trajectories: A Semiparametric, Group-Based Approach. Psychol. Methods 1999, 4, 139–157. [Google Scholar] [CrossRef]
- Sclove, S.L. Application of Model-Selection Criteria to Some Problems in Multivariate Analysis. Psychometrika 1987, 52, 333–343. Available online: https://0-link-springer-com.brum.beds.ac.uk/article/10.1007%2FBF02294360 (accessed on 6 June 2021). [CrossRef]
- Yıldırım, A.; Hacıhasanoğlu Aşılar, R.; Bakar, N.; Demir, N. Effect of anxiety and depression on self-care agency and quality of life in hospitalized patients with chronic obstructive pulmonary disease: A questionnaire survey. Int. J. Nurs. Pract. 2013, 19, 14–22. [Google Scholar] [CrossRef] [PubMed]
- Megari, K. Quality of life in chronic disease patients. Health Psychol. Res. 2013, 1, e27. [Google Scholar] [CrossRef]
- Lima, S.; Teixeira, L.; Esteves, R.; Ribeiro, F.; Pereira, F.; Teixeira, A.; Magalhaes, C. Spirituality and quality of life in older adults: A path analysis model. BMC Geriatr. 2020, 20, 259. [Google Scholar] [CrossRef]
- Bilotta, C.; Bowling, A.; Nicolini, P.; Case, A.; Vergani, C. Quality of life in older outpatients living alone in the community in Italy. Health Soc. Care Community 2012, 20, 32–41. [Google Scholar] [CrossRef]
- Chen, Y.; Hicks, A.; While, A.E. Quality of life and related factors: A questionnaire survey of older people living alone in Mainland China. Qual. Life Res. 2014, 23, 1593–1602. [Google Scholar] [CrossRef]
- Zhang, M.; Wang, H.; Li, T.; Yu, X. Prevalence of neuropsychiatric symptoms across the declining memory continuum: An observational study in a memory clinic setting. Dement. Geriatr. Cogn. Dis. Extra 2012, 2, 200–208. [Google Scholar] [CrossRef]
- Chen, T.Y.; Kao, C.W.; Cheng, S.M.; Chang, Y.C. Uncertainty and depressive symptoms as mediators of quality of life in patients with heart failure. PLoS ONE 2018, 13, e0205953. [Google Scholar] [CrossRef]
- Giammanco, M.D.; Gitto, L. Coping, uncertainty and health-related quality of life as determinants of anxiety and depression on a sample of hospitalized cardiac patients in Southern Italy. Qual. Life Res. 2016, 25, 2941–2956. [Google Scholar] [CrossRef] [PubMed]
- Sharif, S.P.; Ahadzadeh, A.S.; Perdamen, H.K. Uncertainty and quality of life of Malaysian women with breast cancer: Mediating role of coping styles and mood states. Appl. Nurs. Res. 2017, 38, 88–94. [Google Scholar] [CrossRef]
- Ordu, G.N.K.; Gokce-Kutsal, Y.; Borman, P.; Ceceli, E.; Dogan, A.; Eyigor, S.; Karapolat, H. Pain and quality of life (QoL) in elderly: The Turkish experience. Arch. Gerontol. Geriatr. 2012, 55, 357–362. [Google Scholar] [CrossRef]
- Lee, S.; Cheong, C.H. Effect of the Physical Environment on the Health-related Quality of Life of the Low-income Korean Elderly Population. Iran. J. Public Health 2018, 47, 1865–1873. Available online: http://ijph.tums.ac.ir (accessed on 5 June 2021).
- Mishra, N.; Mishra, A.K.; Bidija, M. A study on correlation between depression, fear of fall and quality of life in elderly individuals. Int. J. Res. Med. Sci. 2017, 5, 1456–1460. [Google Scholar] [CrossRef] [Green Version]
- Yokoya, T.; Demura, S.; Sato, S. Relationships between physical activity, ADL capability and fall risk in community-dwelling Japanese elderly population. Environ. Health Prev. Med. 2007, 12, 25. [Google Scholar] [CrossRef] [PubMed]
- Rho, B.; Mo, S.H. The Effect of Levels and Dimensions of Social Support on Geriatric Depression. J. Korean Gerontol. Nurs. 2007, 27, 53–69. Available online: https://kmbase.medric.or.kr/KMID/0379220070270010053 (accessed on 5 June 2021).
- Lee, M.H.; Ko, J.E. The Impact of Social Capital on Aging Problems among Community-Living Older Adults. Korean J. Soc. Welf. 2015, 17, 85–110. Available online: http://www.dbpia.co.kr/journal/articleDetail?nodeId=NODE06512131 (accessed on 5 June 2021).
- Kang, E.N. Types of Neighborhood Environments and Life Satisfaction of Older Adults. J. Korean Gerontol. Nurs. 2017, 37, 669–686. [Google Scholar] [CrossRef] [Green Version]


| Characteristics | Categories | N | % | |
|---|---|---|---|---|
| General characteristics | Age group | 65–70 | 3213 | 35.6 |
| 71–75 | 2232 | 24.7 | ||
| 76–80 | 1965 | 21.8 | ||
| ≥ 81 | 1617 | 17.9 | ||
| M(SD) | 74.07 (6.59) | |||
| Sex | Male | 3892 | 43.1 | |
| Female | 5135 | 56.9 | ||
| Eligibility for basic livelihood security | Yes | 559 | 6.2 | |
| No | 8468 | 93.8 | ||
| Household type | One-person household | 1692 | 18.7 | |
| Married couple household | 4145 | 45.9 | ||
| Single parent household | 175 | 1.9 | ||
| Others | 3015 | 33.4 | ||
| Physical health | Diagnosis of hypertension | 5152 | 57.1 | |
| Diagnosis of diabetes | 1110 | 12.3 | ||
| Falls | 0.32 (0.81) | |||
| Mental health | Depression | Low or below | 8558 | 94.8 |
| Moderate or higher | 469 | 5.2 | ||
| Discomfort from cognitive decline | 1.44 (0.90) | |||
| Happiness | 6.66 (1.88) | |||
| Social health | Trust in social environment | 5.06 (1.63) | ||
| Degree of contact | 3.46 (1.37) | |||
| Participation in social activities | Yes | 5532 | 61.3 | |
| No | 3495 | 38.7 | ||
| Number of Groups | AIC | BIC | saBIC | LMR | BLRT | Estimated Probability for Trajectory Group (%) | |||||
|---|---|---|---|---|---|---|---|---|---|---|---|
| 1 | 2 | 3 | 4 | 5 | 6 | ||||||
| 1 | 51,283.984 | 51,319.524 | 51,303.635 | n/a | n/a | 100.0 | |||||
| 2 | 41,886.226 | 41,964.414 | 41,929.457 | <0.001 | <0.001 | 66.8 | 33.2 | ||||
| 3 | 41,151.446 | 41,272.282 | 41,218.259 | <0.001 | <0.001 | 52.0 | 23.3 | 24.7 | |||
| 4 | 41,013.431 | 41,176.914 | 41,103.824 | <0.001 | <0.001 | 57.3 | 16.6 | 10.1 | 16.0 | ||
| 5 | 40,994.111 | 41,200.243 | 41,108.086 | <0.001 | <0.001 | 47.5 | 28.0 | 2.2 | 16.0 | 6.3 | |
| 6 | 41,002.081 | 41,250.860 | 41,139.636 | 0.733 | 1.000 | 40.6 | 10.5 | 2.9 | 22.6 | 10.0 | 13.4 |
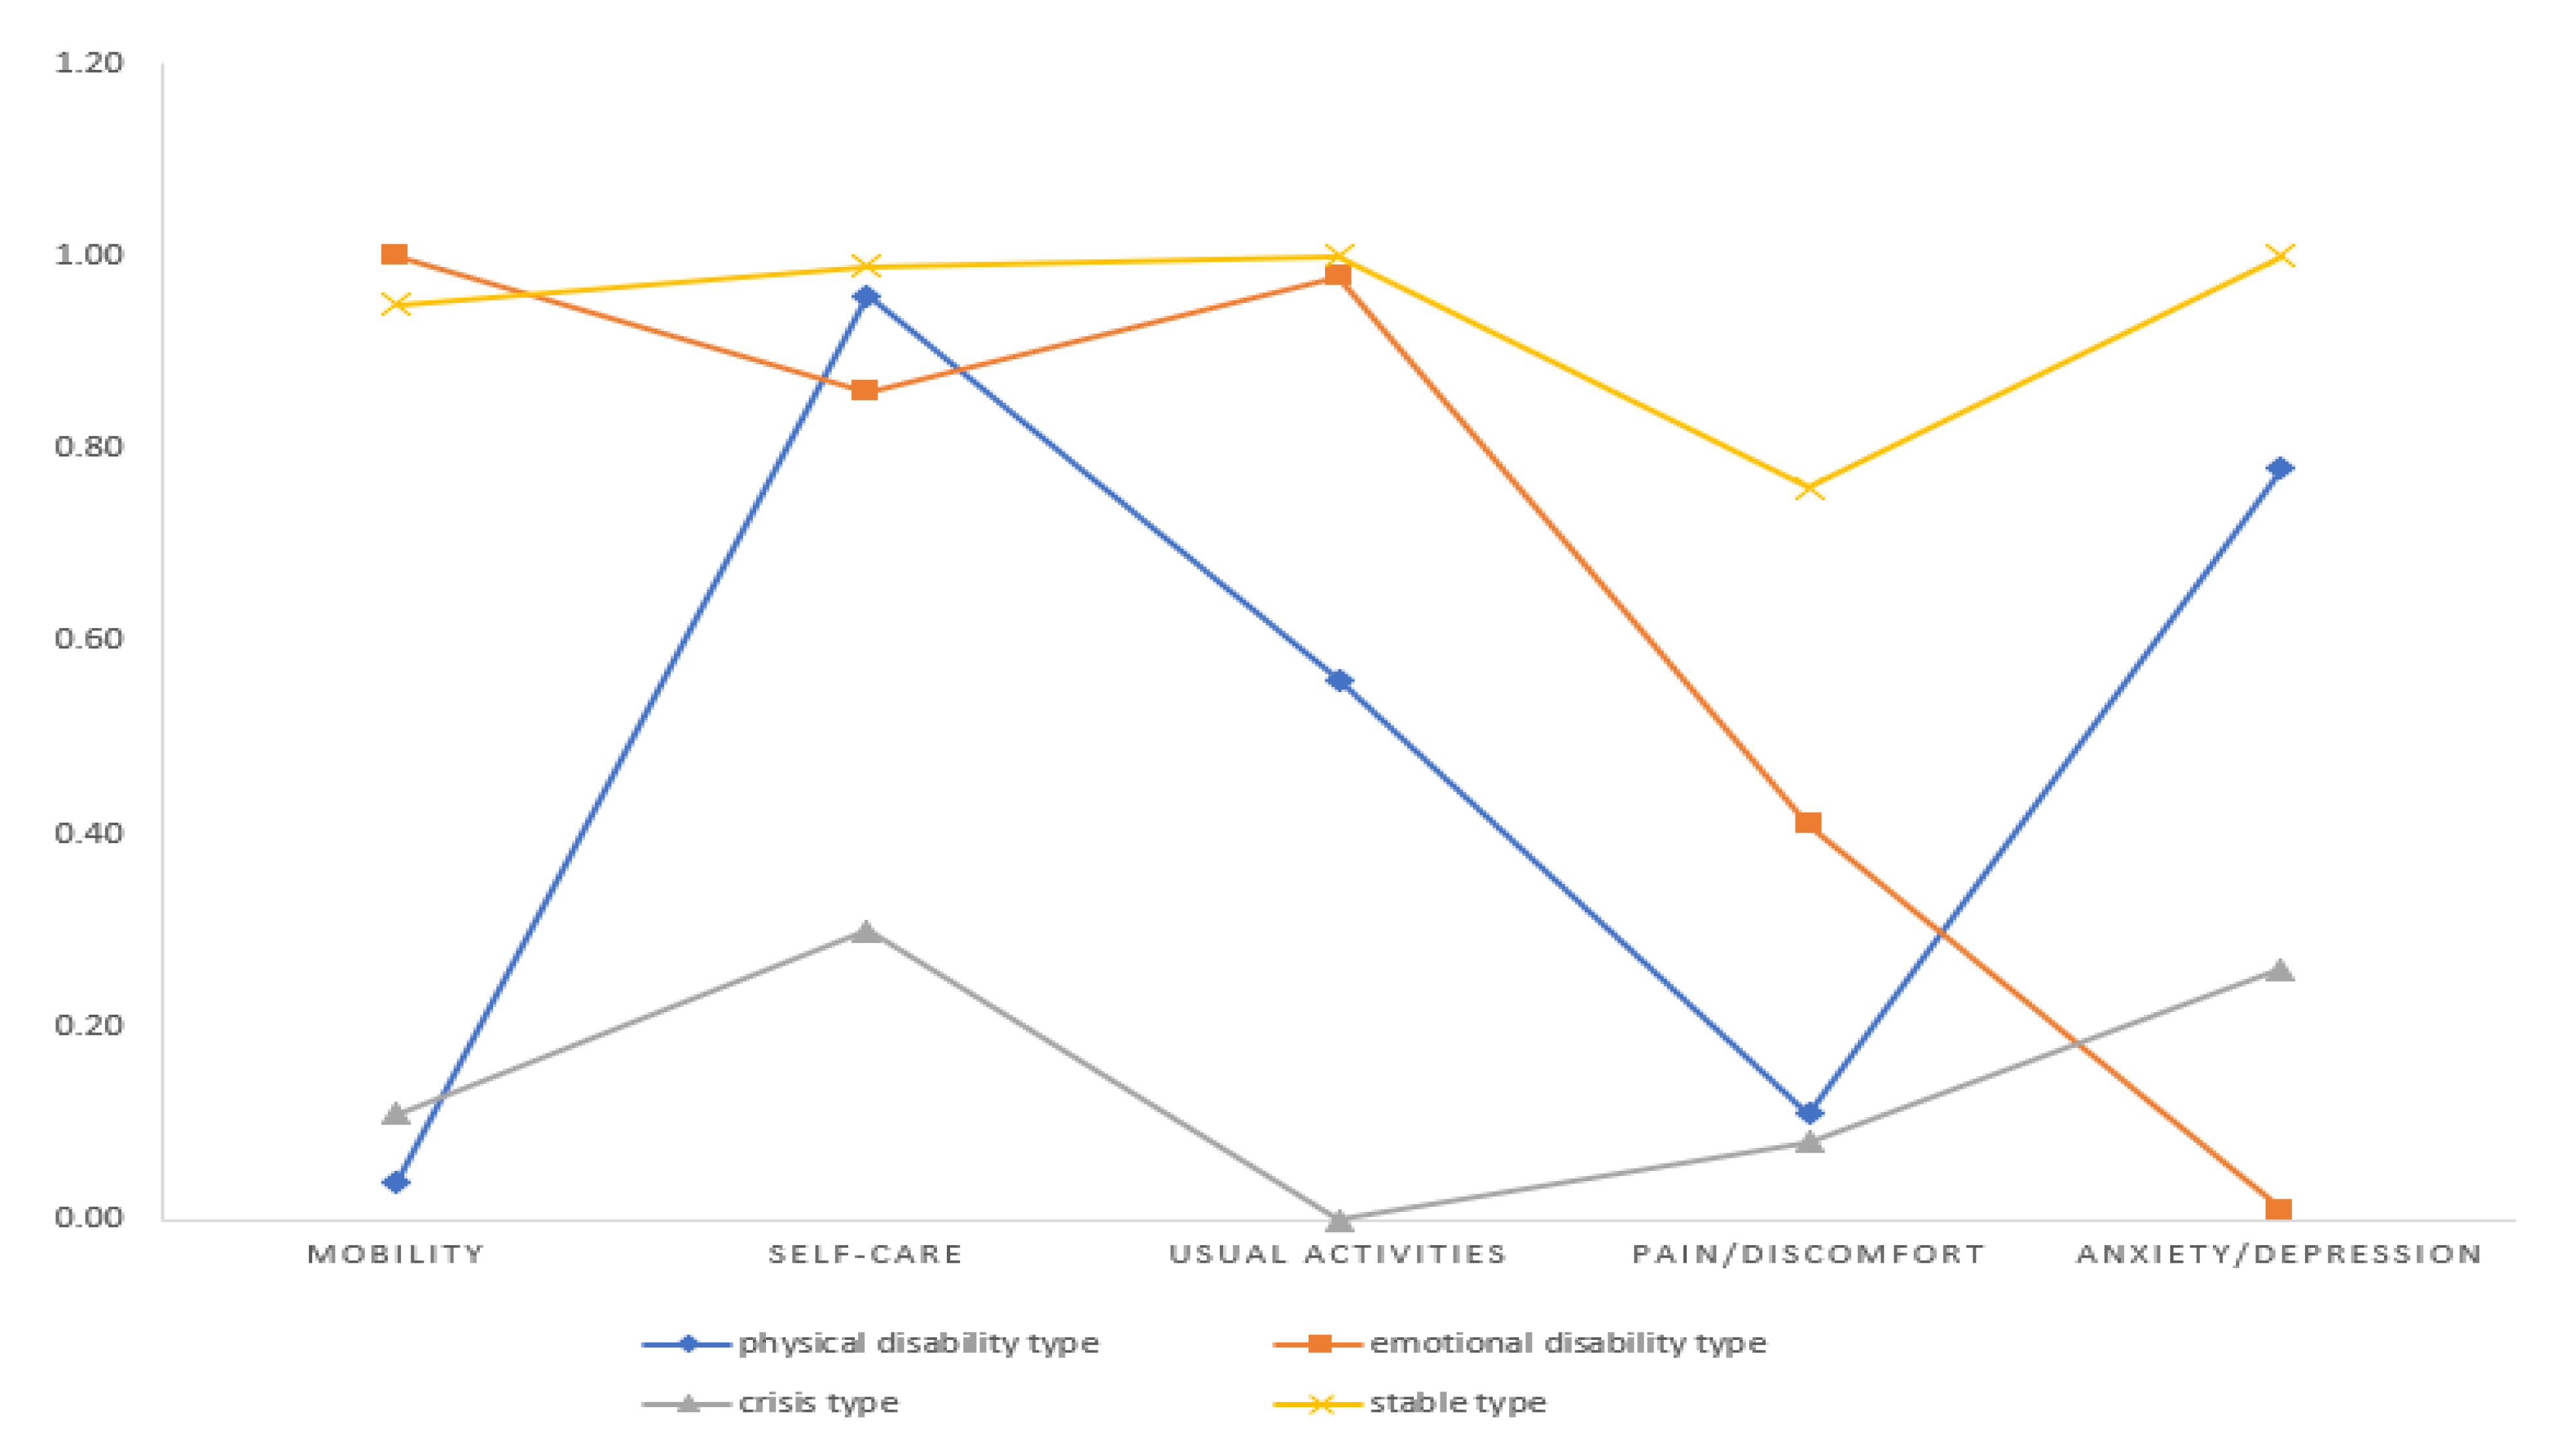
| Group Indices | Class 1 | Class 2 | Class 3 | Class 4 | Total | F | p | |||||
|---|---|---|---|---|---|---|---|---|---|---|---|---|
| (N = 5173, 57.3%) | (N = 1501, 16.6%) | (N = 907, 10.0%) | (N = 1446, 16.0%) | (N = 9027, 100.0%) | ||||||||
| M | (SD) | M | (SD) | M | (SD) | M | (SD) | M | (SD) | |||
| Mobility | 0.95 | (0.21) | 0.04 | (0.20) | 1.00 | (0.00) | 0.11 | (0.31) | 0.67 | (0.47) | 10,911.692 | <0.001 |
| Self-care | 0.99 | (0.10) | 0.96 | (0.20) | 0.86 | (0.35) | 0.30 | (0.46) | 0.86 | (0.35) | 3272.555 | <0.001 |
| Usual activities | 1.00 | (0.07) | 0.56 | (0.50) | 0.98 | (0.15) | 0.00 | (0.00) | 0.76 | (0.43) | 8937.071 | <0.001 |
| Pain/discomfort | 0.76 | (0.43) | 0.11 | (0.31) | 0.41 | (0.49) | 0.08 | (0.27) | 0.51 | (0.50) | 1788.401 | <0.001 |
| Anxiety/depression | 1.00 | (0.00) | 0.78 | (0.41) | 0.01 | (0.20) | 0.26 | (0.44) | 0.75 | (0.43) | 59.5.925 | <0.001 |
| Characteristics | Categories | Comparison Group (Ref = Class 1) | ||||||
|---|---|---|---|---|---|---|---|---|
| Class 2 | Class 3 | Class 4 | ||||||
| OR | p | OR | p | OR | p | |||
| General characteristics | Low income (ref = no) | Yes | 1.18 | 0.245 | 1.08 | 0.641 | 2.04 | <0.001 |
| Household type (ref = others) | One-person household | 1.14 | 0.150 | 1.40 | 0.003 | 0.98 | 0.846 | |
| Married couple household | 0.84 | 0.019 | 1.06 | 0.542 | 0.94 | 0.489 | ||
| Single parent household | 0.96 | 0.828 | 1.22 | 0.476 | 0.87 | 0.581 | ||
| Physical health | Hypertension (ref = no) | Yes | 1.30 | <0.001 | 1.06 | 0.489 | 1.12 | 0.140 |
| Diabetes (ref = no) | Yes | 1.11 | 0.281 | 1.05 | 0.658 | 0.99 | 0.916 | |
| Number of falls | 1.30 | <0.001 | 1.26 | <0.001 | 1.56 | <0.001 | ||
| Psychological health | Depression (ref = no) | Yes | 2.67 | <0.001 | 4.91 | <0.001 | 10.30 | <0.001 |
| Discomfort from cognitive decline | 1.47 | <0.001 | 1.79 | <0.001 | 2.12 | <0.001 | ||
| Happiness | 0.87 | <0.001 | 0.64 | <0.001 | 0.65 | <0.001 | ||
| Social health | Degree of contact | 0.92 | <0.001 | 0.95 | 0.055 | 0.91 | <0.001 | |
| Trust in social environment | 1.09 | 0.001 | 0.90 | 0.001 | 1.00 | 0.956 | ||
| Participation in social activities (ref = yes) | No | 1.39 | <0.001 | 0.89 | 0.172 | 1.82 | <0.001 | |
Publisher’s Note: MDPI stays neutral with regard to jurisdictional claims in published maps and institutional affiliations. |
© 2021 by the authors. Licensee MDPI, Basel, Switzerland. This article is an open access article distributed under the terms and conditions of the Creative Commons Attribution (CC BY) license (https://creativecommons.org/licenses/by/4.0/).
Share and Cite
Choi, E.-H.; Kang, M.-J.; Lee, H.-J.; Yun, M.-S. A Latent Class Analysis of Health-Related Quality of Life in Korean Older Adults. Int. J. Environ. Res. Public Health 2021, 18, 7874. https://0-doi-org.brum.beds.ac.uk/10.3390/ijerph18157874
Choi E-H, Kang M-J, Lee H-J, Yun M-S. A Latent Class Analysis of Health-Related Quality of Life in Korean Older Adults. International Journal of Environmental Research and Public Health. 2021; 18(15):7874. https://0-doi-org.brum.beds.ac.uk/10.3390/ijerph18157874
Chicago/Turabian StyleChoi, Eun-Hi, Mi-Jung Kang, Hyun-Jin Lee, and Mi-Soon Yun. 2021. "A Latent Class Analysis of Health-Related Quality of Life in Korean Older Adults" International Journal of Environmental Research and Public Health 18, no. 15: 7874. https://0-doi-org.brum.beds.ac.uk/10.3390/ijerph18157874