
Infectious Disease Relational Data Analysis Using String Grammar Non-Euclidean Relational Fuzzy C-Means


Abstract
:1. Introduction
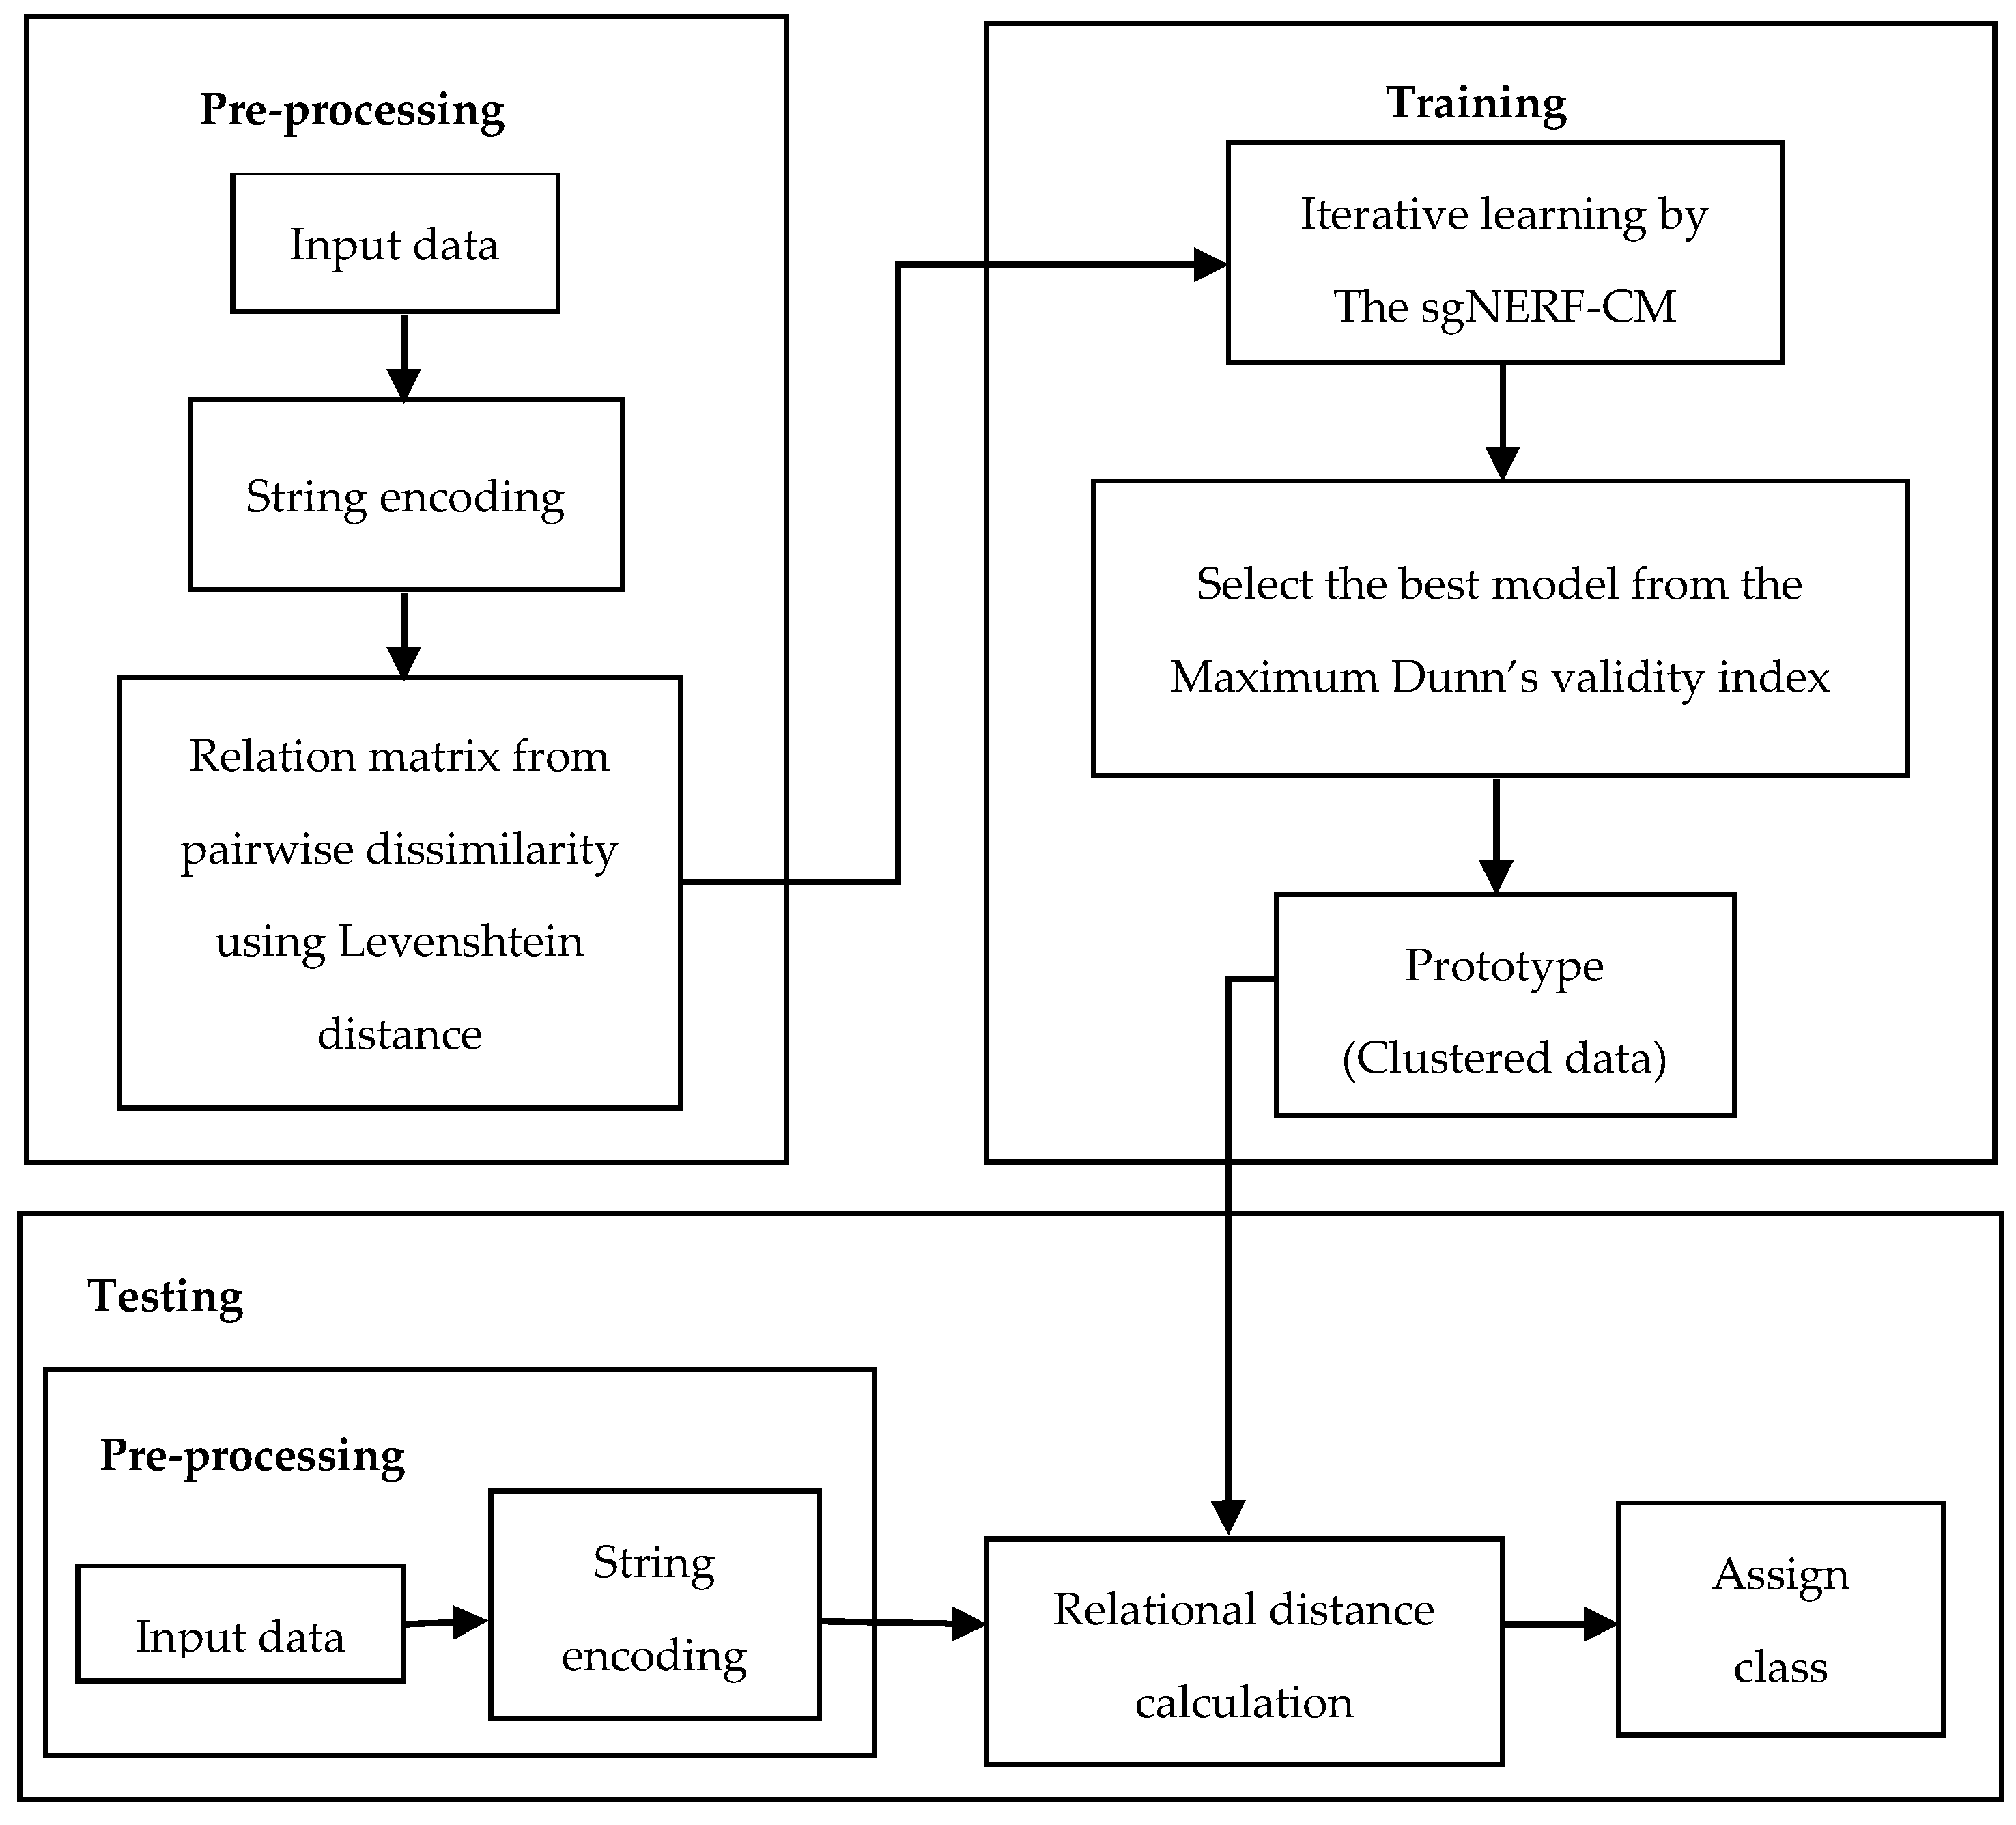
2. String Grammar Non-Euclidean Relational Fuzzy C-Means (sgNERF-CM) Algorithm
3. System Description
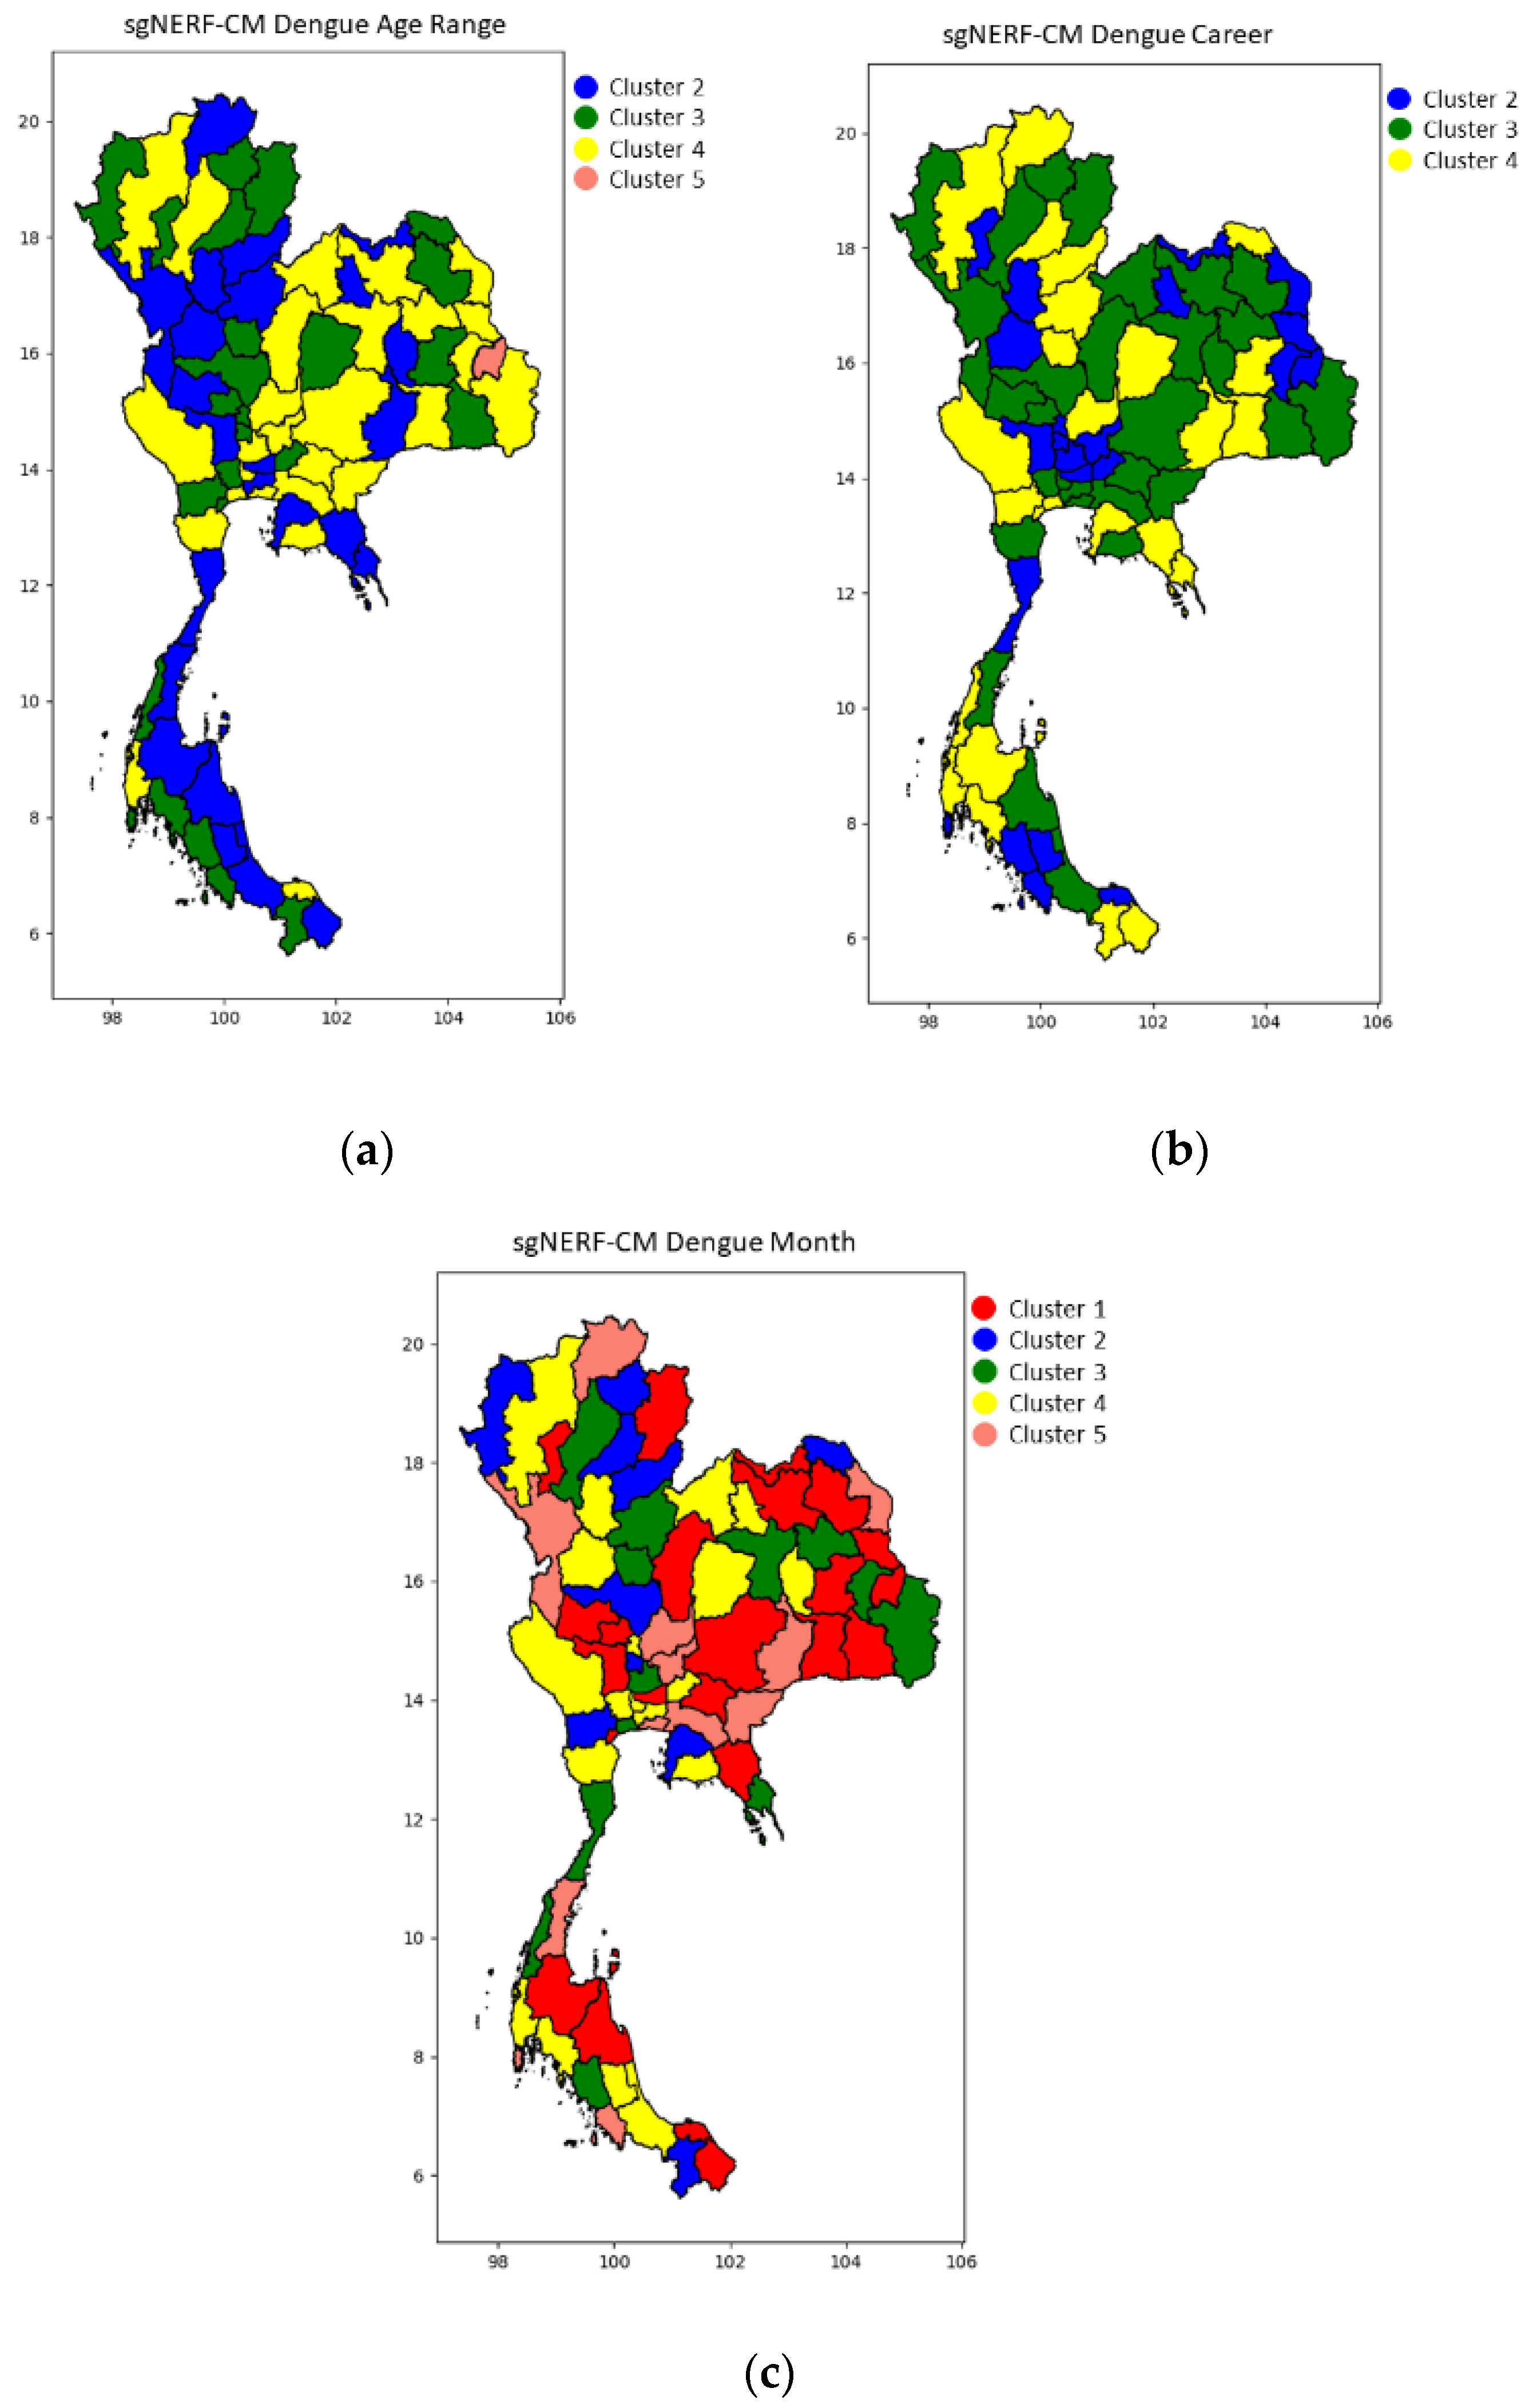
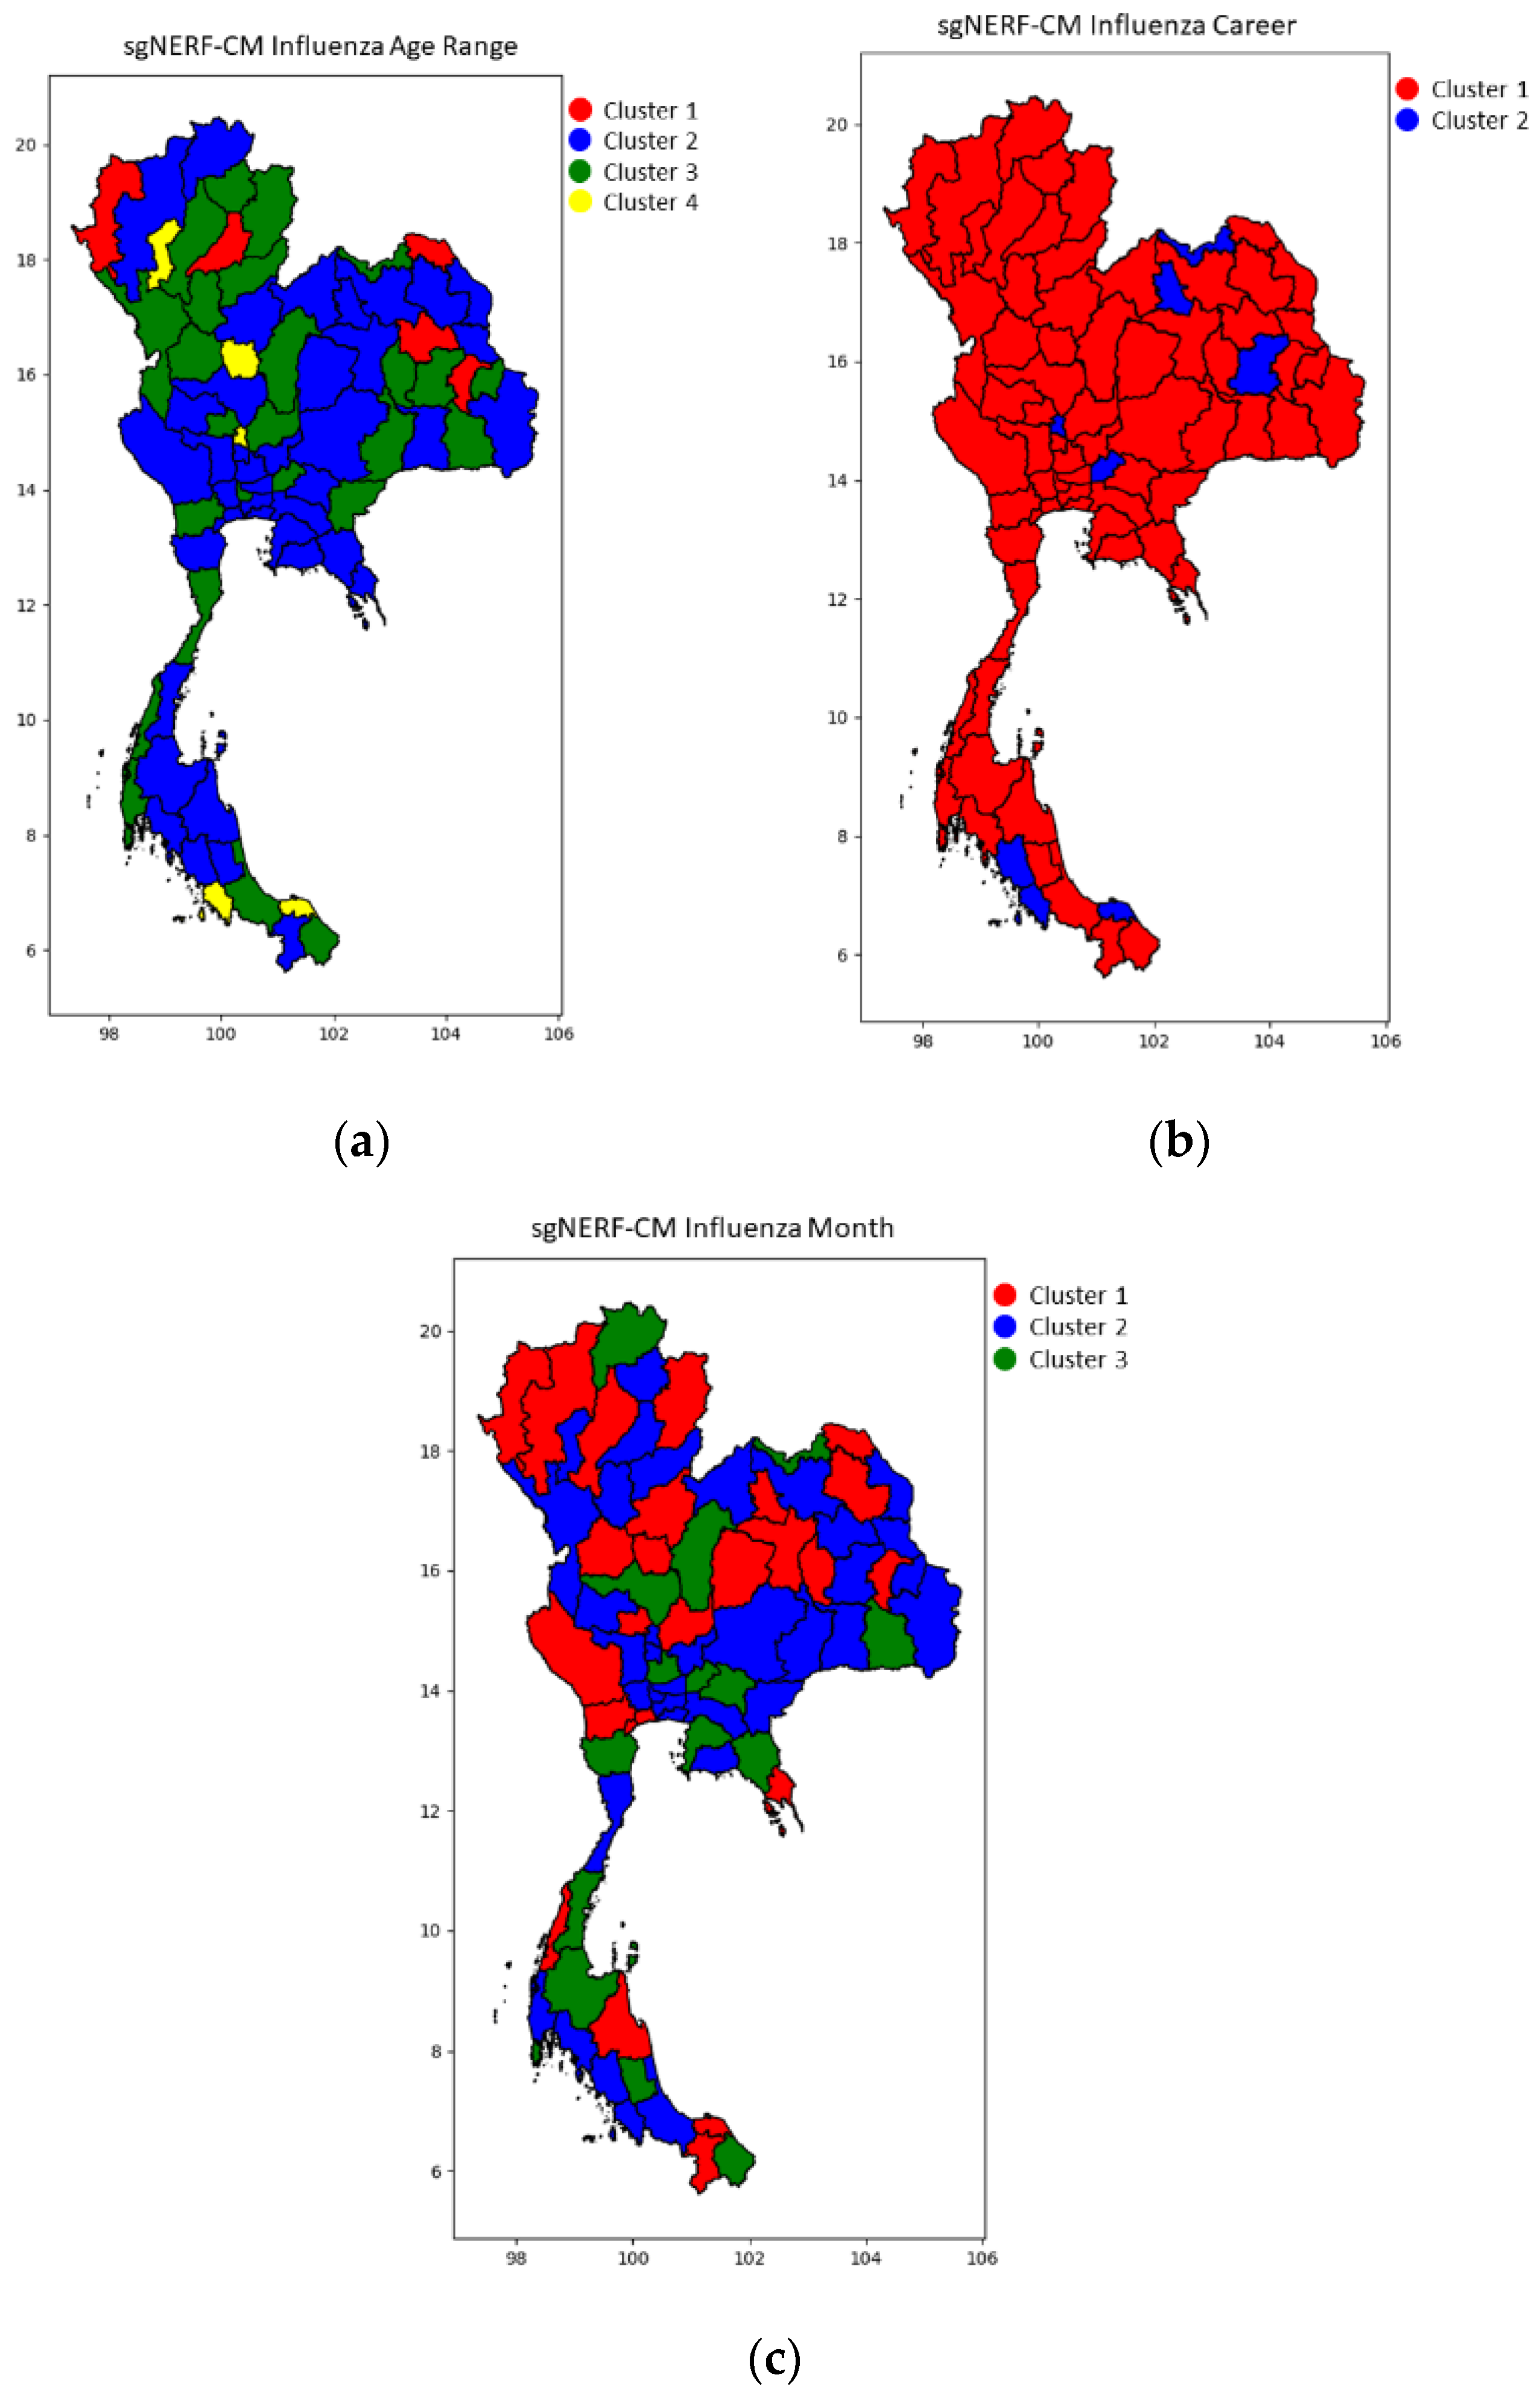
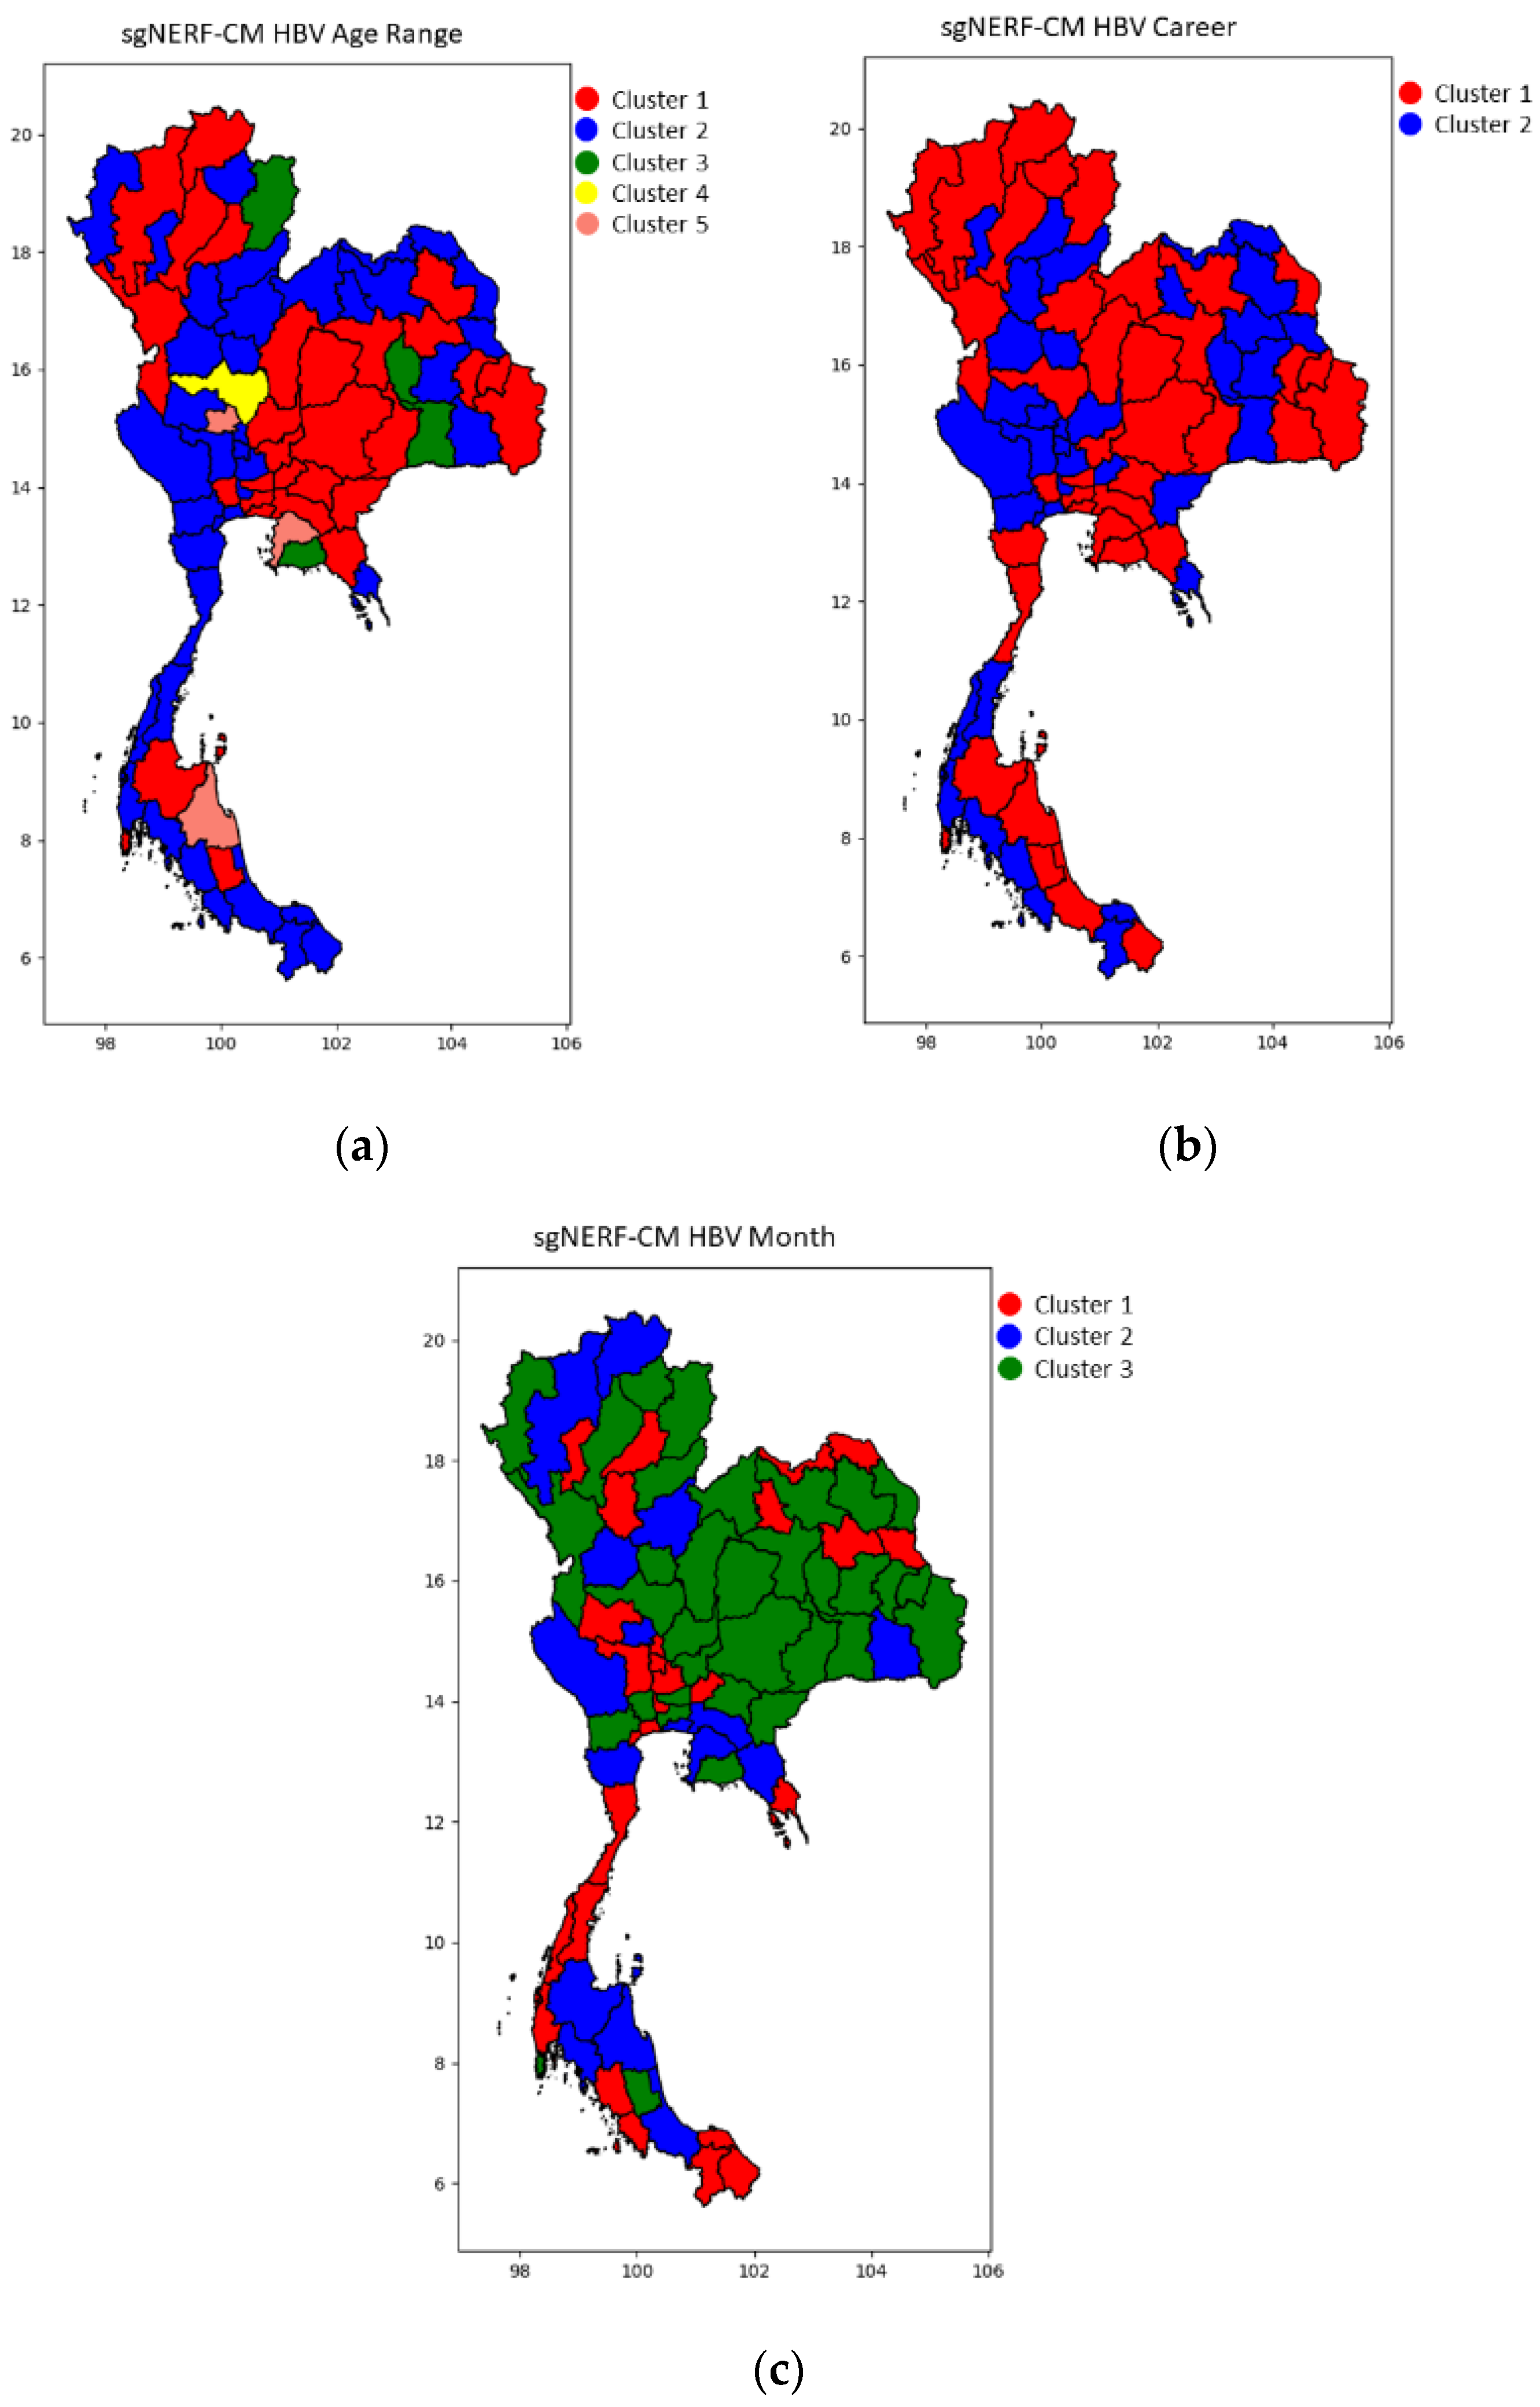
4. Simulation Results
5. Conclusions
Author Contributions
Funding
Institutional Review Board Statement
Informed Consent Statement
Data Availability Statement
Acknowledgments
Conflicts of Interest
References
- Becker, N.G.; Britton, T. Statistical studies of infectious disease incidence. J. R. Statist. Soc. B. 1999, 61, 287–307. [Google Scholar] [CrossRef]
- Truong, P.N.; Nguyen, T.V.; Nguyen, T.T.T.; Stein, A. A spatial-temporal statistical analysis of health seasonality: Explaining HFMD infections within a children population along the Vietnamese south central coast. BMC Public Health 2019, 19, 937. [Google Scholar] [CrossRef] [PubMed]
- Barbazan, P.; Yoksan, S.; Gonzalez, J.P. Dengue hemorrhagic fever epidemiology in Thailand: Description and forecasting of epidemics. Microbes Infect. 2002, 4, 699–705. [Google Scholar] [CrossRef]
- Lai, P.C.; Wong, C.M.; Hedley, A.J.; Lo, S.V.; Leung, P.Y.; Kong, J.; Leung, G.M. Understanding the spatial clustering of severe acute respiratory syndrome (SARS) in Hong Kong. Environ. Health Perspect 2004, 122, 1550–1556. [Google Scholar] [CrossRef] [PubMed] [Green Version]
- Merletti, F.; Soskolne, C.L.; Vineis, P. Epidemiological Method Applied to Occupational Health and Safety. In Encyclopaedia of Occupational Health and Safety, 4th ed.; The International Labour Office; Available online: http://www.ilocis.org/documents/chpt28e.htm (accessed on 1 February 2021).
- Levy, P.S.; Stolte, K. Statistical methods in public health and epidemiology: A look at the recent past and projections for the next decade. Stat. Methods Med Res. 2000, 9, 44–55. [Google Scholar] [CrossRef] [PubMed]
- Donnelly, C.A.; Ghani, A.C.; Leung, G.M.; Hedley, A.J.; Fraser, C.; Riley, S.; Abu-Raddad, L.J.; Ho, L.-M.; Thach, T.-Q.; Chau, P.; et al. Epidemiological determinants of spread of causal agent of severe acute respiratory syndrome in Hong Kong. Lancet 2003, 361, 1761–1766. [Google Scholar] [CrossRef] [Green Version]
- Beckett, C.G.; Kosasih, H.; Faisal, I.; Nurhayati, R.T.; Tan, R.; Widjaja, S.; Listiyaningsih, E.; Ma’Roef, C.; Wurtadi, S.; Bangs, M.J.; et al. Early detection of dengue infections using cluster sampling around index cases. Am. J. Trop. Med. Hyg. 2005, 72, 777–782. [Google Scholar] [CrossRef] [PubMed]
- Mutheneni, S.R.; Mopuri, R.; Naish, S.; Gunti, D.; Upadhyayula, S.M. Spatial distribution and cluster analysis of dengue using self-organizing maps in Andhra Pradesh, India, 2011–2013. Parasite Epidemiol Control. 2016, 3, 52–61. [Google Scholar] [CrossRef] [PubMed] [Green Version]
- Zambrano, L.I.; Sierra, M.; Lara, B.; Rodríguez-Núñez, I.; Medina, M.T.; Lozada-Riascos, C.O.; Rodríguez-Morales, A.J. Estimating and mapping the incidence of dengue and chikungunya in Honduras during 2015 using Geographic Information Systems (GIS). J. Infect. Public Health 2017, 10, 446–456. [Google Scholar] [CrossRef] [PubMed] [Green Version]
- Lai, W.T.; Chen, C.H.; Hung, H.; Chen, R.-B.; Shete, S.; Wu, C.-C. Recognizing spatial and temporal clustering patterns of dengue outbreaks in Taiwan. BMC Infect. Dis. 2018, 18, 1–11. [Google Scholar] [CrossRef] [PubMed]
- Rejeki, D.S.; Nurhayati, N.; Aji, B. A spatiotemporal analysis of dengue hemorrhagic fever in Banyumas, Indonesia. Int. J. Public Health Sci. (IJPHS) 2021, 10, 231–240. [Google Scholar] [CrossRef]
- Hathaway, R.J.; Davenport, J.W.; Bezdek, J.C. Relational Duals of the c-Mean Clustering Algorithms. Pattern Recognit. 1989, 22, 205–212. [Google Scholar] [CrossRef]
- Hathaway, R.J.; Bezdek, J.C. NERF c-Means: Non-Euclidean Relational Fuzzy Clustering. Pattern Recognit. 1994, 27, 429–437. [Google Scholar] [CrossRef]
- Bezdek, J.C.; Keller, J.; Krishnapuram, R.; Pal, N.R. Fuzzy Models and Algorithms for Pattern Recognition and Image Processing; Springer Science Business Media, Inc.: New York, NY, USA, 1999. [Google Scholar]
- Fu, K.S. Syntactic Pattern Recognition and Application; Prentice-Hall, Inc.: Englewood Cliffs, NJ, USA, 1982. [Google Scholar]
- Gonzalez, R.C.; Thomson, M.G. Syntactic Pattern Recognition an Introduction; Addison-Wesley Publishing Company, Inc.: Boston, MA, USA, 1978. [Google Scholar]
- Fu, K.; Lu, S. A Clustering Procedure for Syntactic Patterns. IEEE Trans. Syst. Man. Cybern. 1977, 7, 734–742. [Google Scholar] [CrossRef]
- Juan, A.; Vidal, E. On the Use of Normalized Edit Distances and an Efficient k-NN Search Technique (k-AESA) for Fast and Accurate String Classification. In Proceedings of the 15th International Conference on Pattern Recognition, Barcelona, Spain, 3–7 September 2000; pp. 676–679. [Google Scholar]
- Klomsae, A.; Auephanwiriyakul, S.; Theera-Umpon, N. A string grammar possibilistic-fuzzy C-medians. Soft Comput. 2019, 23, 7637–7653. [Google Scholar] [CrossRef]
- Klomsae, A.; Auephanwiriyakul, S.; Theera-Umpon, N. A Novel String Grammar Unsupervised Possibilistic C-Medians Algorithm for Sign Language Translation Systems. Symmetry 2017, 9, 321. [Google Scholar] [CrossRef] [Green Version]
- Klomsae, A.; Auephanwiriyakul, S.; Theera-Umpon, N. A String Grammar Fuzzy-Possibilistic C-Medians. Appl. Soft Comput. 2017, 57, 684–695. [Google Scholar] [CrossRef]
- Klomsae, A.; Auephanwiriyakul, S.; Theera-Umpon, N. A Novel String Grammar Fuzzy C-Medians. In Proceedings of the 2015 IEEE International Conference on Fuzzy Systems, Istanbul, Turkey, 2–5 August 2015. [Google Scholar]
- Bouthwong, A.; Auephanwiriyakul, S.; Theera-Umpon, N. sgRHCM: String Grammar Relational Hard C-Means. In Proceedings of the International Conference on Green and Human Information Technology, Hanoi, Vietnam, 5–7 February 2020. [Google Scholar]
- National Disease Survelliance. Available online: http://www.boe.moph.go.th/boedb/surdata (accessed on 23 March 2020).
- Dunn, J.C. Well-Separated Clusters and Optimal Fuzzy Partitions. Cybern. Syst. 1974, 4, 5–104. [Google Scholar] [CrossRef]
- Ansari, Z.; Azeem, M.F.; Ahmed, W.; Babu, A.V. Quantitative Evaluation of Performance and Validity Indices for Clustering the Web Navigational Sessions. World Comput. Sci. Inf. Technol. J. 2011, 1, 217–226. [Google Scholar]


| Year | Province | Under 28 Days | Under 1 Year | 1 Years and Over | 2 Years and Over | 3 Years and Over | 4 Years and Over | 5 Years and Over | 6 Years and Over | 7–9 Years | 10–14 Years | 15–24 Years | 25–34 Years | 35–44 Years | 45–54 Years | 55–64 Years | Over 65 Years | Unknown |
|---|---|---|---|---|---|---|---|---|---|---|---|---|---|---|---|---|---|---|
| 2018 | Chiang Mai | 0 | 4 | 4 | 9 | 10 | 8 | 10 | 13 | 51 | 117 | 264 | 268 | 162 | 71 | 73 | 33 | 0 |
| 2018 | Narathiwat | 0 | 3 | 4 | 4 | 11 | 7 | 11 | 13 | 41 | 53 | 65 | 61 | 37 | 17 | 19 | 9 | 0 |
| 2017 | Chon Buri | 0 | 10 | 17 | 8 | 17 | 6 | 17 | 15 | 64 | 145 | 153 | 85 | 46 | 19 | 7 | 5 | 0 |
| 2017 | Samut Prakan | 0 | 8 | 11 | 18 | 14 | 18 | 17 | 29 | 112 | 192 | 213 | 79 | 47 | 25 | 11 | 6 | 0 |
| 2016 | Sukhothai | 0 | 0 | 2 | 1 | 5 | 8 | 9 | 17 | 31 | 53 | 65 | 21 | 9 | 6 | 4 | 0 | 0 |
| 2016 | Nakhon Sawan | 0 | 7 | 4 | 9 | 7 | 10 | 8 | 12 | 52 | 69 | 125 | 55 | 25 | 23 | 9 | 15 | 0 |
| 2015 | Uthai Thani | 0 | 3 | 4 | 7 | 15 | 17 | 17 | 32 | 124 | 285 | 324 | 174 | 100 | 44 | 37 | 25 | 0 |
| 2015 | Bangkok | 0 | 65 | 87 | 108 | 128 | 129 | 152 | 192 | 798 | 1711 | 3338 | 2520 | 1668 | 989 | 576 | 277 | 0 |
| 2014 | Tak | 0 | 2 | 2 | 14 | 9 | 10 | 16 | 15 | 52 | 99 | 87 | 35 | 28 | 16 | 5 | 2 | 0 |
| 2014 | Rayong | 0 | 1 | 5 | 8 | 4 | 9 | 11 | 17 | 36 | 71 | 116 | 80 | 53 | 26 | 14 | 6 | 0 |
| Year | Province | Farmers | Public Servant | General Contractor | Merchant | Housekeeper | Student | Soldier | Fisherman | Teacher | Other | Unknow | Herdsman | Priest | Special Occupation | Public Health Personnel |
|---|---|---|---|---|---|---|---|---|---|---|---|---|---|---|---|---|
| 2018 | Chiang Mai | 57 | 9 | 411 | 60 | 31 | 331 | 1 | 0 | 6 | 57 | 99 | 0 | 17 | 8 | 10 |
| 2018 | Tak | 341 | 7 | 895 | 77 | 62 | 793 | 11 | 0 | 5 | 146 | 252 | 0 | 12 | 0 | 1 |
| 2017 | Chon Buri | 5 | 1 | 42 | 8 | 6 | 183 | 2 | 0 | 1 | 0 | 37 | 0 | 0 | 0 | 1 |
| 2017 | Samut Prakan | 17 | 5 | 81 | 10 | 7 | 214 | 1 | 2 | 1 | 3 | 45 | 0 | 0 | 0 | 0 |
| 2016 | Kalasin | 57 | 8 | 142 | 7 | 8 | 303 | 1 | 0 | 2 | 3 | 85 | 0 | 9 | 0 | 1 |
| 2016 | Chaiyaphum | 58 | 5 | 98 | 6 | 18 | 644 | 5 | 0 | 1 | 194 | 207 | 0 | 0 | 0 | 1 |
| 2015 | Phangnga | 140 | 3 | 42 | 3 | 2 | 877 | 7 | 0 | 1 | 1 | 154 | 0 | 2 | 0 | 3 |
| 2015 | Bangkok | 57 | 0 | 21 | 5 | 12 | 354 | 0 | 0 | 1 | 20 | 65 | 0 | 3 | 0 | 5 |
| 2014 | Nong Khai | 198 | 6 | 276 | 44 | 30 | 696 | 4 | 2 | 7 | 21 | 76 | 0 | 3 | 0 | 3 |
| 2014 | Buri Ram | 100 | 40 | 113 | 8 | 22 | 106 | 5 | 0 | 4 | 9 | 61 | 0 | 1 | 8 | 61 |
| Year | Province | Jan | Feb | Mar | Apr | May | Jun | Jul | Aug | Sep | Oct | Nov | Dec |
|---|---|---|---|---|---|---|---|---|---|---|---|---|---|
| 2018 | Trat | 6 | 9 | 16 | 15 | 31 | 56 | 71 | 34 | 53 | 38 | 36 | 21 |
| 2018 | Khon Kaen | 5 | 5 | 6 | 9 | 64 | 132 | 138 | 143 | 120 | 67 | 83 | 80 |
| 2017 | Samut Sakhon | 75 | 48 | 36 | 19 | 20 | 26 | 51 | 60 | 42 | 40 | 66 | 26 |
| 2017 | Suphan Buri | 29 | 38 | 37 | 18 | 5 | 15 | 19 | 25 | 34 | 30 | 32 | 5 |
| 2016 | Tak | 26 | 18 | 20 | 19 | 19 | 31 | 58 | 63 | 43 | 49 | 39 | 17 |
| 2016 | Uttaradit | 13 | 6 | 22 | 11 | 12 | 12 | 37 | 46 | 36 | 7 | 6 | 1 |
| 2014 | Narathiwat | 34 | 19 | 3 | 6 | 13 | 15 | 44 | 75 | 67 | 66 | 48 | 25 |
| 2014 | Phatthalung | 36 | 42 | 29 | 26 | 16 | 69 | 39 | 50 | 40 | 69 | 59 | 48 |
| 2013 | Bangkok | 575 | 282 | 292 | 210 | 271 | 0 | 0 | 0 | 0 | 0 | 0 | 0 |
| Disease | Category | Year | Province | String Grammar |
|---|---|---|---|---|
| Dengue fever | Age Range | 2017 | Roi Et | 2, 12, 15, 28, 25, 49, 45, 75, 350, 735, 555, 129, 61, 38, 29, 16, 0 |
| Monthly | 2018 | Ranong | 5, 2, 52, 4, 4, 89, 2, 3, 0, 1, 7, 0, 0, 0, 2 | |
| Career | 2013 | Trat | 15, 15, 48, 58, 56, 131, 91, 43, 24, 9, 9, 5 | |
| Influenza | Age Range | 2018 | Phichit | 0, 37, 49, 57, 60, 51, 56, 41, 79, 99, 110, 115, 98, 95, 74, 74, 0 |
| Monthly | 2016 | Loei | 81, 6, 38, 0, 0, 101, 7, 0, 1, 2, 214, 0, 1, 0, 1 | |
| Career | 2014 | Bangkok | 1440, 4216, 3629, 1003, 572, 697, 1055, 1343, 1822, 1298, 1852, 1395 | |
| HBV | Age Range | 2011 | Buri Ram | 0, 0, 0, 1, 0, 0, 0, 0, 1, 6, 31, 56, 86, 82, 62, 24, 0 |
| Monthly | 2008 | Krabi | 4, 0, 11, 0, 2, 2, 0, 0, 0, 1, 1, 0, 0, 0, 0 | |
| Career | 2018 | Phayao | 10, 8, 13, 3, 13, 5, 2, 10, 10, 13, 11, 13 |
| Report Categories | Dengue Fever | Influenza | HBV | |||
|---|---|---|---|---|---|---|
| Training | Blind Test | Training | Blind Test | Training | Blind Test | |
| Age Range | 487 | 76 | 791 | 76 | 791 | 76 |
| Monthly | 487 | 76 | 791 | 76 | 791 | 76 |
| Career | 487 | 76 | 730 | 76 | 730 | 76 |
| Data Set | sgNERF-CM | sgRHCM | NERF-CM | RHCM | ||||
|---|---|---|---|---|---|---|---|---|
| (No. Train, No. of Clusters) | Dunn’s Index | (No. Train, No. of Clusters) | Dunn’s Index | (No. Train, No. of Clusters) | Dunn’s Index | (No. Train, No. of Clusters) | Dunn’s Index | |
| Dengue fever | (3rd, 5) | 0.317 | (3rd, 6) | 0.317 | (5th, 2) | 0.016 | (3rd, 2) | 0.013 |
| Influenza | (5th, 4) | 0.250 | (5th, 7) | 0.225 | (4th, 6) | 0.006 | (3rd, 4) | 0.013 |
| HBV | (1st, 6) | 0.114 | (3rd, 3) | 0.114 | (1st, 2) | 0.031 | (1st, 2) | 0.032 |
| Data Set | sgNERF-CM | sgRHCM | NERF-CM | RHCM | ||||
|---|---|---|---|---|---|---|---|---|
| (No. Train, No. of Clusters) | Dunn’s Index | (No. Train, No. of Clusters) | Dunn’s Index | (No. Train, No. of Clusters) | Dunn’s Index | (No. Train, No. of Clusters) | Dunn’s Index | |
| Dengue fever | (4th, 5) | 0.241 | (3rd, 3) | 0.232 | (3rd, 2) | 0.009 | (5th, 3) | 0.031 |
| Influenza | (1st, 3) | 0.214 | (1st, 2) | 0.214 | (4th, 4) | 0.003 | (5th, 8) | 0.005 |
| HBV | (4th, 2) | 0.167 | (3rd, 2) | 0.139 | (4th, 2) | 0.019 | (3rd, 2) | 0.013 |
| Data Set | sgNERF-CM | sgRHCM | NERF-CM | RHCM | ||||
|---|---|---|---|---|---|---|---|---|
| (No. Train, No. of Clusters) | Dunn’s Index | (No. Train, No. of Clusters) | Dunn’s Index | (No. Train, No. of Clusters) | Dunn’s Index | (No. Train, No. of Clusters) | Dunn’s Index | |
| Dengue fever | (3rd, 5) | 0.315 | (3rd, 8) | 0.308 | (3rd, 2) | 0.010 | (5th, 3) | 0.031 |
| Influenza | (5th, 3) | 0.209 | (3rd, 5) | 0.222 | (5th, 2) | 0.005 | (5th, 2) | 0.006 |
| HBV | (5th, 3) | 0.190 | (5th, 5) | 0.195 | (1st, 2) | 0.053 | (5th, 3) | 0.031 |
| Data | Cluster | Province | (<28 Days, <1 Year, 1+, 2+, 3+, 4+, 5+, 6+, 7–9, 10–14, 15–24, 25–34, 35–44, 45–54, 55–64, 65+, Unknown) |
|---|---|---|---|
| Training | 1 | 2561, Phichit | 0, 5, 11, 5, 11, 18, 15, 29, 67, 209, 237, 104, 50, 32, 20, 8, 0 |
| 1 | 2556, Nonthaburi | 0, 2, 8, 8, 13, 13, 12, 15, 53, 126, 198, 84, 59, 35, 19, 9, 0 | |
| Blind Test | 1 | No data are assigned | |
| Training | 2 | 2561, Chiang Rai | 0, 22, 25, 32, 42, 55, 59, 47, 159, 323, 538, 436, 315, 248, 208, 93, 0 |
| 2 | 2560, Roi Et | 2, 12, 15, 28, 25, 49, 45, 75, 350, 735, 555, 129, 61, 38, 29, 16, 0 | |
| Blind Test | 2 | 2562, Trat | 0, 4, 3, 5, 7, 9, 21, 11, 58, 94, 108, 90, 43, 20, 15, 6, 0 |
| 2 | 2562, Narathiwat | 0, 3, 9, 4, 7, 8, 18, 20, 63, 113, 147, 115, 56, 30, 18, 13, 0 | |
| Training | 3 | 2558, Chumphon | 0, 3, 2, 10, 8, 6, 6, 16, 50, 125, 124, 68, 34, 20, 19, 5, 0 |
| 3 | 2557, Mae Hong Son | 0, 0, 1, 0, 3, 5, 9, 15, 42, 77, 117, 62, 34, 36, 16, 9, 0 | |
| Blind Test | 3 | 2562, Chai Nat | 0, 0, 2, 1, 1, 2, 8, 5, 28, 58, 63, 27, 21, 11, 11, 3, 0 |
| 3 | 2562, Krabi | 0, 7, 2, 12, 10, 3, 6, 8, 38, 61, 64, 30, 26, 13, 4, 5, 0 | |
| Training | 4 | 2561, Ratchaburi | 0, 9, 9, 14, 18, 22, 34, 46, 140, 320, 291, 139, 69, 34, 28, 13, 0 |
| 4 | 2556, Tak | 1, 4, 8, 12, 14, 21, 23, 21, 93, 201, 260, 153, 71, 29, 14, 13, 0 | |
| Blind Test | 4 | 2562, Loei | 0, 12, 21, 14, 22, 26, 25, 38, 145, 309, 305, 127, 55, 35, 35, 19, 0 |
| 4 | 2562, Nakhon Phanom | 0, 4, 1, 3, 10, 17, 20, 25, 90, 221, 149, 62, 52, 23, 18, 9, 0 | |
| Training | 5 | 2560, Amnat Charoen | 0, 2, 1, 3, 3, 6, 9, 16, 68, 127, 96, 19, 15, 7, 3, 3, 0 |
| 5 | 2558, Surat Thani | 0, 1, 2, 2, 6, 8, 6, 6, 43, 85, 169, 87, 35, 11, 7, 3, 0 | |
| Blind Test | 5 | 2562, Amnat Charoen | 0, 1, 1, 1, 3, 7, 8, 11, 55, 102, 79, 23, 9, 9, 9, 7, 0 |
| Data | Cluster | Province | (Farmers, Public Servant, General Contractor, Merchant, Housekeeper, Student, Military/Police, Fisherman, Teacher, Other, Unknown, Herdsman, Priest, Special Occupation, Public Health Personnel) |
|---|---|---|---|
| Training | 1 | 2561, Phangnga | 11, 5, 80, 4, 6, 111, 0, 0, 2, 6, 96, 0, 0, 0, 1 |
| 1 | 2559, Samut Sakhon | 4, 2, 87, 3, 11, 125, 1, 0, 0, 2, 58, 0, 1, 0, 0 | |
| Blind Test | 1 | No data are assigned | |
| Training | 2 | 2561, Loei | 31, 1, 21, 9, 4, 206, 2, 0, 0, 2, 36, 0, 0, 0, 2 |
| 2 | 2560, Sa Kaeo | 12, 0, 43, 5, 5, 262, 4, 0, 0, 0, 38, 0, 2, 0, 0 | |
| Blind Test | 2 | 2562, Satun | 6, 3, 5, 1, 0, 58, 0, 0, 0, 1, 9, 0, 1, 0, 0 |
| 2 | 2562, Ang Thong | 3, 2, 32, 3, 5, 56, 0, 0, 1, 2, 9, 2, 0, 0, 0 | |
| Training | 3 | 2561, Nakhon Ratchasima | 87, 24, 279, 38, 62, 1431, 23, 0, 8, 36, 418, 0, 9, 0, 8 |
| 3 | 2555, Nakhon Ratchasima | 41, 13, 194, 20, 30, 963, 14, 0, 3, 9, 193, 0, 4, 0, 3 | |
| Blind Test | 3 | 2562, Kalasin | 76, 6, 75, 12, 22, 517, 4, 0, 1, 6, 231, 0, 4, 0, 3 |
| 3 | 2562, Ubon Ratchathani | 299, 18, 220, 27, 260, 3610, 16, 0, 7, 24, 1595, 0, 21, 0, 3 | |
| Training | 4 | 2560, Phrae | 57, 8, 142, 7, 8, 303, 1, 0, 2, 3, 85, 0, 9, 0, 1 |
| 4 | 2558, Trat | 61, 9, 173, 29, 29, 264, 3, 16, 4, 14, 57, 0, 5, 0, 11 | |
| Blind Test | 4 | 2562, Narathiwat | 57, 12, 120, 6, 31, 311, 25, 0, 9, 6, 41, 0, 0, 0, 6 |
| 4 | 2562, Yala | 148, 11, 78, 22, 50, 459, 26, 0, 14, 16, 85, 0, 0, 0, 1 | |
| Training | 5 | 2561, Buri Ram | 29, 2, 46, 4, 5, 686, 0, 0, 0, 5, 120, 0, 2, 0, 1 |
| 5 | 2557, Nakhon Sawan | 22, 5, 54, 7, 16, 179, 5, 0, 0, 8, 113, 0, 2, 0, 0 | |
| Blind Test | 5 | No data are assigned | |
| Data | Cluster | Province | (Jan, Feb, Mar, Apr, May, Jun, Jul, Aug, Sep, Oct, Nov, Dec) |
|---|---|---|---|
| Training | 1 | 2561, Nakhon Pathom | 57, 41, 43, 79, 114, 222, 247, 251, 206, 246, 256, 228 |
| 1 | 2556, Rayong | 85, 77, 54, 59, 81, 127, 142, 95, 84, 63, 59, 30 | |
| Blind Test | 1 | Pattani | 53, 37, 18, 11, 39, 71, 88, 75, 50, 56, 44, 21 |
| 1 | Phetchabun | 5, 7, 20, 29, 60, 174, 147, 122, 83, 35, 22, 6 | |
| Training | 2 | 2559, Chanthaburi | 43, 31, 37, 16, 38, 62, 108, 72, 41, 45, 40, 9 |
| 2 | 2558, Nan | 0, 0, 2, 13, 60, 73, 101, 77, 47, 16, 8, 7 | |
| Blind Test | 2 | Phrae | 1, 7, 7, 8, 20, 53, 108, 80, 35, 22, 11, 5 |
| 2 | Uttaradit | 10, 7, 10, 46, 25, 74, 171, 67, 54, 37, 22, 15 | |
| Training | 3 | 2561, Surin | 10, 5, 19, 23, 145, 277, 380, 273, 257, 117, 49, 49 |
| 3 | 2556, Mae Hong Son | 2, 10, 11, 32, 152, 333, 398, 275, 112, 63, 60, 25 | |
| Blind Test | 3 | Kalasin | 13, 17, 32, 43, 50, 172, 203, 183, 98, 69, 56, 21 |
| 3 | Phitsanulok | 12, 14, 20, 14, 18, 42, 56, 87, 99, 61, 46, 15 | |
| Training | 4 | 2560, Maha Sarakham | 58, 46, 72, 45, 98, 275, 388, 402, 198, 81, 33, 10 |
| 4 | 2556, Maha Sarakham | 58, 46, 72, 45, 98, 275, 388, 402, 198, 81, 33, 10 | |
| Blind Test | 4 | Maha Sarakham | 20, 25, 32, 17, 14, 89, 145, 146, 152, 93, 35, 13 |
| 4 | Loei | 6, 2, 9, 48, 103, 288, 303, 141, 119, 100, 56, 13 | |
| Training | 5 | 2560, Yasothon | 13, 14, 11, 22, 65, 107, 84, 86, 44, 16, 5, 1 |
| 5 | 2556, Yasothon | 13, 14, 11, 22, 65, 107, 84, 86, 44, 16, 5, 1 | |
| Blind Test | 5 | Nakhon Phanom | 2, 11, 15, 49, 166, 241, 107, 68, 26, 11, 5, 3 |
| 5 | Chumphon | 30, 38, 36, 47, 64, 69, 77, 53, 45, 35, 11, 11 |
| Data | Cluster | Province | (<28 Days, <1 Year, 1+, 2+, 3+, 4+, 5+, 6+, 7–9, 10–14, 15–24, 25–34, 35–44, 45–54, 55–64, 65+, Unknown) |
|---|---|---|---|
| Training | 1 | 2559, Chachoengsao | 0, 51, 44, 34, 53, 46, 50, 42, 112, 95, 120, 158, 101, 63, 48, 36, 0 |
| 1 | 2552, Maha Sarakham | 0, 2, 7, 9, 12, 5, 6, 16, 55, 128, 200, 80, 61, 46, 48, 16, 3 | |
| Blind Test | 1 | 2562, Mae Hong Son | 0, 37, 51, 58, 56, 55, 50, 63, 135, 162, 148, 150, 111, 67, 53, 50, 0 |
| 1 | 2562, Kalasin | 0, 41, 52, 62, 70, 77, 70, 78, 210, 261, 182, 169, 108, 129, 94, 83, 0 | |
| Training | 2 | 2561, Lop Buri | 1, 63, 105, 79, 96, 86, 78, 72, 152, 138, 395, 221, 152, 135, 113, 98, 0 |
| 2 | 2560, Nakhon Ratchasima | 2, 253, 398, 391, 471, 451, 478, 523, 1176, 1370, 2807, 1197, 1314, 1327, 1222, 1198, 0 | |
| Blind Test | 2 | 2562, Chiang Mai | 4, 435, 765, 847, 864, 963, 1020, 1202, 2844, 2556, 2277, 3521, 2202, 1034, 891, 434, 0 |
| 2 | 2562, Bangkok | 6, 1253, 2936, 2804, 3023, 3459, 3646, 4672, 10564, 10389, 9066, 14720, 11842, 6415, 4266, 3451, 1 | |
| Training | 3 | 2561, Phatthalung | 1, 89, 112, 120, 105, 110, 101, 60, 166, 172, 90, 112, 128, 99, 89, 81, 0 |
| 3 | 2558, Phitsanulok | 1, 85, 126, 101, 98, 81, 48, 54, 137, 101, 116, 83, 62, 56, 29, 29, 0 | |
| Blind Test | 3 | 2562, Phangnga | 4, 106, 125, 107, 125, 102, 82, 93, 197, 160, 106, 98, 91, 59, 49, 53, 0 |
| 3 | 2562, Sukhothai | 1, 60, 111, 113, 138, 110, 124, 113, 315, 301, 294, 295, 227, 120, 98, 78, 0 | |
| Training | 4 | 2561, Chai Nat | 0, 4, 7, 7, 7, 10, 3, 5, 18, 26, 14, 13, 21, 11, 17, 3, 0 |
| 4 | 2559, Ranong | 0, 3, 2, 4, 6, 4, 3, 2, 5, 7, 5, 7, 9, 6, 3, 2, 0 | |
| Blind Test | 4 | 2562, Pattani | 0, 25, 28, 38, 31, 30, 21, 15, 44, 46, 84, 81, 40, 34, 39, 56, 0 |
| 4 | 2562, Satun | 0, 19, 42, 20, 20, 24, 21, 12, 28, 32, 28, 20, 21, 19, 23, 29, 0 |
| Data | Cluster | Province | (Farmers, Public Servant, General Contractor, Merchant, Housekeeper, Student, Military/Police, Fisherman, Teacher, Other, Unknown, Herdsman, Priest, Special Occupation, Public Health Personnel) |
|---|---|---|---|
| Training | 1 | 2559, Khon Kaen | 173, 115, 278, 98, 70, 823, 8, 0, 4, 98, 694, 0, 8, 0, 1 |
| 1 | 2559, Surat Thani | 125, 44, 442, 67, 42, 741, 9, 2, 6, 129, 655, 1, 2, 1, 9 | |
| Blind Test | 1 | 2562, Mae Hong Son | 107, 29, 234, 10, 18, 425, 7, 0, 2, 4, 393, 0, 2, 0, 15 |
| 1 | 2562, Mukdahan | 237, 22, 220, 5, 0, 925, 41, 0, 4, 15, 588, 1, 11, 0, 0 | |
| Training | 2 | 2558, Mae Hong Son | 12, 5, 14, 1, 2, 38, 0, 0, 0, 0, 96, 0, 0, 0, 0 |
| 2 | 2558, Roi Et | 18, 13, 13, 0, 1, 66, 3, 0, 0, 0, 64, 0, 0, 0, 0 | |
| Blind Test | 2 | 2562, Nakhon Nayok | 14, 4, 101, 3, 0, 109, 6, 0, 0, 1, 192, 0, 1, 0, 0 |
| 2 | 2562, Sing Buri | 16, 19, 165, 11, 1, 209, 10, 0, 0, 4, 169, 0, 0, 0, 14 | |
| Training | 3 | 2554, Tak | 78, 11, 136, 13, 1, 139, 3, 0, 0, 7, 104, 0, 0, 2, 4 |
| 3 | 2551, Songkhla | 119, 14, 81, 10, 11, 58, 4, 1, 0, 1, 74, 0, 0, 0, 1 | |
| Blind Test | 3 | No data are assigned | |
| Data | Cluster | Province | String. (Jan, Feb, Mar, Apr, May, Jun, Jul, Aug, Sep, Oct, Nov, Dec) |
|---|---|---|---|
| Training | 1 | 2561, Phetchaburi | 77, 85, 54, 35, 28, 37, 71, 72, 116, 64, 46, 38 |
| 1 | 2559, Phichit | 74, 263, 294, 42, 15, 39, 37, 75, 267, 293, 92, 42 | |
| Blind Test | 1 | 2562, Nong Bua Lam Phu | 29, 92, 136, 30, 13, 60, 39, 45, 77, 55, 34, 86 |
| 1 | 2562, Samut Songkhram | 29, 59, 63, 68, 19, 25, 41, 68, 92, 66, 63, 44 | |
| Training | 2 | 2561, Nan | 183, 112, 123, 86, 76, 136, 126, 244, 450, 221, 95, 63 |
| 2 | 2558, Samut Prakan | 89, 218, 224, 129, 91, 114, 114, 121, 173, 184, 180, 134 | |
| Blind Test | 2 | 2562, Tak | 90, 145, 209, 84, 71, 235, 203, 455, 565, 288, 259, 94 |
| 2 | 2562, Uttaradit | 182, 467, 437, 90, 61, 169, 193, 465, 803, 394, 242, 173 | |
| Training | 3 | 2560, Nakhon Sawan | 159, 117, 89, 42, 63, 147, 500, 1038, 999, 618, 275, 151 |
| 3 | 2560, P.Nakhon S.Ayutthaya | 121, 106, 62, 40, 60, 306, 412, 546, 696, 320, 114, 88 | |
| Blind Test | 3 | 2562, Narathiwat | 250, 135, 117, 41, 37, 67, 120, 160, 263, 269, 168, 211 |
| 3 | 2562, Phatthalung | 190, 285, 178, 49, 25, 77, 67, 92, 409, 264, 258, 188 |
| Data | Cluster | Province | (<28 Days, <1 Year, 1+, 2+, 3+, 4+, 5+, 6+, 7–9, 10–14, 15–24, 25–34, 35–44, 45–54, 55–64, 65+, Unknown) |
|---|---|---|---|
| Training | 1 | 2559, Si Sa Ket | 0, 0, 0, 0, 0, 0, 0, 0, 0, 0, 18, 36, 39, 39, 14, 6, 0 |
| 1 | 2558, Nakhon Si Thammarat | 0, 0, 0, 0, 0, 0, 0, 0, 0, 0, 14, 17, 34, 27, 15, 9, 0 | |
| Blind Test | 1 | 2562, Chanthaburi | 0, 1, 0, 0, 0, 0, 1, 0, 1, 0, 12, 32, 38, 14, 14, 5, 0 |
| 1 | 2562, Tak | 0, 0, 1, 0, 0, 0, 0, 0, 0, 1, 16, 27, 25, 21, 13, 10, 0 | |
| Training | 2 | 2559, Nakhon Phanom | 0, 0, 0, 0, 0, 0, 0, 0, 0, 0, 4, 4, 8, 6, 9, 3, 0 |
| 2 | 2558, Sing Buri | 0, 0, 0, 0, 0, 0, 0, 0, 0, 0, 1, 0, 3, 0, 1, 3, 0 | |
| Blind Test | 2 | 2562, Ang Thong | 0, 0, 0, 0, 0, 0, 0, 0, 0, 0, 1, 1, 0, 0, 2, 1, 0 |
| 2 | 2562, Bungkan | 0, 0, 0, 0, 0, 0, 0, 0, 0, 0, 1, 1, 4, 5, 2, 0, 0 | |
| Training | 3 | 2558, Sakon Nakhon | 0, 0, 0, 0, 0, 0, 0, 0, 0, 0, 3, 13, 12, 10, 4, 2, 0 |
| 3 | 2550, Ratchaburi | 0, 0, 0, 0, 0, 0, 0, 0, 0, 0, 6, 9, 11, 11, 5, 7, 0 | |
| Blind Test | 3 | 2562, Rayong | 0, 0, 0, 0, 0, 0, 0, 0, 0, 0, 6, 18, 12, 16, 10, 2, 0 |
| 3 | 2562, Maha Sarakham | 0, 0, 0, 0, 0, 0, 0, 0, 0, 0, 0, 14, 21, 12, 3, 2, 0 | |
| Training | 4 | 2549, Nonthaburi | 0, 1, 0, 0, 0, 0, 0, 0, 0, 2, 1, 10, 5, 10, 7, 0, 0 |
| 4 | 2551, Bangkok | 0, 0, 1, 0, 0, 0, 0, 4, 1, 2, 38, 52, 30, 30, 9, 9, 0 | |
| Blind Test | 4 | 2562, Chiang Mai | 0, 0, 0, 1, 1, 1, 0, 0, 1, 2, 17, 44, 45, 40, 27, 10, 0 |
| 4 | 2562, Nakhon Sawan | 0, 0, 0, 0, 0, 0, 0, 0, 1, 0, 2, 8, 3, 6, 3, 5, 0 | |
| Training | 5 | 2557, Chachoengsao | 0, 0, 0, 0, 0, 0, 0, 0, 0, 0, 9, 29, 41, 44, 23, 11, 0 |
| 5 | 2555, Loei | 0, 0, 0, 0, 0, 0, 0, 0, 0, 0, 12, 20, 22, 27, 12, 8, 0 | |
| Blind Test | 5 | 2562, Chai Nat | 0, 0, 0, 0, 0, 0, 0, 0, 0, 0, 1, 2, 2, 4, 1, 3, 0 |
| 5 | 2562, Chon Buri | 0, 0, 0, 0, 0, 0, 0, 0, 0, 0, 8, 32, 34, 18, 15, 9, 0 | |
| Training | 6 | 2558, Phatthalung | 0, 0, 0, 0, 0, 0, 0, 0, 0, 0, 1, 2, 7, 12, 3, 2, 0 |
| 6 | 2552, Chon Buri | 0, 0, 0, 0, 0, 0, 0, 0, 0, 0, 13, 6, 11, 4, 6, 2, 0 | |
| Blind Test | 6 | No data are assigned | |
| Data | Cluster | Province | (Farmers, Public Servant, General Contractor, Merchant, Housekeeper, Student, Military/Police, Fisherman, Teacher, Other, Unknown, Herdsman, Priest, Special Occupation, Public Health Personnel) |
|---|---|---|---|
| Training | 1 | 2561, Phetchabun | 128, 1, 193, 4, 8, 14, 19, 0, 1, 1, 63, 0, 4, 0, 0 |
| 1 | 2549, Udon Thani | 51, 3, 17, 4, 5, 8, 0, 0, 0, 3, 10, 0, 0, 0, 0 | |
| Blind Test | 1 | 2562, Chiang Rai | 53, 2, 103, 4, 6, 5, 1, 0, 0, 0, 11, 0, 3, 0, 1 |
| 1 | 2562, Nakhon Si Thammarat | 55, 0, 61, 1, 0, 5, 2, 1, 0, 1, 42, 0, 0, 0, 0 | |
| Training | 2 | 2561, Nonthaburi | 0, 0, 14, 1, 0, 2, 0, 0, 0, 0, 1, 0, 0, 0, 0 |
| 2 | 2559, Nong Khai | 8, 7, 26, 2, 0, 2, 0, 0, 0, 0, 6, 0, 0, 0, 0 | |
| Blind Test | 2 | 2562, Suphan Buri | 6, 1, 9, 1, 0, 1, 0, 0, 0, 0, 0, 0, 0, 0, 0 |
| 2 | 2562, Bungkan | 7, 1, 4, 0, 0, 0, 0, 0, 0, 0, 1, 0, 0, 0, 0 |
| Data | Cluster | Province | (Jan, Feb, Mar, Apr, May, Jun, Jul, Aug, Sep, Oct, Nov, Dec) |
|---|---|---|---|
| Training | 1 | 2561, Lamphun | 1, 0, 0, 4, 1, 1, 0, 1, 2, 1, 0, 2 |
| 1 | 2560, Phuket | 2, 0, 2, 3, 0, 1, 3, 2, 2, 2, 0, 2 | |
| Blind Test | 1 | 2562, Lamphun | 3, 1, 1, 2, 0, 0, 1, 3, 4, 0, 2, 2 |
| 1 | 2562, Narathiwat | 0, 2, 1, 1, 4, 2, 7, 2, 3, 0, 5, 3 | |
| Training | 2 | 2561, Chiang Mai | 55, 28, 24, 17, 15, 23, 23, 17, 11, 16, 21, 13 |
| 2 | 2559, Loei | 22, 26, 24, 19, 17, 11, 19, 13, 5, 10, 14, 19 | |
| Blind Test | 2 | 2562, Si Sa Ket | 29, 15, 15, 12, 21, 23, 10, 13, 13, 16, 18, 11 |
| 2 | 2562, Surat Thani | 17, 16, 15, 15, 16, 9, 12, 17, 15, 10, 17, 11 | |
| Training | 3 | 2561, Phrae | 3, 2, 3, 2, 1, 2, 3, 2, 3, 3, 2, 1 |
| 3 | 2559, Phichit | 11, 6, 7, 9, 9, 5, 6, 2, 9, 5, 9, 2 | |
| Blind Test | 3 | 2562, Nakhon Sawan | 0, 1, 1, 4, 1, 2, 4, 5, 4, 1, 4, 1 |
| 3 | 2562, Phichit | 1, 4, 6, 6, 5, 8, 1, 1, 1, 3, 2, 4 |
Publisher’s Note: MDPI stays neutral with regard to jurisdictional claims in published maps and institutional affiliations. |
© 2021 by the authors. Licensee MDPI, Basel, Switzerland. This article is an open access article distributed under the terms and conditions of the Creative Commons Attribution (CC BY) license (https://creativecommons.org/licenses/by/4.0/).
Share and Cite
Budwong, A.; Auephanwiriyakul, S.; Theera-Umpon, N. Infectious Disease Relational Data Analysis Using String Grammar Non-Euclidean Relational Fuzzy C-Means. Int. J. Environ. Res. Public Health 2021, 18, 8153. https://0-doi-org.brum.beds.ac.uk/10.3390/ijerph18158153
Budwong A, Auephanwiriyakul S, Theera-Umpon N. Infectious Disease Relational Data Analysis Using String Grammar Non-Euclidean Relational Fuzzy C-Means. International Journal of Environmental Research and Public Health. 2021; 18(15):8153. https://0-doi-org.brum.beds.ac.uk/10.3390/ijerph18158153
Chicago/Turabian StyleBudwong, Apiwat, Sansanee Auephanwiriyakul, and Nipon Theera-Umpon. 2021. "Infectious Disease Relational Data Analysis Using String Grammar Non-Euclidean Relational Fuzzy C-Means" International Journal of Environmental Research and Public Health 18, no. 15: 8153. https://0-doi-org.brum.beds.ac.uk/10.3390/ijerph18158153