
Valid and Reliable Barbell Velocity Estimation Using an Inertial Measurement Unit


Abstract
:1. Introduction
2. Materials and Methods
2.1. Participants
2.2. Study Design
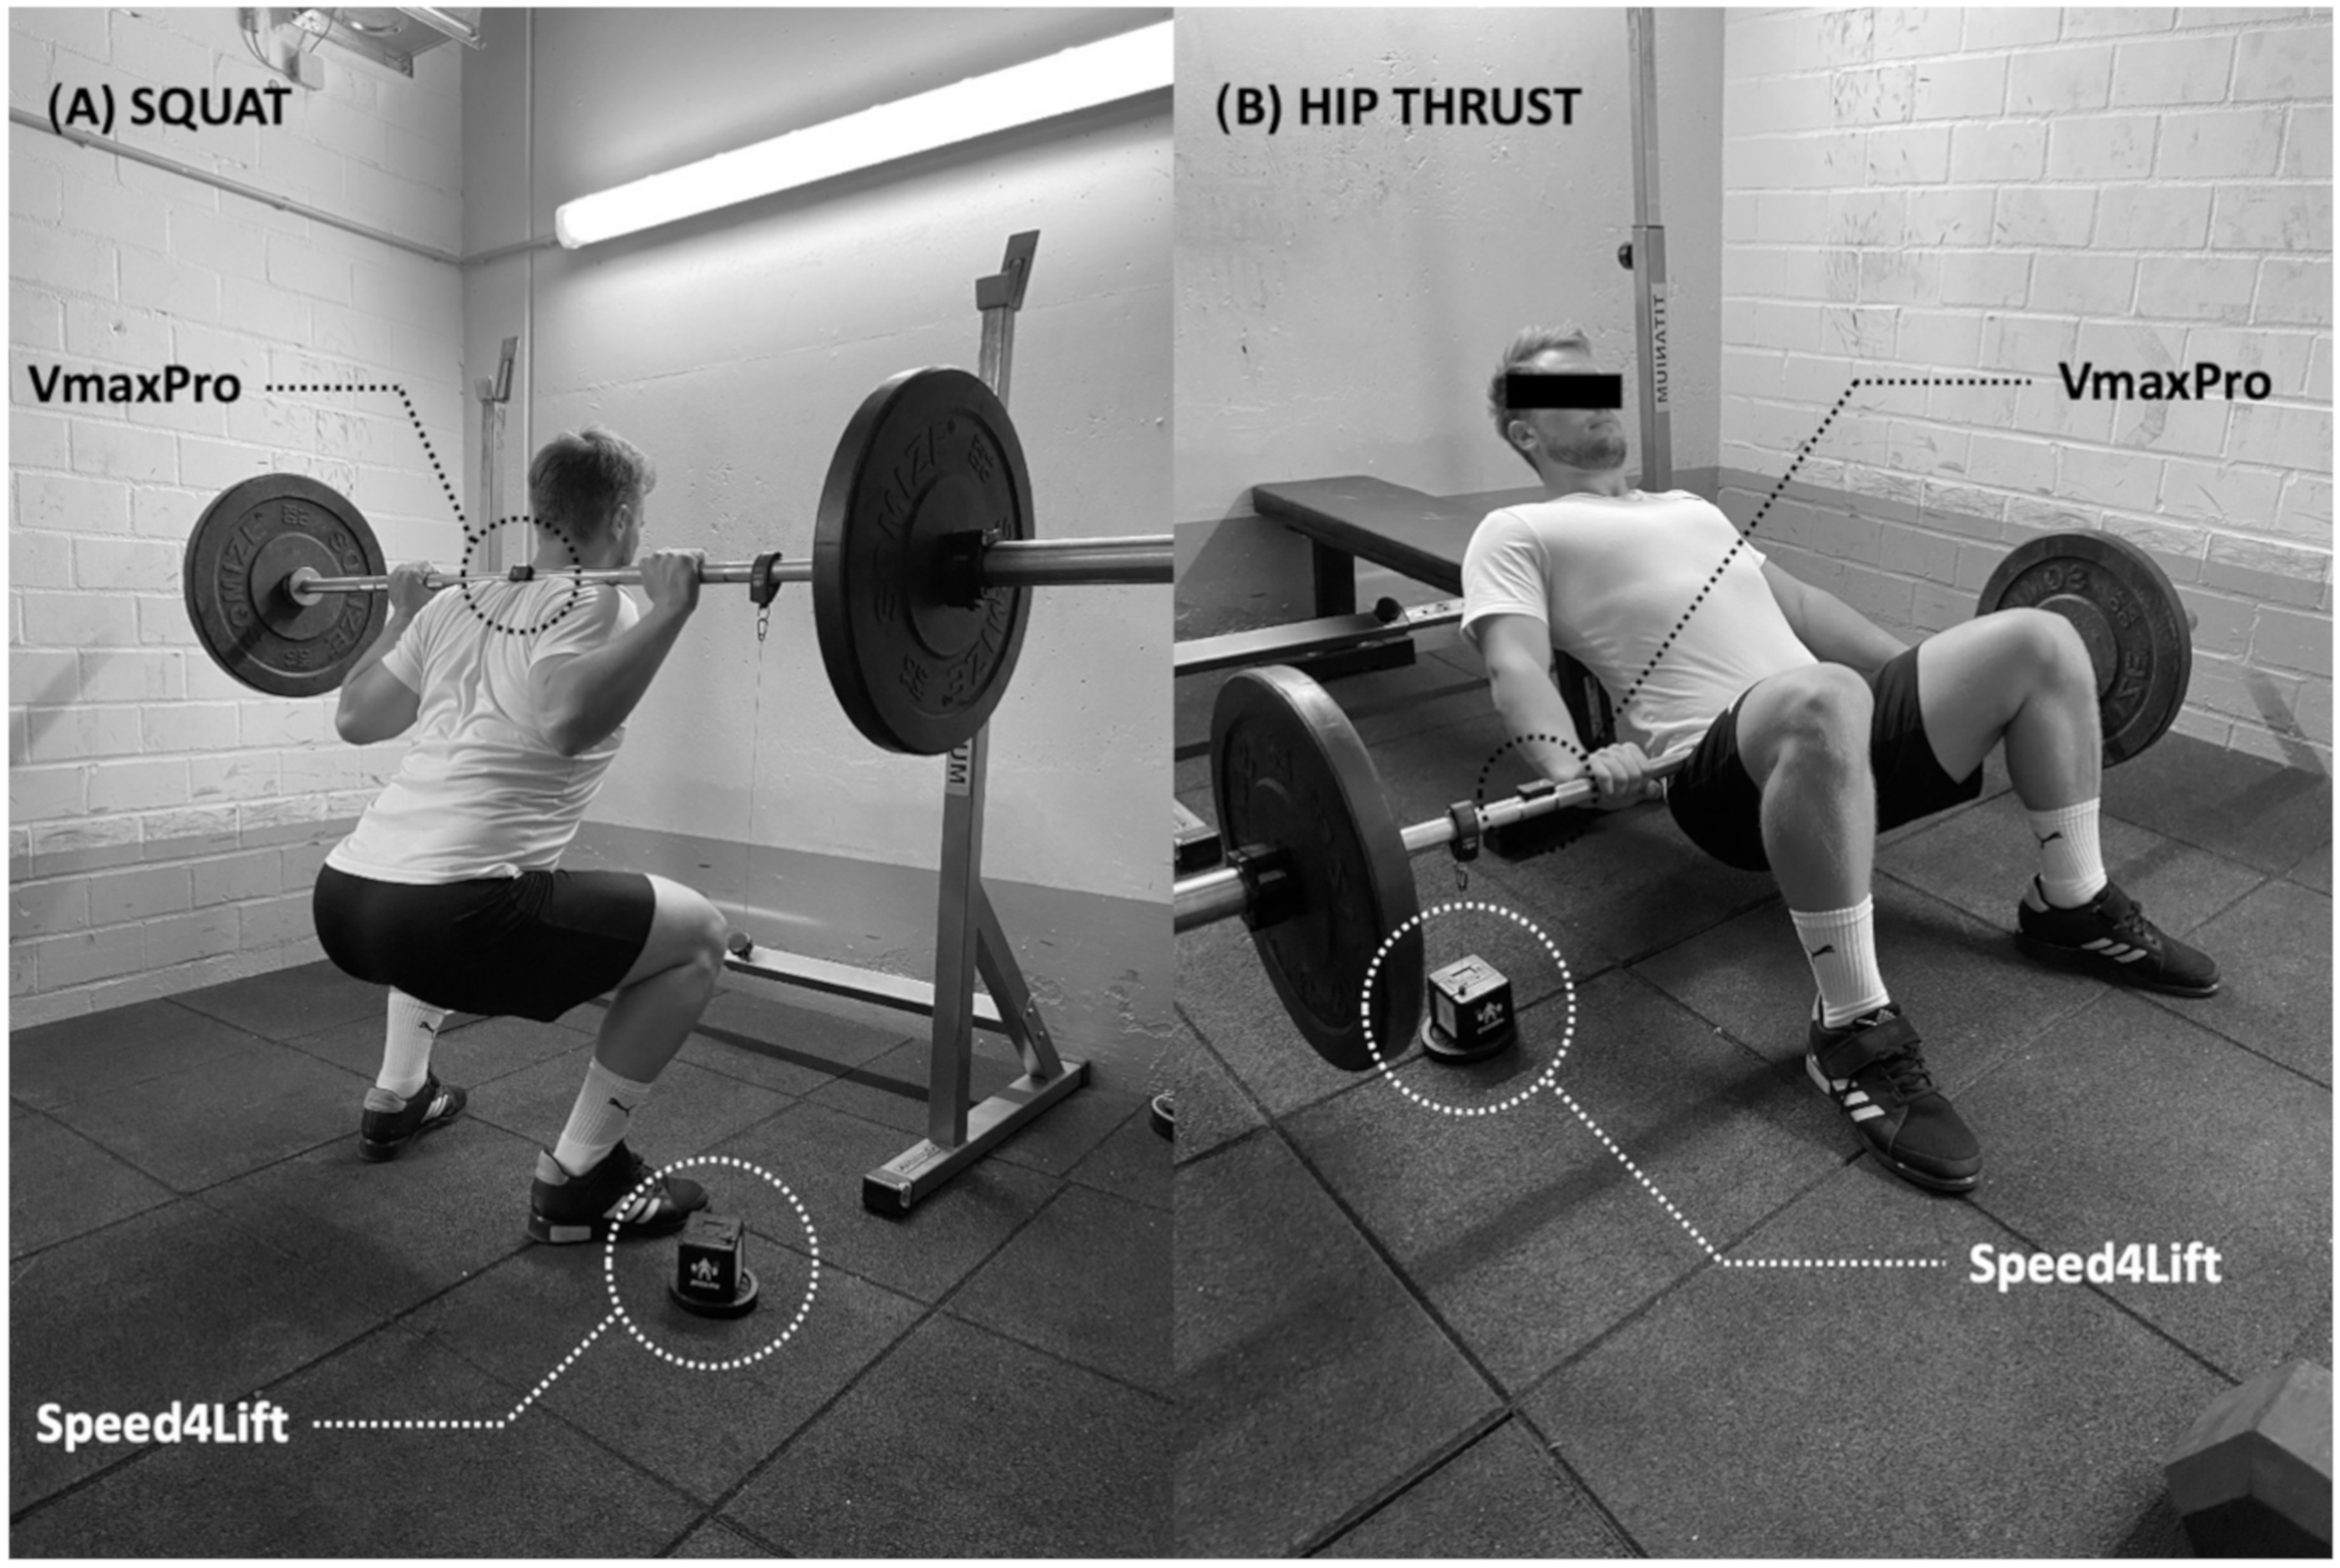
2.3. Data Collection
2.4. Statistics
3. Results
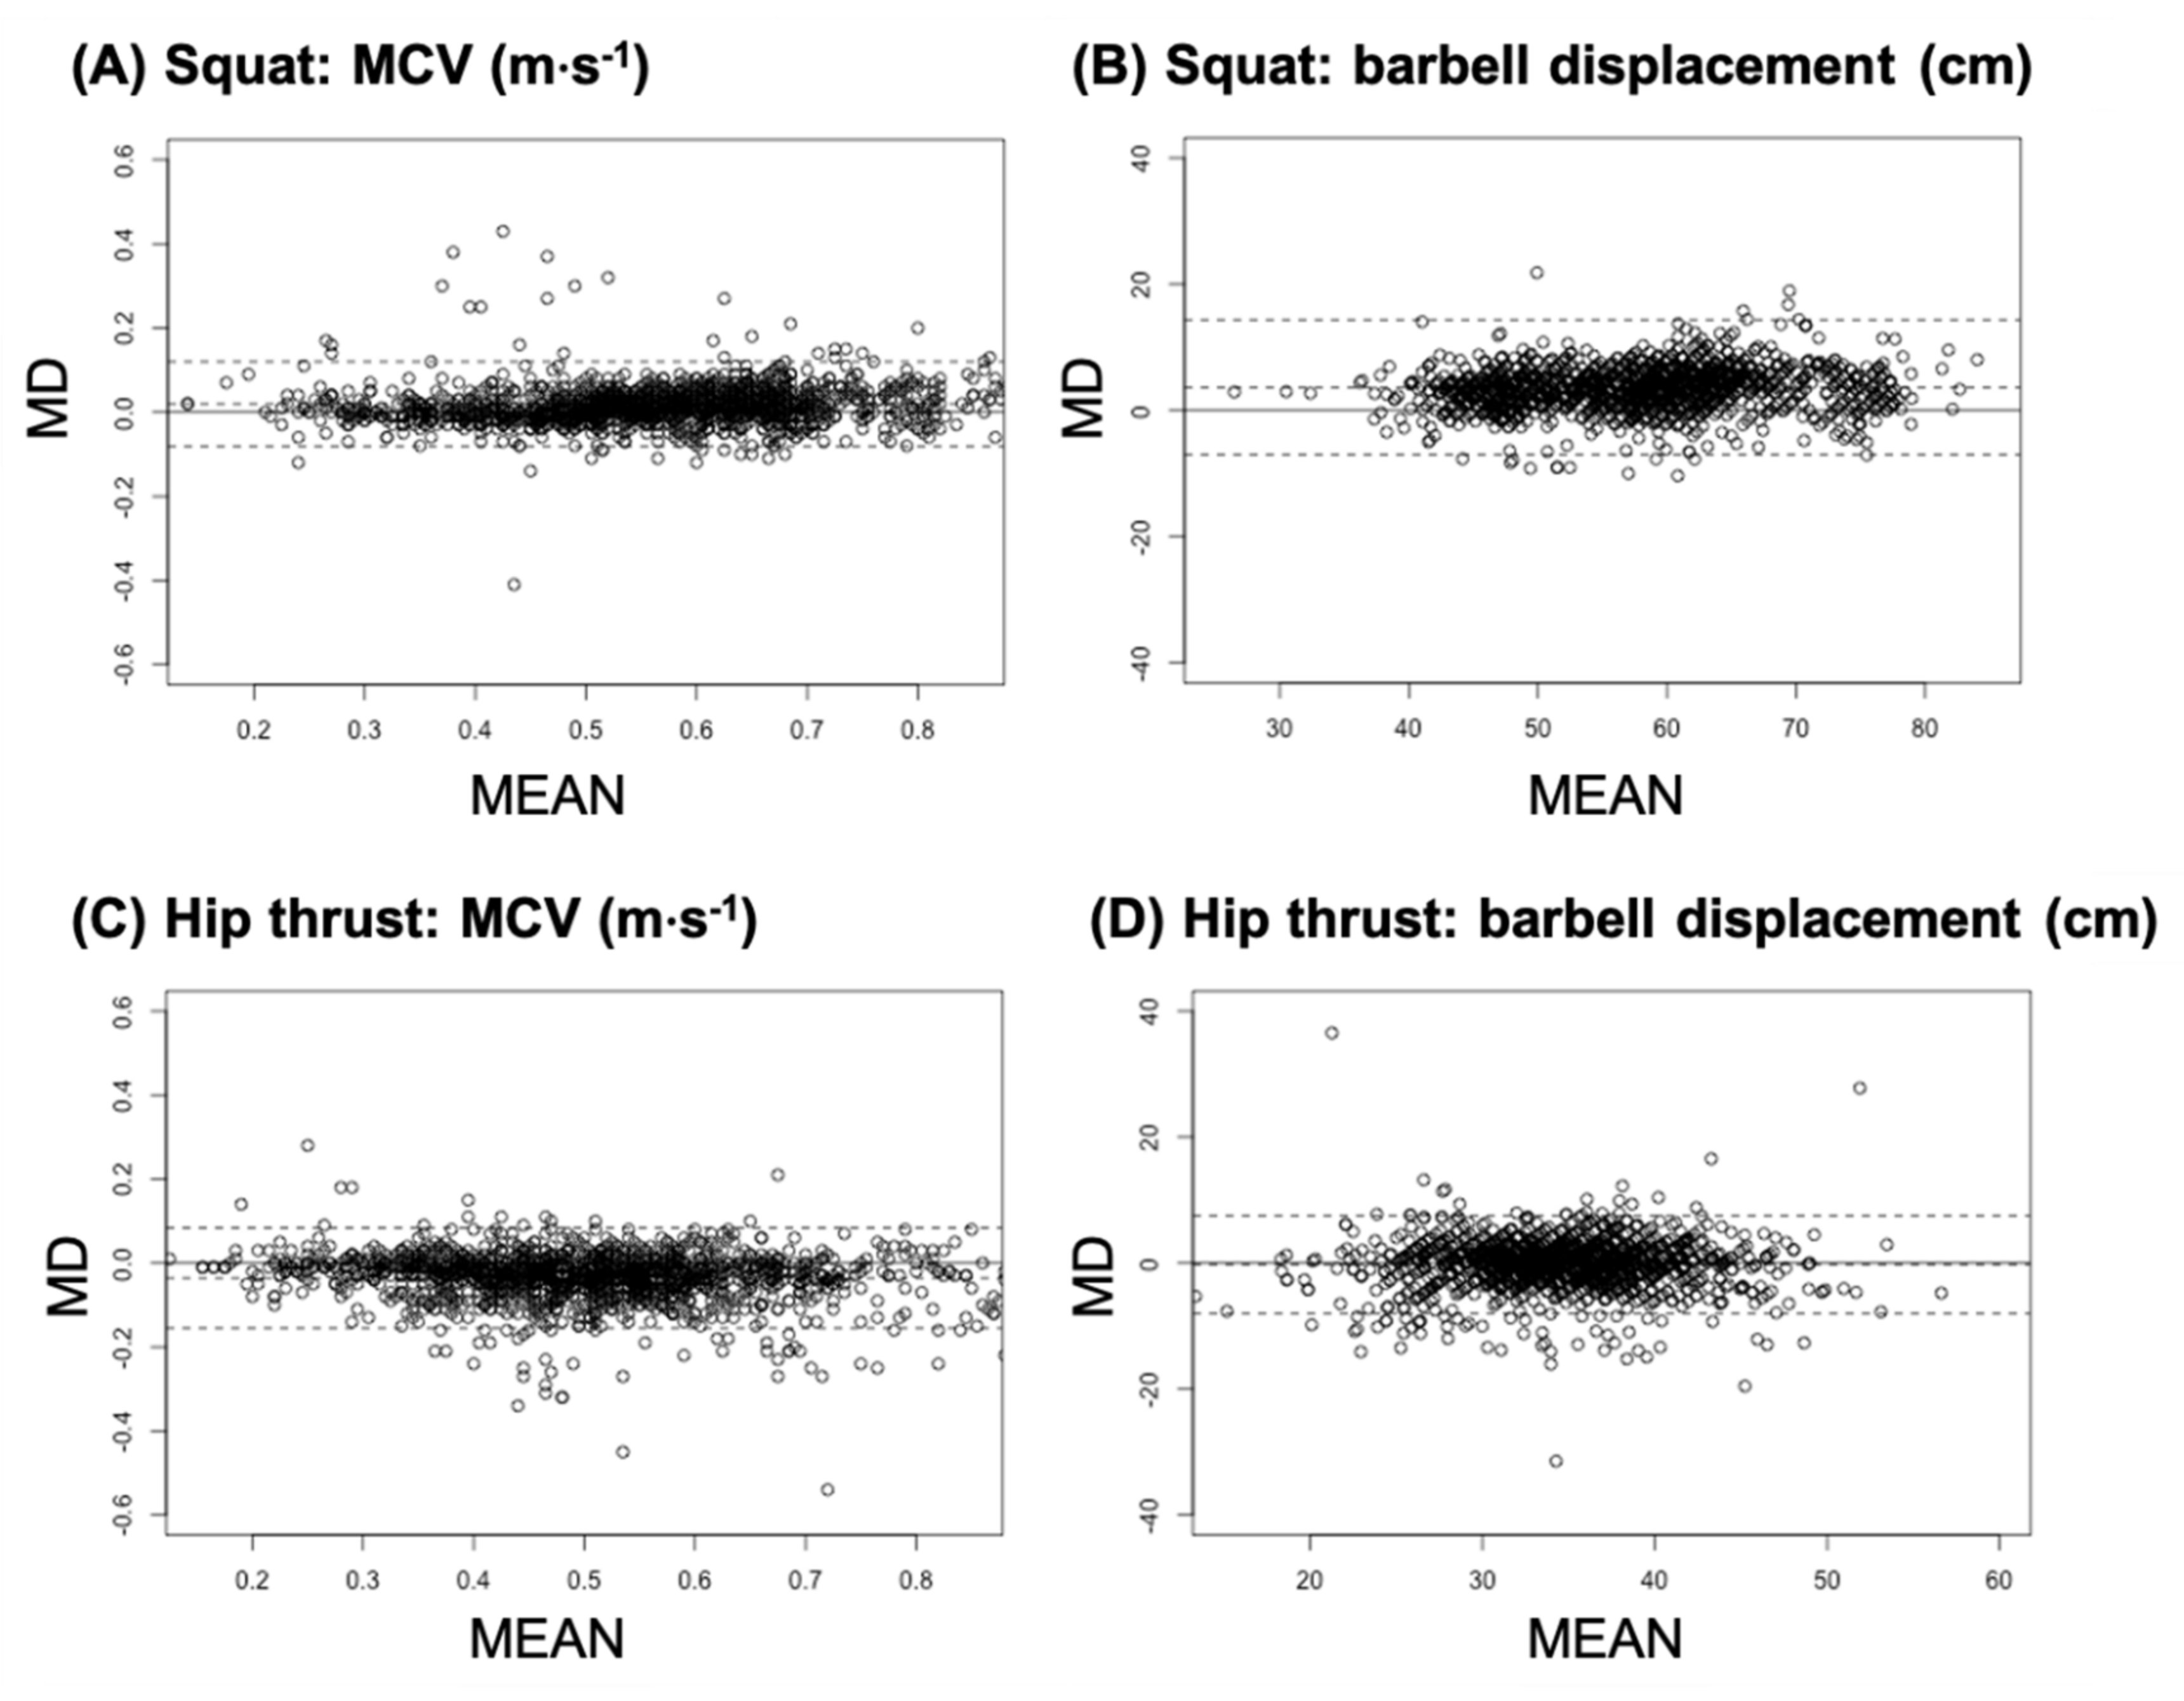
3.1. Validity
3.2. Between- and Within-Day Reliability
4. Discussion
5. Conclusions
Author Contributions
Funding
Institutional Review Board Statement
Informed Consent Statement
Data Availability Statement
Acknowledgments
Conflicts of Interest
References
- Clemente, F.M.; Akyildiz, Z.; Pino-Ortega, J.; Rico-González, M. Validity and Reliability of the Inertial Measurement Unit for Barbell Velocity Assessments: A Systematic Review. Sensors 2021, 21, 2511. [Google Scholar] [CrossRef] [PubMed]
- Pareja-Blanco, F.; Alcazar, J.; Sánchez-Valdepeñas, J.; Cornejo-Daza, P.J.; Piqueras-Sanchiz, F.; Mora-Vela, R.; Sánchez-Moreno, M.; Bachero-Mena, B.; Ortega-Becerra, M.; Alegre, L.M. Velocity Loss as a Critical Variable Determining the Adaptations to Strength Training. Med. Sci. Sports Exerc. 2020, 52, 1752–1762. [Google Scholar] [CrossRef]
- Sánchez-Medina, L.; González-Badillo, J.J.; Pérez, C.E.; Pallarés, J.G. Velocity- and power-load relationships of the bench pull vsBench press exercises. Int. J. Sports Med. 2014, 35, 209–2164. [Google Scholar] [CrossRef] [PubMed]
- Bazuelo-Ruiz, B.; Padial, P.; García-Ramos, A.; Morales-Artacho, A.J.; Miranda, M.T.; Feriche, B. Predicting Maximal Dynamic Strength from the Load-Velocity Relationship in Squat Exercise. J. Strength Cond. Res. 2015, 29, 1999–2005. [Google Scholar] [CrossRef] [PubMed]
- González-Badillo, J.J.; Sánchez-Medina, L. Movement velocity as a measure of loading intensity in resistance training. Int. J. Sports Med. 2010, 31, 347–352. [Google Scholar] [CrossRef]
- Jovanovic, M.; Flanagan, E. Researched applications of velocity based strength training. J. Aust. Strength Cond. 2014, 22, 58–69. [Google Scholar]
- Atkinson, G.; Nevill, A.M. Statistical methods for assessing measurement error (reliability) in variables relevant to sports medicine. Sports Med. 1998, 26, 217–238. [Google Scholar] [CrossRef]
- Banyard, H.G.; Nosaka, K.; Sato, K.; Haff, G.G. Validity of Various Methods for Determining Velocity, Force, and Power in the Back Squat. Int. J. Sports Physiol. Perform. 2017, 12, 1170–1176. [Google Scholar] [CrossRef]
- Balsalobre-Fernández, C.; Kuzdub, M.; Poveda-Ortiz, P.; Campo-Vecino, J.D. Validity and Reliability of the PUSH Wearable Device to Measure Movement Velocity During the Back Squat Exercise. J. Strength Cond. Res. 2016, 30, 1968–1974. [Google Scholar] [CrossRef]
- Balsalobre-Fernández, C.; Marchante, D.; Baz-Valle, E.; Alonso-Molero, I.; Jiménez, S.L.; Muñóz-López, M. Analysis of Wearable and Smartphone-Based Technologies for the Measurement of Barbell Velocity in Different Resistance Training Exercises. Front. Physiol. 2017, 8, 649. [Google Scholar] [CrossRef] [Green Version]
- Aroganam, G.; Manivannan, N.; Harrison, D. Review on Wearable Technology Sensors Used in Consumer Sport Applications. Sensors 2019, 19, 1983. [Google Scholar] [CrossRef] [PubMed] [Green Version]
- Suh, Y.S. Inertial sensor-based smoother for gait analysis. Sensors 2014, 14, 24338–24357. [Google Scholar] [CrossRef] [PubMed]
- Taborri, J.; Palermo, E.; Rossi, S.; Cappa, P. Gait Partitioning Methods: A Systematic Review. Sensors 2016, 16, 66. [Google Scholar] [CrossRef] [PubMed] [Green Version]
- Bao, S.-D.; Meng, X.-L.; Xiao, W.; Zhang, Z.-Q. Fusion of Inertial/Magnetic Sensor Measurements and Map Information for Pedestrian Tracking. Sensors 2017, 17, 340. [Google Scholar] [CrossRef] [PubMed]
- Ilyas, M.; Cho, K.; Baeg, S.-H.; Park, S. Drift Reduction in Pedestrian Navigation System by Exploiting Motion Constraints and Magnetic Field. Sensors 2016, 16, 1455. [Google Scholar] [CrossRef] [PubMed] [Green Version]
- Pham, D.D.; Suh, Y.S. Pedestrian Navigation Using Foot-Mounted Inertial Sensor and LIDAR. Sensors 2016, 16, 120. [Google Scholar] [CrossRef] [PubMed] [Green Version]
- Prieto, J.; Mazuelas, S.; Win, M.Z. Context-Aided Inertial Navigation via Belief Condensation. IEEE Trans. Signal Process. 2016, 64, 3250–3261. [Google Scholar] [CrossRef]
- Ren, M.; Pan, K.; Liu, Y.; Guo, H.; Zhang, X.; Wang, P. A Novel Pedestrian Navigation Algorithm for a Foot-Mounted Inertial-Sensor-Based System. Sensors 2016, 16, 139. [Google Scholar] [CrossRef] [Green Version]
- Shi, W.; Wang, Y.; Wu, Y. Dual MIMU Pedestrian Navigation by Inequality Constraint Kalman Filtering. Sensors 2017, 17, 427. [Google Scholar] [CrossRef]
- Van Nguyen, L.; La, H.M. Real-Time Human Foot Motion Localization Algorithm With Dynamic Speed. IEEE Trans. Hum. -Mach. Syst. 2016, 46, 822–833. [Google Scholar] [CrossRef]
- Wang, Z.; Zhao, H.; Qiu, S.; Gao, Q. Stance-Phase Detection for ZUPT-Aided Foot-Mounted Pedestrian Navigation System. IEEE/ASME Trans. Mechatron. 2015. [Google Scholar] [CrossRef]
- Gómez-Espinosa, A.; Espinosa-Castillo, N.; Valdés-Aguirre, B. Foot-Mounted Inertial Measurement Units-Based Device for Ankle Rehabilitation. Appl. Sci. 2018, 8, 2032. [Google Scholar] [CrossRef] [Green Version]
- Duong, P.D.; Suh, Y.S. Foot Pose Estimation Using an Inertial Sensor Unit and Two Distance Sensors. Sensors 2015, 15, 15888–15902. [Google Scholar] [CrossRef]
- Benoussaad, M.; Sijobert, B.; Mombaur, K.; Coste, C.A. Robust Foot Clearance Estimation Based on the Integration of Foot-Mounted IMU Acceleration Data. Sensors 2015, 16, 12. [Google Scholar] [CrossRef] [Green Version]
- Zhou, Q.; Zhang, H.; Lari, Z.; Liu, Z.; El-Sheimy, N. Design and Implementation of Foot-Mounted Inertial Sensor Based Wearable Electronic Device for Game Play Application. Sensors 2016, 16, 1752. [Google Scholar] [CrossRef] [PubMed]
- Mitschke, C.; Heß, T.; Milani, T.L. Which Method Detects Foot Strike in Rearfoot and Forefoot Runners Accurately when Using an Inertial Measurement Unit? Appl. Sci. 2017, 7, 959. [Google Scholar] [CrossRef] [Green Version]
- Blaumann & Meyer Vmaxpro. Available online: https://vmaxpro.de/customers-and-partners/ (accessed on 29 July 2021).
- Harriss, D.J.; Atkinson, G. Ethical Standards in Sport and Exercise Science Research: 2016 Update. Int. J. Sports Med. 2015, 36, 1121–1124. [Google Scholar] [CrossRef] [PubMed] [Green Version]
- World Medical Association. World Medical Association Declaration of Helsinki: Ethical principles for medical research involving human subjects. JAMA 2013, 310, 2191–2194. [Google Scholar] [CrossRef] [Green Version]
- Kraemer, W.J.; Fry, A.C.; Maud, P.; Foster, C. Strength Testing: Development and Evaluation of Methodology; Human Kinetics: Champaign, IL, USA, 1995. [Google Scholar]
- Martínez-Cava, A.; Hernández-Belmonte, A.; Courel-Ibáñez, J.; Morán-Navarro, R.; González-Badillo, J.J.; Pallarés, J.G. Reliability of technologies to measure the barbell velocity: Implications for monitoring resistance training. PLoS ONE 2020, 15, e0232465. [Google Scholar] [CrossRef]
- Seel, T.; Raisch, J.; Schauer, T. IMU-based joint angle measurement for gait analysis. Sensors 2014, 14, 6891–6909. [Google Scholar] [CrossRef] [Green Version]
- Cohen, J. Statistical Power Analysis for the Behavioral Sciences; Routledge: New York, NY, USA, 1988. [Google Scholar]
- Bland, J.M.; Altman, D.G. Statistical methods for assessing agreement between two methods of clinical measurement. Lancet 1986, 1, 307–310. [Google Scholar] [CrossRef]
- Fleiss, J.L. The Design and Analysis of Clinical Experiments; Wiley: New York, NY, USA, 1988; Available online: https://0-onlinelibrary-wiley-com.brum.beds.ac.uk/doi/abs/10.1002/bimj.4710300308 (accessed on 10 April 2021).
- Pérez-Castilla, A.; Piepoli, A.; Delgado-García, G.; Garrido-Blanca, G.; García-Ramos, A. Reliability and Concurrent Validity of Seven Commercially Available Devices for the Assessment of Movement Velocity at Different Intensities During the Bench Press. J. Strength Cond. Res. 2019, 33, 1258–1265. [Google Scholar] [CrossRef] [PubMed]
- Arede, J.; Figueira, B.; Gonzalo-Skok, O.; Leite, N. Validity and reliability of Gyko Sport for the measurement of barbell velocity on the bench-press exercise. J. Sports Med. Phys. Fit. 2019, 59, 1651–1658. [Google Scholar] [CrossRef] [PubMed]
- Flores, S.S.; de Benito, A.M.; Redondo, J.C. Validity and reliability of a 3-axis accelerometer for measuring weightlifting movements. Int. J. Sports Sci. Coach. 2016, 872–879. [Google Scholar] [CrossRef]
- Zourdos, M.; Dolan, C.; Quiles, J.; Klemp, A.; Jo, E.; Loenneke, J.; Blanco, R.; Whitehurst, M. Efficacy of Daily 1RM Training in Well-Trained Powerlifters and Weightlifters: A Case Series. Nutr. Hosp. Organo Off. Soc. Esp. Nutr. Parenter. Enter. 2015. [Google Scholar]
- Bryanton, M.A.; Kennedy, M.D.; Carey, J.P.; Chiu, L.Z.F. Effect of squat depth and barbell load on relative muscular effort in squatting. J. Strength Cond. Res. 2012, 26, 2820–2828. [Google Scholar] [CrossRef]


| Exercise | Parameter | TE (%) | CV (%) | ICC (95% CI) | CC (95% CI) | LoA | SEM |
|---|---|---|---|---|---|---|---|
| SQ | MCV (m·s−1) | 5.6 | 7.6 | 0.94 0.92–0.95) | 0.96 *** (0.95–0.96) | 0.1 | 0.01 |
| Barbell displacement (cm) | 5.9 | 5.9 | 0.88 (0.43–0.95) | 0.84 *** (0.83–0.85) | 10.69 | 1.18 | |
| HT | MCV (m·s−1) | 9.2 | 11.2 | 0.85 (0.70–0.92) | 0.91 *** (0.91–0.92) | 0.12 | 0.02 |
| Barbell displacement (cm) | 7.2 | 10.2 | 0.76 (0.73–0.78) | 0.76 *** (0.74–0.78) | 7.78 | 1.64 |
| Device | Exercise | Reliability | Parameter | TE (%) | CV (%) | ICC (95% CI) | CC (95% CI) | LoA | SEM |
|---|---|---|---|---|---|---|---|---|---|
| S4L | SQ | Within-day | MCV (m·s−1) | 3.3 | 4.4 | 0.91 (0.78–0.97) | 0.92 *** (0.80–0.97) | 0.04 | 0.01 |
| Barbell displacement (cm) | 3.8 | 5.5 | 0.94 (0.85–0.98) | 0.94 *** (0.84–0.98) | 6.58 | 0.82 | |||
| Between-day | MCV (m·s−1) | 8.6 | 12.3 | 0.75 (0.56–0.87) | 0.75 *** (0.85–0.87) | 0.21 | 0.05 | ||
| Barbell displacement (cm) | 6.7 | 9.3 | 0.78 (0.61–0.88) | 0.79 *** (0.61–0.89) | 11.67 | 2.8 | |||
| HT | Within-day | MCV (m·s−1) | 3.3 | 4.5 | 0.93 (0.83–0.97) | 0.93 *** (0.83–0.97) | 0.05 | 0.01 | |
| Barbell displacement (cm) | 4.8 | 6.9 | 0.71 (0.39–0.88) | 0.71 *** (0.37–0.88) | 5.07 | 1.40 | |||
| Between-day | MCV (m·s−1) | 12 | 15.9 | 0.56 (0.22–0.74) | 0.56 *** (0.26–0.76) | 0.2 | 0.72 | ||
| Barbell displacement (cm) | 10.3 | 13.9 | 0.49 (0.19–0.71) | 0.52 ** (0.208–0.735) | 10.68 | 3.87 | |||
| VMP | SQ | Within-day | MCV (m·s−1) | 3 | 4.4 | 0.88 (0.71–0.95) | 0.87 *** (0.69–0.95) | 0.05 | 0.09 |
| Barbell displacement (cm) | 4.5 | 6.5 | 0.91 (0.79–0.97) | 0.91 *** (0.78–0.96) | 7.29 | 1.11 | |||
| Between-day | MCV (m·s−1) | 6.9 | 9.9 | 0.82 (0.67–0.90) | 0.81 *** 0.66–0.90) | 0.16 | 0.04 | ||
| Barbell displacement (cm) | 5.6 | 8 | 0.83 (0.69–0.91) | 0.83 *** (0.69–0.91) | 9.43 | 1.98 | |||
| HT | Within-day | MCV (m·s−1) | 5.3 | 7.4 | 0.80 (0.56–0.92) | 0.81 *** (0.57–0.93) | 0.09 | 0.02 | |
| Barbell displacement (cm) | 6 | 8.7 | 0.58 (0.18–0.82) | 0.57 ** (0.16–0.82) | 6.4 | 2.19 | |||
| Between-day | MCV (m·s−1) | 10.4 | 14.9 | 0.55 (0.25–0.75) | 0.55 ** (0.24–0.75) | 0.21 | 0.07 | ||
| Barbell displacement (cm) | 9.3 | 13.3 | 0.41 (0.07–0.66) | 0.41 * (0.07–0.66) | 10.75 | 4.23 |
Publisher’s Note: MDPI stays neutral with regard to jurisdictional claims in published maps and institutional affiliations. |
© 2021 by the authors. Licensee MDPI, Basel, Switzerland. This article is an open access article distributed under the terms and conditions of the Creative Commons Attribution (CC BY) license (https://creativecommons.org/licenses/by/4.0/).
Share and Cite
Held, S.; Rappelt, L.; Deutsch, J.-P.; Donath, L. Valid and Reliable Barbell Velocity Estimation Using an Inertial Measurement Unit. Int. J. Environ. Res. Public Health 2021, 18, 9170. https://0-doi-org.brum.beds.ac.uk/10.3390/ijerph18179170
Held S, Rappelt L, Deutsch J-P, Donath L. Valid and Reliable Barbell Velocity Estimation Using an Inertial Measurement Unit. International Journal of Environmental Research and Public Health. 2021; 18(17):9170. https://0-doi-org.brum.beds.ac.uk/10.3390/ijerph18179170
Chicago/Turabian StyleHeld, Steffen, Ludwig Rappelt, Jan-Philip Deutsch, and Lars Donath. 2021. "Valid and Reliable Barbell Velocity Estimation Using an Inertial Measurement Unit" International Journal of Environmental Research and Public Health 18, no. 17: 9170. https://0-doi-org.brum.beds.ac.uk/10.3390/ijerph18179170