
Does the Consumer Sociodemographic Profile Influence the Perception of Aspects Related and Not Related to Food Safety? A Study in Traditional Spanish Street Markets

 , and
, and
Abstract
:1. Introduction
2. Materials and Methods
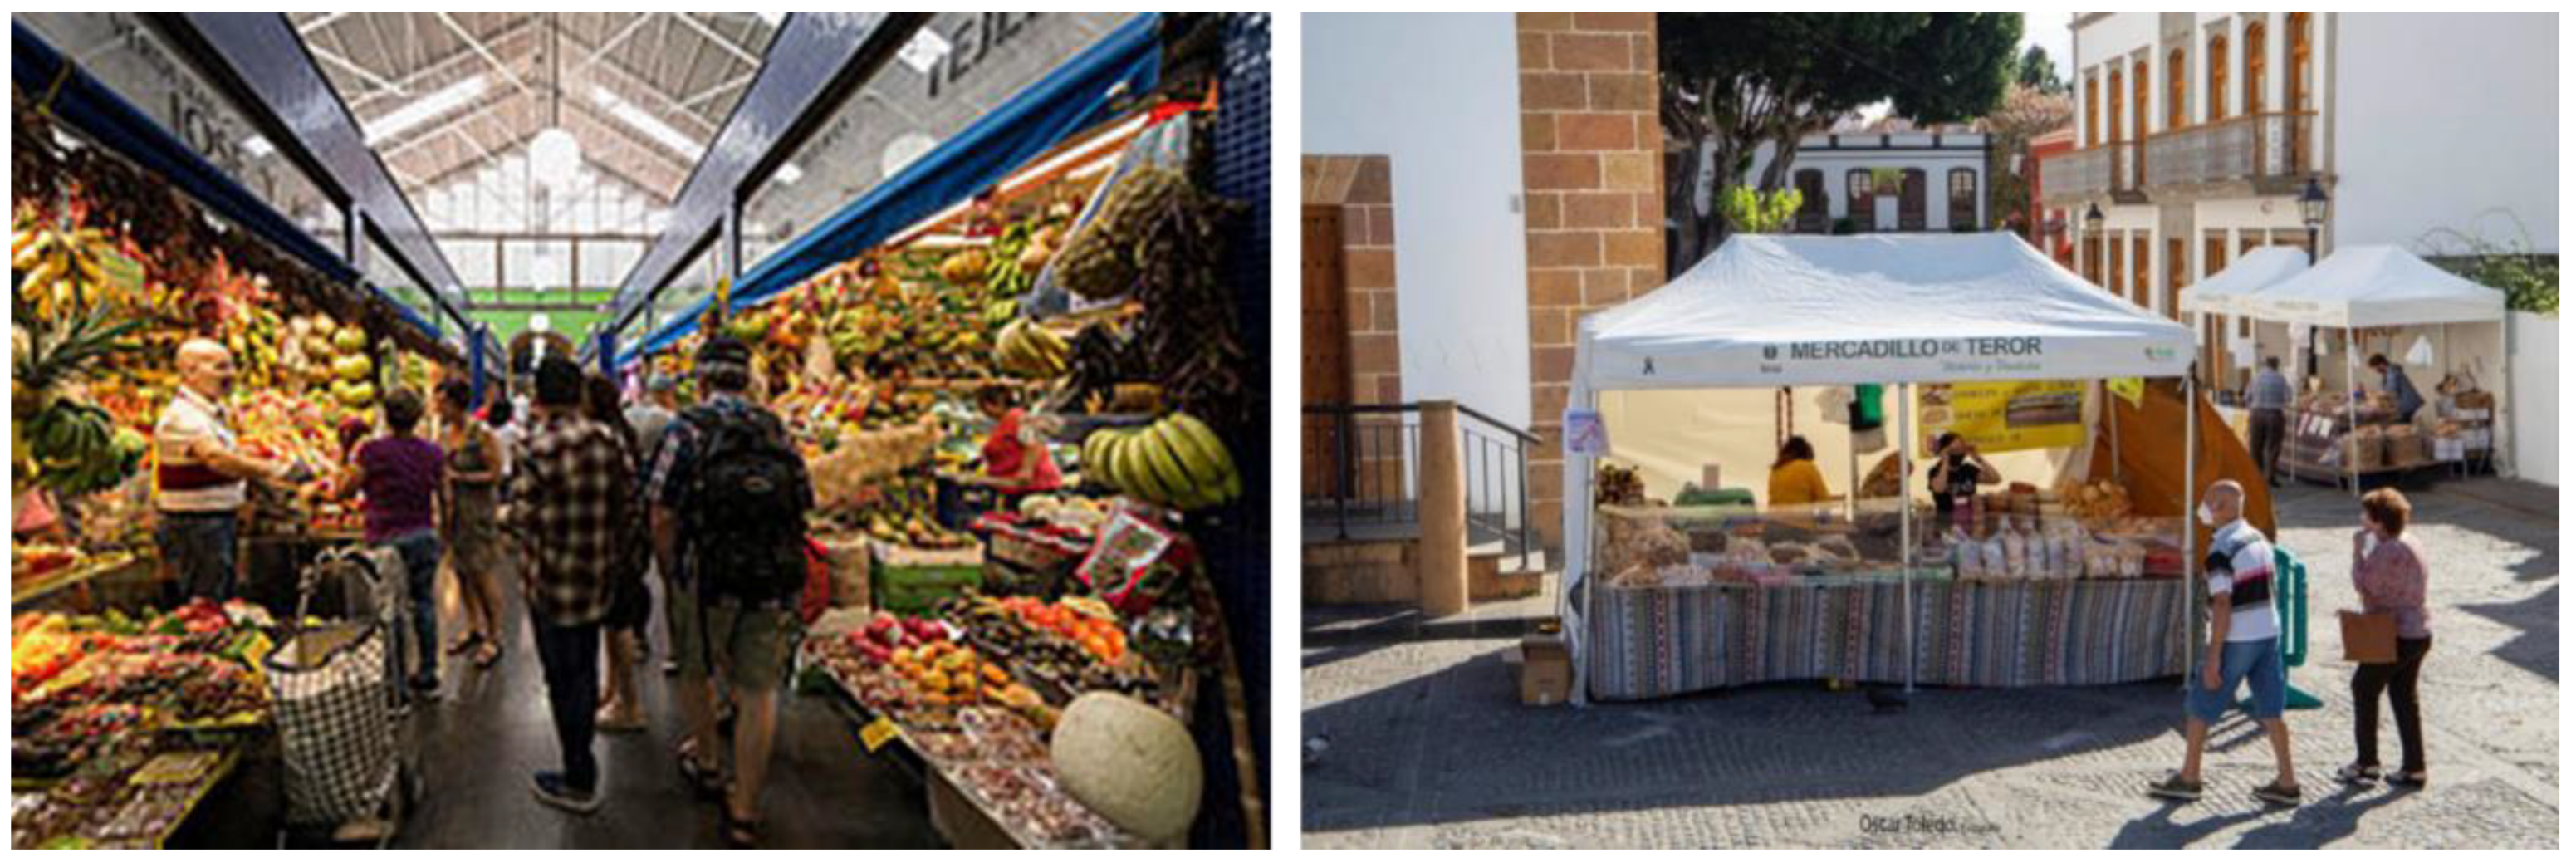
2.1. Street Markets
2.2. Survey
2.3. Statistical Analysis
3. Results
4. Discussion
5. Conclusions
Supplementary Materials
Author Contributions
Funding
Institutional Review Board Statement
Informed Consent Statement
Data Availability Statement
Conflicts of Interest
References
- Hanashiro, A.; Morita, M.; Matté, G.R.; Matté, M.H.; Torres, E.A. Microbiological quality of selected street foods from a restricted area of São Paulo city, Brazil. Food Control 2005, 16, 439–444. [Google Scholar] [CrossRef]
- Lues, J.F.R.; Rasephei, M.R.; Venter, P.; Theron, M.M. Assessing food safety and associated food handling practices in street food vending. Int. J. Environ. Health Res. 2006, 16, 319–328. [Google Scholar] [CrossRef] [PubMed]
- Walker, E.; Pritchard, C.; Forsythe, S. Food handlers’ hygiene knowledge in small food businesses. Food Control 2003, 14, 339–343. [Google Scholar] [CrossRef]
- Kubheka, L.; Mosupye, F.; von Holy, A. Microbiological survey of street-vended salad and gravy in Johannesburg city, South Africa. Food Control 2001, 12, 127–131. [Google Scholar] [CrossRef]
- Ahmed, A.M.; Shimamoto, T. Isolation and molecular characterization of Salmonella enterica, Escherichia coli O157:H7 and Shigella spp. from meat and dairy products in Egypt. Int. J. Food Microbiol. 2014, 168–169, 57–62. [Google Scholar] [CrossRef]
- Giangaspero, A.; Papini, R.; Marangi, M.; Koehler, A.V.; Gasser, R.B. Cryptosporidium parvum genotype IIa and Giardia duo-denalis assemblage A in Mytilus galloprovincialis on sale at local food markets. Int. J. Food Microbiol. 2014, 171, 62–67. [Google Scholar] [CrossRef] [PubMed]
- Krishnasree, V.; Nethra, P.V.; Dheeksha, J.; Madumitha, M.S.; Vidyaeswari, R.; Lakshya, P. A pilot study on assessing the sus-tainability of food safety and hygienic practices in street food handling system. Asian J. Dairy Food Res. 2018, 37, 321–325. [Google Scholar]
- Sabbithi, A.; Reddi, S.L.; Kumar, R.N.; Bhaskar, V.; Rao, G.S.; Rao, S. Identifying critical risk practices among street food handlers. Br. Food J. 2017, 119, 390–400. [Google Scholar] [CrossRef]
- Yulistiani, R.; Praseptiangga, D. Contamination level and prevalence of foodborne pathogen enterobacteriaceae in broiler and backyard chicken meats sold at traditional markets in Surabaya, Indonesia. Malays. Appl. Biol. 2019, 48, 95–103. [Google Scholar]
- Alimi, B.A.; Workneh, T.S. Consumer awareness and willingness to pay for safety of street foods in developing countries: A review. Int. J. Consum. Studies 2016, 40, 242–248. [Google Scholar] [CrossRef]
- Abrahale, K.; Sousa, S.; Albuquerque, G.; Padrão, P.; Lunet, N. Street food research worldwide: A scoping review. J. Hum. Nutr. Diet. 2019, 32, 152–174. [Google Scholar] [CrossRef]
- Young, I.; Thaivalappil, A.; Reimer, D.; Greig, J. Food safety at farmers’ markets: A knowledge synthesis of published re-search. J. Food Prot. 2017, 80, 2033–4207. [Google Scholar] [CrossRef] [PubMed]
- Yu, H.; Gibson, K.E.; Wright, K.G.; Neal, J.A.; Sirsat, S.A. Food safety and food quality perceptions of farmers’ market consumers in the United States. Food Control 2017, 79, 266–271. [Google Scholar] [CrossRef] [Green Version]
- Gupta, V.; Khanna, K.; Gupta, R.K. A study on the street food dimensions and its effects on consumer attitude and behavioural intentions. Tour. Rev. 2018, 73, 374–388. [Google Scholar] [CrossRef]
- Krommuang, A.; Suwunnamek, O.; Hothonhcum, K. Does the marketing mix affect street food consumption in Thailand? Int. J. Bus. Mark. Decis. Sci. 2017, 10, 76–85. [Google Scholar]
- Rajagopal. Coexistence and conflicts between shopping malls and street markets in growing cities: Analysis of shoppers behaviour. J. Retail. Leis. Property 2010, 9, 277–301. [Google Scholar] [CrossRef] [Green Version]
- Ovca, A.; Jevšnik, M.; Raspor, P. Future professional food handlers’ perspectives towards food safety. Br. Food J. 2017, 119, 411–424. [Google Scholar] [CrossRef]
- Tiozzo, B.; Mari, S.; Ruzza, M.; Crovato, S.; Ravarotto, L. Consumers’ perceptions of food risks: A snapshot of the Italian Trive-neto area. Appetite 2017, 111, 105–115. [Google Scholar] [CrossRef] [PubMed]
- Sánchez, M.D.P.; Lugo, D.; Millán, R.; Verdú, A.; Raposo, A.; Sanjuán, E.; Carrascosa, C. Mobile Artisanal Cheese Vending in Small Street Markets of Gran Canaria. Int. J. Clin. Nutr. Diet. 2015, 1, 101. [Google Scholar] [CrossRef] [PubMed] [Green Version]
- Ergönül, B. Consumer awareness and perception to food safety: A consumer analysis. Food Control 2013, 32, 461–471. [Google Scholar] [CrossRef]
- Pohlert, T. The Pairwise Multiple Comparison of Mean Ranks Package (PMCMR). R package. Available online: https://CRAN.R-project.org/package=PMCMR (accessed on 27 December 2020).
- Lawless, H.T.; Heymann, H. Sensory Evaluation of Food: Principles and Practices; Chapman & Hall: New York, NY, USA, 1998; p. 608. [Google Scholar]
- Manly, B.F.J. Multivariate Statistical Methods: A Primer. Available online: https://0-search-ebscohost-com.brum.beds.ac.uk/login.aspx?direct=true&db=cat07429a&AN=ulpgc.92985&site=eds-live (accessed on 12 April 2021).
- Izraelov, M.; Silber, J. An assessment of the global food security index. Food Secur. 2019, 11, 1135–1152. [Google Scholar] [CrossRef]
- R Core Team. R: A Language and Environment for Statistical Computing; R Foundation for Statistical Computing: Vienna, Austria. Available online: https://www.R-project.org/ (accessed on 27 December 2020).
- Theng, S.L.; Adnan, S.A.B.M.; Jaafar, N.M.; Jaafar, S.N.A.; Mahyudin, N. Comparative Study Of Consumers’ Knowledge and Attitudes Towards Food Safety and Purchase Intention of Night Market Foods Con-taining Poultry in Low and High Food Poisoning Cases States. Malays. Appl. Biol. 2017, 46, 131–161. [Google Scholar]
- Choi, J.; Lee, A.; Ok, C. The Effects of Consumers’ Perceived Risk and Benefit on Attitude and Behavioral Intention: A Study of Street Food. J. Travel Tour. Mark. 2013, 30, 222–237. [Google Scholar] [CrossRef]
- Morano, R.S.; Barrichello, A.; Jacomossi, R.R.; D’ Acosta-Rivera, J.R. Street food: Factors influencing perception of product quality. RAUSP Manag. J. 2018, 53, 535–554. [Google Scholar] [CrossRef]
- Young, I.; Chung, A.; McWhirter, J.; Papadopoulos, A. Observational assessment of food safety behaviours at farmers’ markets in Ontario, Canada: A cross-sectional study. Food Control 2020, 108, 106875. [Google Scholar] [CrossRef]
- Czarniecka-Skubina, E.; Trafiałek, J.; Wiatrowski, M.; Głuchowski, A. An Evaluation of the Hygiene Practices of European Street Food Vendors and a Preliminary Estimation of Food Safety for Consumers, Conducted in Paris. J. Food Prot. 2018, 81, 1614–1621. [Google Scholar] [CrossRef] [PubMed]
- Levine, K.; Yavelak, M.; Luchansky, J.B.; Porto-Fett, A.C.S.; Chapman, B. Consumer Perceptions of the Safety of Ready-to-Eat Foods in Retail Food Store Settings. J. Food Prot. 2017, 80, 1364–1377. [Google Scholar] [CrossRef]
- Loukieh, M.; Mouannes, E.; Jaoudeh, C.A.; Wakim, L.H.; Fancello, F.; Zeidan, M.B. Street foods in Beirut city: An as-sessment of the food safety practices and of the microbiological quality. J. Food Saf. 2018, 38, e12455. [Google Scholar] [CrossRef]
- Ghartey, A.F.; Antwi, B.K. Hand Hygiene Practices among Street Food Vendors. Food Environ. Saf. J. 2019, 18. Available online: www.fia.usv.ro/fiajournal (accessed on 27 April 2020).
- Alfiero, S.; Giudice, A.L.; Bonadonna, A. Street food and innovation: The food truck phenomenon. Br. Food J. 2017, 119, 2462–2476. [Google Scholar] [CrossRef] [Green Version]
- Balsas, C.J.L. The role of public markets in urban habitability and competitiveness. J. Place Manag. Dev. 2019, 13, 30–46. [Google Scholar] [CrossRef]
- Grace, D.; Dipeolu, M.; Alonso, S. Improving food safety in the informal sector: Nine years later. Infect. Ecol. Epidemiol. 2019, 9, 1579613. [Google Scholar] [CrossRef] [PubMed] [Green Version]
- Garner, B.; Ayala, C. Regional tourism at the farmers’ market: Consumers’ preferences for local food products. Int. J. Cult. Tour. Hosp. Res. 2019, 13, 37–54. [Google Scholar] [CrossRef]
- Rajagopal. Street markets influencing urban consumer behavior in Mexico. Lat. Am. Bus. Review 2010, 11, 77–110. [Google Scholar] [CrossRef]
- Feng, C.-L.; Wu, C.-T. Literary Overview of Night Market Studies in Southeast Asia: Local Tourists’ Selection Criteria for Night Market Visitation in Taiwan. Int. J. Organ. Innov. 2016, 9, 105. [Google Scholar]
- Renko, S.; Petljak, K.K. The secrets of the longevity of informal retail markets in Croatia. Br. Food J. 2018, 120, 325–339. [Google Scholar] [CrossRef]
- Mascarello, G.; Pinto, A.; Parise, N.; Crovato, S.; Ravarotto, L. The perception of food quality. Profiling Italian consumers. Appetite 2015, 89, 175–182. [Google Scholar] [CrossRef]
- Lu, J.; Wu, L.; Wang, S.; Xu, L. Consumer Preference and Demand for Traceable Food Attributes: A Choice-Based Conjoint Analysis. Available online: http://apps.fas.usda.gov/psdonline/ (accessed on 13 April 2020).
- Liu, A.; Niyongira, R. Chinese consumers food purchasing behaviors and awareness of food safety. Food Control 2017, 79, 185–191. [Google Scholar] [CrossRef]
- Yilmaz, E.; Oraman, Y.; Unakitan, G.; İnan, İ.H. Consumer Food Safety Knowledge, Practices and Differences in Behaviors in Thrace Region of Turkey. J. Agric. Sci. 2018, 21, 279–287. Available online: www.agri.ankara.edu.tr/dergi (accessed on 25 May 2020). [CrossRef] [Green Version]
- Nagyová, L.; Golian, J.; Géci, A.; Palkovič, J.; Čapla, J.; Kádeková, Z. Food safety from a consumers’ point of view: Food quality. Potravinarstvo 2018, 12, 355–363. [Google Scholar]
- Alimi, B. Risk factors in street food practices in developing countries: A review. Food Sci. Hum. Wellness 2016, 5, 141–148. [Google Scholar] [CrossRef] [Green Version]
- Bouranta, N.; Psomas, E.; Vouzas, F. The effect of service recovery on customer loyalty: The role of perceived food safety. Int. J. Qual. Serv. Sci. 2019, 11, 69–86. [Google Scholar] [CrossRef]
- Sõukand, R.; Stryamets, N.; Fontefrancesco, M.F.; Pieroni, A. The importance of tolerating interstices: Babushka markets in Ukraine and Eastern Europe and their role in maintaining local food knowledge and diversity. Heliyon 2020, 6, e03222. [Google Scholar] [CrossRef] [PubMed] [Green Version]
- Asiegbu, C.V.; Lebelo, S.L.; Tabit, F.T. The food safety knowledge and microbial hazards awareness of consumers of ready-to-eat street-vended food. Food Control 2016, 60, 422–429. [Google Scholar] [CrossRef]
- Sanlier, N. Food Safety Knowledge and the Safe Food Handling Behaviours of Female and Male Consumers. Pak. J. Med. Sci. 2010, 26. Available online: www.pjms.com.pk653 (accessed on 6 April 2020).
- Lusk, J.L.; McCluskey, J. Understanding the Impacts of Food Consumer Choice and Food Policy Outcomes. Appl. Econ. Perspect. Policy 2018, 40, 5–21. [Google Scholar] [CrossRef] [Green Version]


| Global n = 950 | Female n = 523 | Male n = 427 | p-Value | |
|---|---|---|---|---|
| AGE (years) | 0.053 † | |||
| 18–30 | 121 (12.7) | 75 (14.3) | 46 (10.8) | |
| 31–59 | 508 (53.5) | 287 (54.9) | 221 (51.8) | |
| >60 | 321 (33.8) | 161 (30.8) | 160 (37.5) | |
| ISLAND | 0.948 † | |||
| Gran Canaria | 475 (50.0) | 261 (49.9) | 214 (50.1) | |
| Tenerife | 475 (50.0) | 262 (50.1) | 213 (49.9) | |
| LEVEL OF EDUCATION/n = 600 | 0.006 † | |||
| Primary/Secondary | 184 (30.7) | 89 (25.8) | 95 (37.3) | |
| VT/Higher Secondary | 207 (34.5) | 122 (35.4) | 85 (33.3) | |
| University | 209 (34.8) | 134 (38.8) | 75 (29.4) | |
| OCCUPATIONAL STATUS/n = 600 | 0.179 † | |||
| Student | 44 (7.3) | 26 (7.5) | 18 (7.1) | |
| Worker | 362 (60.3) | 214 (62.0) | 148 (58.0) | |
| Unemployed | 97 (16.2) | 59 (17.1) | 38 (14.9) | |
| Pensioner | 97 (16.2) | 46 (13.3) | 51 (20.0) | |
| FACILITIES | 0.795 † | |||
| Fixed | 890 (93.7) | 489 (93.5) | 401 (93.9) | |
| Mobile | 60 (6.3) | 34 (6.5) | 26 (6.1) | |
| PRODUCTS (50 *) | 42 (37–45) | 42 (37–45) | 42 (37–45) | 0.433 ‡ |
| Quality | 9 (8–10) | 9 (8–9) | 9 (8–10) | 0.067 ‡ |
| Labelling/Information | 8 (6–9) | 8 (6–9) | 8 (6–9) | 0.472 ‡ |
| Variety | 8 (7–9) | 8 (7–9) | 8 (7–9) | 0.956 ‡ |
| Local/Artisanal | 9 (8–10) | 9 (8–10) | 9 (8–10) | 0.407 ‡ |
| Freshness | 9 (8–10) | 9 (8–10) | 9 (8–10) | 0.319 ‡ |
| PRICES (30 *) | 24 (20–27) | 24 (20–27) | 25 (20–28) | 0.029 ‡ |
| Quality/Cost ratio | 9 (7–10) | 9 (7–9) | 9 (7–10) | 0.215 ‡ |
| Price choice | 8 (6–9) | 8 (6–9) | 8 (6–9) | 0.108 ‡ |
| Higher price—better quality association | 8 (7–9) | 8 (6–9) | 8 (7–9) | 0.052 ‡ |
| PROFESSIONALISM (40 *) | 35 (30–37) | 35 (30–37) | 35 (30–38) | 0.510 ‡ |
| Received treatment | 9 (8–10) | 9 (8–10) | 9 (8–10) | 0.621 ‡ |
| Waiting time | 9 (7–9) | 9 (7–9) | 9 (7–9) | 0.496 ‡ |
| Information/Advice | 9 (7–9) | 9 (7–9) | 9 (7–9) | 0.965 ‡ |
| Looking after customers | 9 (8–10) | 9 (8–10) | 9 (8–10) | 0.314 ‡ |
| FOOD HANDLERS’ TRAINING (40 *) | 33 (27–36) | 33 (27–36) | 32 (26–36) | 0.753 ‡ |
| Presentation of products | 8 (7–9) | 8 (7–9) | 8 (7–9) | 0.393 ‡ |
| Food handling | 9 (7–9) | 8 (7–9) | 9 (7–9) | 0.757 ‡ |
| Correct uniform | 8 (6–9) | 8 (6–9) | 8 (6–9) | 0.276 ‡ |
| Uniform hygiene | 9 (6–9) | 9 (7–9) | 8 (6–9) | 0.424 ‡ |
| MARKET HYGIENE (40 *) | 32 (28–35) | 32 (29–35) | 32 (28–36) | 0.950 ‡ |
| Table cleanliness | 8 (7–9) | 8 (7–9) | 8 (7–9) | 0.790 ‡ |
| Equipment cleanliness | 8 (7–9) | 8 (7–9) | 8 (7–9) | 0.573 ‡ |
| Structure cleanliness | 8 (7–9) | 8 (7–9) | 8 (7–9) | 0.872 ‡ |
| General hygiene | 9 (7–9) | 9 (7–9) | 9 (7–9) | 0.974 ‡ |
| OVERALL EVALUATION (10 *) | 9 (7–9) | 9 (7–9) | 9 (7–9) | 0.651 ‡ |
| TOTAL (210 *) | 174 (151–188) | 174 (152–187) | 174 (150–189) | 0.491 ‡ |
| MARKET/SHOPPING CENTRE DIFFERENCE | 0.015 † | |||
| Price | 282 (29.8) | 139 (26.6) | 143 (33.6) | |
| Hygiene | 70 (7.4) | 40 (7.7) | 30 (7.1) | |
| Freshness & Quality | 333 (35.2) | 209 (40.0) | 124 (29.2) | |
| Personal assistance | 113 (11.9) | 59 (11.3) | 54 (12.7) | |
| Local products | 124 (13.1) | 64 (12.3) | 60 (14.1) | |
| Habit/Proximity/Convenience | 25 (2.6) | 11 (2.1) | 14 (3.3) |
| 18–30 n = 121 | 31–59 n = 508 | >60 n = 321 | p-Value | |
|---|---|---|---|---|
| GENDER | 0.053 † | |||
| Female | 75 (62.0) | 287 (56.5) | 161 (50.2) | |
| Male | 46 (38.0) | 221 (43.5) | 160 (49.8) | |
| ISLAND | <0.001 † | |||
| Gran Canaria | 51 (42.1) | 289 (56.9) | 135 (42.1) | |
| Tenerife | 70 (57.9) | 219 (43.1) | 186 (57.9) | |
| LEVEL OF EDUCATION/n = 600 | 0.003 † | |||
| Primary/Secondary | 31 (31.3) | 96 (27.2) | 57 (38.5) | |
| VT/Higher Secondary | 29 (29.3) | 119 (33.7) | 59 (39.9) | |
| University | 39 (39.4) | 138 (39.1) | 32 (21.6) | |
| OCCUPATIONAL STATUS/n = 600 | <0.001 † | |||
| Student | 34 (34.3) | 9 (2.5) | 1 (0.7) | |
| Worker | 54 (54.5) | 250 (70.8) | 58 (39.2) | |
| Unemployed | 10 (10.1) | 75 (21.2) | 12 (8.1) | |
| Pensioner | 1 (1.0) | 19 (5.4) | 77 (52.0) | |
| FACILITIES | 0.050 † | |||
| Fixed | 110 (90.9) | 471 (92.7) | 309 (96.3) | |
| Mobile | 11 (9.1) | 37 (7.3) | 12 (3.7) | |
| PRODUCTS (50 *) | 40 (36–44) a | 42 (37–45) a,b | 43 (38–45) b | 0.016 ‡ |
| Quality | 9 (7–9) | 9 (8–9) | 9 (8–10) | 0.048 ‡ |
| Labelling/Information | 7 (6–8) | 8 (6–9) | 8 (7–9) | <0.001 ‡ |
| Variety | 8 (7–9) | 8 (7–9) | 8 (7–9) | 0.685 ‡ |
| Local/Artisanal | 9 (7–9) | 9 (8–10) | 9 (8–10) | 0.120 ‡ |
| Freshness | 9 (8–10) | 9 (8–10) | 9 (8–10) | 0.006 ‡ |
| PRICES (30*) | 24 (20–26) a | 23 (19–27) a | 26 (22–28) b | <0.001 ‡ |
| Quality/Cost ratio | 9 (7–9) | 8 (7–9) | 9 (8–10) | <0.001 ‡ |
| Price choice | 8 (7–9) | 8 (6–9) | 8 (7–9) | <0.001 ‡ |
| Higher price—better quality association | 8 (6–9) | 8 (6–9) | 9 (7–10) | <0.001 ‡ |
| PROFESSIONALISM (40 *) | 33 (28–37) a | 35 (30–37) a,b | 36 (32–38) b | 0.003 ‡ |
| Received treatment | 9 (7–10) | 9 (8–10) | 9 (8–10) | 0.003 ‡ |
| Waiting time | 8 (7–9) | 9 (7–9) | 9 (8–9) | <0.001 ‡ |
| Information/Advice | 8 (7–9) | 8 (7–9) | 9 (8–9) | 0.081 ‡ |
| Looking after customers | 8 (7–10) | 9 (8–10) | 9 (8–10) | 0.037 ‡ |
| FOOD HANDLERS’ TRAINING (40 *) | 31 (26–35) a | 32 (26–36) a | 34 (29–36) b | 0.001 ‡ |
| Presentation of products | 8 (7–9) | 8 (7–9) | 9 (7–9) | 0.014 ‡ |
| Food handling | 8 (6–9) | 8 (7–9) | 9 (8–9) | <0.001 ‡ |
| Correct uniform | 8 (6–9) | 8 (5–9) | 8 (6–9) | 0.034 ‡ |
| Uniform hygiene | 8 (6–9) | 8 (6–9) | 9 (7–9) | <0.001 ‡ |
| MARKET HYGIENE (40 *) | 32 (28–35) a,b | 32 (28–35) a | 33 (30–36) b | 0.013 ‡ |
| Table cleanliness | 8 (6–9) | 8 (7–9) | 9 (8–9) | 0.004 ‡ |
| Equipment cleanliness | 8 (7–9) | 8 (7–9) | 8 (7–9) | 0.153 ‡ |
| Structure cleanliness | 8 (7–9) | 8 (7–9) | 8 (7–9) | 0.153 ‡ |
| General hygiene | 8 (7–9) | 8 (7–9) | 9 (8–9) | <0.001 ‡ |
| OVERALL EVALUATION (10 *) | 8 (7–9) | 8 (7–9) | 9 (8–9) | <0.001 ‡ |
| TOTAL (210 *) | 166 (146–185) | 170 (149–187) | 183 (155–190) | <0.001 ‡ |
| MARKET/SHOPPING CENTRE DIFFERENCE | 0.049 † | |||
| Price | 41 (33.9) | 138 (27.2) | 103 (32.3) | |
| Hygiene | 11 (9.1) | 37 (7.3) | 22 (6.9) | |
| Freshness & Quality | 45 (37.2) | 194 (38.3) | 94 (29.5) | |
| Personal assistance | 12 (9.9) | 56 (11.0) | 45 (14.1) | |
| Local products | 12 (9.9) | 71 (14.0) | 41 (12.9) | |
| Habit/Proximity/Convenience | 0 | 11 (2.2) | 14 (4.4) |
| Primary/Secondary n = 184 | VT/Higher Sec. n = 207 | University n = 209 | p-Value | |
|---|---|---|---|---|
| GENDER | 0.006 † | |||
| Female | 89 (48.4) | 122 (58.9) | 134 (64.1) | |
| Male | 95 (51.6) | 85 (41.1) | 75 (35.9) | |
| AGE (years) | 0.003 † | |||
| 18–30 | 31 (16.8) | 29 (14.0) | 39 (18.7) | |
| 31–59 | 96 (52.2) | 119 (57.5) | 138 (66.0) | |
| >60 | 57 (31.0) | 59 (28.5) | 32 (15.3) | |
| ISLAND | 0.008 † | |||
| Gran Canaria | 80 (43.5) | 98 (47.3) | 122 (58.4) | |
| Tenerife | 104 (56.5) | 109 (52.7) | 87 (41.6) | |
| OCCUPATIONAL STATUS/n = 600 | 0.049 † | |||
| Student | 14 (7.6) | 13 (6.3) | 17 (8.1) | |
| Worker | 96 (52.2) | 128 (61.8) | 138 (66.0) | |
| Unemployed | 33 (17.9) | 38 (18.4) | 26 (12.4) | |
| Pensioner | 41 (22.3) | 28 (13.5) | 28 (13.4) | |
| FACILITIES | 0.276 † | |||
| Fixed | 170 (92.4) | 187 (90.3) | 183 (87.6) | |
| Mobile | 14 (7.6) | 20 (9.7) | 26 (12.4) | |
| PRODUCTS (50 *) | 38 (34–43) | 38 (34–43) | 39 (36–43) | 0.445 ‡ |
| Quality | 8 (7–9) | 8 (7–9) | 8 (7–9) | 0.164 ‡ |
| Labelling/Information | 7 (6–8) | 7 (6–8) | 7 (6–8) | 0.500 ‡ |
| Variety | 8 (6–9) | 7 (6–9) | 8 (7–9) | 0.428 ‡ |
| Local/Artisanal | 8 (7–9) | 8 (7–9) | 8 (7–9) | 0.383 ‡ |
| Freshness | 8 (7–9) | 8 (7–9) | 9 (7–9) | 0.375 ‡ |
| PRICES (30 *) | 21 (18–24) | 21 (18–24) | 21 (17–24) | 0.919 ‡ |
| Quality/Cost ratio | 7 (6–8) | 8 (6–9) | 8 (6–9) | 0.502 ‡ |
| Price choice | 7 (6–8) | 7 (5–8) | 7 (5–8) | 0.675 ‡ |
| Higher price—better quality association | 7 (6–8) | 7 (5–8) | 7 (5–8) | 0.864 ‡ |
| PROFESSIONALISM (40 *) | 32 (28–36) | 32 (28–35) | 32 (28–35) | 0.652 ‡ |
| Received treatment | 8 (7–10) | 8 (7–9) | 9 (7–9) | 0.556 ‡ |
| Waiting time | 8 (7–9) | 8 (7–9) | 8 (7–9) | 0.847 ‡ |
| Information/Advice | 8 (6–9) | 8 (6–9) | 8 (7–9) | 0.813 ‡ |
| Looking after customers | 8 (7–10) | 8 (7–9) | 8 (7–9) | 0.171 ‡ |
| FOOD HANDLERS’ TRAINING (40 *) | 29 (25–33) | 28 (24–32) | 28 (23–32) | 0.208 ‡ |
| Presentation of products | 8 (7–9) | 8 (7–9) | 8 (7–9) | 0.127 ‡ |
| Food handling | 8 (6–9) | 7 (6–9) | 7 (6–8) | 0.293 ‡ |
| Correct uniform | 7 (6–8) | 7 (5–8) | 7 (5–8) | 0.285 ‡ |
| Uniform hygiene | 7 (6–9) | 7 (5–8) | 7 (5–8) | 0.413 ‡ |
| MARKET HYGIENE (40 *) | 31 (27–34) | 30 (26–33) | 29 (26–33) | 0.168 ‡ |
| Table cleanliness | 8 (7–9) | 7 (6–9) | 8 (6–9) | 0.080 ‡ |
| Equipment cleanliness | 8 (7–9) | 8 (7–9) | 8 (6–8) | 0.066 ‡ |
| Structure cleanliness | 8 (6–9) | 7 (6–8) | 7 (6–8) | 0.033 ‡ |
| General hygiene | 8 (6–9) | 7 (6–9) | 7 (6–8) | 0.604 ‡ |
| OVERALL EVALUATION (10 *) | 8 (7–9) | 8 (7–9) | 8 (7–9) | 0.851 ‡ |
| TOTAL (210 *) | 157 (142–171) | 154 (141–170) | 157 (140–170) | 0.616 ‡ |
| MARKET/SHOPPING CENTRE DIFFERENCE | 0.089 † | |||
| Price | 53 (29.1) | 63 (30.6) | 51 (24.4) | |
| Hygiene | 20 (11.0) | 30 (14.6) | 20 (9.6) | |
| Freshness & Quality | 68 (37.4) | 85 (41.3) | 91 (43.5) | |
| Personal assistance | 22 (12.1) | 17 (8.3) | 17 (8.1) | |
| Local products | 17 (9.3) | 9 (4.4) | 27 (12.9) | |
| Habit/Proximity/Convenience | 2 (1.1) | 2 (1.0) | 3 (1.4) |
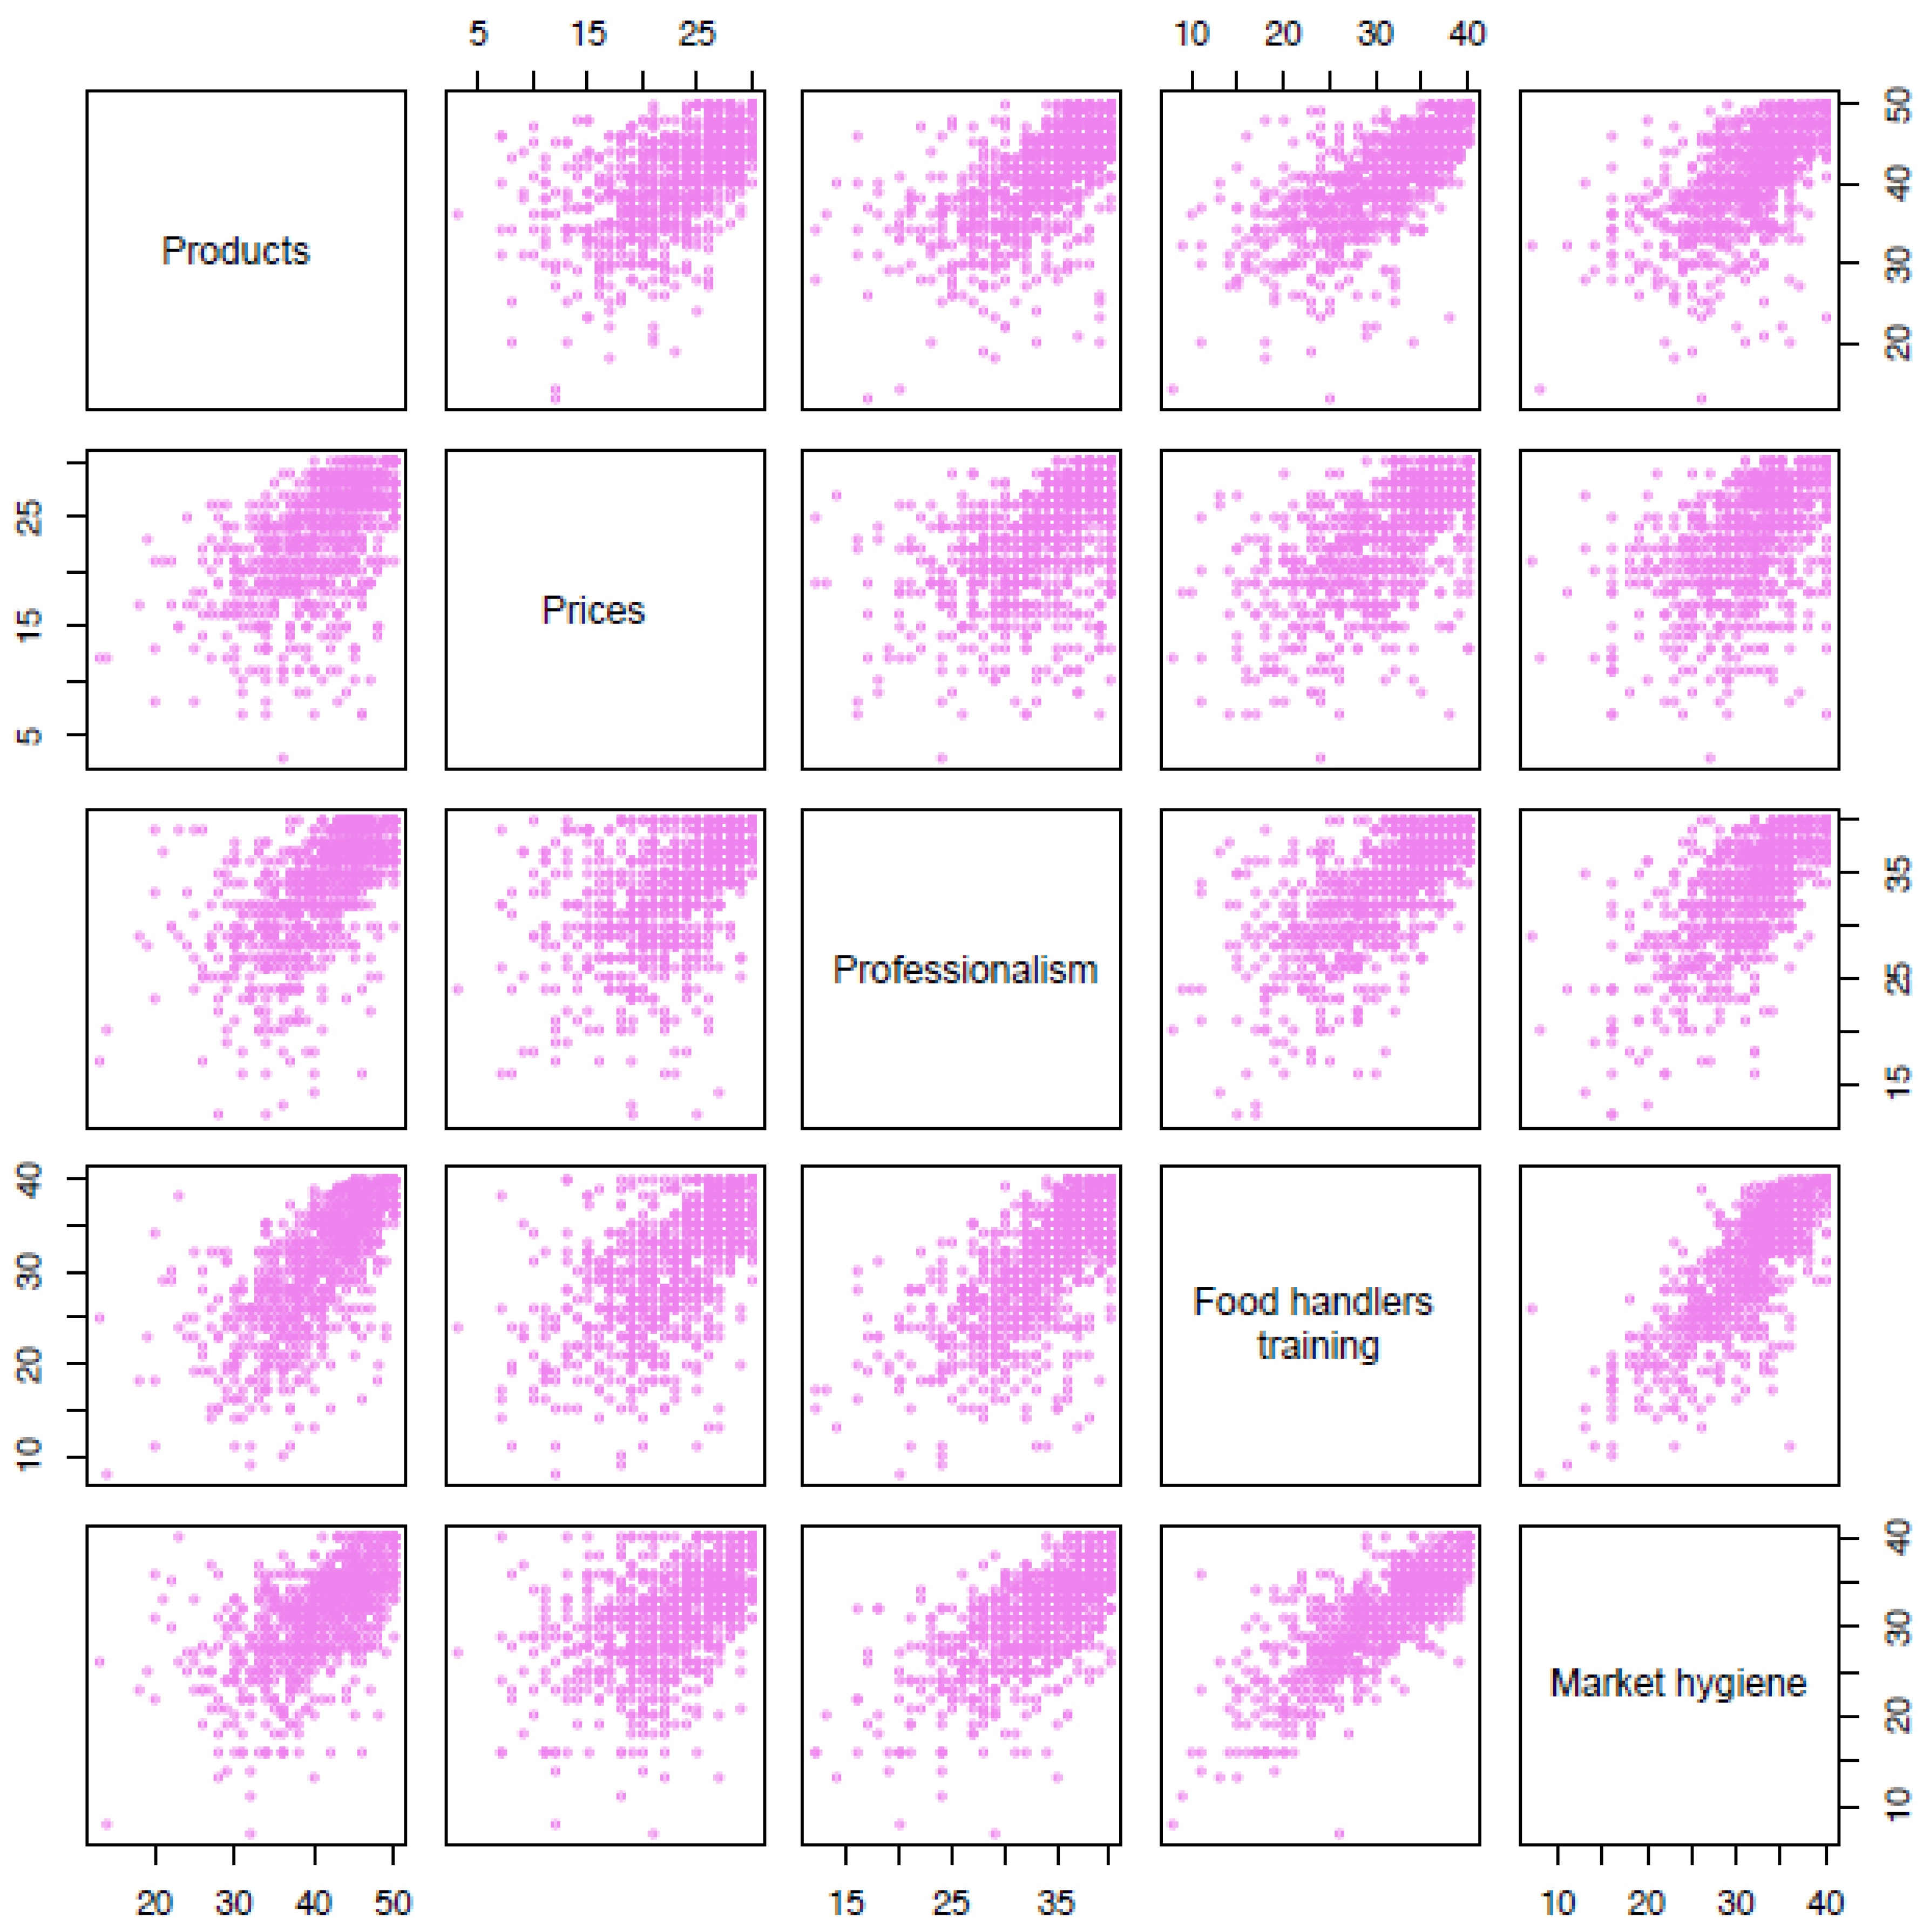
| Products | Prices | Professionalism | Food Handlers’ Training | |
|---|---|---|---|---|
| Prices | 0.549 (<0.001) | |||
| Professionalism | 0.602 (<0.001) | 0.499 (<0.001) | ||
| Food handlers’ training | 0.700 (<0.001) | 0.611 (<0.001) | 0.677 (<0.001) | |
| Market hygiene | 0.607 (<0.001) | 0.512 (<0.001) | 0.679 (<0.001) | 0.802 (<0.001) |
| Totals | First | Second | Third | Fourth | Fifth |
|---|---|---|---|---|---|
| Products | 0.4411 | −0.0749 | −0.8726 | −0.0641 | −0.185 |
| Prices | 0.3978 | −0.8532 | 0.3053 | −0.0813 | −0.1183 |
| Professionalism | 0.4417 | 0.3572 | 0.2373 | −0.7856 | 0.06145 |
| Food handlers’ training | 0.4872 | 0.0988 | 0.0452 | 0.3929 | 0.7723 |
| Market hygiene | 0.4633 | 0.3594 | 0.2948 | 0.4666 | −0.5929 |
| Variance | % of Variance | % of Accumulated Variance | |
|---|---|---|---|
| First | 3.509 | 70.173 | 70.173 |
| Second | 0.553 | 11.054 | 81.227 |
| Third | 0.403 | 8.054 | 89.282 |
| Fourth | 0.359 | 7.179 | 96.460 |
| Fifth | 0.177 | 3.540 | 100.000 |
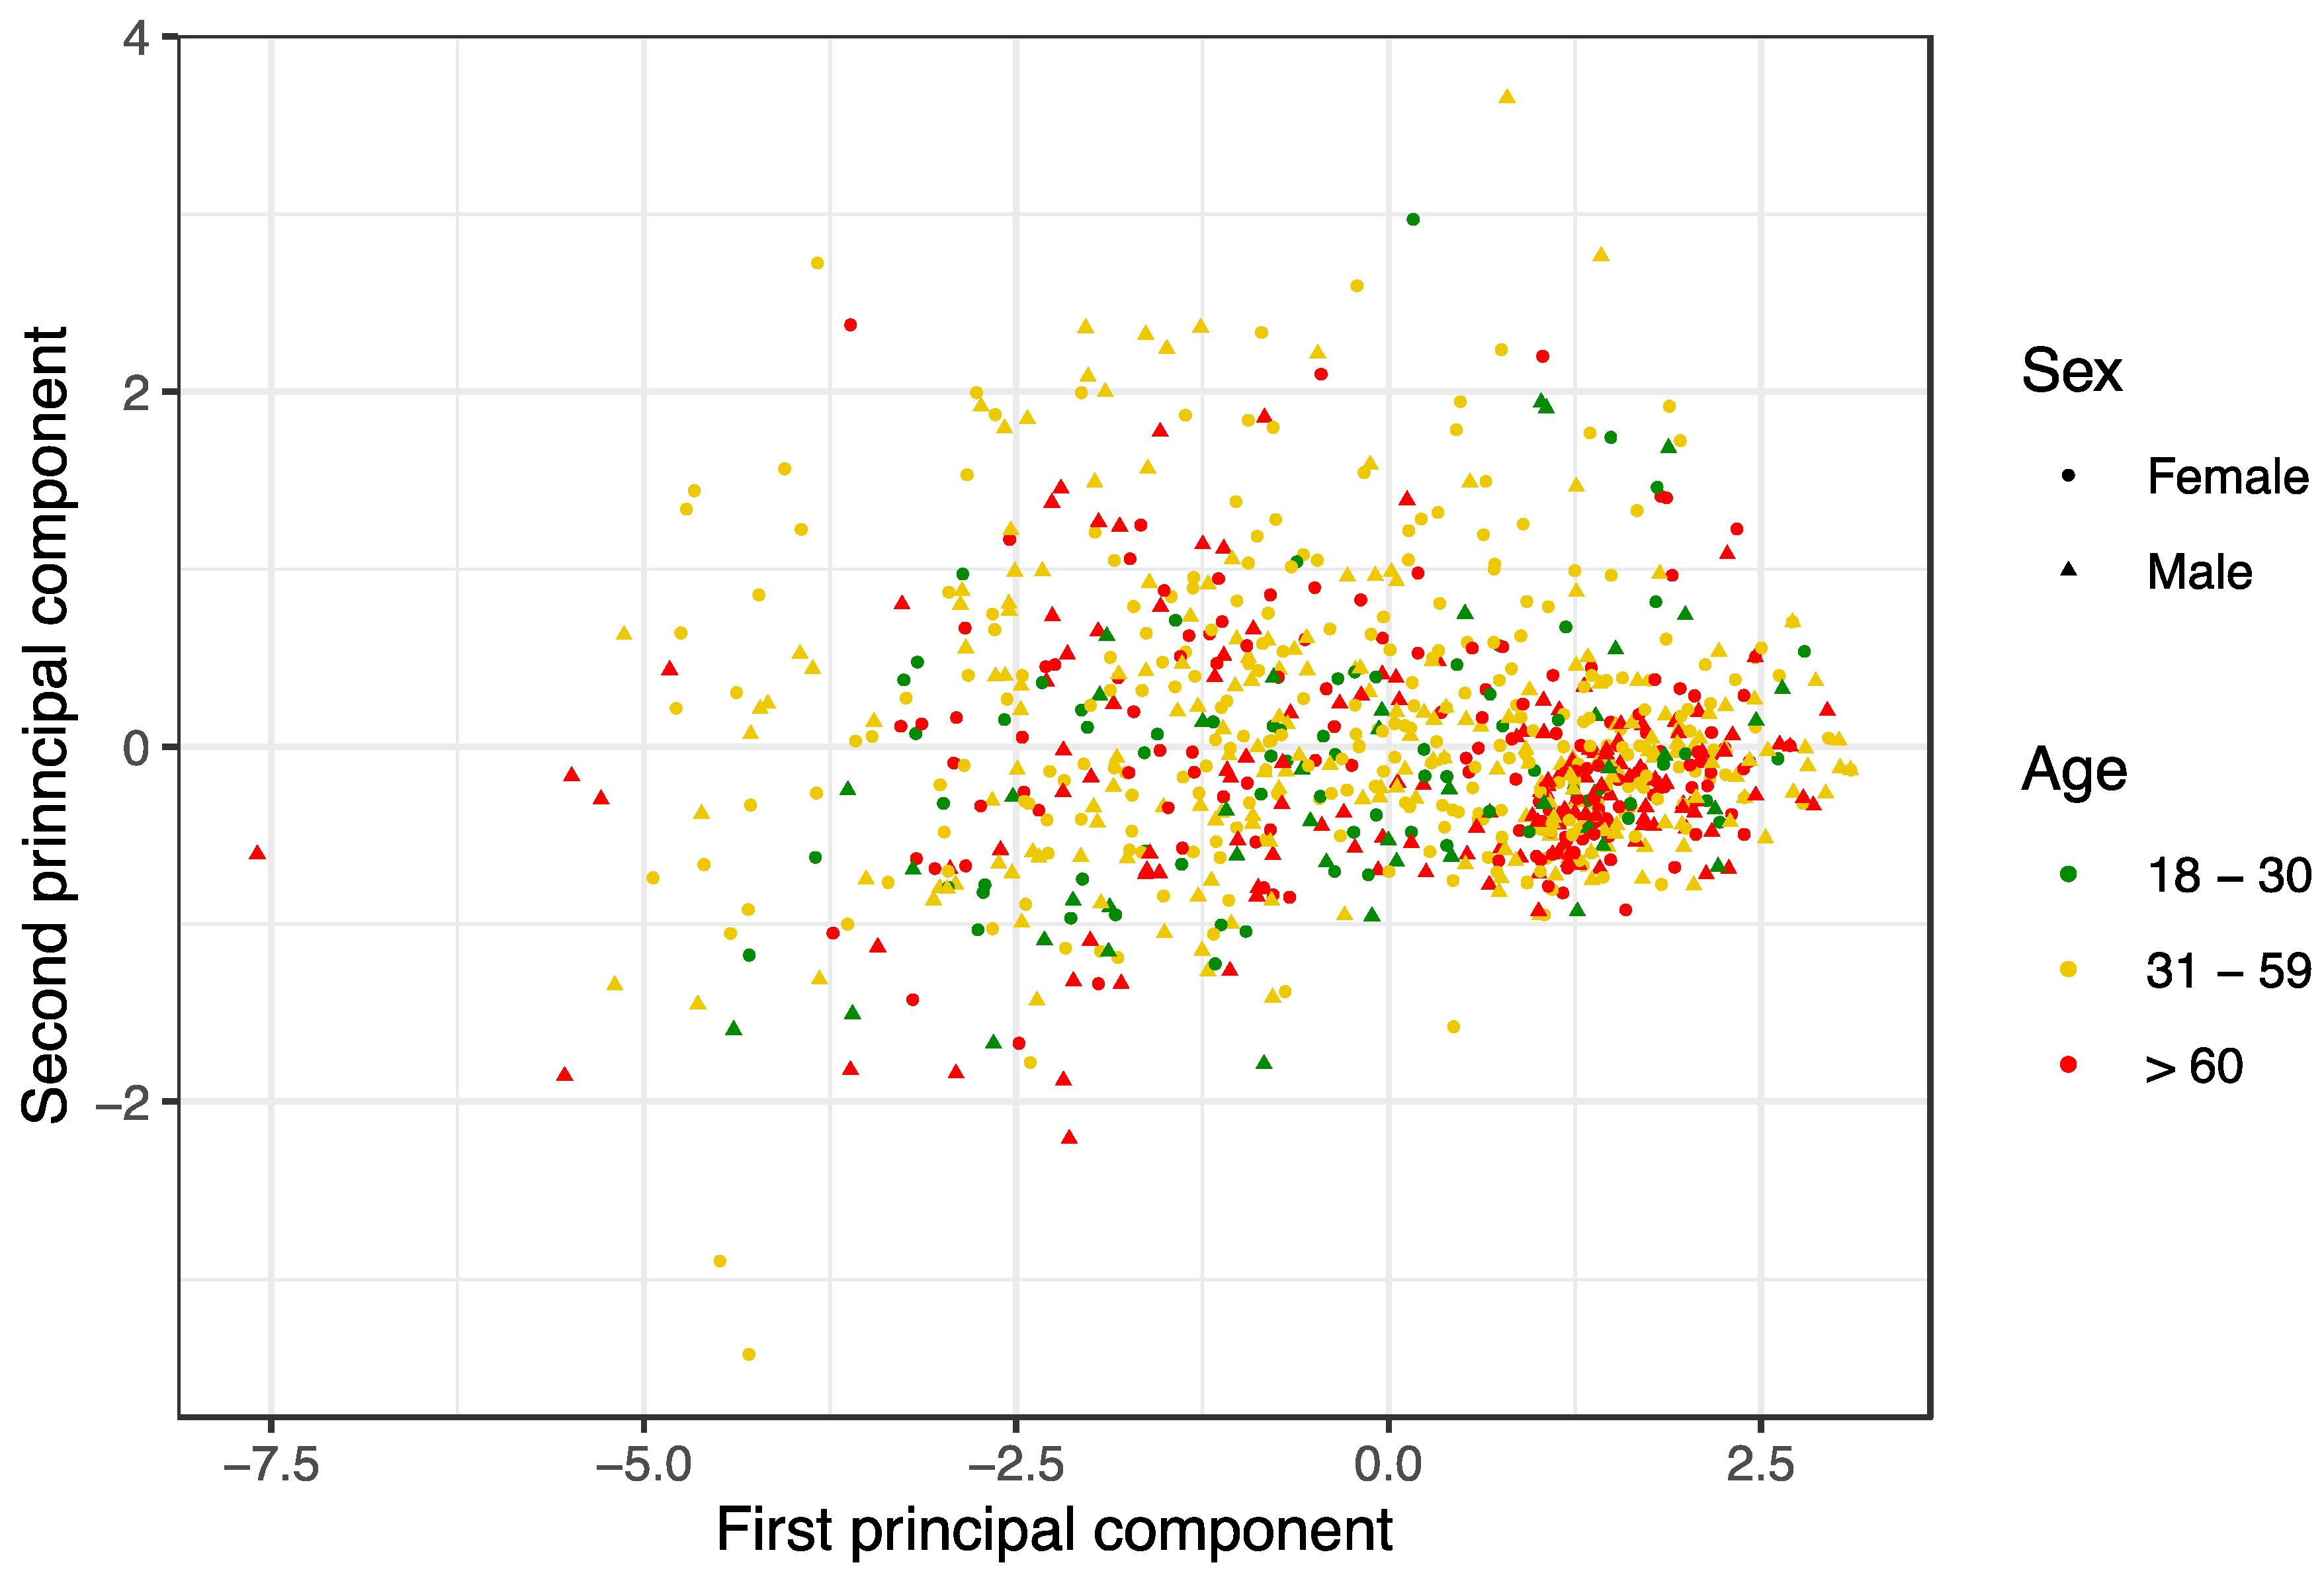
| First PC | p-Value | Second PC | p-Value | |
|---|---|---|---|---|
| AGE (years) | <0.001 † | <0.001 † | ||
| 18–30 | −0.138 (−1.641; 1.267) a | −0.134 (−0.612; 0.173) a | ||
| 31–59 | 0.134 (−1.419; 1.359) a | −0.025 (−0.386; 0.440) b | ||
| >60 | 1.070 (−0.958; 1.623) b | −0.172 (−0.462; 0.165) a | ||
| GENDER | 0.472 † | 0.006 † | ||
| Female | 0.374 (−1.288; 1.400) | −0.069 (−0.385; 0.395) | ||
| Male | 0.386 (−1.360; 1.530) | −0.140 (−0.485; 0.235) | ||
| LEVEL OF EDUCATION | 0.597 † | 0.830 † | ||
| Primary/Secondary | −0.867 (−1.945; 0.325) | 0.117 (−0.363; 0.600) | ||
| VT/Higher Secondary | −1.061 (−2.068; 0.159) | 0.000 (−0.427; 0.585) | ||
| University | −0.827 (−2.134; 0.110) | 0.114 (−0.481; 0.633) |
Publisher’ s Note: MDPI stays neutral with regard to jurisdictional claims in published maps and institutional affiliations. |
© 2021 by the authors. Licensee MDPI, Basel, Switzerland. This article is an open access article distributed under the terms and conditions of the Creative Commons Attribution (CC BY) license (https://creativecommons.org/licenses/by/4.0/).
Share and Cite
Verdú, A.; Millán, R.; Saavedra, P.; Iruzubieta, C.J.C.; Sanjuán, E. Does the Consumer Sociodemographic Profile Influence the Perception of Aspects Related and Not Related to Food Safety? A Study in Traditional Spanish Street Markets. Int. J. Environ. Res. Public Health 2021, 18, 9794. https://0-doi-org.brum.beds.ac.uk/10.3390/ijerph18189794
Verdú A, Millán R, Saavedra P, Iruzubieta CJC, Sanjuán E. Does the Consumer Sociodemographic Profile Influence the Perception of Aspects Related and Not Related to Food Safety? A Study in Traditional Spanish Street Markets. International Journal of Environmental Research and Public Health. 2021; 18(18):9794. https://0-doi-org.brum.beds.ac.uk/10.3390/ijerph18189794
Chicago/Turabian StyleVerdú, Abel, Rafael Millán, Pedro Saavedra, Conrado Javier Carrascosa Iruzubieta, and Esther Sanjuán. 2021. "Does the Consumer Sociodemographic Profile Influence the Perception of Aspects Related and Not Related to Food Safety? A Study in Traditional Spanish Street Markets" International Journal of Environmental Research and Public Health 18, no. 18: 9794. https://0-doi-org.brum.beds.ac.uk/10.3390/ijerph18189794