
Metabolic Syndrome and Coronary Artery Disease Risk: A Meta-Analysis of Observational Studies

 ,
,  and
and
Abstract
:1. Introduction
2. Materials and Methods
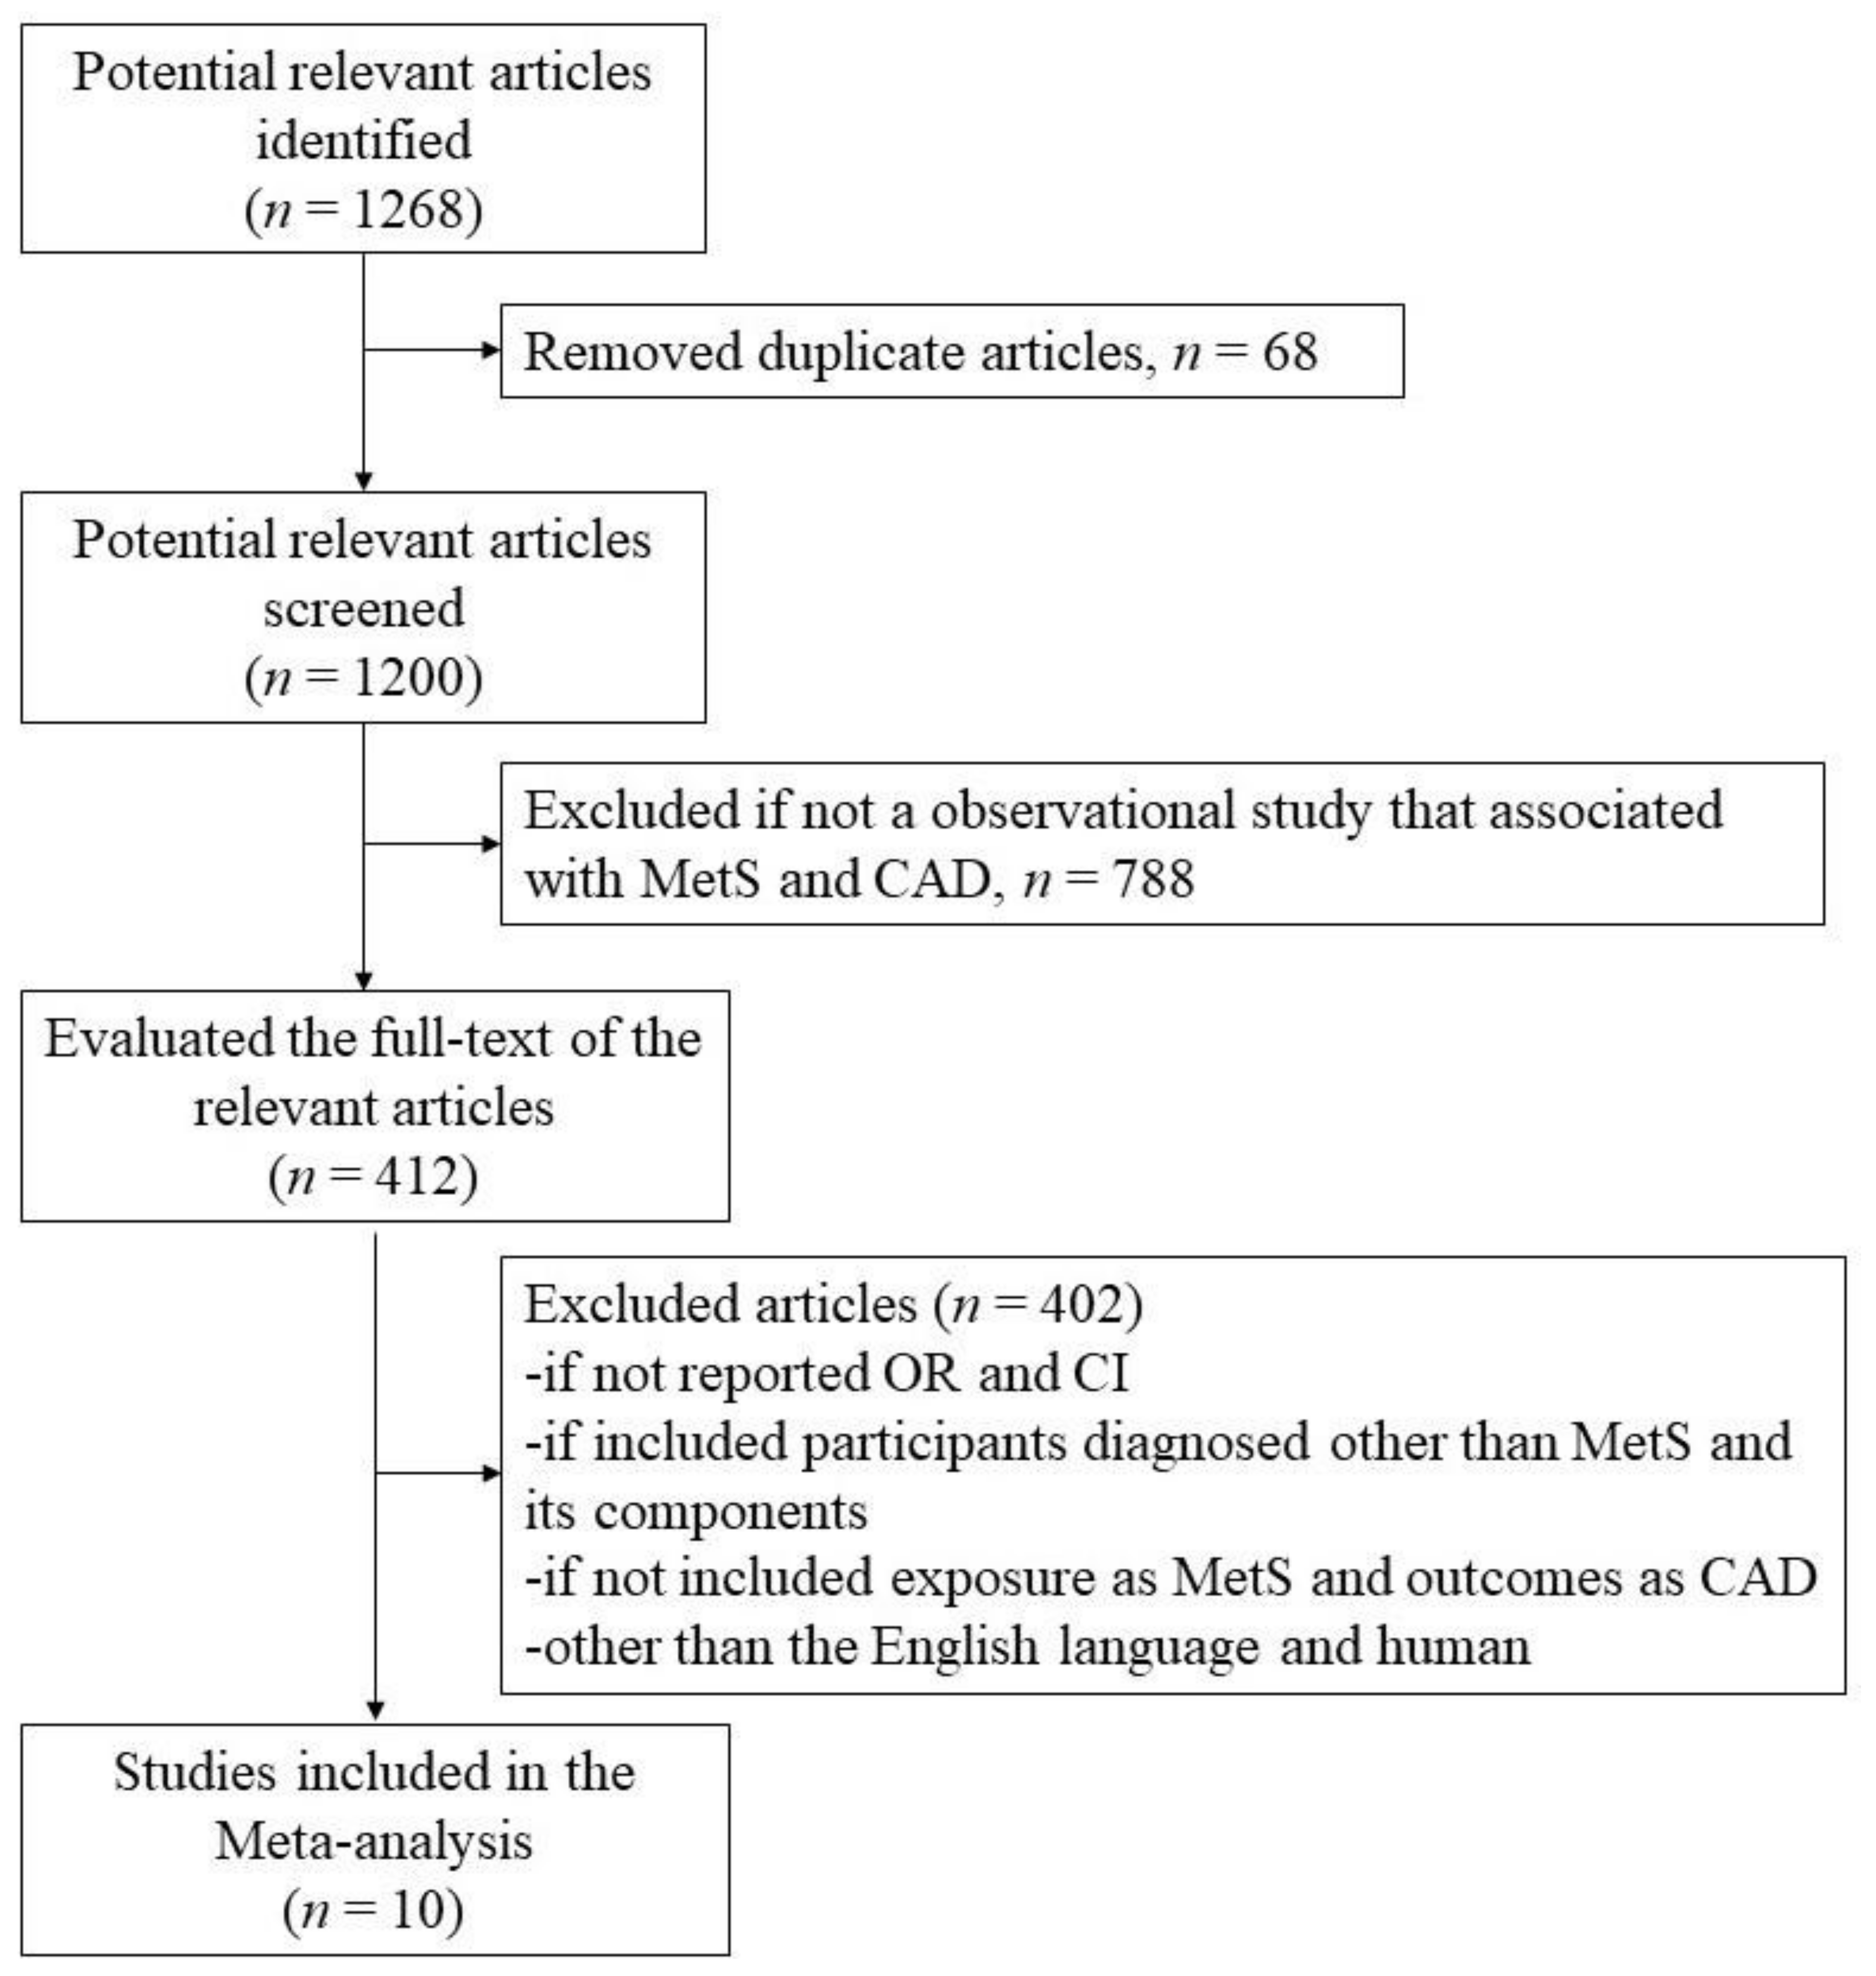
2.1. Search Strategy
2.2. Inclusion and Exclusion Criteria
2.3. Data Extraction
2.4. Statistical Analysis
3. Results
3.1. Selected Studies and Characteristics
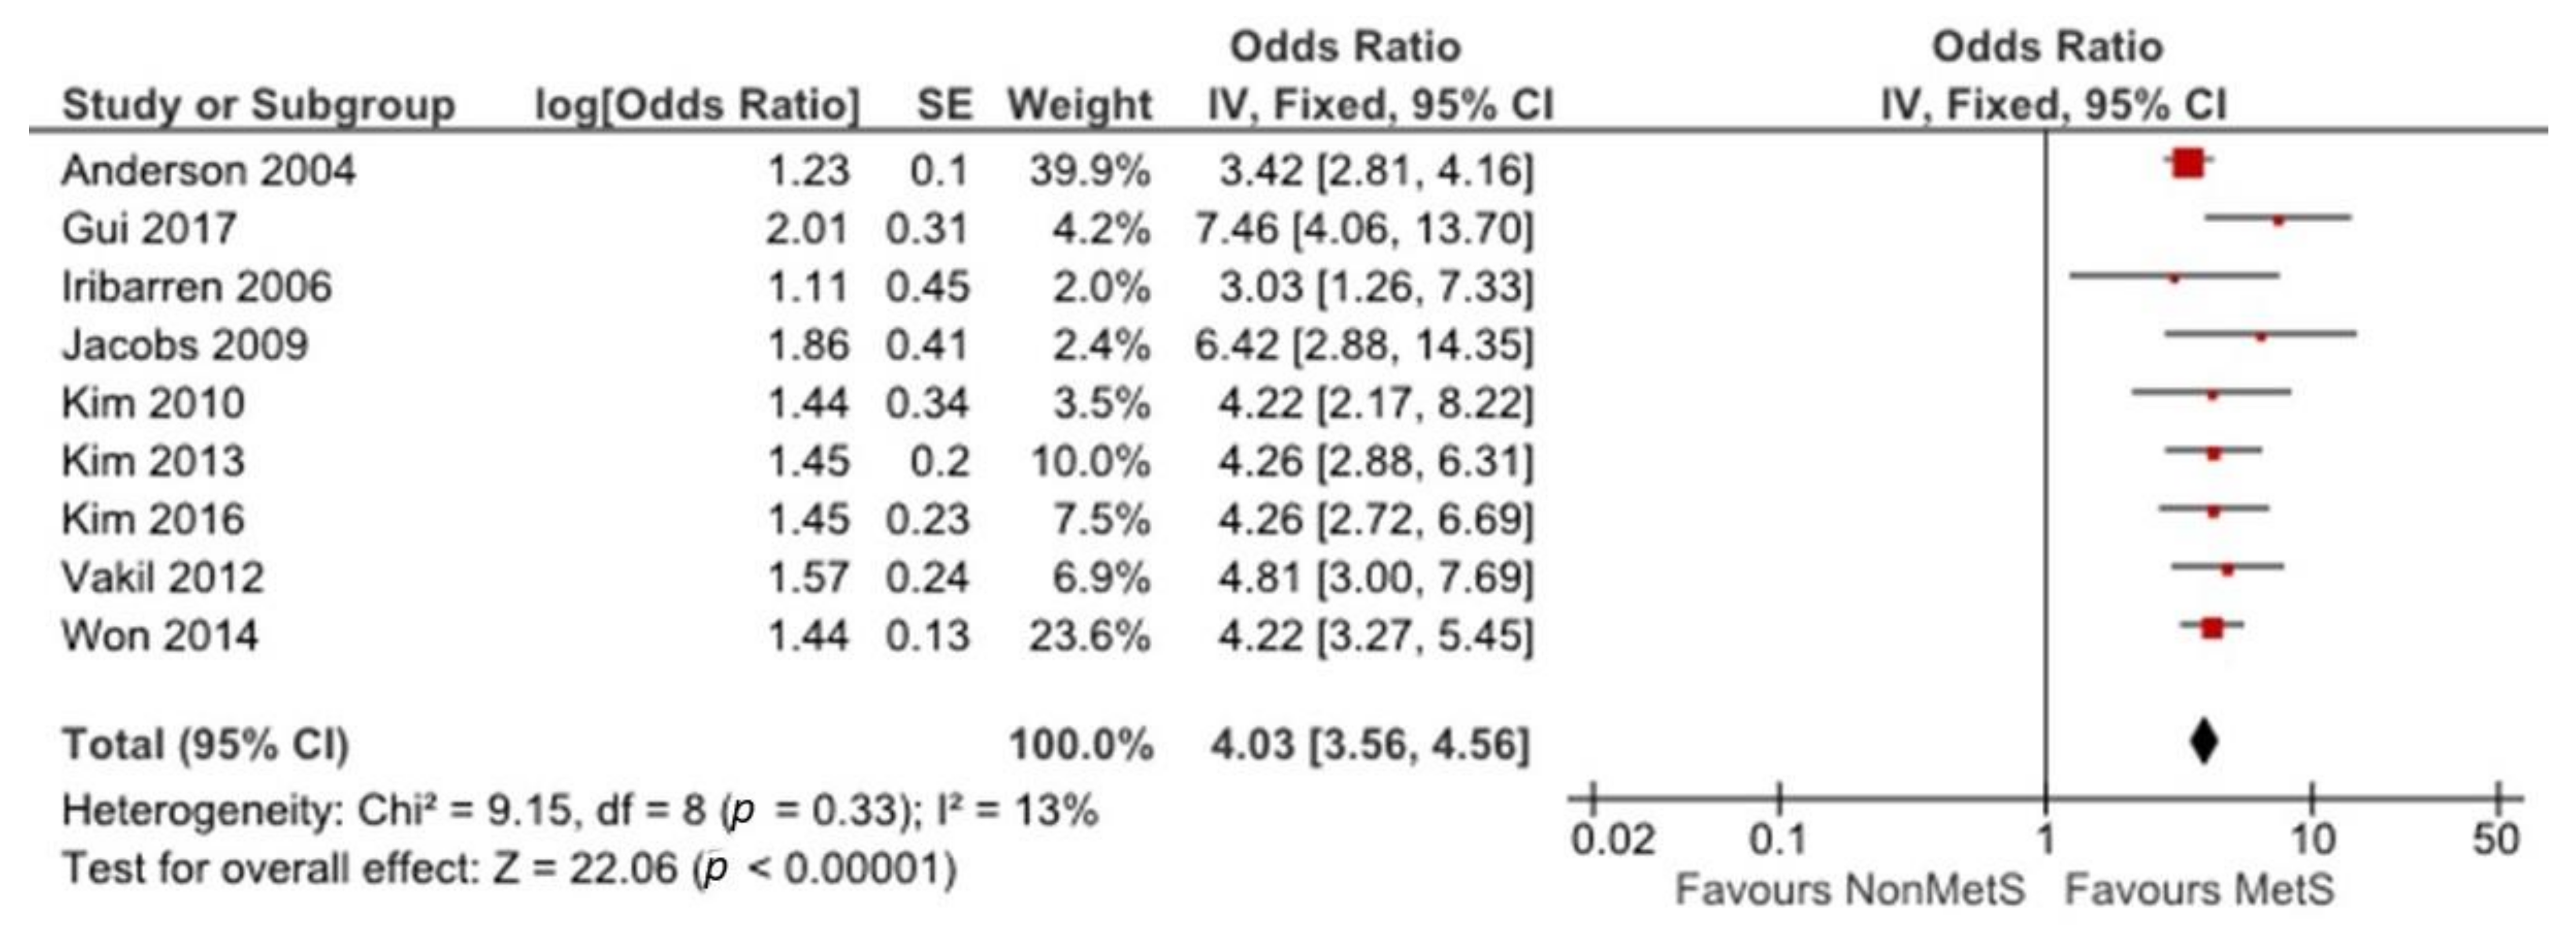
3.2. Association between MetS and CAD
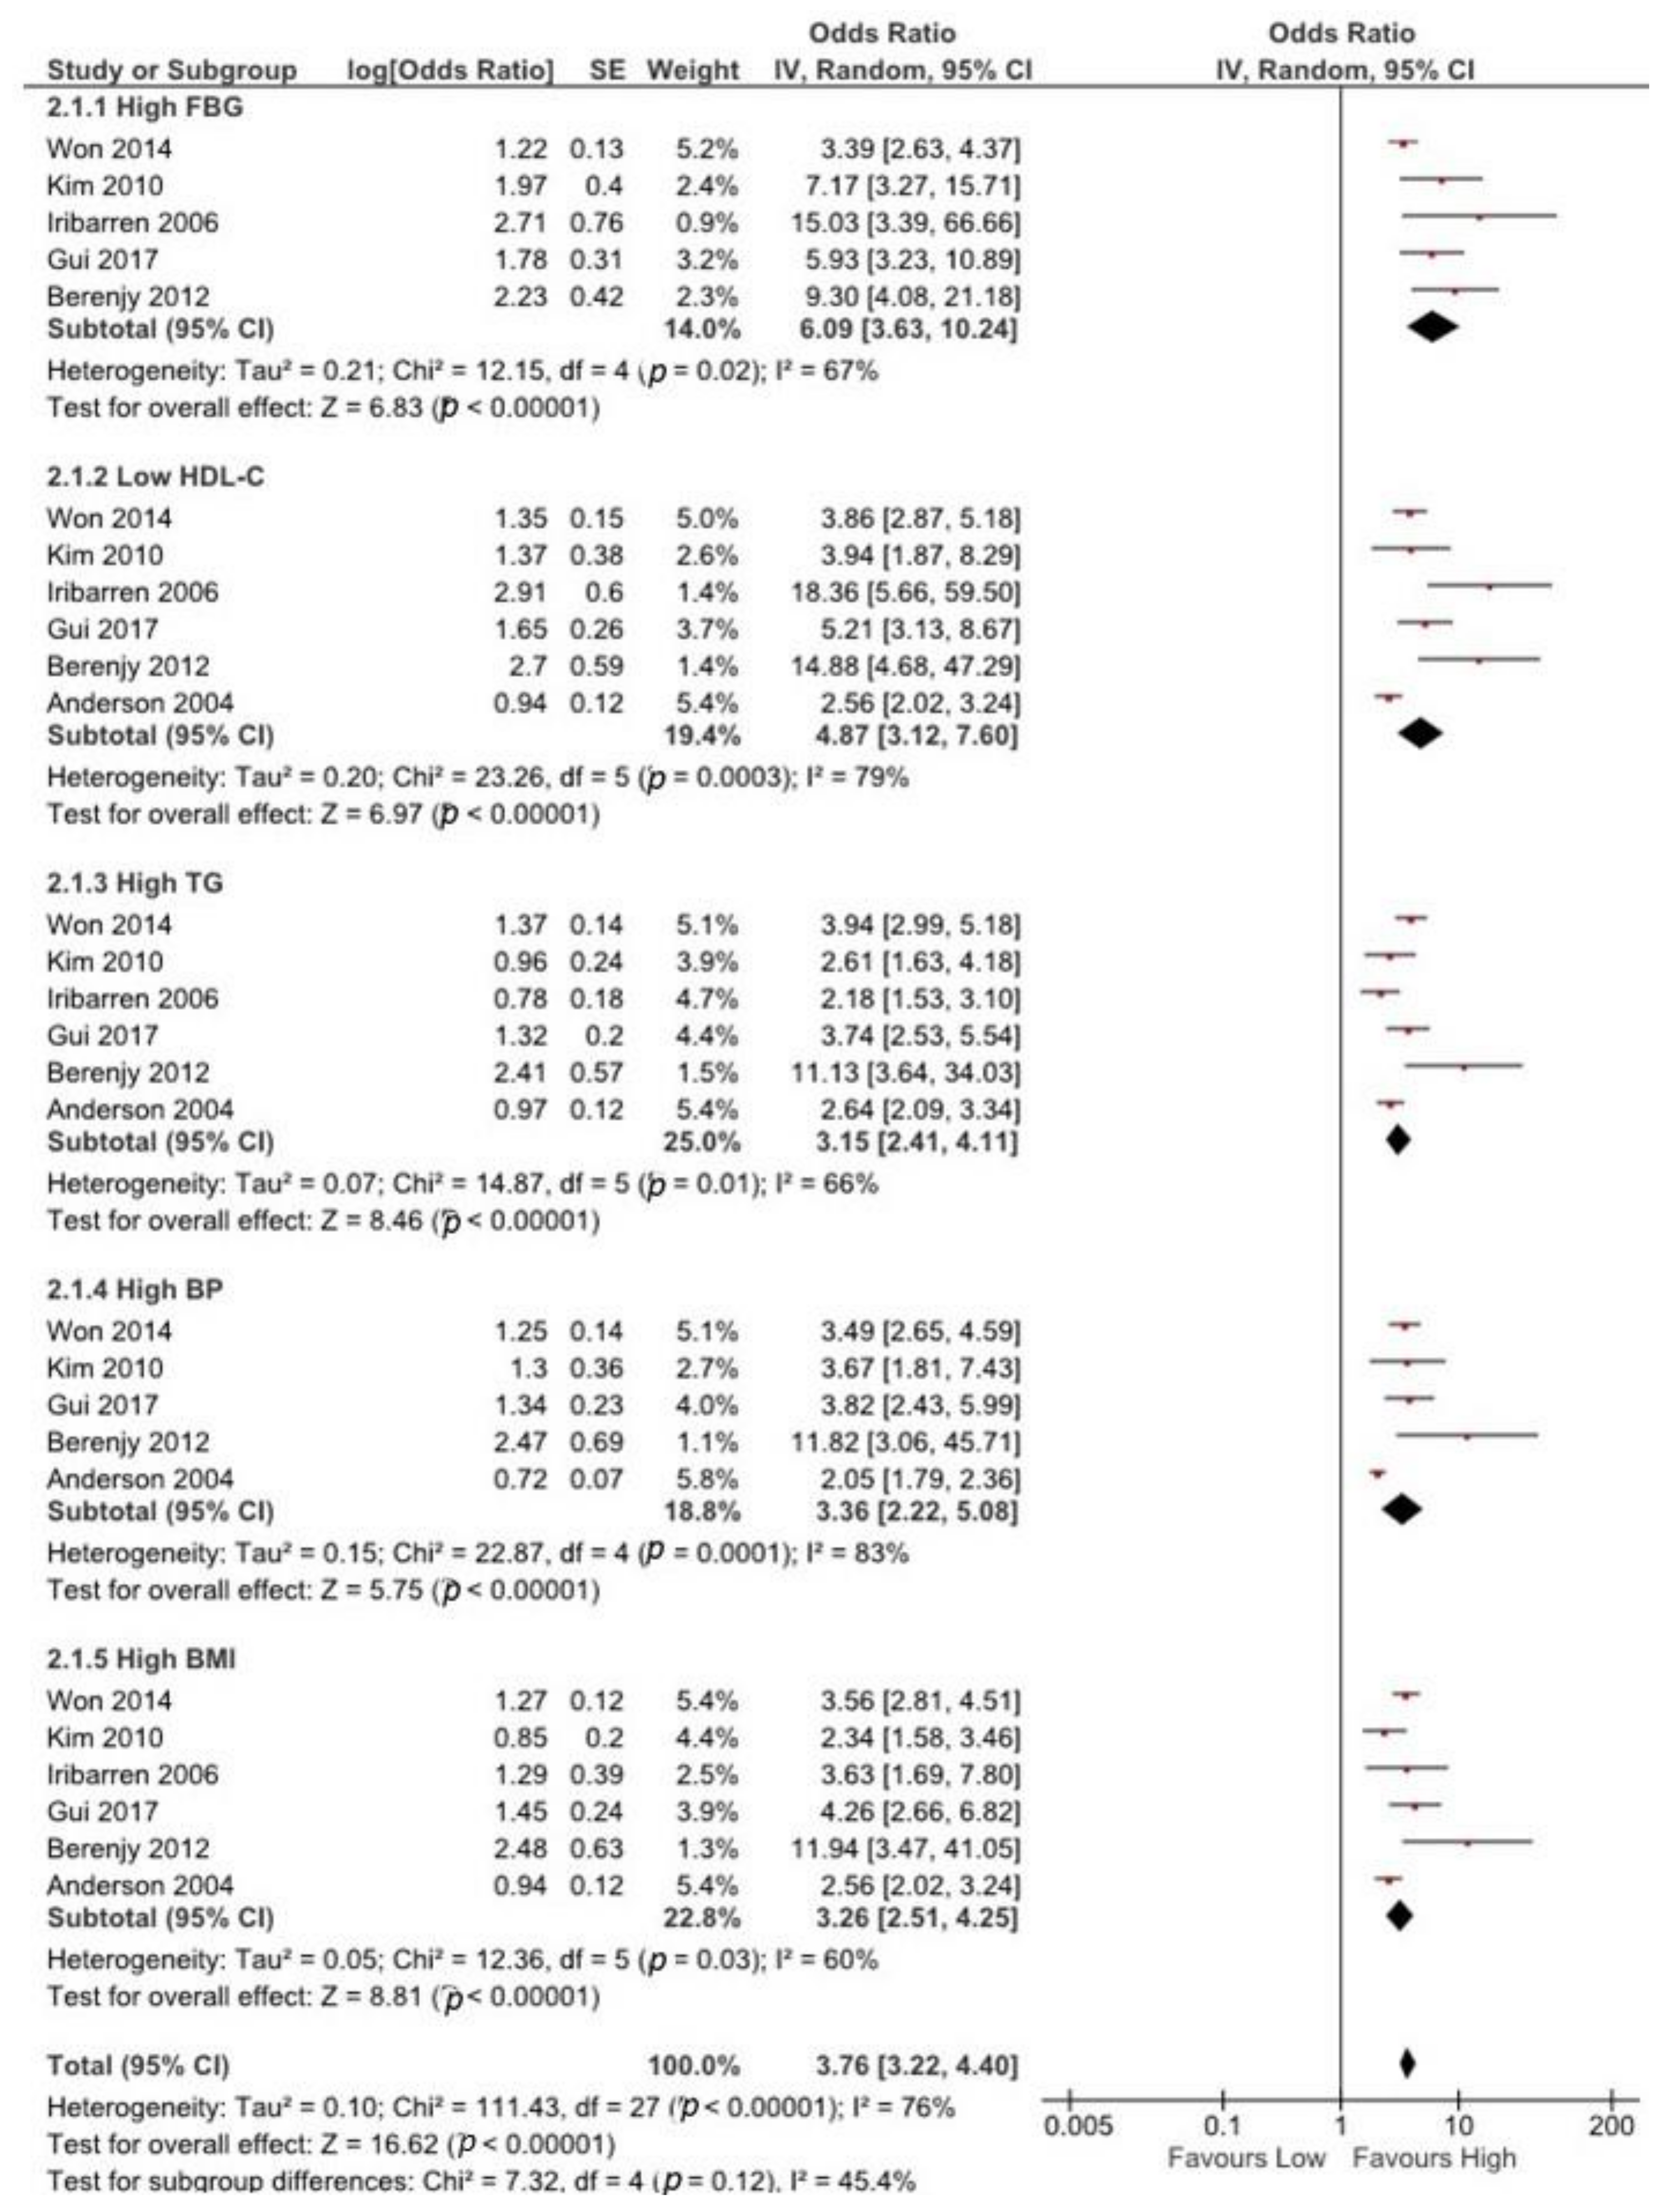
3.3. Association between Any MetS Component and CAD
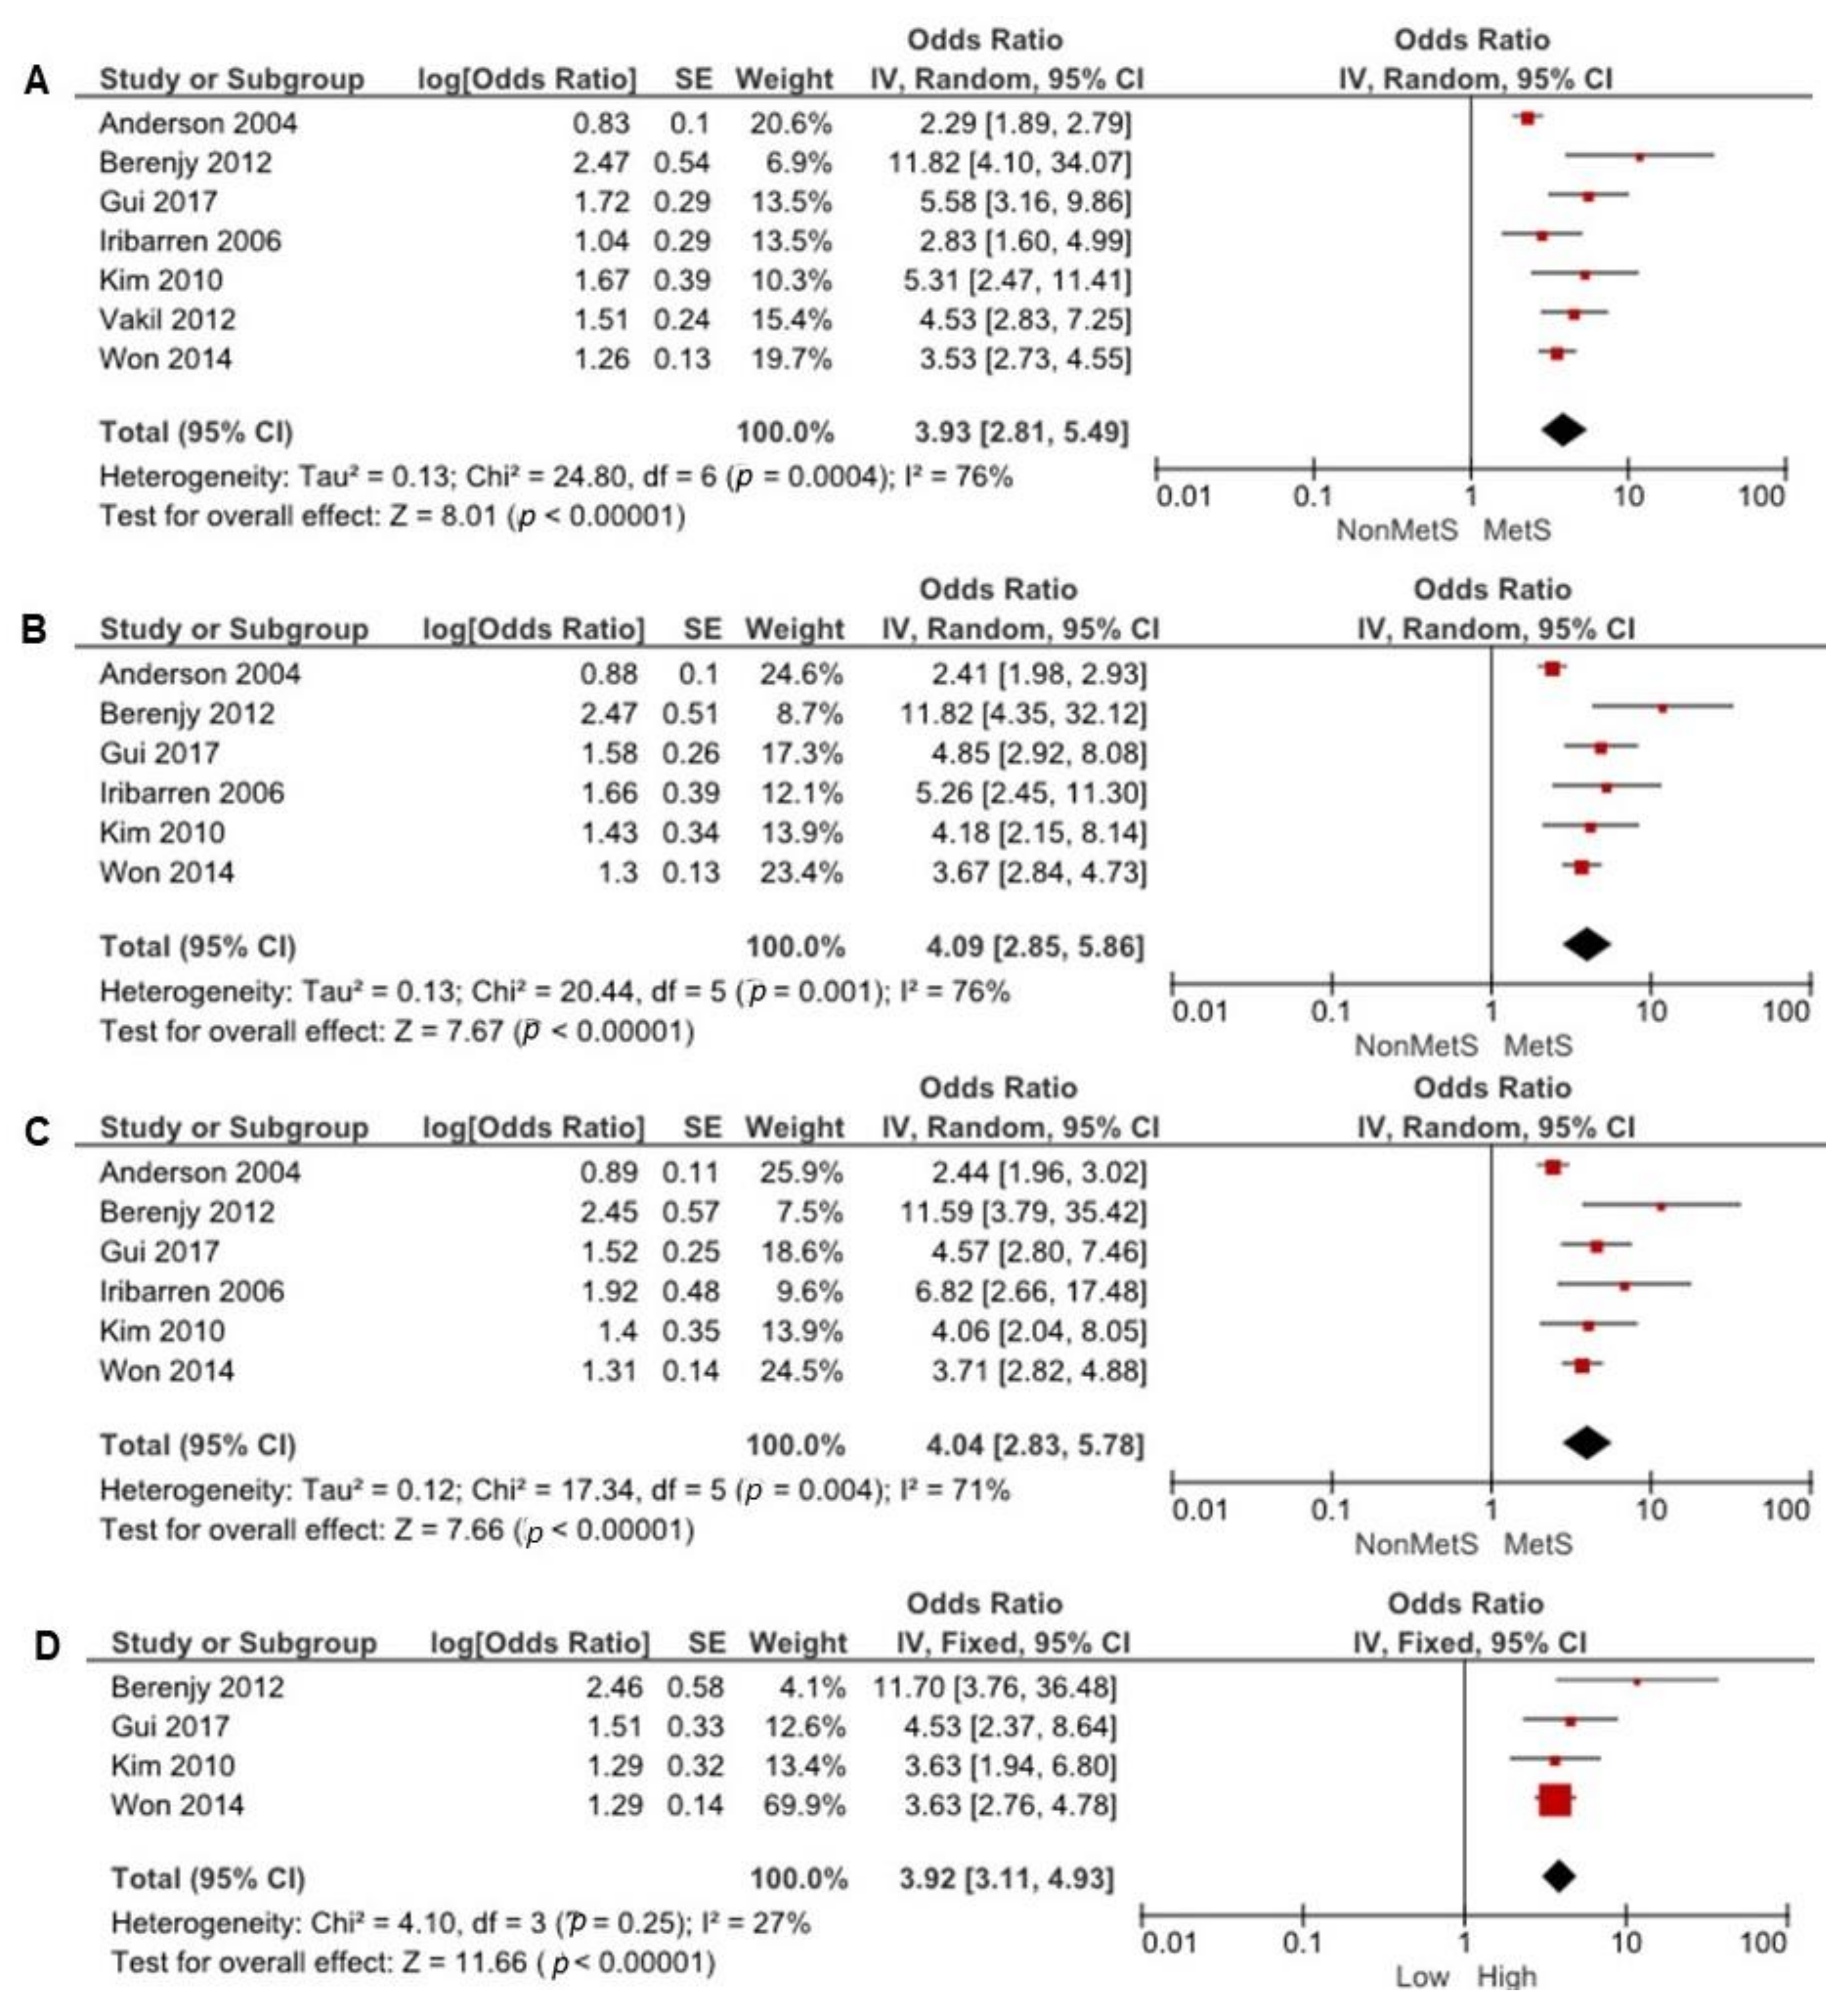
3.4. Association between Multiple MetS Components and CAD
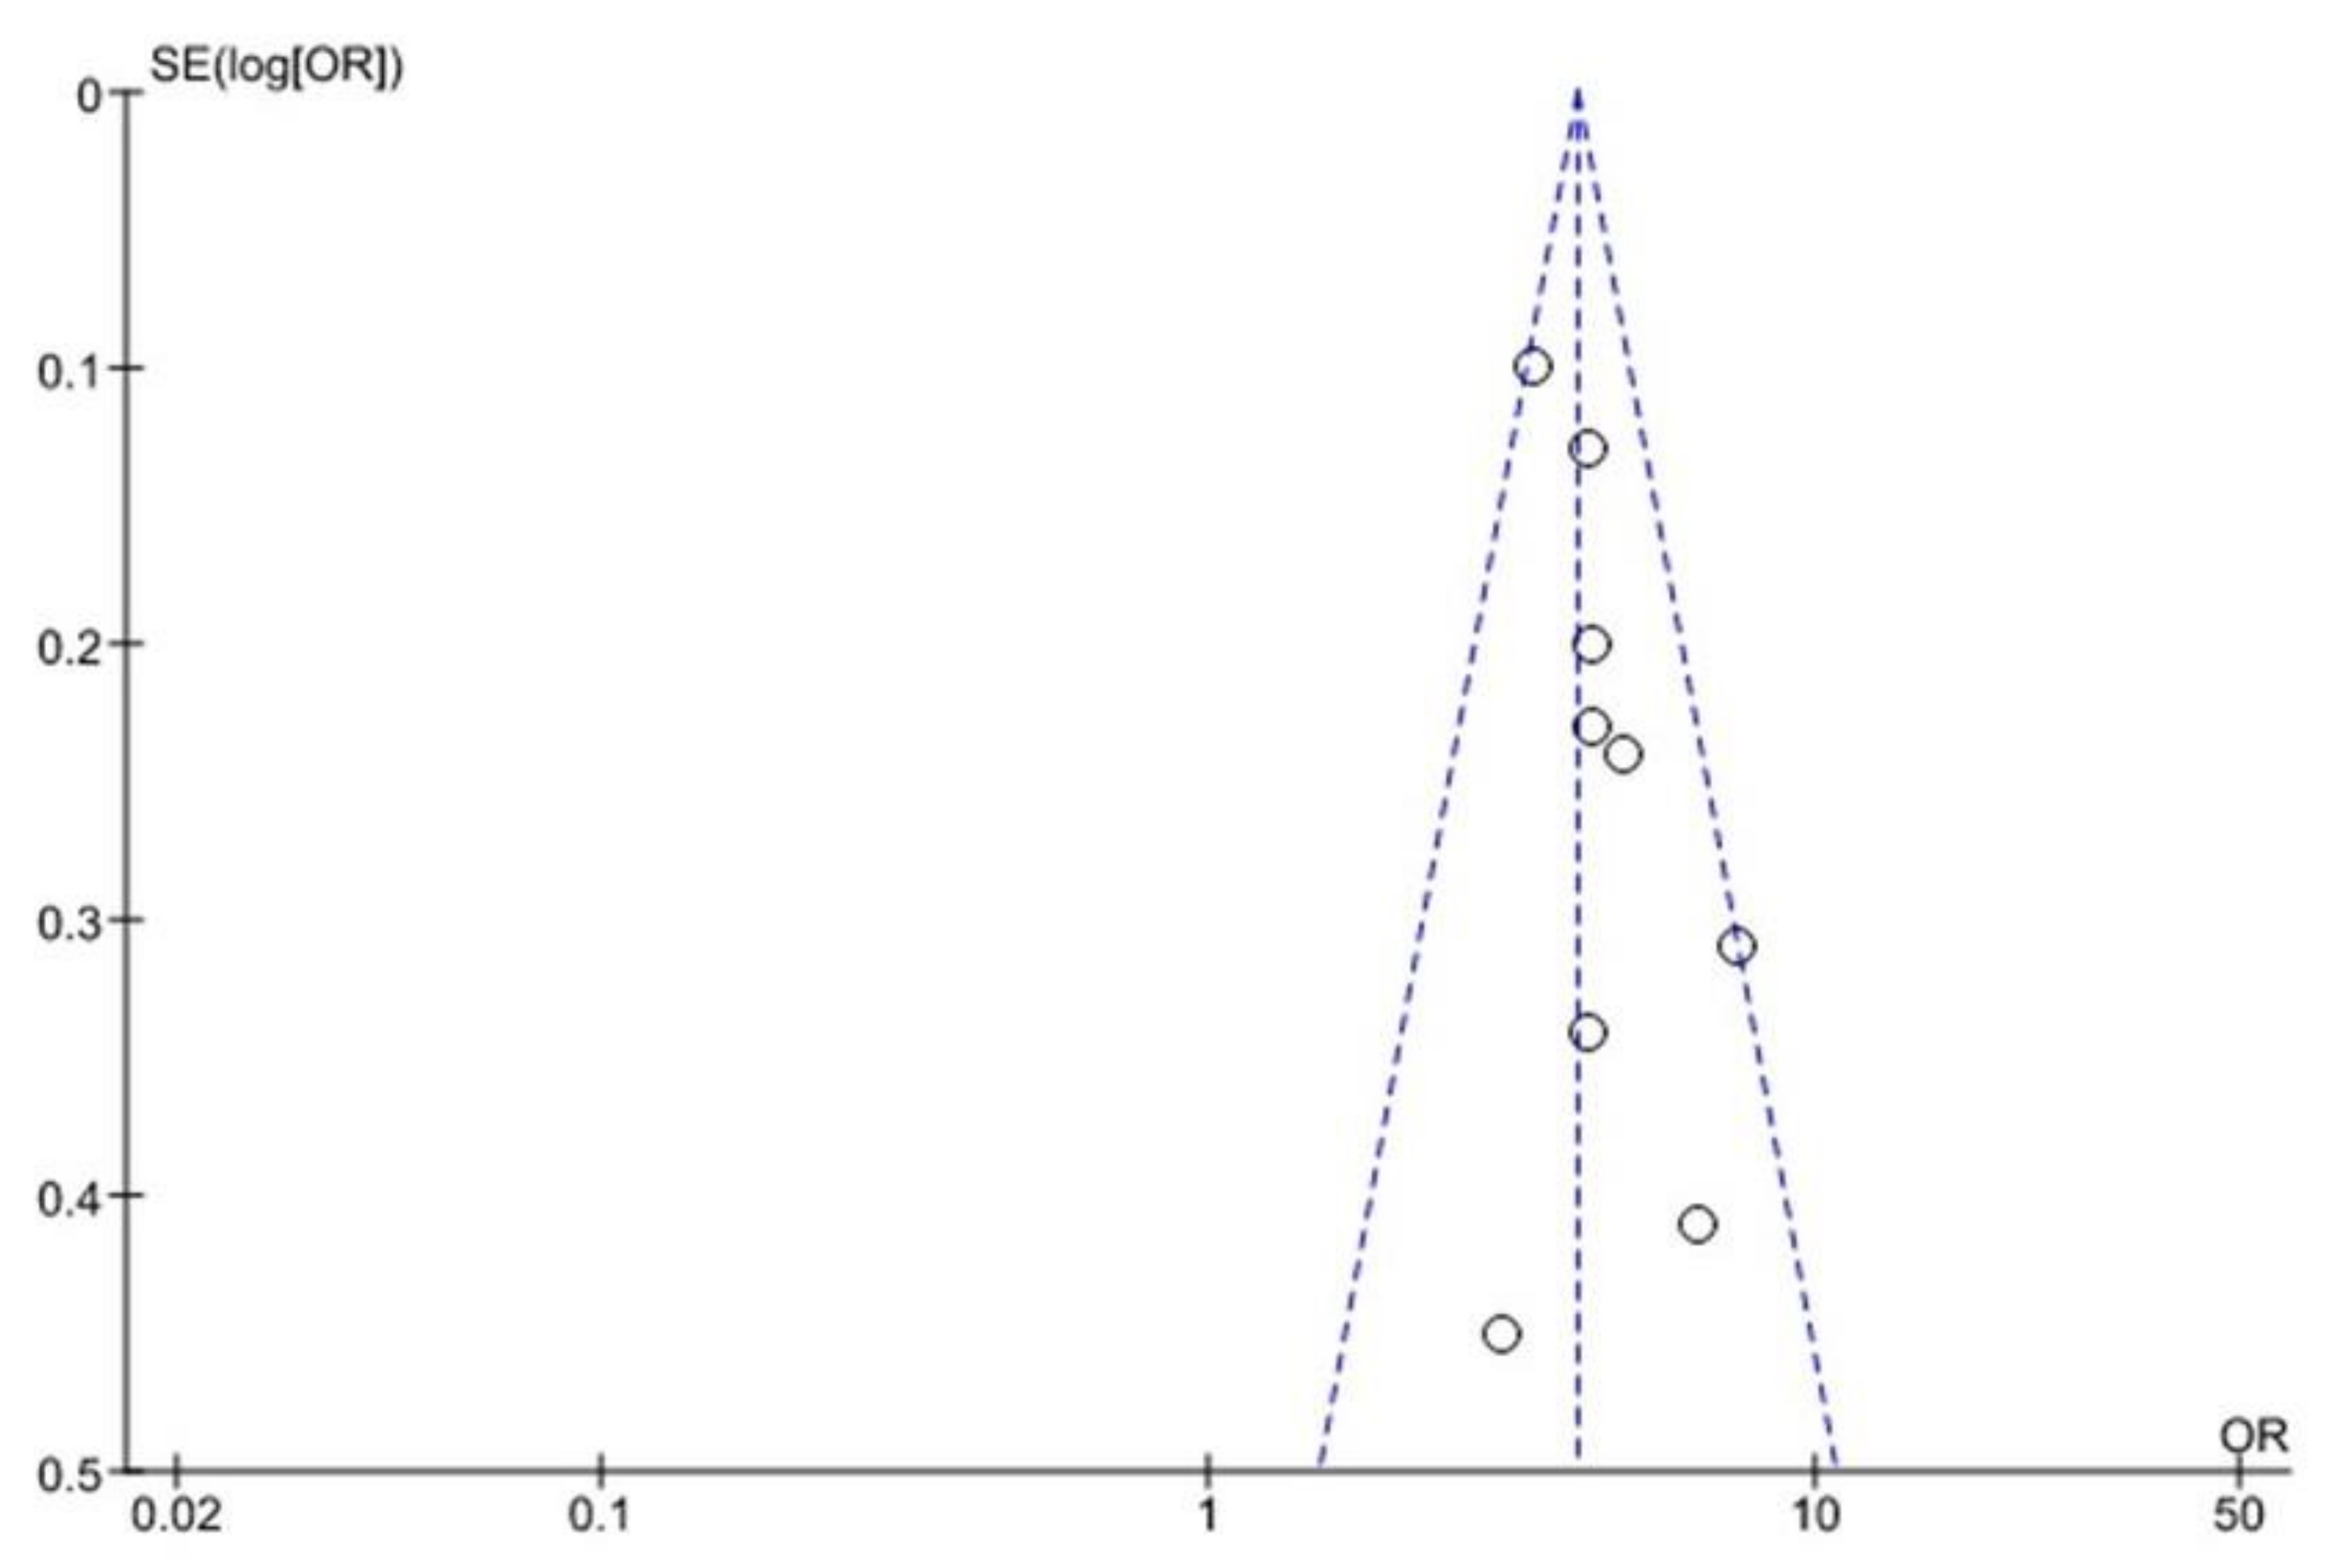
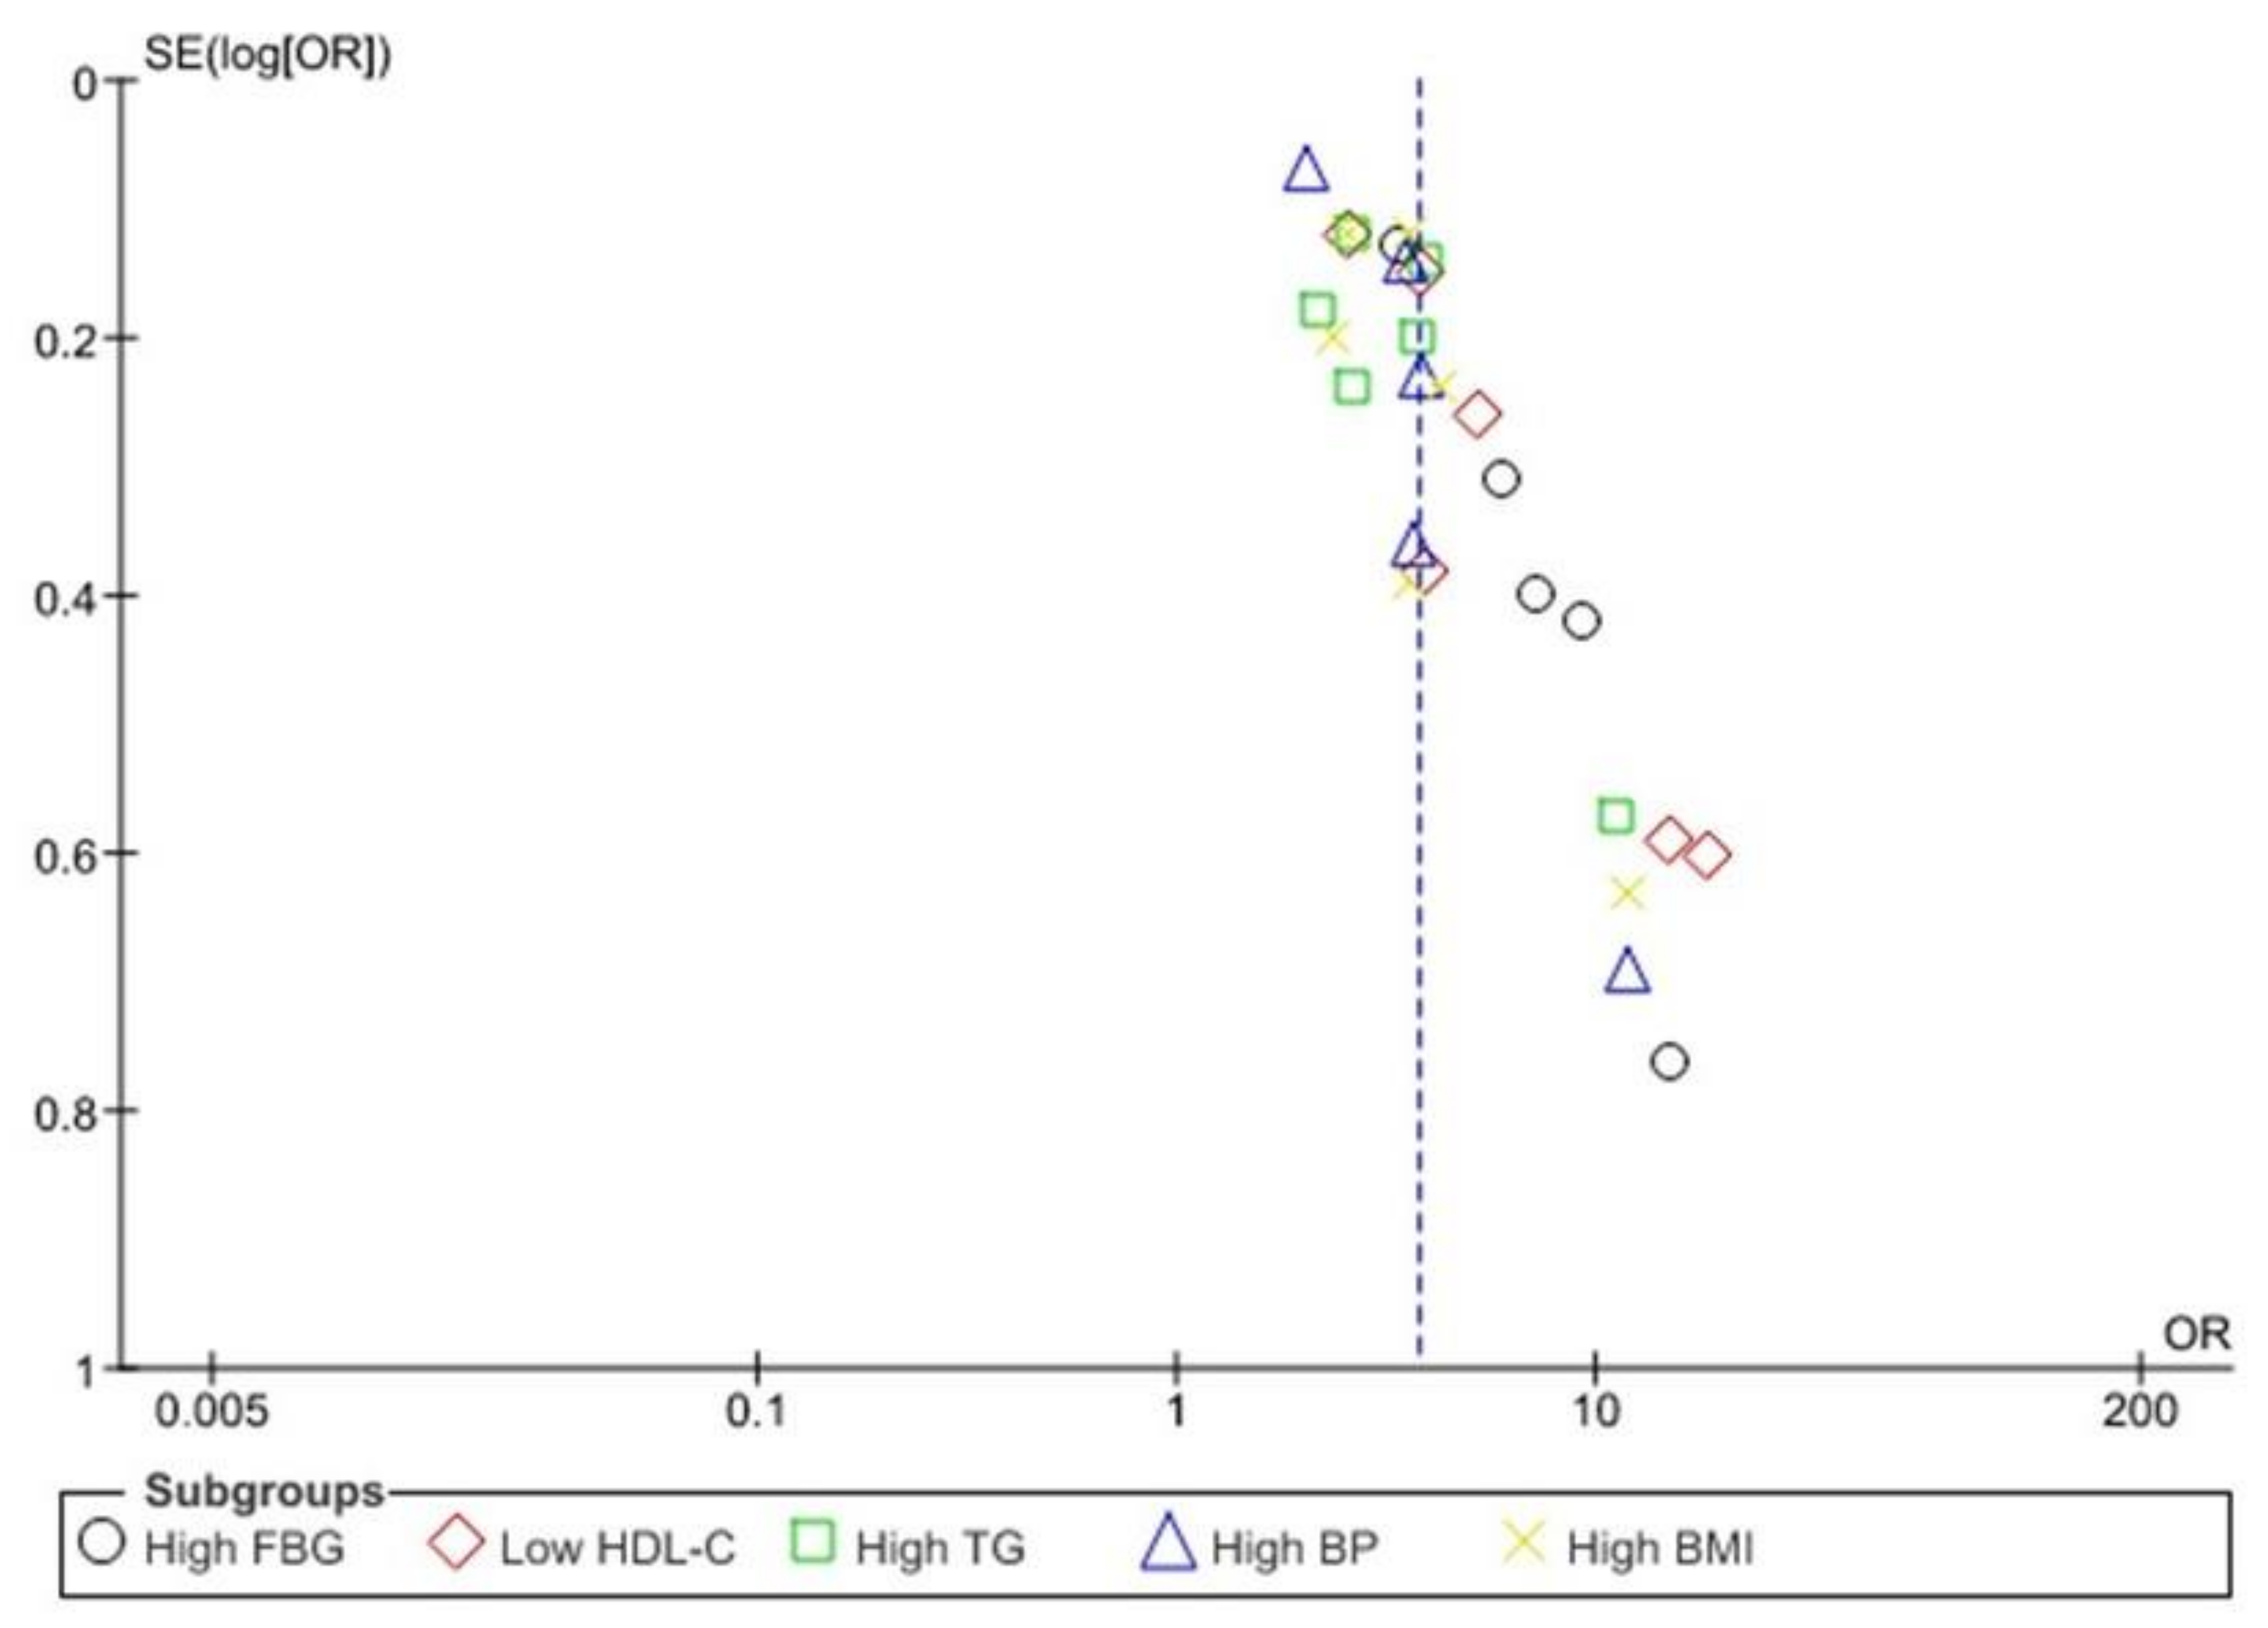
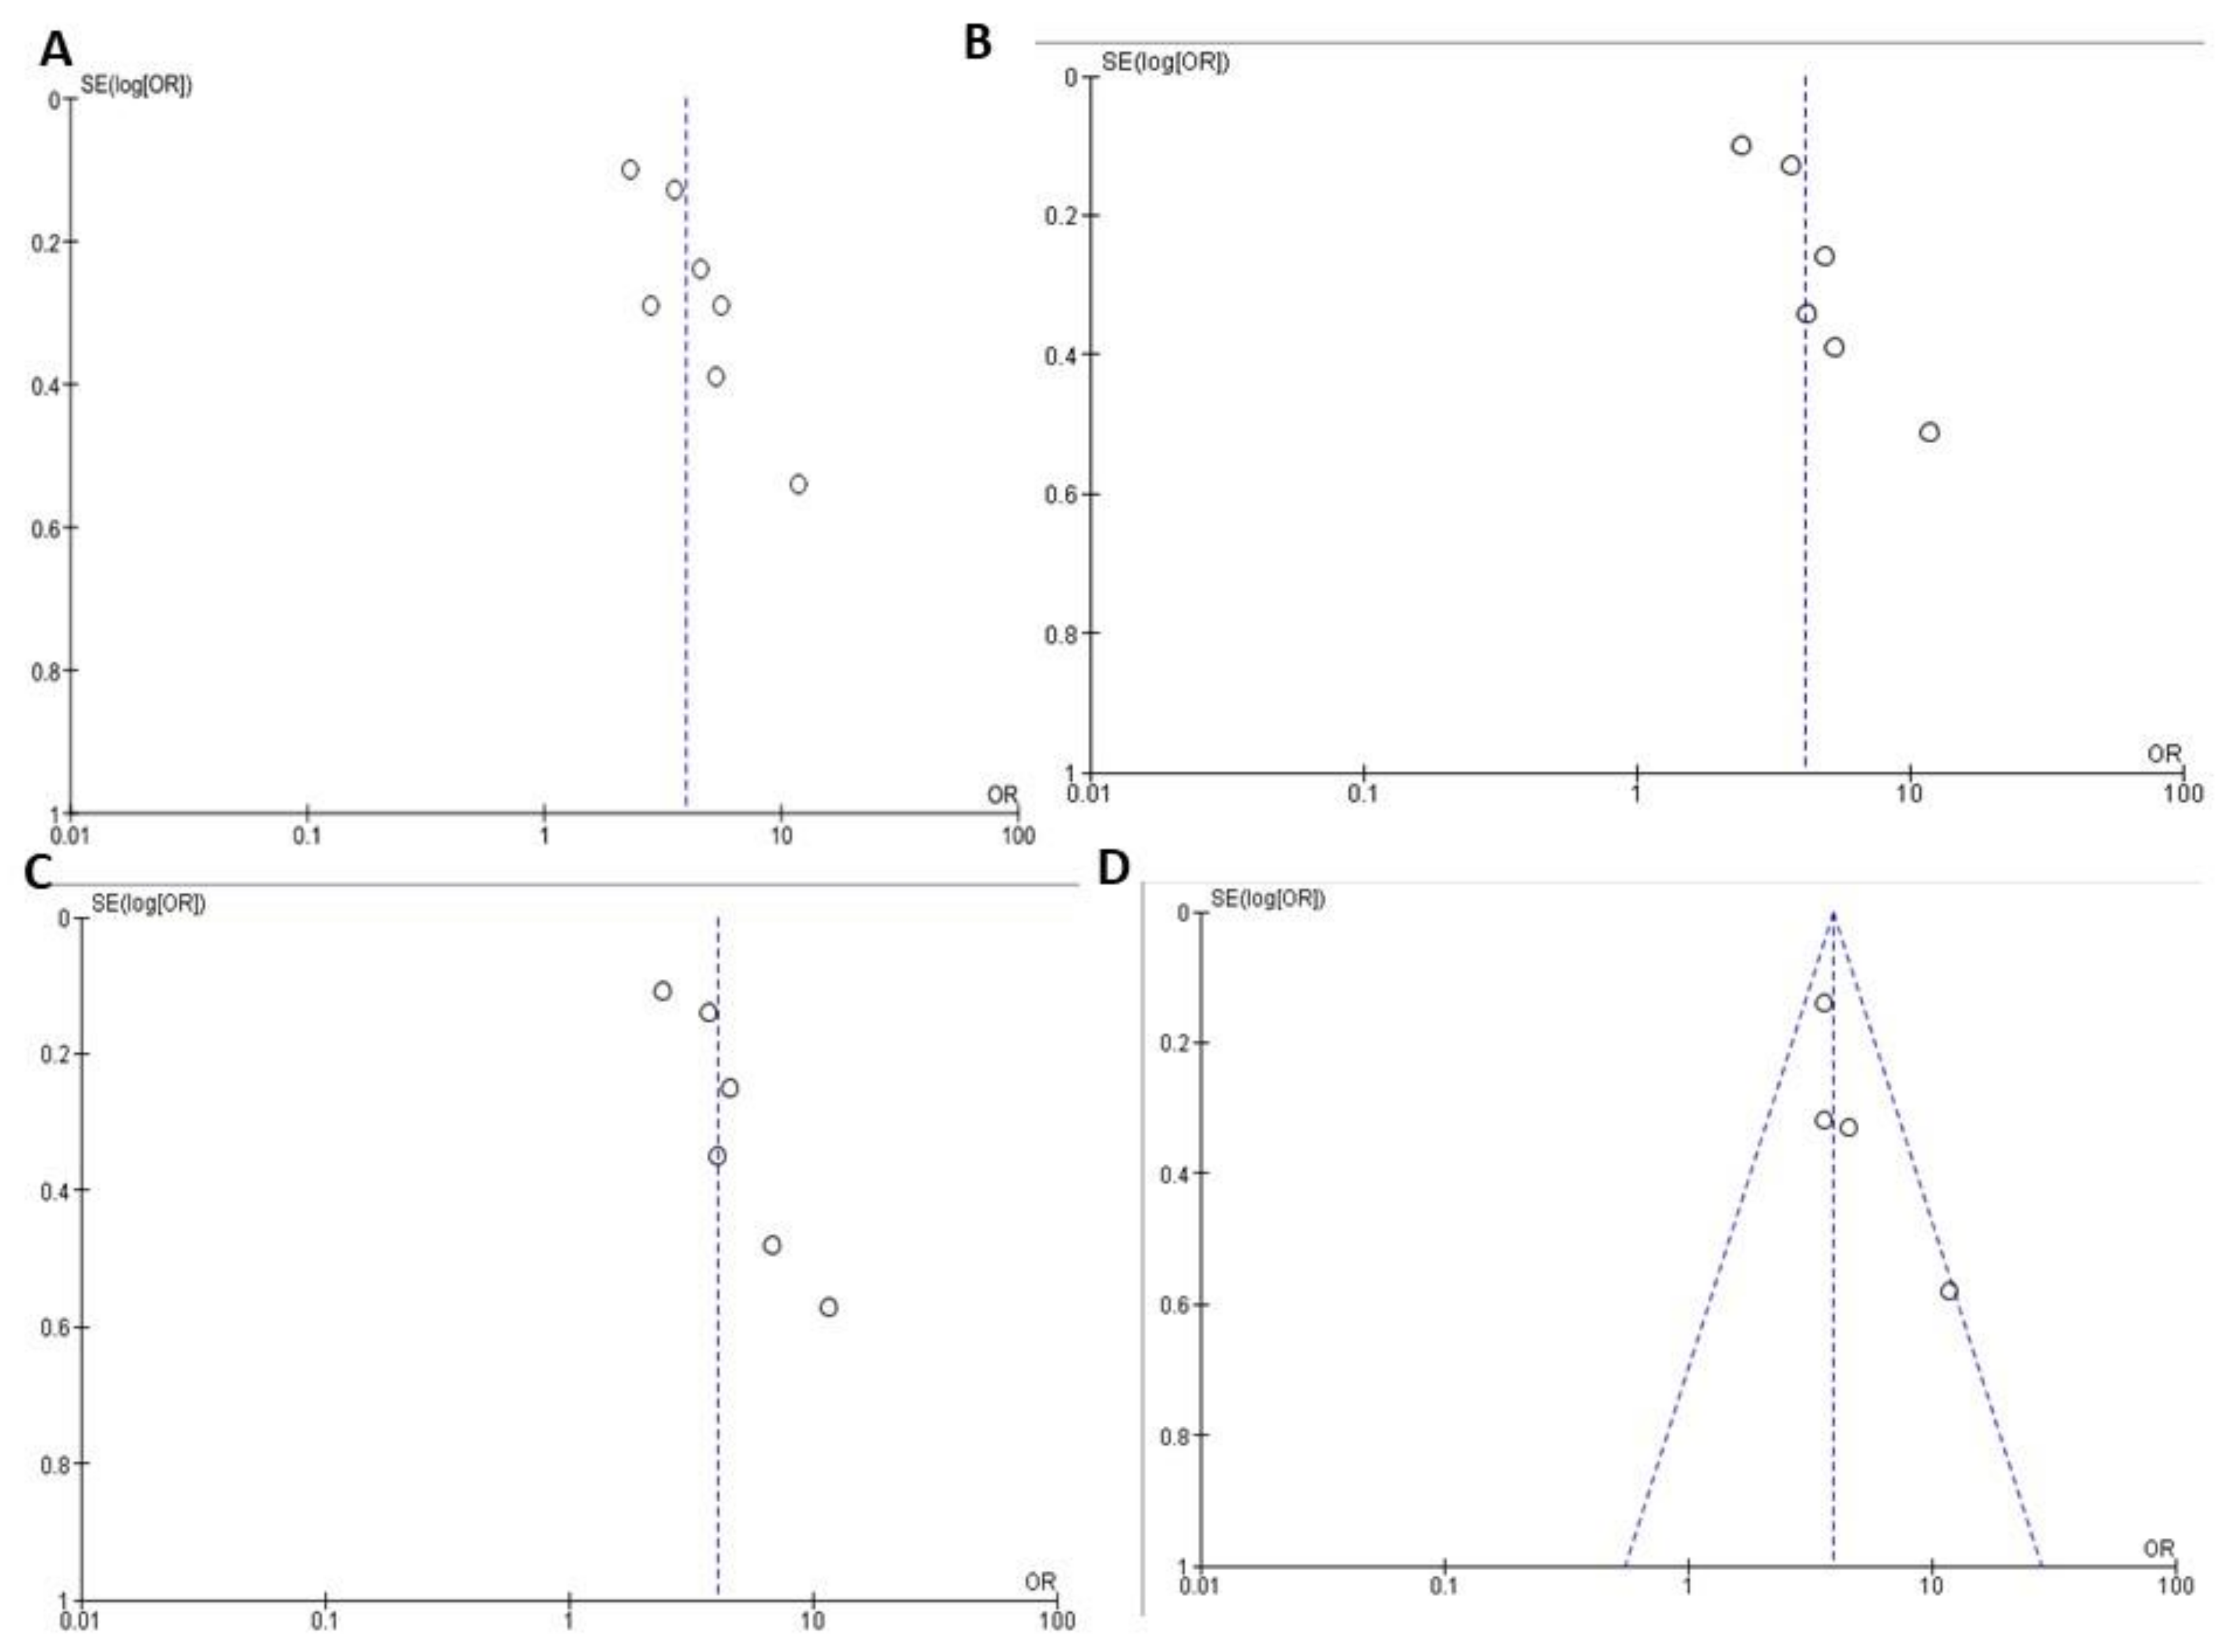
3.5. Funnel Plot Analysis
4. Discussion
5. Conclusions
Author Contributions
Funding
Institutional Review Board Statement
Informed Consent Statement
Data Availability Statement
Conflicts of Interest
References
- Saklayen, M.G. The global epidemic of the metabolic syndrome. Curr. Hypertens. Rep. 2018, 20, 12. [Google Scholar] [CrossRef] [Green Version]
- Ansarimoghaddam, A.; Adineh, H.A.; Zareban, I.; Iranpour, S.; HosseinZadeh, A.; Kh, F. Prevalence of metabolic syndrome in Middle-East countries: Meta-analysis of cross-sectional studies. Diabetes Metab. Syndr. Clin. Res. Rev. 2018, 12, 195–201. [Google Scholar] [CrossRef] [PubMed]
- Alberti, K.; Eckel, R.H.; Grundy, S.M.; Zimmet, P.Z.; Cleeman, J.I.; Donato, K.A.; Fruchart, J.-C.; James, W.P.T.; Loria, C.M.; Smith, S.C., Jr. Harmonizing the metabolic syndrome: A joint interim statement of the international diabetes federation task force on epidemiology and prevention; national heart, lung, and blood institute; American heart association; world heart federation; international atherosclerosis society; and international association for the study of obesity. Circulation 2009, 120, 1640–1645. [Google Scholar]
- Eckel, R.H.; Grundy, S.M.; Zimmet, P.Z. The metabolic syndrome. Lancet 2005, 365, 1415–1428. [Google Scholar] [CrossRef]
- Saely, C.; Rein, P.; Drexel, H. The metabolic syndrome and risk of cardiovascular disease and diabetes: Experiences with the new diagnostic criteria from the International Diabetes Federation. Horm. Metab. Res. 2007, 39, 642–650. [Google Scholar] [CrossRef] [PubMed]
- Hirode, G.; Wong, R.J. Trends in the prevalence of metabolic syndrome in the United States, 2011–2016. Jama 2020, 323, 2526–2528. [Google Scholar] [CrossRef]
- Tørris, C.; Bjørnnes, A.K. Duration of Lactation and Maternal Risk of Metabolic Syndrome: A Systematic Review and Meta-Analysis. Nutrients 2020, 12, 2718. [Google Scholar] [CrossRef] [PubMed]
- Zhao, P.; Xia, N.; Zhang, H.; Deng, T. The Metabolic Syndrome Is a Risk Factor for Breast Cancer: A Systematic Review and Meta-Analysis. Obes. Facts 2020, 13, 384–396. [Google Scholar] [CrossRef]
- Mariani, M.; Sassano, M.; Boccia, S. Metabolic syndrome and gastric cancer risk: A systematic review and meta-analysis. Eur. J. Cancer Prev. 2020. [Google Scholar] [CrossRef]
- Cameron, A.J.; Shaw, J.E.; Zimmet, P.Z. The metabolic syndrome: Prevalence in worldwide populations. Endocrinol. Metab. Clin. 2004, 33, 351–375. [Google Scholar] [CrossRef]
- Rocha, E. Metabolic syndrome and cardiovascular risk. Rev. Port. De Cardiol. 2019, 38, 333–335. [Google Scholar] [CrossRef] [PubMed]
- Climent, B.; Santiago, E.; Sánchez, A.; Muñoz-Picos, M.; Pérez–Vizcaíno, F.; García-Sacristán, A.; Rivera, L.; Prieto, D. Metabolic syndrome inhibits store-operated Ca2+ entry and calcium-induced calcium-release mechanism in coronary artery smooth muscle. Biochem. Pharmacol. 2020, 114222. [Google Scholar] [CrossRef] [PubMed]
- Montazerifar, F.; Bolouri, A.; Mozaffar, M.M.; Karajibani, M. The prevalence of metabolic syndrome in coronary artery disease patients. Cardiol. Res. 2016, 7, 202. [Google Scholar] [CrossRef] [Green Version]
- Mahalle, N.; Garg, M.; Naik, S.S.; Kulkarni, M.V. Association of metabolic syndrome with severity of coronary artery disease. Indian J. Endocrinol. Metab. 2014, 18, 708. [Google Scholar] [PubMed]
- Neeb, Z.P.; Edwards, J.M.; Alloosh, M.; Long, X.; Mokelke, E.A.; Sturek, M. Metabolic syndrome and coronary artery disease in Ossabaw compared with Yucatan swine. Comp. Med. 2010, 60, 300–315. [Google Scholar] [PubMed]
- Stroup, D.F.; Berlin, J.A.; Morton, S.C.; Olkin, I.; Williamson, G.D.; Rennie, D.; Moher, D.; Becker, B.J.; Sipe, T.A.; Thacker, S.B. Meta-analysis of observational studies in epidemiology: A proposal for reporting. Jama 2000, 283, 2008–2012. [Google Scholar] [CrossRef]
- Higgins, J.; Green, S. Cochrane handbook for systematic reviews of interventions. Version 5.1. The Cochrane Collaboration. 2011. Available online: https://handbook-5-1.cochrane.org/ (accessed on 20 August 2020).
- Tillin, T.; Forouhi, N.; Johnston, D.; McKeigue, P.; Chaturvedi, N.; Godsland, I. Metabolic syndrome and coronary heart disease in South Asians, African-Caribbeans and white Europeans: A UK population-based cross-sectional study. Diabetologia 2005, 48, 649–656. [Google Scholar] [CrossRef] [Green Version]
- Fox, K.A.; Metra, M.; Morais, J.; Atar, D. The myth of ‘stable’coronary artery disease. Nat. Rev. Cardiol. 2020, 17, 9–21. [Google Scholar] [CrossRef] [PubMed]
- Mendis, S.; Puska, P.; Norrving, B. World Atlas on Cardiovascular Disease Prevention and Control; Mendis, S., Puska, P., Norrving, B., Eds.; World Health Organization: Geneva, Switzerland, 2013; pp. 1–163. [Google Scholar]
- Members, W.G.; Lloyd-Jones, D.; Adams, R.J.; Brown, T.M.; Carnethon, M.; Dai, S.; De Simone, G.; Ferguson, T.B.; Ford, E.; Furie, K. 22. Glossary. Circulation 2010, 121, e46–e215. [Google Scholar]
- Anderson, J.L.; Horne, B.D.; Jones, H.U.; Reyna, S.P.; Carlquist, J.F.; Bair, T.L.; Pearson, R.R.; Lappé, D.L.; Muhlestein, J.B. Which features of the metabolic syndrome predict the prevalence and clinical outcomes of angiographic coronary artery disease? Cardiology 2004, 101, 185–193. [Google Scholar] [CrossRef]
- Kim, L.K.; Yoon, J.W.; Lee, D.-H.; Kim, K.M.; Choi, S.H.; Park, K.S.; Jang, H.C.; Kim, M.-K.; Park, H.E.; Choi, S.-Y. Impact of metabolic syndrome on the progression of coronary calcium and of coronary artery disease assessed by repeated cardiac computed tomography scans. Cardiovasc. Diabetol. 2016, 15, 92. [Google Scholar] [CrossRef] [PubMed] [Green Version]
- Iribarren, C.; Go, A.S.; Husson, G.; Sidney, S.; Fair, J.M.; Quertermous, T.; Hlatky, M.A.; Fortmann, S.P. Metabolic syndrome and early-onset coronary artery disease: Is the whole greater than its parts? J. Am. Coll. Cardiol. 2006, 48, 1800–1807. [Google Scholar] [CrossRef] [PubMed] [Green Version]
- Gui, M.-H.; Ling, Y.; Liu, L.; Jiang, J.-J.; Li, X.-Y.; Gao, X. Effect of metabolic syndrome score, metabolic syndrome, and its individual components on the prevalence and severity of angiographic coronary artery disease. Chin. Med J. 2017, 130, 669. [Google Scholar] [CrossRef] [PubMed]
- Won, K.-B.; Chang, H.-J.; Sung, J.; Shin, S.; Cho, I.-J.; Shim, C.-Y.; Hong, G.-R.; Kim, Y.J.; Choi, B.-W.; Chung, N. Differential association between metabolic syndrome and coronary artery disease evaluated with cardiac computed tomography according to the presence of diabetes in a symptomatic Korean population. BMC Cardiovasc. Disord. 2014, 14, 105. [Google Scholar] [CrossRef] [PubMed] [Green Version]
- Kim, J.-Y.; Choi, E.-Y.; Mun, H.-S.; Min, P.-K.; Yoon, Y.-W.; Lee, B.K.; Hong, B.-K.; Rim, S.-J.; Kwon, H.M. Usefulness of metabolic syndrome score in the prediction of angiographic coronary artery disease severity according to the presence of diabetes mellitus: Relation with inflammatory markers and adipokines. Cardiovasc. Diabetol. 2013, 12, 140. [Google Scholar] [CrossRef] [PubMed] [Green Version]
- Kim, J.-Y.; Mun, H.-S.; Lee, B.K.; Yoon, S.B.; Choi, E.-Y.; Min, P.-K.; Yoon, Y.-W.; Hong, B.-K.; Rim, S.-J.; Kwon, H.M. Impact of metabolic syndrome and its individual components on the presence and severity of angiographic coronary artery disease. Yonsei Med. J. 2010, 51, 676–682. [Google Scholar] [CrossRef]
- Jacobs, M.; Van Greevenbroek, M.; Van Der Kallen, C.; Ferreira, I.; Blaak, E.; Feskens, E.; Jansen, E.; Schalkwijk, C.; Stehouwer, C. Low-grade inflammation can partly explain the association between the metabolic syndrome and either coronary artery disease or severity of peripheral arterial disease: The CODAM study. Eur. J. Clin. Investig. 2009, 39, 437–444. [Google Scholar] [CrossRef]
- Berenjy, S.; Rahmat, A.B.; Yassin, Z.B.; Sann, L.M.; Sahebjamee, F.; Hanachi, P. Metabolic syndrome and risk of Coronary Artery Disease in west of Iran. Life Sci. J. 2012, 9, 706–717. [Google Scholar]
- Vakil, K.P.; Malhotra, S.; Sawada, S.; Campbell, S.R.; Sayfo, S.; Kamalesh, M. Waist circumference and metabolic syndrome: The risk for silent coronary artery disease in males. Metab. Syndr. Relat. Disord. 2012, 10, 225–231. [Google Scholar] [CrossRef]
- Sterne, J.A.; Harbord, R.M. Funnel plots in meta-analysis. Stata J. 2004, 4, 127–141. [Google Scholar] [CrossRef] [Green Version]
- Alderson, P.; Green, S.; Higgins, J.P.T. Cochrane Reviewers’ Handbook 4.2.2 [updated March 2004]. Available online: http://www.cochrane.org/resources/handbook/hbook.htm (accessed on 20 August 2020).
- Maloberti, A.; Bruno, R.; Facchetti, R.; Grassi, G.; Taddei, S.; Ghiadoni, L.; Giannattasio, C. THE role of metabolic syndrome in blood pressure control and pulse wave velocity progression over a 3.5 years in treated hypertensive PATIENTS. Eur. J. Intern. Med. 2020, 76, 107–109. [Google Scholar] [CrossRef]
- McNamara, A. Metabolic syndrome. InnovAiT 2019, 12, 582–588. [Google Scholar] [CrossRef]
- Galassi, A.; Reynolds, K.; He, J. Metabolic syndrome and risk of cardiovascular disease: A meta-analysis. Am. J. Med. 2006, 119, 812–819. [Google Scholar] [CrossRef]
- Mottillo, S.; Filion, K.B.; Genest, J.; Joseph, L.; Pilote, L.; Poirier, P.; Rinfret, S.; Schiffrin, E.L.; Eisenberg, M.J. The metabolic syndrome and cardiovascular risk: A systematic review and meta-analysis. J. Am. Coll. Cardiol. 2010, 56, 1113–1132. [Google Scholar] [CrossRef] [Green Version]
- Li, X.; Li, X.; Lin, H.; Fu, X.; Lin, W.; Li, M.; Zeng, X.; Gao, Q. Metabolic syndrome and stroke: A meta-analysis of prospective cohort studies. J. Clin. Neurosci. 2017, 40, 34–38. [Google Scholar] [CrossRef]
- Dimitriadis, K.; Tsioufis, C.; Mazaraki, A.; Liatakis, I.; Koutra, E.; Kordalis, A.; Kasiakogias, A.; Flessas, D.; Tentolouris, N.; Tousoulis, D. Waist circumference compared with other obesity parameters as determinants of coronary artery disease in essential hypertension: A 6-year follow-up study. Hypertens. Res. 2016, 39, 475–479. [Google Scholar] [CrossRef]
- Denardo, S.J.; Gong, Y.; Nichols, W.W.; Messerli, F.H.; Bavry, A.A.; Cooper-DeHoff, R.M.; Handberg, E.M.; Champion, A.; Pepine, C.J. Blood pressure and outcomes in very old hypertensive coronary artery disease patients: An INVEST substudy. Am. J. Med. 2010, 123, 719–726. [Google Scholar] [CrossRef] [PubMed] [Green Version]
- Lieb, W.; Jansen, H.; Loley, C.; Pencina, M.J.; Nelson, C.P.; Newton-Cheh, C.; Kathiresan, S.; Reilly, M.P.; Assimes, T.L.; Boerwinkle, E. Genetic predisposition to higher blood pressure increases coronary artery disease risk. Hypertension 2013, 61, 995–1001. [Google Scholar] [CrossRef]
- Cordero, A.; Moreno-Arribas, J.; Bertomeu-González, V.; Agudo, P.; Miralles, B.; Masiá, M.D.; López-Palop, R.; Bertomeu-Martínez, V. Low levels of high-density lipoproteins cholesterol are independently associated with acute coronary heart disease in patients hospitalized for chest pain. Rev. Española De Cardiol. (Engl. Ed. ) 2012, 65, 319–325. [Google Scholar] [CrossRef]
- Gotto, A.M., Jr. Low high-density lipoprotein cholesterol as a risk factor in coronary heart disease: A working group report. Circulation 2001, 103, 2213–2218. [Google Scholar] [CrossRef] [PubMed] [Green Version]
- Weverling-Rijnsburger, A.W.; Jonkers, I.J.; Van Exel, E.; Gussekloo, J.; Westendorp, R.G. High-density vs low-density lipoprotein cholesterol as the risk factor for coronary artery disease and stroke in old age. Arch. Intern. Med. 2003, 163, 1549–1554. [Google Scholar] [CrossRef] [Green Version]
- Harchaoui, K.; Visser, M.; Kastelein, J.; Stroes, E.; Dallinga-Thie, G. Triglycerides and cardiovascular risk. Curr. Cardiol. Rev. 2009, 5, 216–222. [Google Scholar] [CrossRef]
- Sarwar, N.; Danesh, J.; Eiriksdottir, G.; Sigurdsson, G.; Wareham, N.; Bingham, S. Triglycerides and the risk of coronary heart disease: 10,158 incident cases among 262,525 participants in 29 Western prospective studies. Circulation 2006, 115, 450–458. [Google Scholar] [CrossRef]
- Ding, D.; Qiu, J.; Li, X.; Li, D.; Xia, M.; Li, Z.; Su, D.; Wang, Y.; Zhang, Y.; Zhang, J. Hyperglycemia and mortality among patients with coronary artery disease. Diabetes Care 2014, 37, 546–554. [Google Scholar] [CrossRef] [PubMed] [Green Version]
- Nielson, C.; Lange, T.; Hadjokas, N. Blood glucose and coronary artery disease in nondiabetic patients. Diabetes Care 2006, 29, 998–1001. [Google Scholar] [CrossRef] [PubMed]
- Ahmadi, A.; Leipsic, J.; Feuchtner, G.; Gransar, H.; Kalra, D.; Heo, R.; Achenbach, S.; Andreini, D.; Al-Mallah, M.; Berman, D.S. Is metabolic syndrome predictive of prevalence, extent, and risk of coronary artery disease beyond its components? Results from the multinational coronary CT angiography evaluation for clinical outcome: An international multicenter registry (CONFIRM). PLoS ONE 2015, 10, e0118998. [Google Scholar] [CrossRef] [PubMed] [Green Version]
- Irace, C.; Cortese, C.; Fiaschi, E.; Carallo, C.; Sesti, G.; Farinaro, E.; Gnasso, A. Components of the metabolic syndrome and carotid atherosclerosis: Role of elevated blood pressure. Hypertension 2005, 45, 597–601. [Google Scholar] [CrossRef] [PubMed] [Green Version]
- Wilson, P.W. High-density lipoprotein, low-density lipoprotein and coronary artery disease. Am. J. Cardiol. 1990, 66, A7–A10. [Google Scholar] [CrossRef]
- St-Pierre, J.; Lemieux, I.; Vohl, M.-C.; Perron, P.; érald Tremblay, G.; Després, J.-P.; Gaudet, D. Contribution of abdominal obesity and hypertriglyceridemia to impaired fasting glucose and coronary artery disease. Am. J. Cardiol. 2002, 90, 15–18. [Google Scholar] [CrossRef]
- Kim, Y.; Je, Y. Meat consumption and risk of metabolic syndrome: Results from the Korean population and a meta-analysis of observational studies. Nutrients 2018, 10, 390. [Google Scholar] [CrossRef] [Green Version]
- Dunkley, A.; Charles, K.; Gray, L.; Camosso-Stefinovic, J.; Davies, M.; Khunti, K. Effectiveness of interventions for reducing diabetes and cardiovascular disease risk in people with metabolic syndrome: Systematic review and mixed treatment comparison meta-analysis. Diabetesobesity Metab. 2012, 14, 616–625. [Google Scholar] [CrossRef] [PubMed]
- Malik, V.S.; Popkin, B.M.; Bray, G.A.; Després, J.-P.; Willett, W.C.; Hu, F.B. Sugar-sweetened beverages and risk of metabolic syndrome and type 2 diabetes: A meta-analysis. Diabetes Care 2010, 33, 2477–2483. [Google Scholar] [CrossRef] [PubMed] [Green Version]
- Ge, K. The transition of Chinese dietary guidelines and the food guide pagoda. Asia Pac. J. Clin. Nutr. 2011, 20, 439. [Google Scholar] [PubMed]
- Schönfeldt, H.; Hall, N.; Bester, M. Relevance of food-based dietary guidelines to food and nutrition security: A South African perspective. Nutr. Bull. 2013, 38, 226–235. [Google Scholar] [CrossRef]
- Chen, G.-C.; Szeto, I.M.; Chen, L.-H.; Han, S.-F.; Li, Y.-J.; Van Hekezen, R.; Qin, L.-Q. Dairy products consumption and metabolic syndrome in adults: Systematic review and meta-analysis of observational studies. Sci. Rep. 2015, 5, 14606. [Google Scholar] [CrossRef]
- Tian, Y.; Su, L.; Wang, J.; Duan, X.; Jiang, X. Fruit and vegetable consumption and risk of the metabolic syndrome: A meta-analysis. Public Health Nutr. 2018, 21, 756–765. [Google Scholar] [CrossRef]


| Study | MetS | CAD |
|---|---|---|
| Iribarren et al. [24] | The 2001 NCEP-ATP-III definition (1) (WC ≥102 cm in men or ≥88 cm in women, fasting TG ≥150 mg/dL, HDL-c <40 mg/dl in men or <50 mg/dL in women, BP ≥130/85 mm Hg or use of BP medication, and FBG ≥110 mg/dL). The revised American Heart Association/National Heart, Lung, and Blood Institute definition incorporating the lower threshold for impaired fasting glucose (≥100 mg/dL) and FBG ≥126 mg/dL | The ninth revision of the International Classification of Disease codes 410.x, 411.x, 413.x, or 414.x plus troponin. I > 4ng/dL, combination of creatine kinase fraction% >3.3, symptoms plus an electrocardiogram, and evidence of angiography during hospitalization. |
| Gui et al. [25] | The presence of ≥3 of the following five criteria: (1) WC: ≥90 cm in men or ≥80 cm in women; (2) TGs: ≥1.7 mmol/L or on drug treatment for elevated TGs; (3) HDL-c: <1.03 mmol/L in men or <1.3 mmol/L in women or on drug treatment for HDL-c; (4) BP ≥130 mm Hg, ≥85 mm Hg, or on antihypertensive drug treatment; (5) FBG ≥5.6 mmol/L or on drug treatment for elevated glucose. | Fifty percent or more lumen diameter reduction in at least one major coronary artery. |
| Won et al. [26] | The presence of ≥3 of the following: (a) BP ≥130 mm Hg, ≥85 mm Hg diastolic, or on antihypertensive treatment; (b) HDL-c <40 mg/dL in men or <50 mg/dL in women; (c) TG ≥150 mg/dL; (d) BMI ≥25 kg/m2; and (e) FBG ≥100 mg/dL. | At least one of the symptoms, including typical angina, atypical angina, dyspnea, and excessive fatigue, but not an acute coronary syndrome, required emergent coronary intervention or surgery. |
| Kim et al. [27] | The presence of MetS was determined using the updated 2005 ATP-III of the NCEP criteria by considering WC ≥90 cm in men and ≥80 cm in women. Those who had ≥3 of the five components were classified as having MetS. | First elective coronary angiography for evaluation of chest pain. |
| Kim et al. [23] | The presence of ≥3 of the flowing five criteria: (1) WC ≥90 cm in men and ≥80 cm in women, (2) TG ≥150 mg/ dL (1.7 mmol/L); (3) HDL-c <40 mg/dL (1.0 mmol/L) in men and <50 mg/dL (1.3 mmol/L) in women; (4) BP ≥130/85 mm Hg or the use of antihypertensive medication; and (5) FBG ≥100 mg/dL (6.1 mmol/L) or the self-reported use of antidiabetic medication (insulin or oral agents). | CAD assessed by the degree of coronary artery stenosis, presence of plaques, and its characteristics. |
| Kim et al. [28] | The presence of ≥3 of the following: WC modified into a body mass index of more than 25 kg/m2. The BP >130/85 mm Hg or being already on antihypertensive medication. FBG ≥110 mg/dL or being already on oral hypoglycemic agents or insulin. HDL-c < 40 mg/dL in men and < 50 mg/dL in women. TG ≥150 mg/dL. | >50% luminal diameter stenosis of at least one major epicardial coronary artery. |
| Jacobs et al. [29] | According to the American Heart Association and the National Heart, Lung, and Blood Institute, it is defined. | Self-reported myocardial infarction, bypass surgery of the coronary arteries, balloon dilatation or stent placement, and/or the presence of signs of myocardial infarction (Minnesota codes 1–1 or 1–2) or ischemia (Minnesota codes 1–3, 4–1, 4–2, 4–3, 5–1, 5–2, 5–3 or 7–1) on a 12-lead electrocardiogram. |
| Anderson et al. [22] | A combination of ≥3 of the following features: FBG 110 mg/dL or more, TG 150 mg/dL or more, HDL-c <40 mg/dL in men or <50 mg/dL in women, BP 130/85 mm Hg or more and WC >40 inches in men or more than 35 inches in women. | The degree of maximal diameter stenosis of each of the three principal coronary arteries and their major branches was estimated to the nearest 10%. |
| Berenjy et al. [30] | WC >88 cm in women and >102 in men. TG ≥150 mg/dL or medication for treatment. HDL-c <50 mg/dL in men and <40 in women or medication for treatment. BP ≥ 130/85 mm Hg or medication for treatment. FBGF ≥ 100 mg/dL or medication for treatment. | >50% luminal diameter stenosis of at least one major epicardial coronary artery. |
| Vakil et al. [31] | As per the revised NCEP, the presence of ≥3 of the following: A WC >102 cm, BP ≥ 130/85 mm Hg or on treatment, FBG ≥ 100 mg/dL, HDL-c ≥ 40 mg/dL, TG ≥ 150 mg/dL. As per the International Diabetes Federation, the presence of a WC ≥ 94 cm and at least two following risk factors: BP ≥ 130/85 mm Hg or on treatment, FBG ≥ 100 mg/dL, HDL-c < 40 mg/dL, TG ≥ 150 mg/dL. | The presence of reversible and/or irreversible perfusion defects on single-photon emission computed tomography or resting and/or stress-induced wall motion abnormalities on two-dimensional stress echocardiography. |
| Author | Study Design | Country | Sample Size | Age in Year Mean (Standard Deviation) | Exposure | Risk Factors Adjusted | Outcome |
|---|---|---|---|---|---|---|---|
| Irribarren et al., [24] | Case-control | USA | n = 393 (women = 239) cases n = 393 (women = 239) control | Case: 45.8 (6.5) Control: 45.2 (5.6) | Metabolic Syndrome (MetS) | Age, educational attainment, cigarette smoking, alcohol consumption, and body mass index | Early-onset Coronary Artery Disease (CAD) |
| Gui et al., [25] | Retrospective | China | n = 296 (women = 91) without MetS n = 330 (women = 141) with MetS | 58 (9) without MetS 60 (9) with MetS | MetS score, MetS, and its components | Age and sex | Angiographic CAD |
| Won et al., [26] | Cross-sectional | S. Korea | n = 1515 (men = 749) without MetS n = 793 (men = 406) with MetS | 57 (9) with no MetS 57 (9) with MetS | MetS and its components | Age, sex, current smoking, and low-density cholesterol | Severity of CAD |
| Kim et al., [27] | Cross-sectional | S. Korea | n = 185 (male = 100) without MetS n = 178 (male = 96) with MetS | 61.8 (11.5) without MetS 62.2 (10.6) with MetS | MetS score in the subject without diabetes included | Age and sex | Angiographic CAD along with high sensitivity C-reactive protein, interleukin-6, resistin, and adiponectin |
| Kim et al., [23] | Retrospective cohort | S. Korea | n = 825 (male = 661) with MetS n = 1601 (male = 1278) without MetS | 56.6 (7.5) with MetS 56.2 (7.2) without MetS | MetS | Age, sex, smoking status, family history of CAD, body mass index, and low-density cholesterol | Progression of CAD |
| Kim et al., [28] | Retrospective | S. Korea | n = 349 (male = 223) without MetS n = 283 (male = 171) with MetS | 61 (10.8) without MetS 61 (10.4) with MetS | MetS and its components | MetS components | Angiographic CAD |
| Jacobs et al., [29] | Cohort | The Netherlands | n = 225 (male = 149) without MetS n = 305 (male = 194) with MetS | 58.8 (7.4) without MetS 60.2 (6.6) with MetS | MetS | Age, sex, and smoking | CAD |
| Anderson et al., [22] | Retrospective | USA | n = 69 male without MetS n = 69 male with MetS | 63 (13) without MetS 63 (12) with MetS | MetS and its components | Age, sex, smoking status, family history of CAD, body mass index, and low-density cholesterol | Angiographic CAD |
| Berenjy et al., [30] | Case-control | Malaysia | n = 258 cases with MetS n = 190 control without MetS | - | MetS components | - | CAD |
| Vakil et al., [31] | Retrospective | USA | n = 1071 male with or without silent CAD | 61 (11) | MetS and its component, such as waist circumference | - | Silent CAD |
Publisher’s Note: MDPI stays neutral with regard to jurisdictional claims in published maps and institutional affiliations. |
© 2021 by the authors. Licensee MDPI, Basel, Switzerland. This article is an open access article distributed under the terms and conditions of the Creative Commons Attribution (CC BY) license (http://creativecommons.org/licenses/by/4.0/).
Share and Cite
Alshammary, A.F.; Alharbi, K.K.; Alshehri, N.J.; Vennu, V.; Ali Khan, I. Metabolic Syndrome and Coronary Artery Disease Risk: A Meta-Analysis of Observational Studies. Int. J. Environ. Res. Public Health 2021, 18, 1773. https://0-doi-org.brum.beds.ac.uk/10.3390/ijerph18041773
Alshammary AF, Alharbi KK, Alshehri NJ, Vennu V, Ali Khan I. Metabolic Syndrome and Coronary Artery Disease Risk: A Meta-Analysis of Observational Studies. International Journal of Environmental Research and Public Health. 2021; 18(4):1773. https://0-doi-org.brum.beds.ac.uk/10.3390/ijerph18041773
Chicago/Turabian StyleAlshammary, Amal F., Khalid Khalaf Alharbi, Naif Jameel Alshehri, Vishal Vennu, and Imran Ali Khan. 2021. "Metabolic Syndrome and Coronary Artery Disease Risk: A Meta-Analysis of Observational Studies" International Journal of Environmental Research and Public Health 18, no. 4: 1773. https://0-doi-org.brum.beds.ac.uk/10.3390/ijerph18041773