
A Deep Learning Model for Classification of Endoscopic Gastroesophageal Reflux Disease

 ,
,  , ,
, ,
Abstract
:1. Introduction
2. Materials and Methods
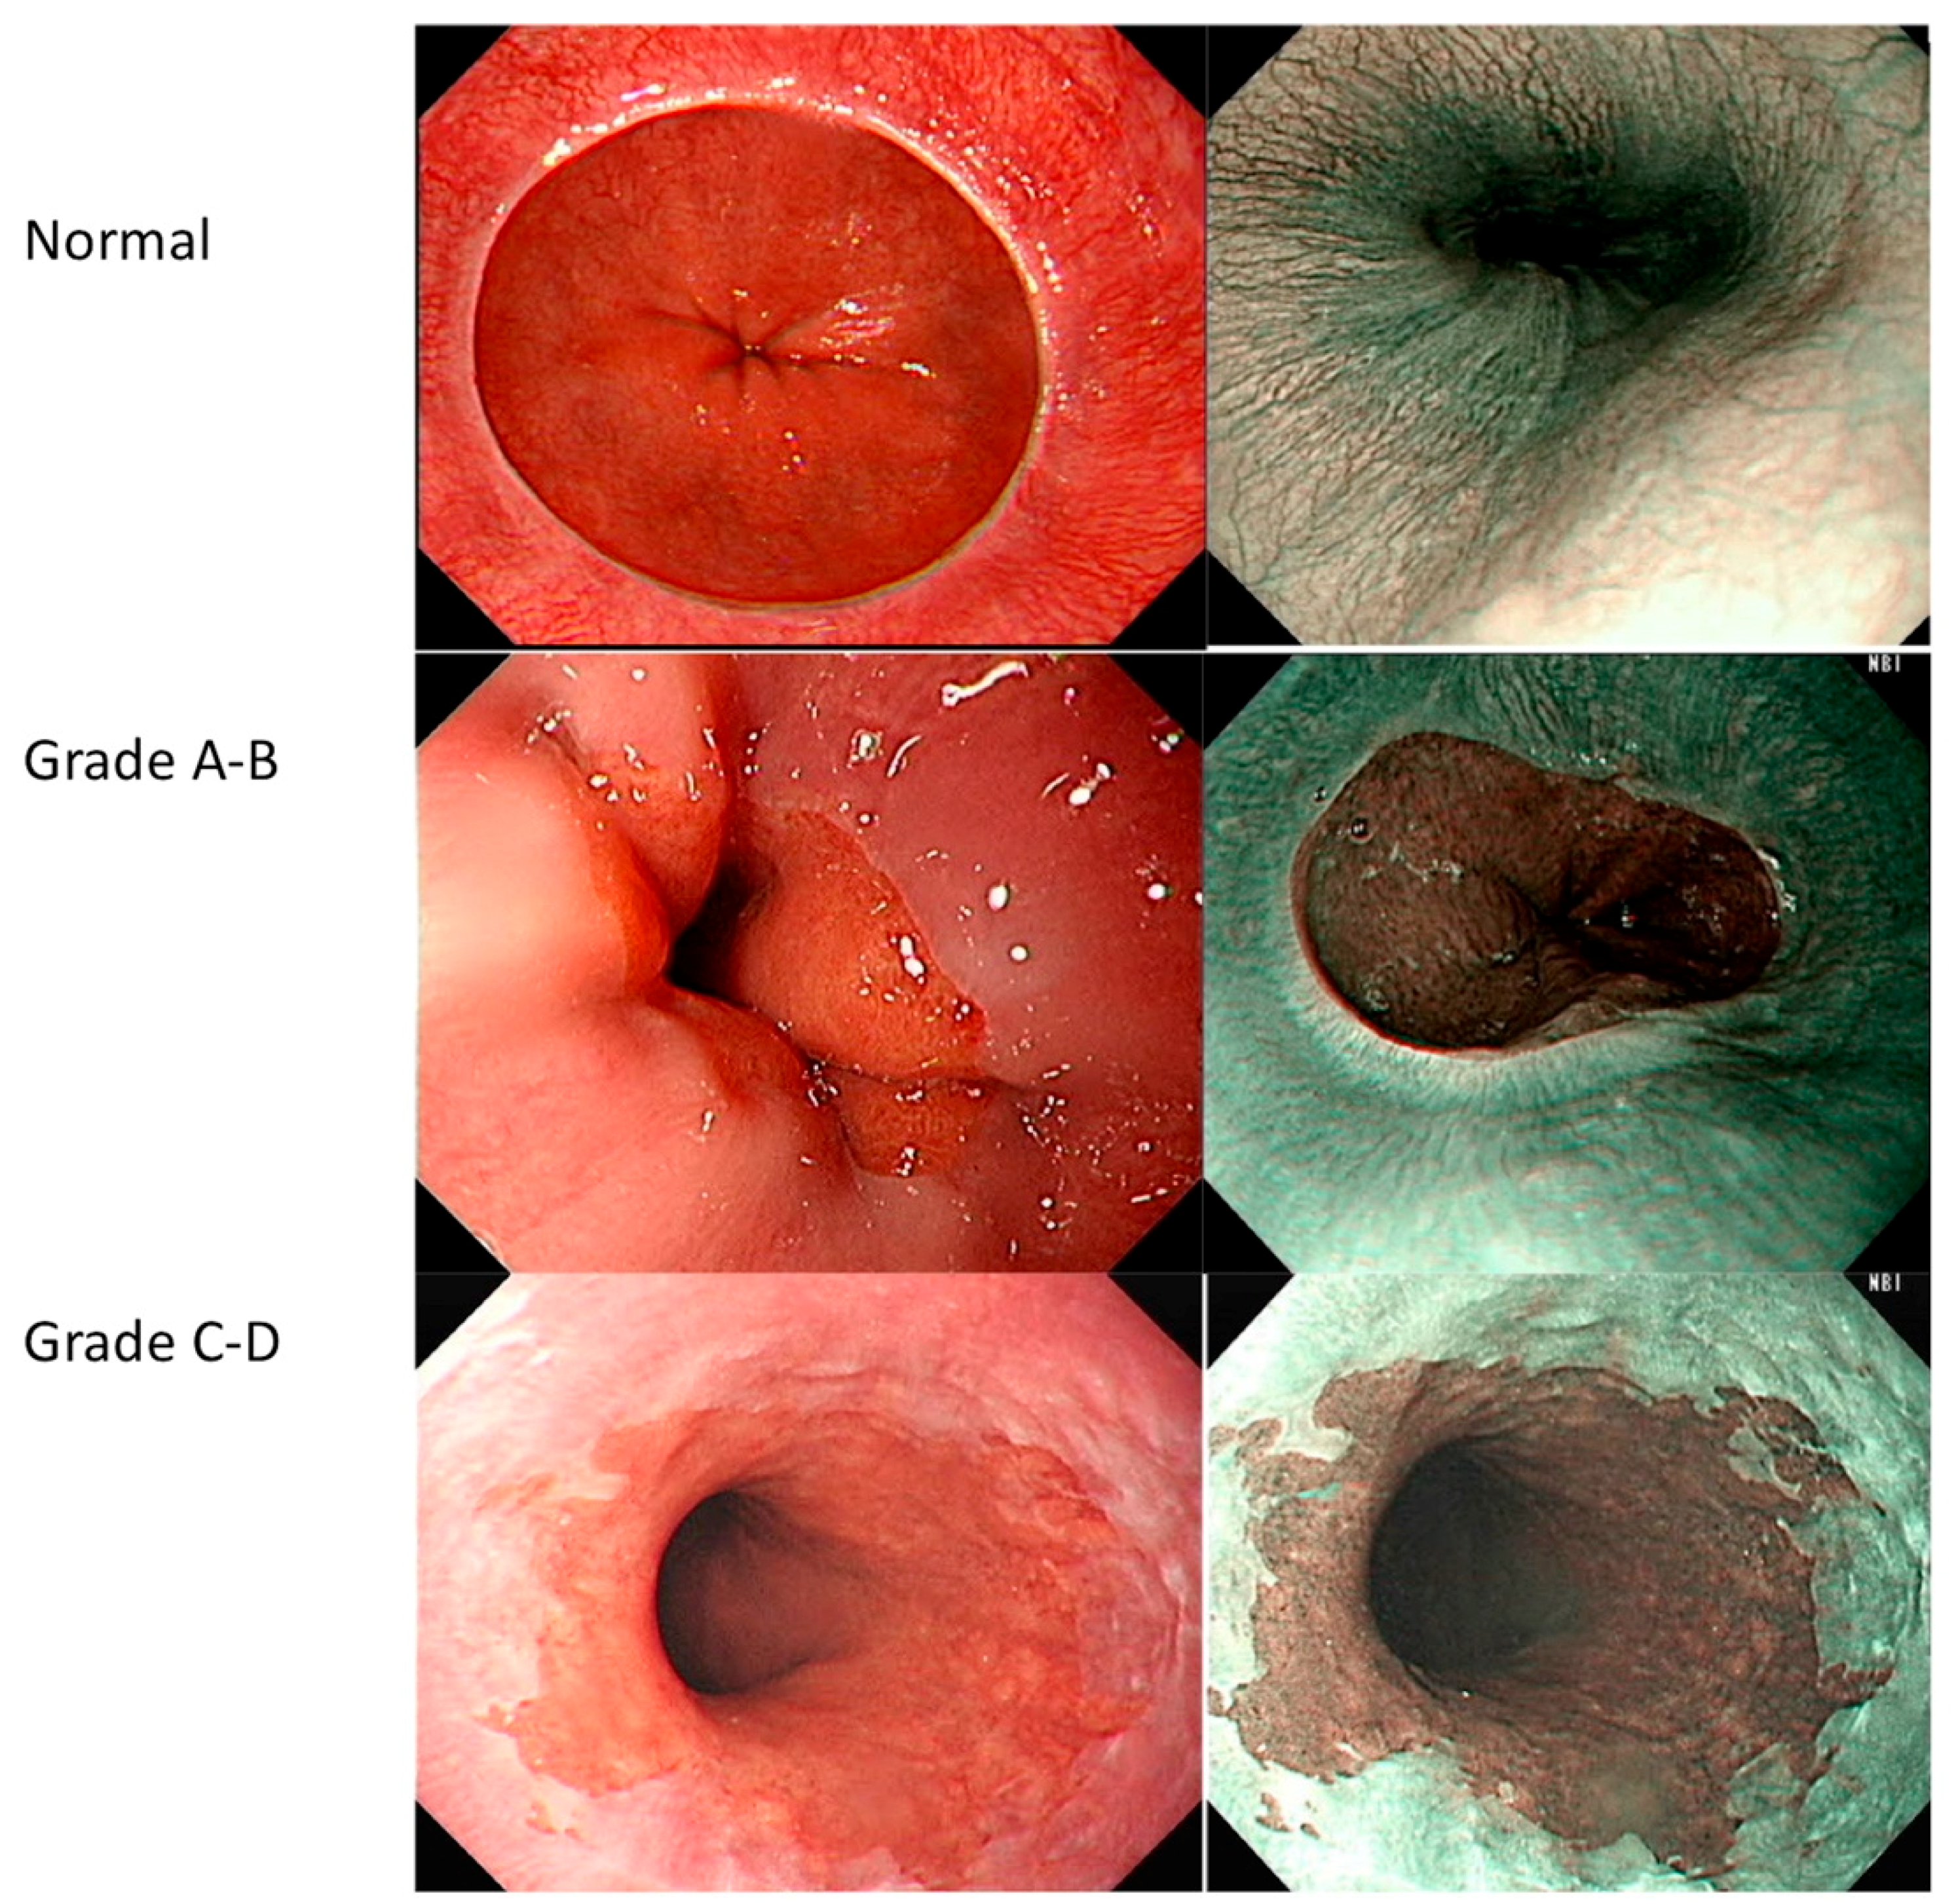
2.1. Grading
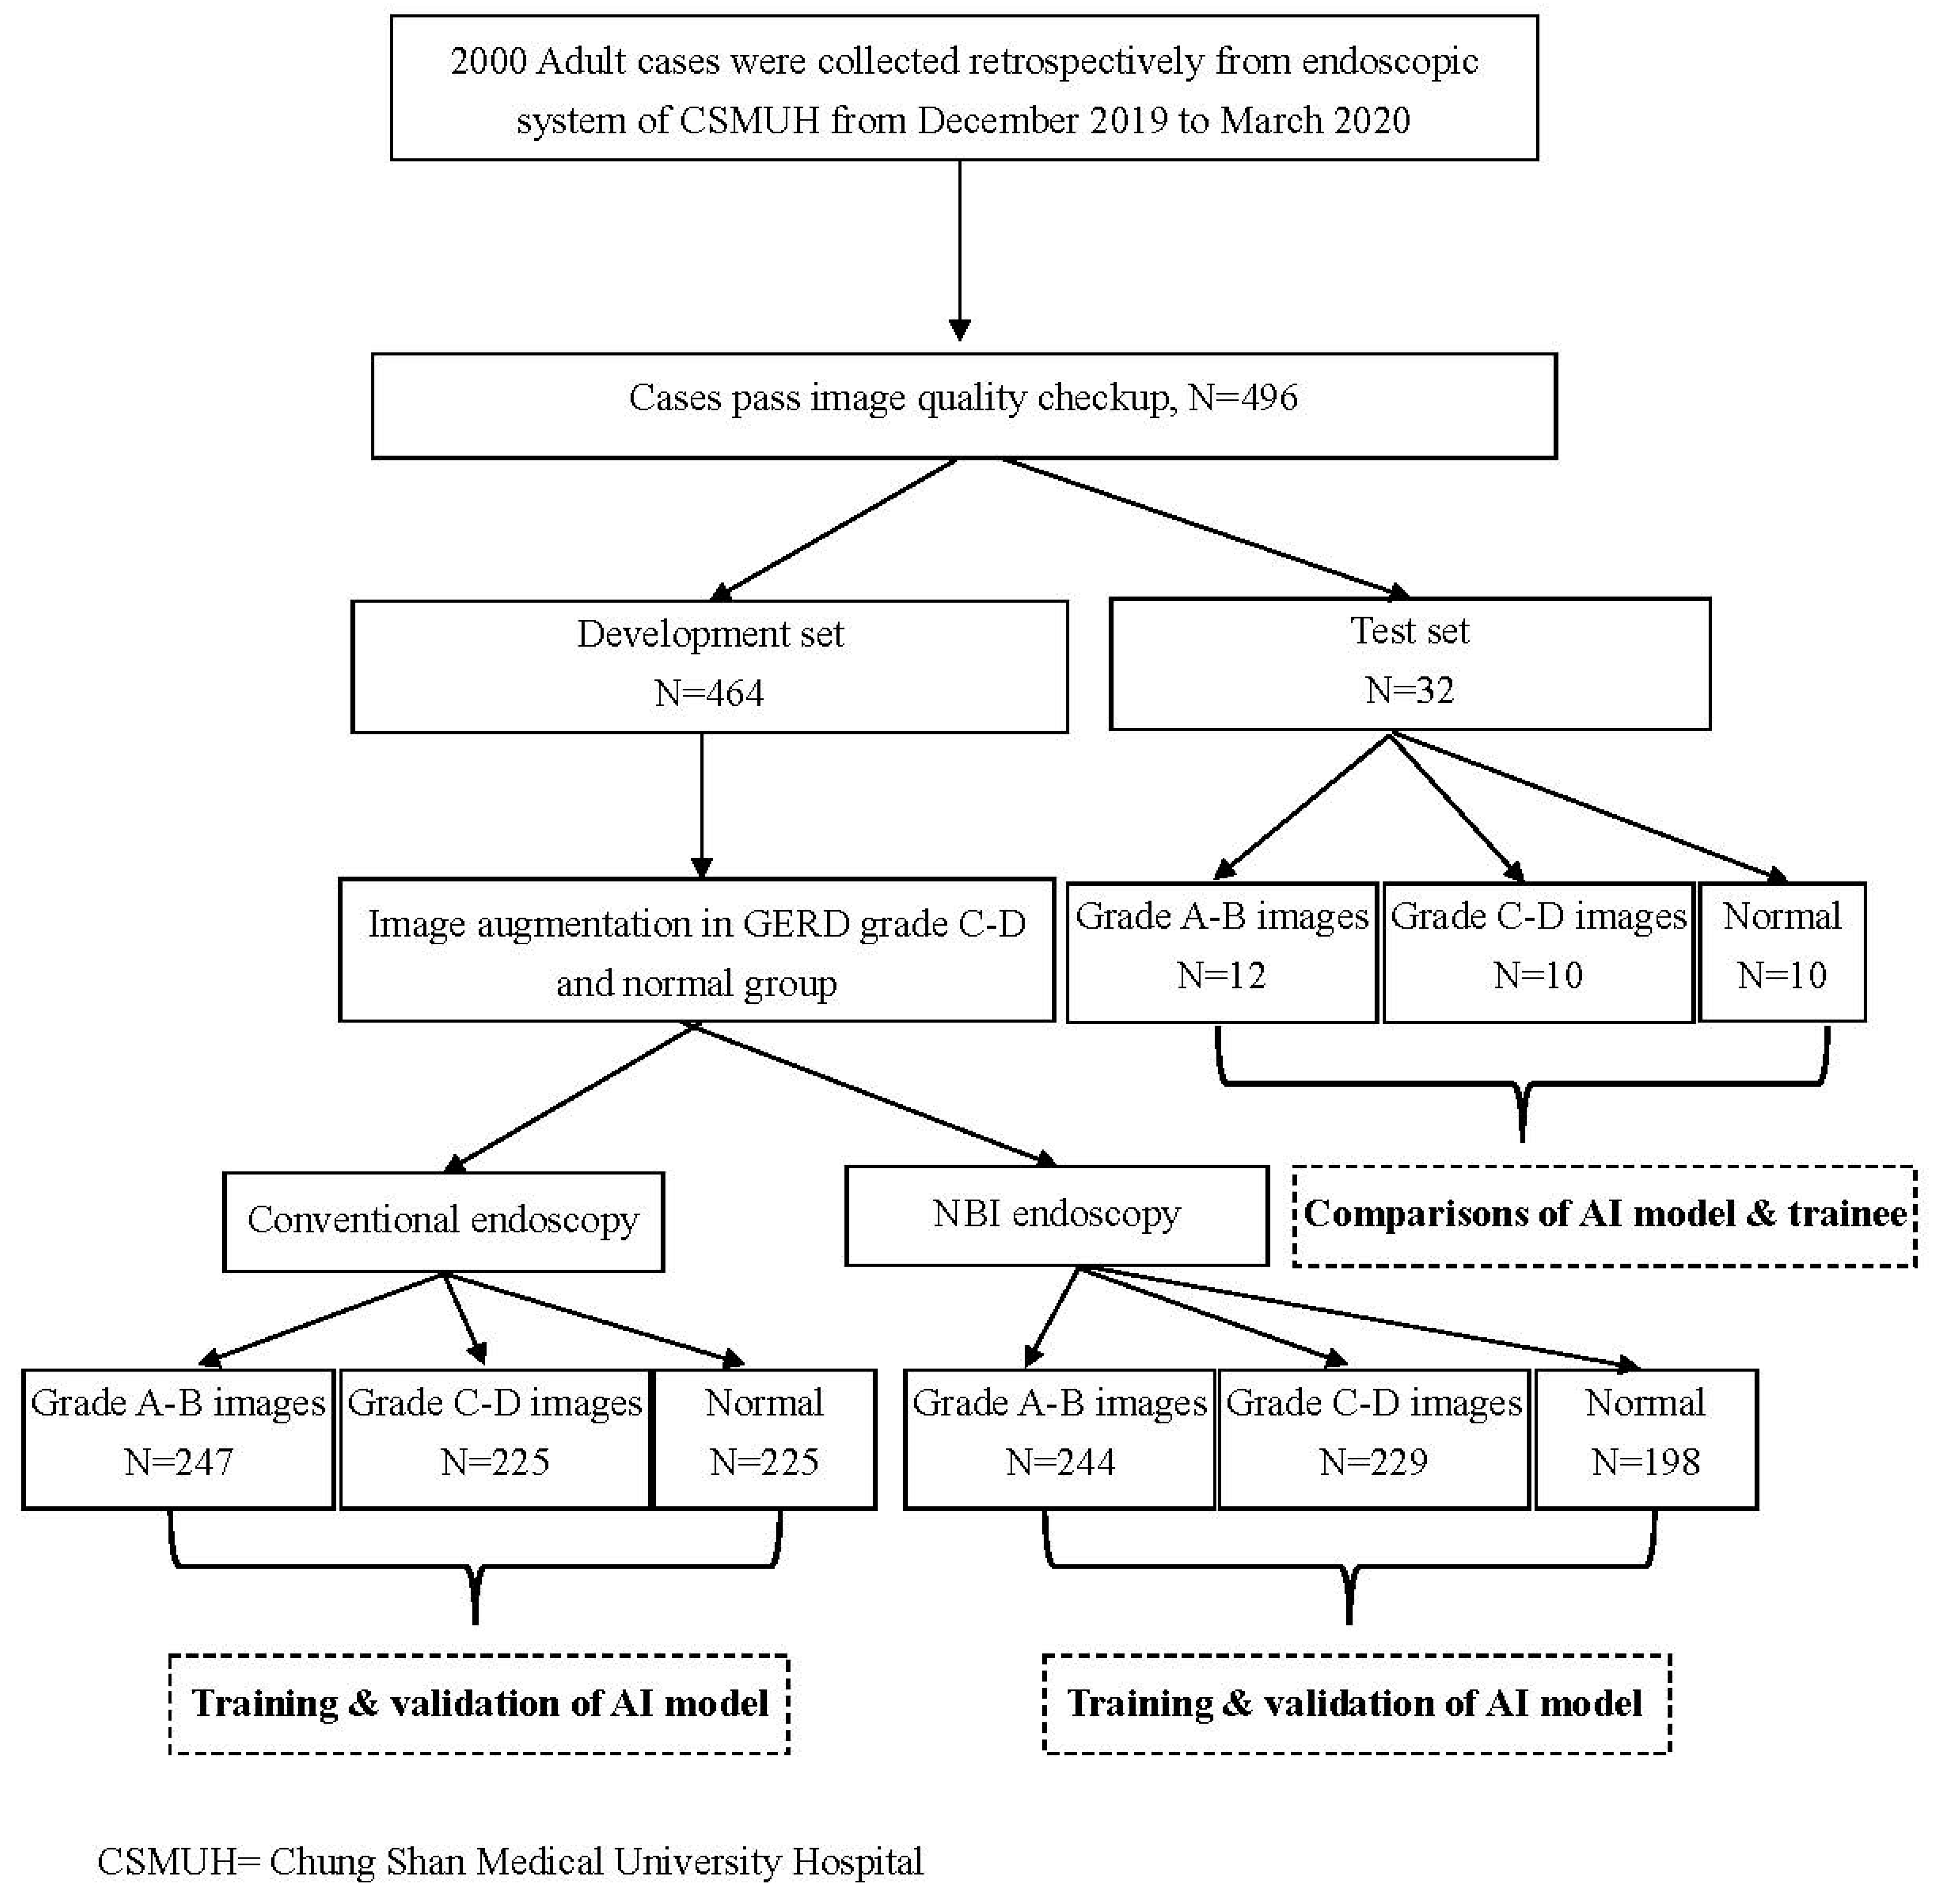
2.2. Study Design
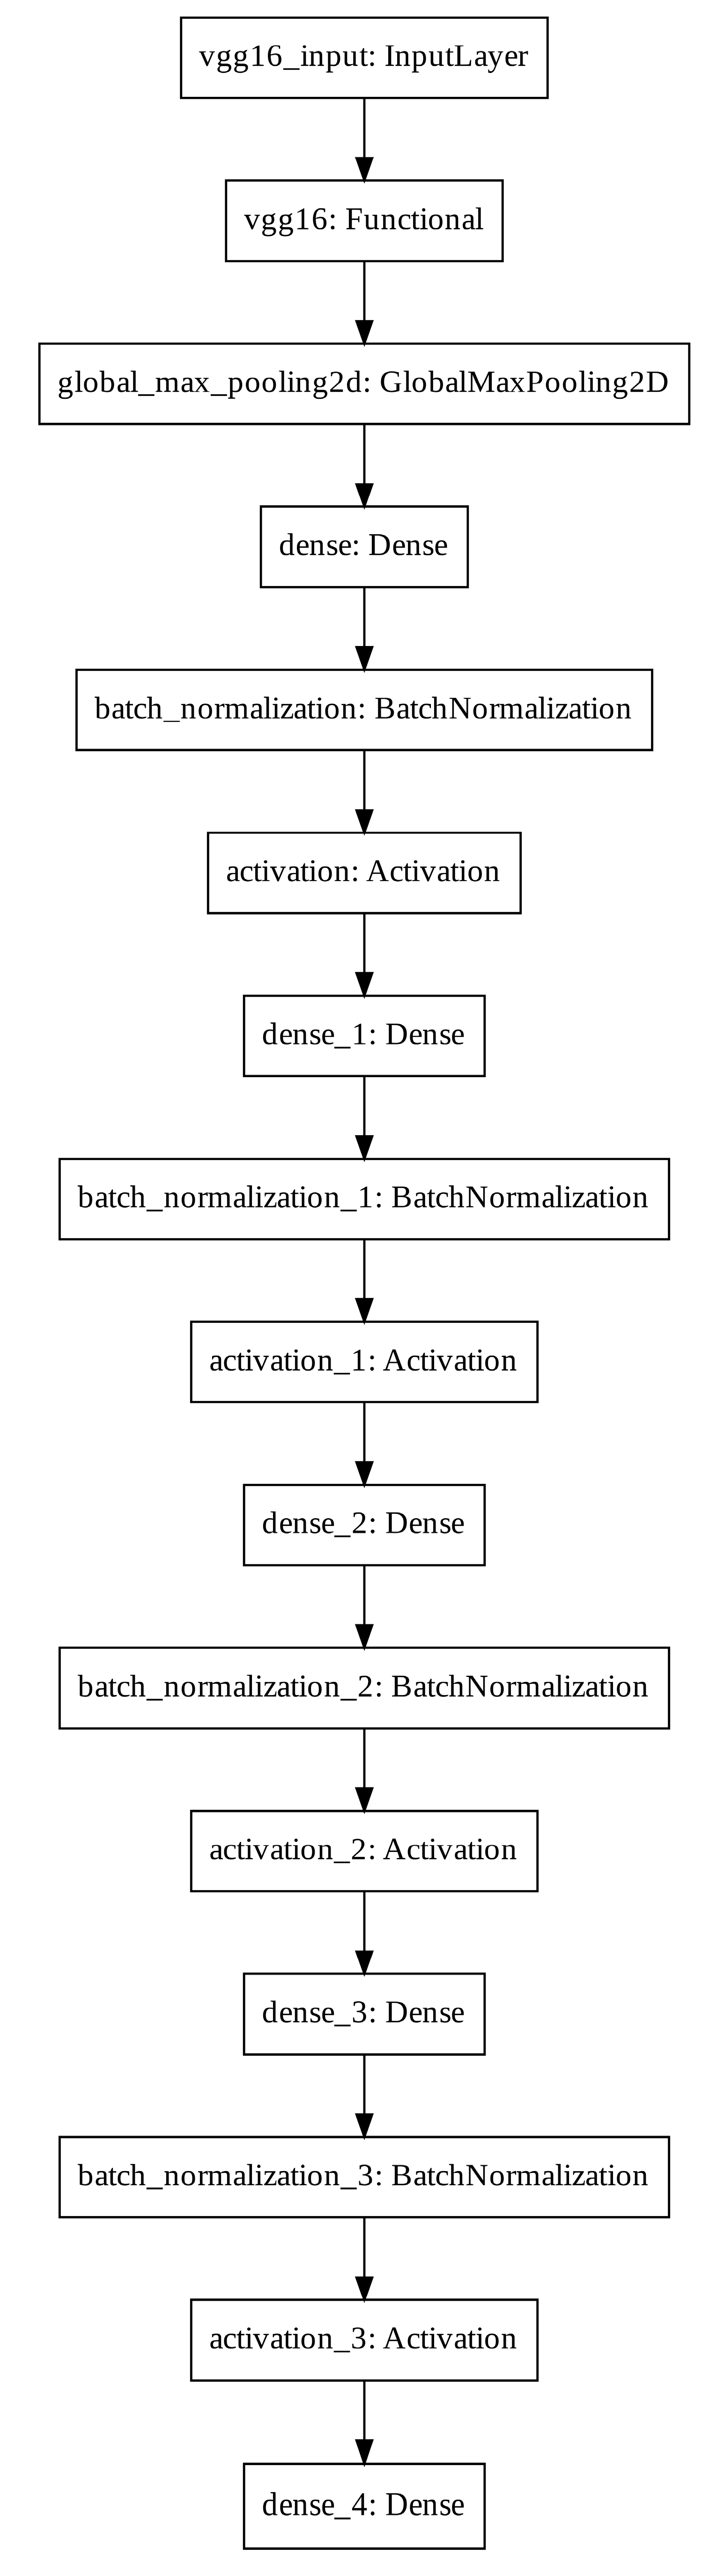
2.3. Model Development
2.4. Model Evaluation
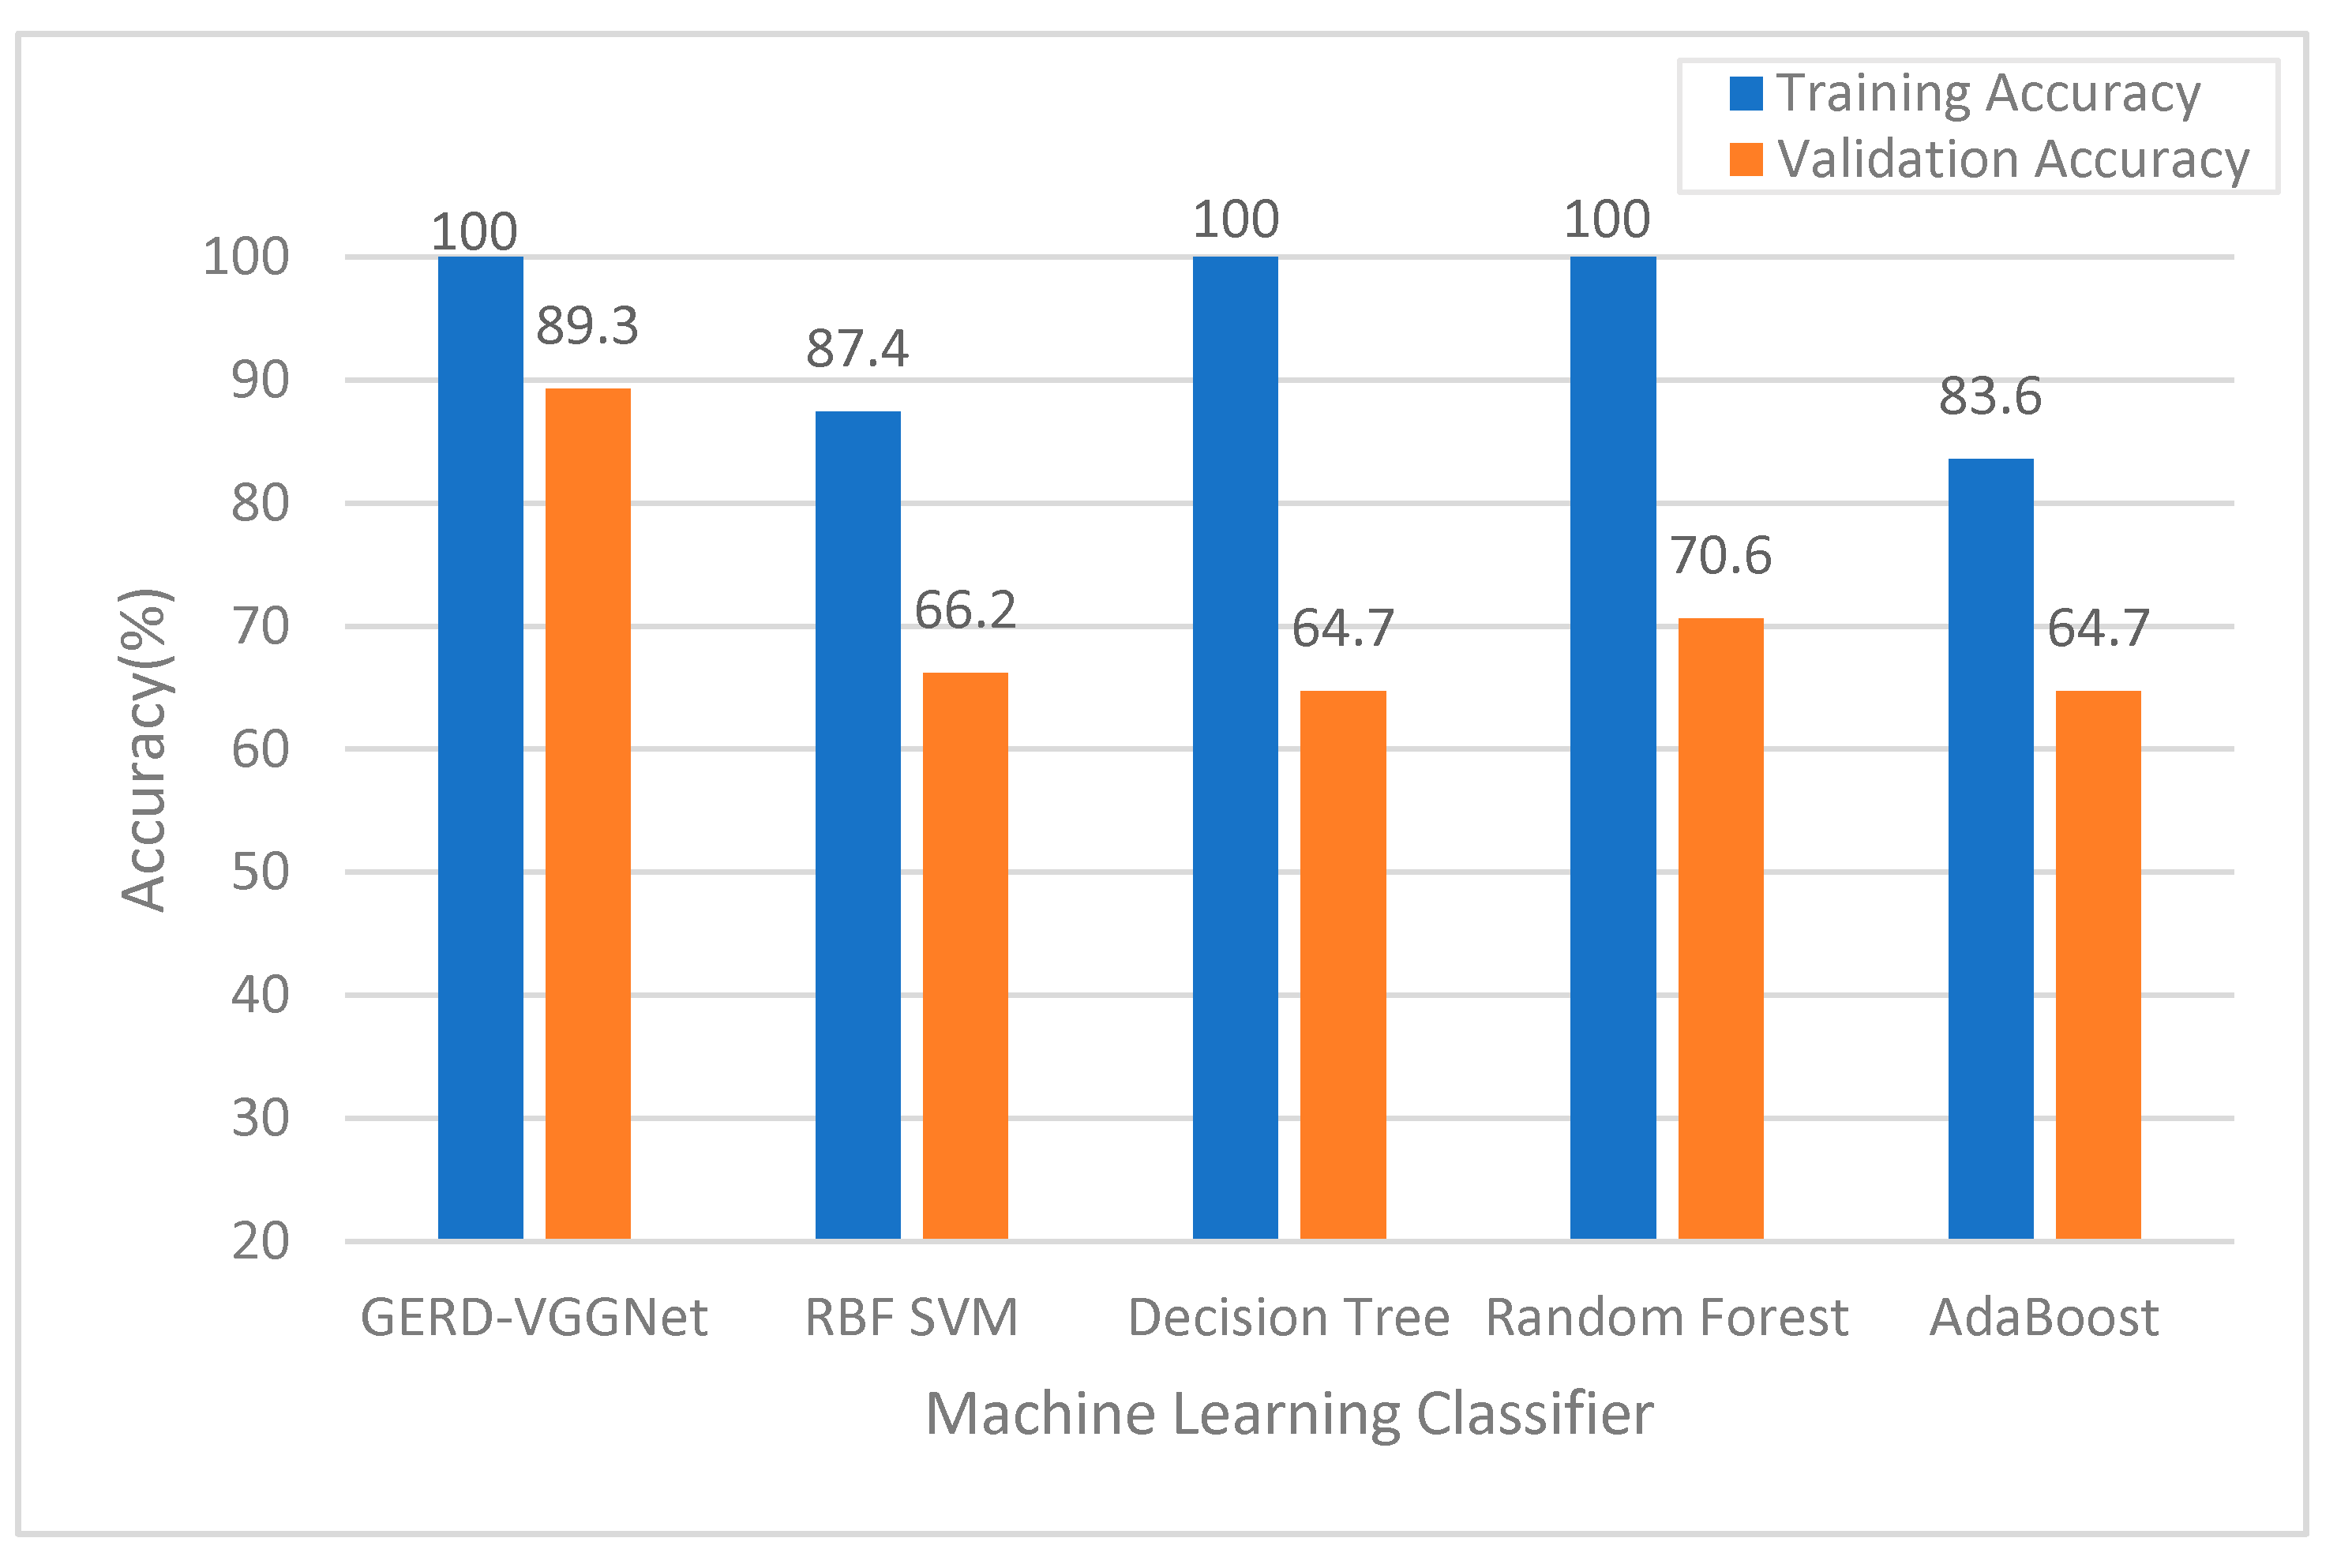
2.5. Classifier Performance Comparison
3. Results and Analysis
3.1. Analysis of Experimental Results
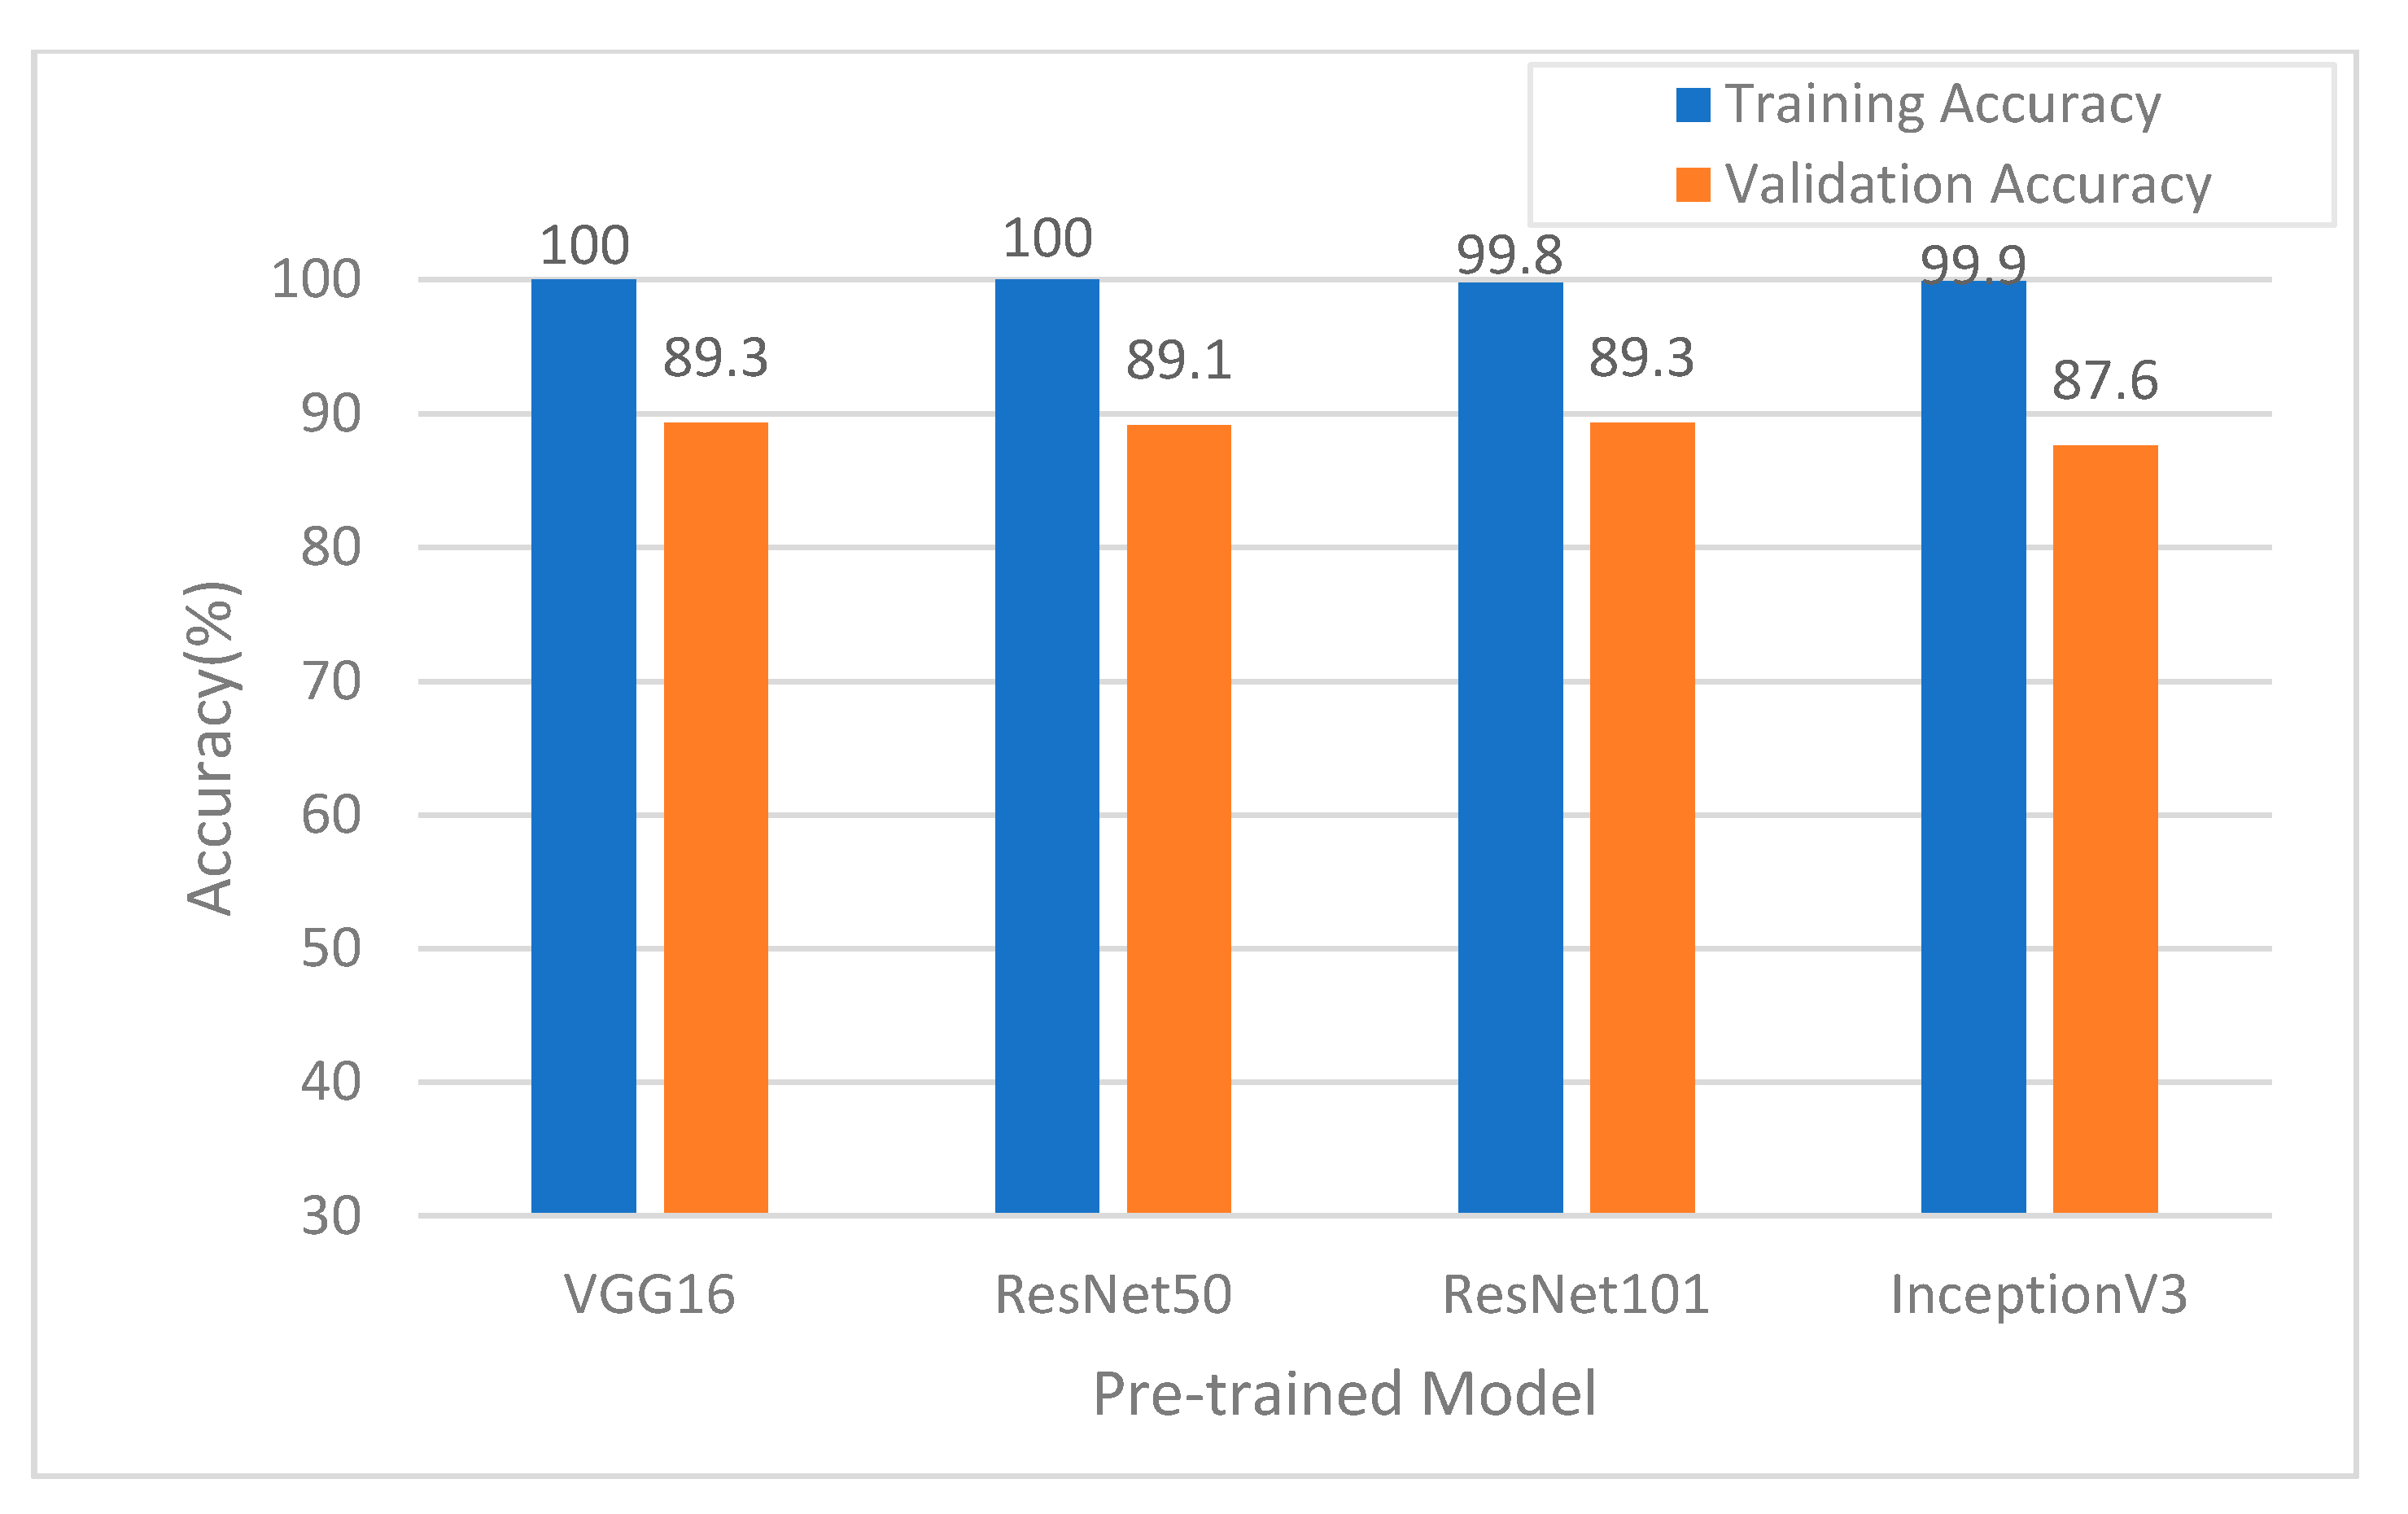
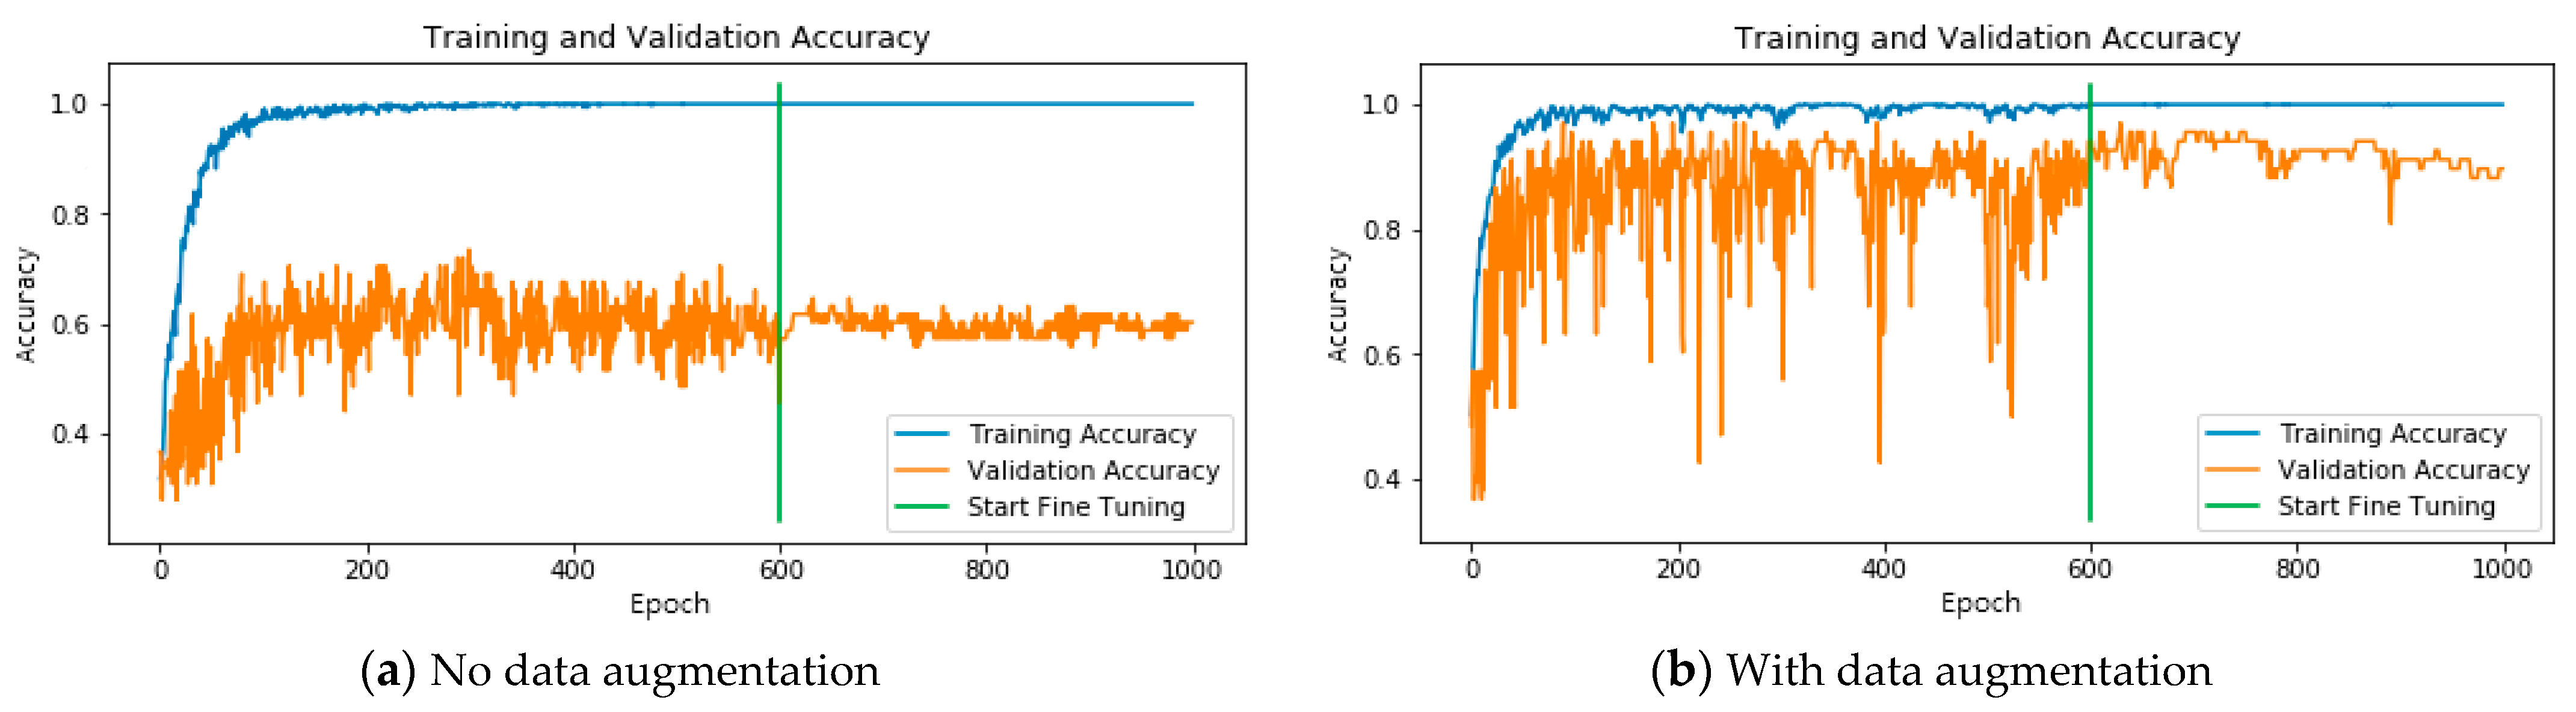
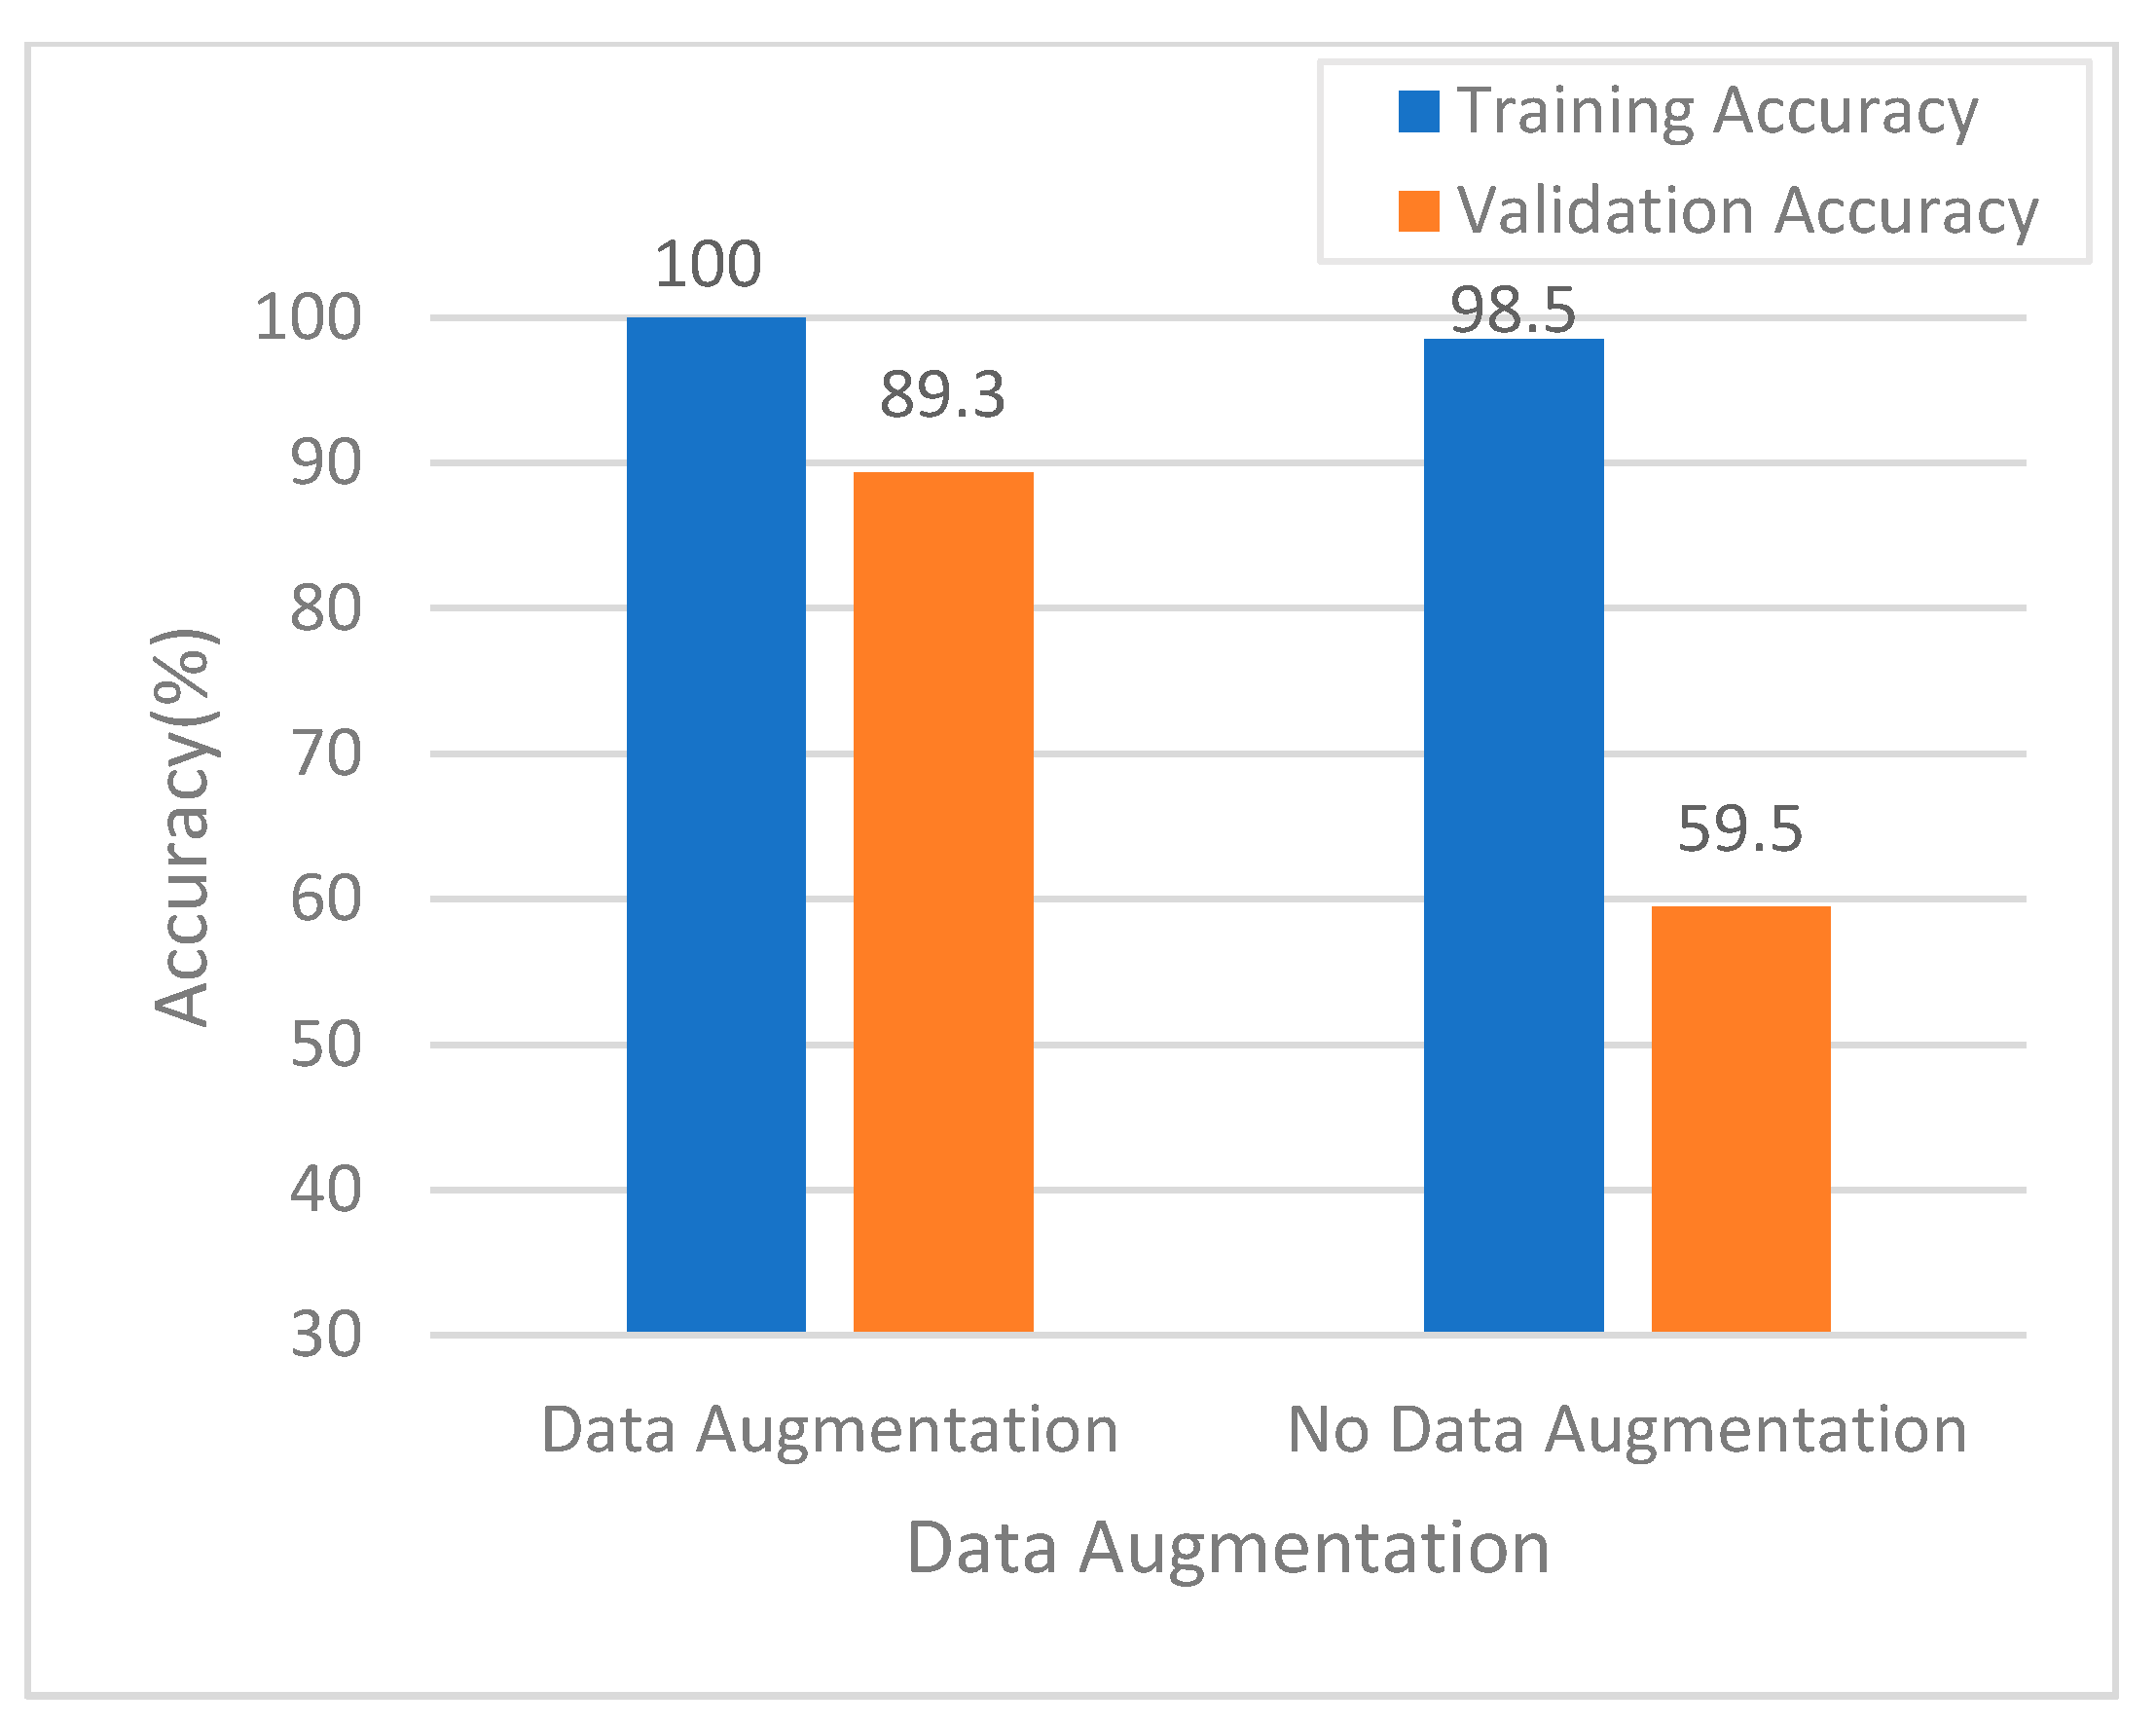
3.2. Model Training and Validation Performance Evaluation
3.3. Model Testing Performance Evaluation
4. Discussion
4.1. Model Training and Validation Performance
4.2. Performance of NBI in AI Prediction
4.3. Limitations
5. Conclusions
Author Contributions
Funding
Institutional Review Board Statement
Informed Consent Statement
Data Availability Statement
Acknowledgments
Conflicts of Interest
References
- Vakil, N.; van Zanten, S.V.; Kahrilas, P.; Dent, J.; Jones, R.; Global Consensus, G. The Montreal definition and classification of gastroesophageal reflux disease: A global evidence-based consensus. Am. J. Gastroenterol. 2006, 101, 1900–1920. [Google Scholar] [CrossRef]
- Dent, J.; El-Serag, H.B.; Wallander, M.A.; Johansson, S. Epidemiology of gastro-oesophageal reflux disease: A systematic review. Gut 2005, 54, 710–717. [Google Scholar] [CrossRef]
- Richter, J.E.; Rubenstein, J.H. Presentation and Epidemiology of Gastroesophageal Reflux Disease. Gastroenterology 2018, 154, 267–276. [Google Scholar] [CrossRef] [PubMed]
- Iwakiri, K.; Kinoshita, Y.; Habu, Y.; Oshima, T.; Manabe, N.; Fujiwara, Y.; Nagahara, A.; Kawamura, O.; Iwakiri, R.; Ozawa, S.; et al. Evidence-based clinical practice guidelines for gastroesophageal reflux disease 2015. J. Gastroenterol. 2016, 51, 751–767. [Google Scholar] [CrossRef] [Green Version]
- Mc, H.G.; Mc, H.R.; Craighead, C.C. Erosive esophagitis: Recurrent, reflux, peptic esophagitis; 80 adult cases. GP 1957, 16, 75–83. [Google Scholar]
- Sellar, R.J.; De Caestecker, J.S.; Heading, R.C. Barium radiology: A sensitive test for gastro-oesophageal reflux. Clin. Radiol. 1987, 38, 303–307. [Google Scholar] [CrossRef]
- Krugmann, J.; Neumann, H.; Vieth, M.; Armstrong, D. What is the role of endoscopy and oesophageal biopsies in the management of GERD? Best Pract. Res. Clin. Gastroenterol. 2013, 27, 373–385. [Google Scholar] [CrossRef]
- Armstrong, D. Endoscopic evaluation of gastro-esophageal reflux disease. Yale J. Biol. Med. 1999, 72, 93–100. [Google Scholar]
- Tefera, L.; Fein, M.; Ritter, M.P.; Bremner, C.G.; Crookes, P.F.; Peters, J.H.; Hagen, J.A.; DeMeester, T.R. Can the combination of symptoms and endoscopy confirm the presence of gastroesophageal reflux disease? Am. Surg. 1997, 63, 933–936. [Google Scholar]
- Lee, S.H.; Jang, B.I.; Kim, K.O.; Jeon, S.W.; Kwon, J.G.; Kim, E.Y.; Jung, J.T.; Park, K.S.; Cho, K.B.; Kim, E.S.; et al. Endoscopic experience improves interobserver agreement in the grading of esophagitis by Los Angeles classification: Conventional endoscopy and optimal band image system. Gut Liver 2014, 8, 154–159. [Google Scholar] [CrossRef] [Green Version]
- Kusano, M.; Ino, K.; Yamada, T.; Kawamura, O.; Toki, M.; Ohwada, T.; Kikuchi, K.; Shirota, T.; Kimura, M.; Miyazaki, M.; et al. Interobserver and intraobserver variation in endoscopic assessment of GERD using the “Los Angeles” classification. Gastrointest. Endosc. 1999, 49, 700–704. [Google Scholar] [CrossRef]
- Pandolfino, J.E.; Vakil, N.B.; Kahrilas, P.J. Comparison of inter- and intraobserver consistency for grading of esophagitis by expert and trainee endoscopists. Gastrointest. Endosc. 2002, 56, 639–643. [Google Scholar] [CrossRef]
- Lee, Y.C.; Lin, J.T.; Chiu, H.M.; Liao, W.C.; Chen, C.C.; Tu, C.H.; Tai, C.M.; Chiang, T.H.; Chiu, Y.H.; Wu, M.S.; et al. Intraobserver and interobserver consistency for grading esophagitis with narrow-band imaging. Gastrointest. Endosc. 2007, 66, 230–236. [Google Scholar] [CrossRef] [PubMed]
- Hosny, A.; Parmar, C.; Quackenbush, J.; Schwartz, L.H.; Aerts, H. Artificial intelligence in radiology. Nat. Rev. Cancer 2018, 18, 500–510. [Google Scholar] [CrossRef] [PubMed]
- Zhou, L.Q.; Wang, J.Y.; Yu, S.Y.; Wu, G.G.; Wei, Q.; Deng, Y.B.; Wu, X.L.; Cui, X.W.; Dietrich, C.F. Artificial intelligence in medical imaging of the liver. World J. Gastroenterol. 2019, 25, 672–682. [Google Scholar] [CrossRef] [PubMed]
- Das, N.; Topalovic, M.; Janssens, W. Artificial intelligence in diagnosis of obstructive lung disease: Current status and future potential. Curr. Opin. Pulm. Med. 2018, 24, 117–123. [Google Scholar] [CrossRef]
- Wong, T.Y.; Bressler, N.M. Artificial Intelligence With Deep Learning Technology Looks Into Diabetic Retinopathy Screening. JAMA 2016, 316, 2366–2367. [Google Scholar] [CrossRef]
- Kanagasingam, Y.; Xiao, D.; Vignarajan, J.; Preetham, A.; Tay-Kearney, M.L.; Mehrotra, A. Evaluation of Artificial Intelligence-Based Grading of Diabetic Retinopathy in Primary Care. JAMA Netw. Open. 2018, 1, e182665. [Google Scholar] [CrossRef] [Green Version]
- Keel, S.; Lee, P.Y.; Scheetz, J.; Li, Z.; Kotowicz, M.A.; MacIsaac, R.J.; He, M. Feasibility and patient acceptability of a novel artificial intelligence-based screening model for diabetic retinopathy at endocrinology outpatient services: A pilot study. Sci. Rep. 2018, 8, 4330. [Google Scholar] [CrossRef]
- Kumagai, Y.; Takubo, K.; Kawada, K.; Aoyama, K.; Endo, Y.; Ozawa, T.; Hirasawa, T.; Yoshio, T.; Ishihara, S.; Fujishiro, M.; et al. Diagnosis using deep-learning artificial intelligence based on the endocytoscopic observation of the esophagus. Esophagus 2019, 16, 180–187. [Google Scholar] [CrossRef]
- Mori, Y.; Kudo, S.E.; Mohmed, H.E.N.; Misawa, M.; Ogata, N.; Itoh, H.; Oda, M.; Mori, K. Artificial intelligence and upper gastrointestinal endoscopy: Current status and future perspective. Dig. Endosc. 2019, 31, 378–388. [Google Scholar] [CrossRef] [PubMed] [Green Version]
- Pace, F.; Riegler, G.; de Leone, A.; Pace, M.; Cestari, R.; Dominici, P.; Grossi, E.; Group, E.S. Is it possible to clinically differentiate erosive from nonerosive reflux disease patients? A study using an artificial neural networks-assisted algorithm. Eur. J. Gastroenterol. Hepatol. 2010, 22, 1163–1168. [Google Scholar] [CrossRef]
- Huang, C.R.; Chen, Y.T.; Chen, W.Y.; Cheng, H.C.; Sheu, B.S. Gastroesophageal Reflux Disease Diagnosis Using Hierarchical Heterogeneous Descriptor Fusion Support Vector Machine. IEEE Trans. Biomed. Eng. 2016, 63, 588–599. [Google Scholar] [CrossRef]
- Simonyan, K.; Zisserman, A. Very deep convolutional networks for large-scale image recognition. arXiv 2014, arXiv:1409.1556. [Google Scholar]
- Pan, S.J.; Yang, Q. A survey on transfer learning. IEEE Trans. Knowl. Data Eng. 2010, 22, 1345–1359. [Google Scholar] [CrossRef]
- Hung, S.-C.; Wu, H.-C.; Tseng, M.-H. Remote Sensing Scene Classification and Explanation Using RSSCNet and LIME. Appl. Sci. 2020, 10, 6151. [Google Scholar] [CrossRef]
- Ioffe, S.; Szegedy, C. Batch normalization: Accelerating deep network training by reducing internal covariate shift. arXiv 2015, arXiv:1502.03167. [Google Scholar]
- Clevert, D.-A.; Unterthiner, T.; Hochreiter, S. Fast and accurate deep network learning by exponential linear units (elus). arXiv 2015, arXiv:1511.07289. [Google Scholar]
- Shorten, C.; Khoshgoftaar, T.M. A survey on image data augmentation for deep learning. J. Big Data 2019, 6, 60. [Google Scholar] [CrossRef]
- Caruana, R.; Lawrence, S.; Giles, C.L. Overfitting in neural nets: Backpropagation, conjugate gradient, and early stopping. In Advances in Neural Information Processing Systems 13: Proceedings of the 2000 Conference; The MIT Press: Cambridge, MA, USA; Denver, CO, USA, January 2000; pp. 381–387. [Google Scholar]
- Roiger, R.; Geatz, M. Data Mining: A Tutorial-Based Primer; Addison Wesley: New York, NY, USA, 2003. [Google Scholar]
- He, K.; Zhang, X.; Ren, S.; Sun, J. Deep residual learning for image recognition. In Proceedings of the IEEE Conference on Computer Vision and Pattern Recognition, Las Vegas, NV, USA, 26 June–1 July 2016; pp. 770–778. [Google Scholar]
- Szegedy, C.; Vanhoucke, V.; Ioffe, S.; Shlens, J.; Wojna, Z. Rethinking the inception architecture for computer vision. In Proceedings of the IEEE Conference on Computer Vision and Pattern Recognition, Las Vegas, NV, USA, 26 June–1 July 2016; pp. 2818–2826. [Google Scholar]
- Tseng, P.H.; Chen, C.C.; Chiu, H.M.; Liao, W.C.; Wu, M.S.; Lin, J.T.; Lee, Y.C.; Wang, H.P. Performance of narrow band imaging and magnification endoscopy in the prediction of therapeutic response in patients with gastroesophageal reflux disease. J. Clin. Gastroenterol. 2011, 45, 501–506. [Google Scholar] [CrossRef]
- Parikh, N.D.; Viana, A.V.; Shah, S.; Laine, L. Image-enhanced endoscopy is specific for the diagnosis of non-erosive gastroesophageal reflux disease. Scand. J. Gastroenterol. 2018, 53, 260–264. [Google Scholar] [CrossRef] [PubMed]
- Furneri, G.; Klausnitzer, R.; Haycock, L.; Ihara, Z. Economic value of narrow-band imaging versus white light endoscopy for the diagnosis and surveillance of Barrett’s esophagus: Cost-consequence model. PLoS ONE 2019, 14, e0212916. [Google Scholar] [CrossRef] [PubMed] [Green Version]


| Characteristics Patient Number | Development Set N = 464 | Test Set N = 32 | ||
|---|---|---|---|---|
| N | % | N | % | |
| Conventional images | ||||
| LA grade 1 A–B | 247 | 35.4 | 12 | 37.5 |
| LA grade C–D | 225 | 32.3 | 10 | 31.3 |
| Normal | 225 | 32.3 | 10 | 31.3 |
| NBI 2 images | ||||
| LA grade A–B | 244 | 36.3 | 12 | 37.5 |
| LA grade C–D | 229 | 34.2 | 10 | 31.3 |
| Normal | 198 | 29.5 | 10 | 31.3 |
| Augmentation (conventional) | ||||
| LA grade A–B | 0 | NA | 0 | NA |
| LA grade C–D | 70 | NA | 0 | NA |
| Normal | 163 | NA | 0 | NA |
| Augmentation (NBI) | ||||
| LA grade A–B | 0 | NA | 0 | NA |
| LA grade C–D | 72 | NA | 0 | NA |
| Normal | 150 | NA | 0 | NA |
| Image Type | Conventional | NBI 2 | |||||
|---|---|---|---|---|---|---|---|
| Real LA 1 Classification | A–B | C–D | Normal | A–B | C–D | Normal | |
| GERD-VGGNet | A–B | 247 | 4 | 0 | 242 | 0 | 0 |
| C–D | 0 | 221 | 0 | 1 | 229 | 0 | |
| Normal | 0 | 0 | 225 | 1 | 0 | 198 | |
| Accuracy | 100% | 98.2% | 100% | 99.2% | 100% | 100% | |
| Image Type | Conventional | NBI 2 | ||||||
|---|---|---|---|---|---|---|---|---|
| Real LA 1 Classification | A–B | C–D | Normal | A–B | C–D | Normal | ||
| GERD-VGGNet | A–B | 11 | 4 | 2 | 10 | 0 | 2 | |
| C–D | 1 | 6 | 0 | 1 | 10 | 0 | ||
| Normal | 0 | 0 | 8 | 1 | 0 | 8 | ||
| Accuracy | 91.7% | 60% | 80% | 83.3% | 100% | 80% | ||
| Trainee 1 | A–B | 8 | 3 | 2 | 9 | 3 | 2 | |
| C–D | 2 | 7 | 1 | 1 | 7 | 0 | ||
| Normal | 2 | 0 | 7 | 2 | 0 | 8 | ||
| Accuracy | 66.7% | 70% | 70% | 75% | 70% | 80% | ||
| Trainee 2 | A–B | 8 | 2 | 1 | 5 | 3 | 1 | |
| C–D | 3 | 8 | 0 | 5 | 7 | 0 | ||
| Normal | 1 | 0 | 9 | 2 | 0 | 9 | ||
| Accuracy | 66.7% | 80% | 90% | 41.7% | 70% | 90% | ||
| Model 1 | Model 2 | Ps |
|---|---|---|
| GERD-VGGNet-NBI 1 | Trainee1-NBI | 1.281 |
| GERD-VGGNet-NBI | Trainee 2-NBI | 2.068 * |
| Trainee 1-NBI | Trainee 2-NBI | 0.823 |
| GERD-VGGNet-conventional | Trainee 1-conventional | 0.552 |
| GERD-VGGNet-conventional | Trainee 2-conventional | 0.293 |
| Trainee 1-conventional | Trainee 2-conventional | 0.842 |
| GERD-VGGNet-NBI | GERD-VGGNet -conventional | 1.281 |
| Trainee 1-NBI | Trainee 1-conventional | 0.552 |
| Trainee 2-NBI | Trainee 2-conventional | 1.112 |
| Task | Algorithm | Data Used | Evaluation Method | Overall Accuracy | Sensitivity | Specificity |
|---|---|---|---|---|---|---|
| Binary classification | Machine learning (ANN) [22] | QUID 1 questionnaire (577 GERD 2 patients, 94 normal cases) | hold-out | 99.2% | 99.1% | 99.8% |
| Binary classification | Machine learning (HHDF-SVM) [23] | 147 RGB images (39 GERD patients, 108 normal cases) | 10-fold cross-validation | 93.2% | 94.9% | 92.6% |
| Three-class classification | Deep learning + data augmentation (proposed GERD-VGGNet) | 603,068 NBI 3 images (GERD A–B: GERD C–D: normal EC-J = 244:229:198) | 10-fold cross validation | 98.9% ± 1% | 99.8% ± 0.2% | 99.7%± 0.2% |
Publisher’s Note: MDPI stays neutral with regard to jurisdictional claims in published maps and institutional affiliations. |
© 2021 by the authors. Licensee MDPI, Basel, Switzerland. This article is an open access article distributed under the terms and conditions of the Creative Commons Attribution (CC BY) license (http://creativecommons.org/licenses/by/4.0/).
Share and Cite
Wang, C.-C.; Chiu, Y.-C.; Chen, W.-L.; Yang, T.-W.; Tsai, M.-C.; Tseng, M.-H. A Deep Learning Model for Classification of Endoscopic Gastroesophageal Reflux Disease. Int. J. Environ. Res. Public Health 2021, 18, 2428. https://0-doi-org.brum.beds.ac.uk/10.3390/ijerph18052428
Wang C-C, Chiu Y-C, Chen W-L, Yang T-W, Tsai M-C, Tseng M-H. A Deep Learning Model for Classification of Endoscopic Gastroesophageal Reflux Disease. International Journal of Environmental Research and Public Health. 2021; 18(5):2428. https://0-doi-org.brum.beds.ac.uk/10.3390/ijerph18052428
Chicago/Turabian StyleWang, Chi-Chih, Yu-Ching Chiu, Wei-Liang Chen, Tzu-Wei Yang, Ming-Chang Tsai, and Ming-Hseng Tseng. 2021. "A Deep Learning Model for Classification of Endoscopic Gastroesophageal Reflux Disease" International Journal of Environmental Research and Public Health 18, no. 5: 2428. https://0-doi-org.brum.beds.ac.uk/10.3390/ijerph18052428