
Device-Measured and Self-Reported Active Travel Associations with Cardiovascular Disease Risk Factors in an Ethnically Diverse Sample of Adults

 ,
,
Abstract
:1. Introduction
2. Materials and Methods
2.1. Study Design and Participants
2.2. Exposure Variables
2.3. Outcome Assessments
2.4. Covariates
2.5. Statistical Analysis
3. Results
3.1. Sample Characteristics
3.2. AT Differences across Demographic Subgroups
3.3. Associations with Main Outcomes
4. Discussion
Strengths and Limitations
5. Conclusions
Author Contributions
Funding
Institutional Review Board Statement
Informed Consent Statement
Data Availability Statement
Acknowledgments
Conflicts of Interest
Appendix A

| Coef. | Std. Err. | p-Value | 95% CI | ||
|---|---|---|---|---|---|
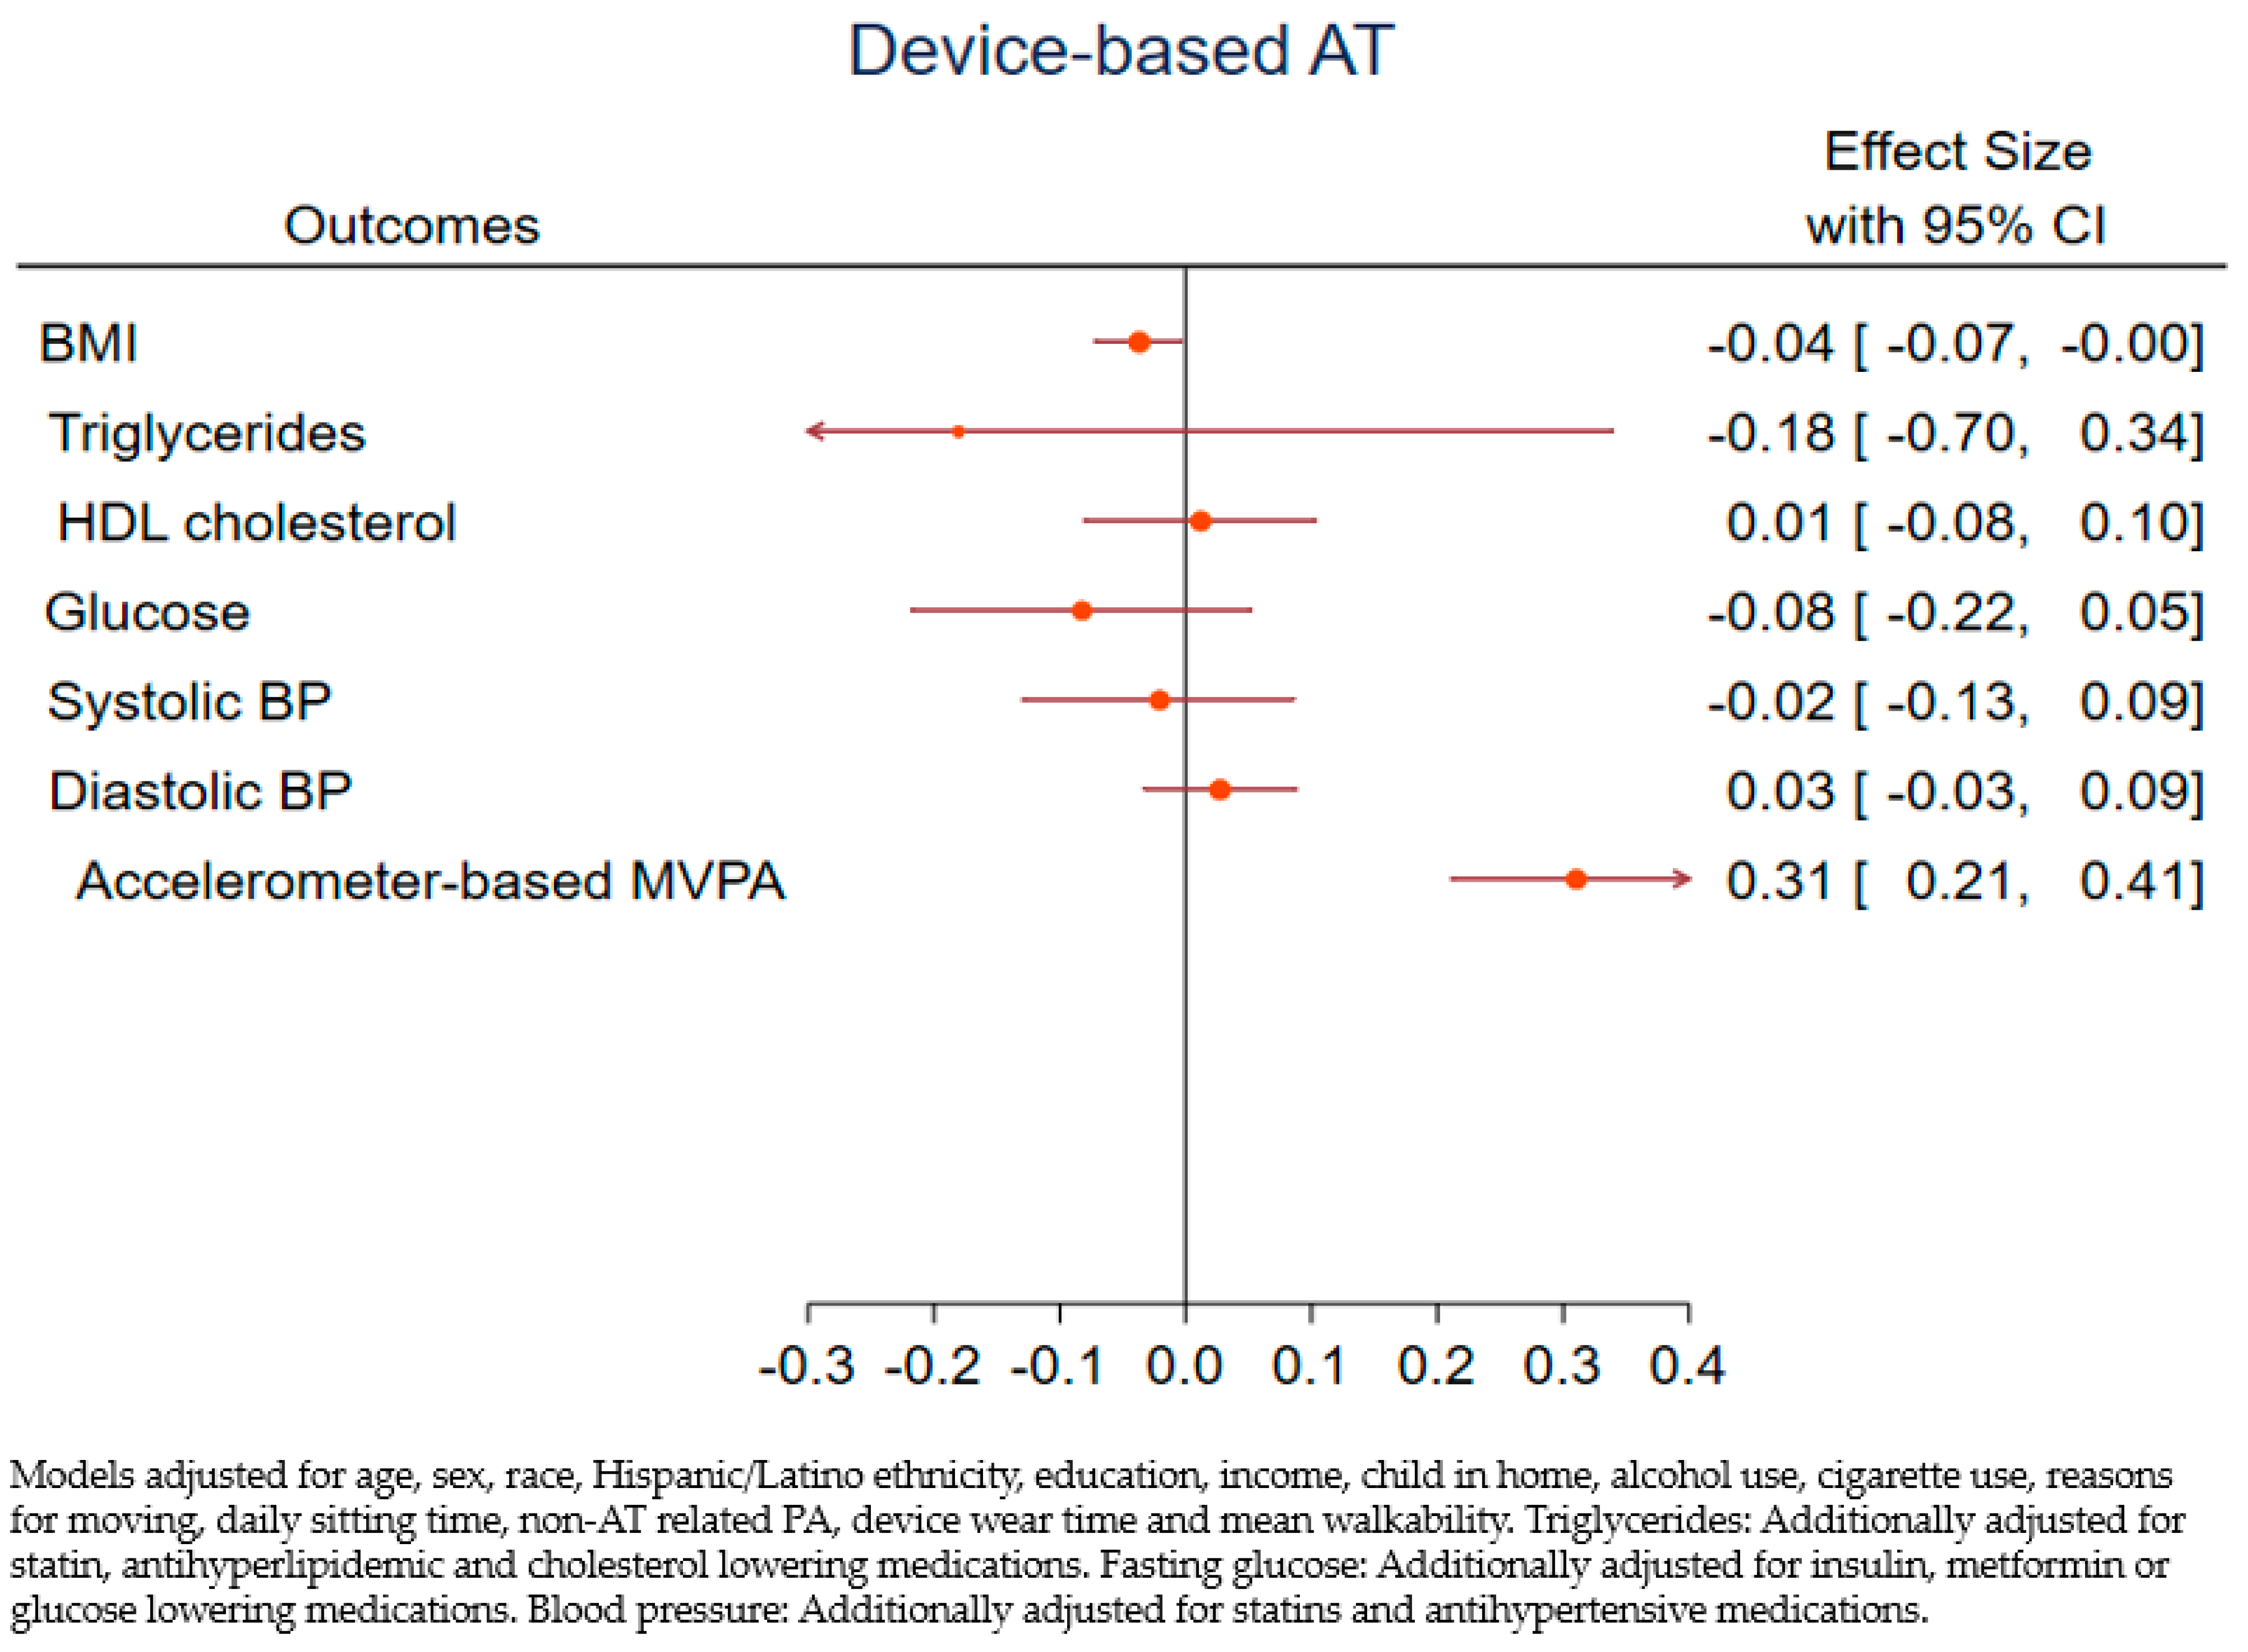
| BMI * | −0.04 | 0.02 | 0.031 | −0.07 | 0.00 |
| Triglycerides, Model 1 | −0.18 | 0.27 | 0.495 | −0.70 | 0.34 |
| Triglycerides, Model 2 | −0.08 | 0.26 | 0.759 | −0.60 | 0.44 |
| HDL cholesterol, Model 1 | 0.01 | 0.05 | 0.806 | −0.08 | 0.10 |
| HDL cholesterol, Model 2 | −0.02 | 0.04 | 0.582 | −0.11 | 0.06 |
| Glucose, Model 1 | −0.08 | 0.07 | 0.228 | −0.22 | 0.05 |
| Glucose, Model 2 | −0.07 | 0.07 | 0.316 | −0.20 | 0.07 |
| Systolic BP, Model 1 | −0.02 | 0.05 | 0.700 | −0.13 | 0.09 |
| Systolic BP, Model 2 | 0.01 | 0.05 | 0.903 | −0.10 | 0.11 |
| Diastolic BP, Model 1 | 0.03 | 0.03 | 0.384 | −0.03 | 0.09 |
| Diastolic BP, Model 2 | 0.04 | 0.03 | 0.181 | −0.02 | 0.10 |
| Coef. | Std. Err. | p-Value | 95% CI | ||
|---|---|---|---|---|---|
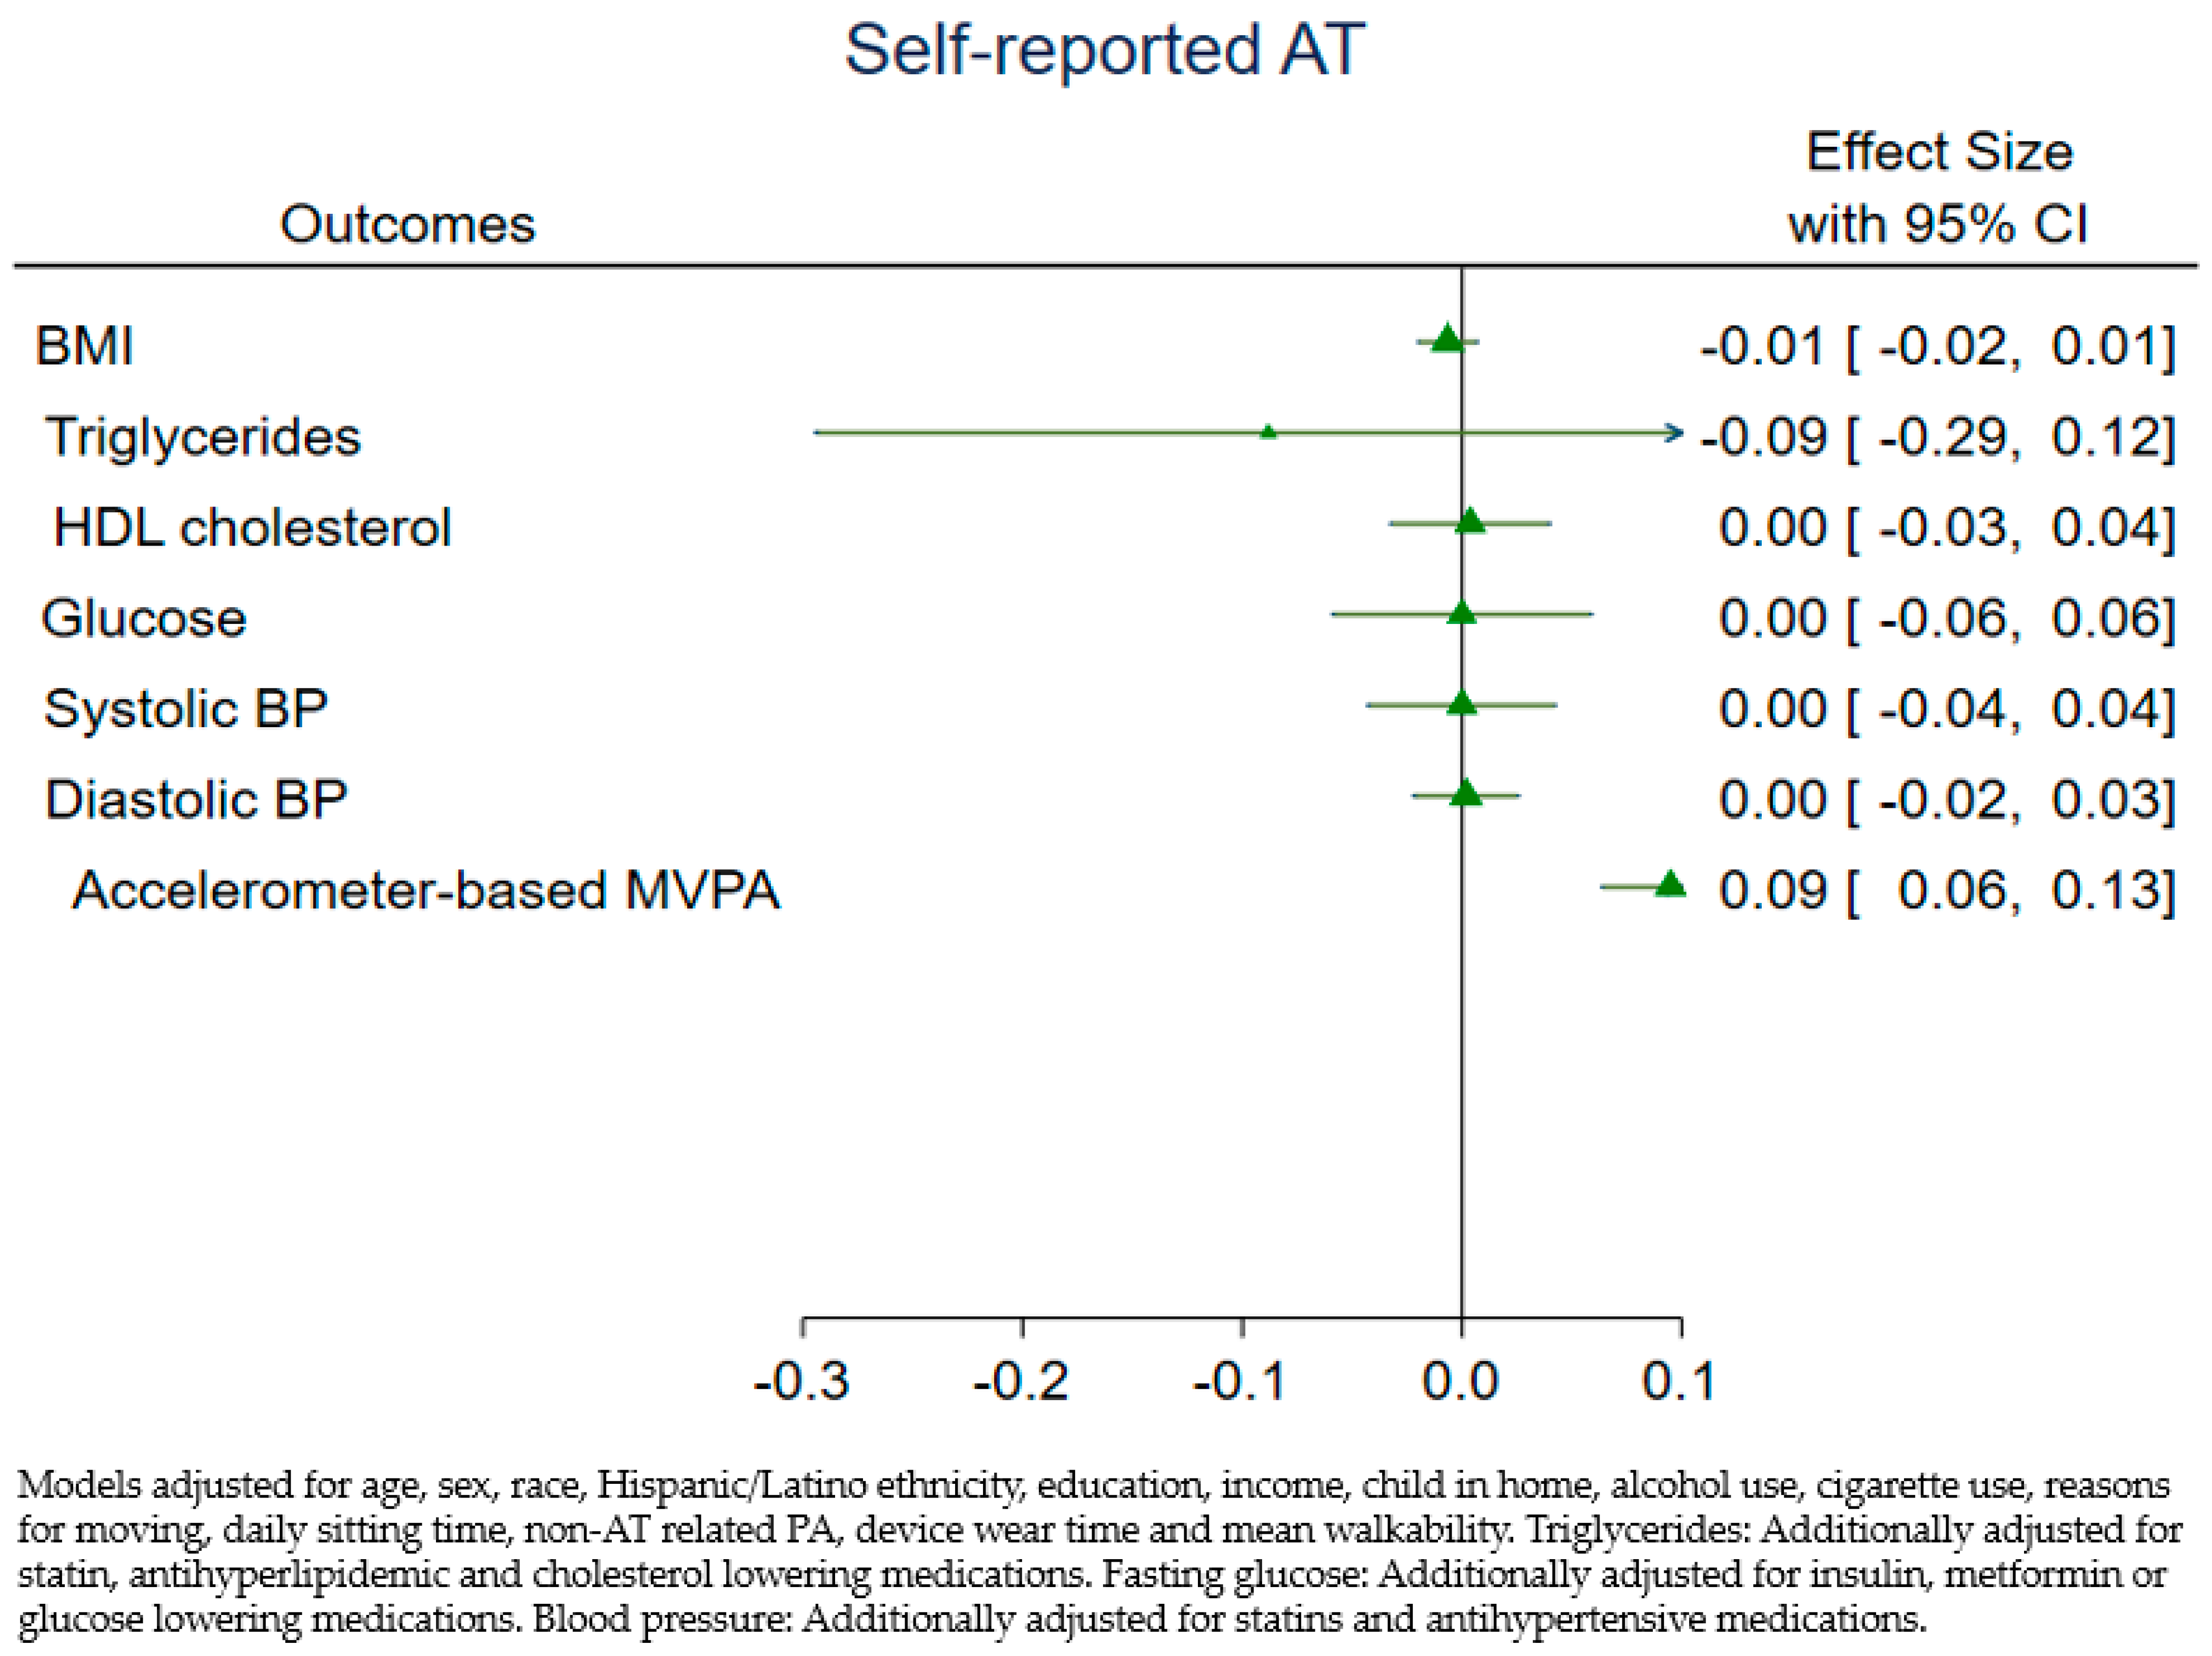
| BMI * | −0.01 | 0.01 | 0.345 | −0.02 | 0.01 |
| Triglycerides, Model 1 | −0.09 | 0.10 | 0.401 | −0.29 | 0.12 |
| Triglycerides, Model 2 | −0.07 | 0.10 | 0.482 | −0.277 | 0.13 |
| HDL cholesterol, Model 1 | 0.00 | 0.02 | 0.840 | −0.03 | 0.04 |
| HDL cholesterol, Model 2 | −0.00 | 0.02 | 0.920 | −0.04 | 0.03 |
| Glucose, Model 1 | −0.00 | −0.02 | 0.988 | −0.05 | 0.05 |
| Glucose, Model 2 | 0.00 | 0.03 | 0.949 | −0.05 | 0.05 |
| Systolic BP, Model 1 | −0.00 | 0.02 | 0.978 | −0.04 | 0.04 |
| Systolic BP, Model 2 | 0.00 | 0.02 | 0.879 | −0.04 | 0.04 |
| Diastolic BP, Model 1 | 0.00 | 0.01 | 0.879 | −0.02 | 0.03 |
| Diastolic BP, Model 2 | 0.00 | 0.01 | 0.755 | −0.02 | 0.03 |
References
- 2018 Physical Activity Guidelines Advisory Committee. 2018 Physical Activity Guidelines Advisory Committee Report; Department of Health and Human Services: Washington, DC, USA, 2018.
- Piercy, K.L.; Troiano, R.P.; Ballard, R.M.; Carlson, S.A.; Fulton, J.E.; Galuska, D.A.; George, S.M.; Olson, R.D. The physical activity guidelines for Americans. JAMA 2018, 320, 2020. [Google Scholar] [CrossRef] [PubMed]
- Global Health Risks: Mortality and Burden of Disease Attributable to Selected Major Risks. 2009. Available online: https://apps.who.int/iris/handle/10665/44203 (accessed on 3 March 2021).
- Lee, I.; Shiroma, E.; Lobelo, F.; Puska, P.; Blair, S.N.; Katzmarzyk, P.T. Lancet Physical Activity Series Working Group. Effect of physical inactivity on major non-communicable diseases worldwide: An analysis of burden of disease and life expectancy. Lancet 2012, 380, 219–229. [Google Scholar] [CrossRef] [Green Version]
- World Health Organization (WHO). Cardiovascular Diseases (CVDs). Available online: https://www.who.int/news-room/fact-sheets/detail/cardiovascular-diseases-(cvds) (accessed on 12 January 2020).
- Lloyd-Jones, D.M.; Hong, Y.; Labarthe, D.; Mozaffarian, D.; Appel, L.J.; Van Horn, L.; Greenlund, K.; Daniels, S.; Nichol, G.; Tomaselli, G.F.; et al. Defining and setting national goals for cardiovascular health promotion and disease reduction: The american heart association’s strategic impact goal through 2020 and beyond. Circulation 2010, 121, 586–613. [Google Scholar] [CrossRef] [Green Version]
- World Health Organization (WHO). Global Action Plan on Physical Activity 2018–2030; World Health Organization: Geneva, Switzerland, 2018. [Google Scholar]
- Guthold, R.; Stevens, G.A.; Riley, L.M.; Bull, F.C. Worldwide trends in insufficient physical activity from 2001 to 2016: A pooled analysis of 358 population-based surveys with 1·9 million participants. Lancet Glob. Health 2018, 6, e1077–e1086. [Google Scholar] [CrossRef] [Green Version]
- 2020 Measures|County Health Rankings & Roadmaps. Available online: https://www.countyhealthrankings.org/explore-health-rankings/measures-data-sources/2020 (accessed on 7 April 2021).
- Solomon, S.; Qin, D.; Manning, M.; Chen, Z.; Marquis, K.B.; Averyt, M.T.; Miller, H.L.M. IPCC (2007). Summary for policymakers. In Climate Change 2007: The Physical Science Basis. Contribution of Working Group I to the Fourth Assessment Report of the Intergovernmental Panel on Climate Change; Cambridge University Press: Cambridge, UK; New York, NY, USA, 2007. [Google Scholar]
- IPCC. Climate Change 2014: Impacts, Adaptation, and Vulnerability. Part A: Global and Sectoral Aspects. Contribution of Working Group II to the Fifth Assessment Report of the Intergovernmental Panel on Climate Change; Field, C.B., Barros, V.R., Dokken, D.J., Mach, K.J., Mastrandrea, M.D., Bilir, T.E., Chatterjee, M., Ebi, K.L., Estrada, Y.O., Genova, R.C., et al., Eds.; Cambridge University Press: Cambridge, UK; New York, NY, USA, 2014; p. 1132. [Google Scholar]
- USA EPA. Fast Facts on Transportation Greenhouse Gas Emissions. Available online: https://www.epa.gov/greenvehicles/fast-facts-transportation-greenhouse-gas-emissions (accessed on 6 April 2021).
- California Greenhouse Gas Emissions for 2000 to 2018. Trends of Emissions and Other Indicators. Available online: https://ww3.arb.ca.gov/cc/inventory/pubs/reports/2000_2018/ghg_inventory_trends_00-18.pdf (accessed on 7 December 2020).
- City of San Diego. Climate Action Plan 2018 Annual Report Appendix. Available online: https://www.sandiego.gov/sites/default/files/city_of_san_diego_appendix_for_2018_cap_annual_report_0.pdf (accessed on 7 December 2020).
- Giles-Corti, B.; Vernez-Moudon, A.; Reis, R.; Turrell, G.; Dannenberg, A.L.; Badland, H.; Foster, S.; Lowe, M.; Sallis, J.F.; Stevenson, M.; et al. City planning and population health: A global challenge. Lancet 2016, 388, 2912–2924. [Google Scholar] [CrossRef]
- International Society for Physical Activity and Health (ISPAH). ISPAH’s Eight Investments That Work for Physical Activity. November 2020. Available online: www.ISPAH.org/Resources (accessed on 6 April 2021).
- Sims, R.R.; Schaeffer, F.; Creutzig, X.; Cruz-Núñez, M.; D’Agosto, D.; Dimitriu, M.J.; Figueroa Meza, L.; Fulton, S.; Kobayashi, O.; Lah, A.; et al. Transport. In Climate Change 2014: Mitigation of Climate Change. Contribution of Working Group III to the Fifth Assessment Report of the Intergovernmental Panel on Climate Change; Cambridge University Press: Cambridge, UK; New York, NY, USA, 2014. [Google Scholar]
- National Household Travel Survey. Vehicle Trips, 2017. Available online: https://nhts.ornl.gov/vehicle-trips (accessed on 6 April 2021).
- Lachapelle, U.; Frank, L.; Saelens, B.E.; Sallis, J.F.; Conway, T.L. Commuting by public transit and physical activity: Where you live, where you work, and how you get there. J. Phys. Act. Health 2011, 8 (Suppl. S1), S72–S82. [Google Scholar] [CrossRef]
- Audrey, S.; Procter, S.; Cooper, A.R. The contribution of walking to work to adult physical activity levels: A cross sectional study. Int. J. Behav. Nutr. Phys. Act. 2014, 11, 37. [Google Scholar] [CrossRef] [Green Version]
- Foley, L.; Panter, J.; Heinen, E.; Prins, R.; Ogilvie, D. Changes in active commuting and changes in physical activity in adults: A cohort study. Int. J. Behav. Nutr. Phys. Act. 2015, 12, 161. [Google Scholar] [CrossRef] [PubMed] [Green Version]
- Brown, B.B.; Tharp, D.; Smith, K.R.; Jensen, W.A. Objectively measured active travel and uses of activity-friendly neighborhood resources: Does change in use relate to change in physical activity and BMI? Prev. Med. Rep. 2017, 8, 60–66. [Google Scholar] [CrossRef]
- Chaix, B.; Kestens, Y.; Duncan, S.; Merrien, C.; Thierry, B.; Pannier, B.; Brondeel, R.; Lewin, A.; Karusisi, N.; Perchoux, C.; et al. Active transportation and public transportation use to achieve physical activity recommendations? A combined GPS, accelerometer, and mobility survey study. Int. J. Behav. Nutr. Phys. Act. 2014, 11, 124. [Google Scholar] [CrossRef]
- Rissel, C.; Curac, N.; Greenaway, M.; Bauman, A. Physical activity associated with public transport use—A review and modelling of potential benefits. Int. J. Environ. Res. Public Health 2012, 9, 2454–2478. [Google Scholar] [CrossRef] [PubMed] [Green Version]
- Zwald, M.L.; Fakhouri, T.H.I.; Fryar, C.D.; Whitfield, G.; Akinbami, L.J. Trends in active transportation and associations with cardiovascular disease risk factors among U.S. adults, 2007–2016. Prev. Med. 2018, 116, 150–156. [Google Scholar] [CrossRef]
- Schäfer, C.; Mayr, B.; Fernandez La Puente de Battre, M.D.; Reich, B.; Schmied, C.; Loidl, M.; Niederseer, D.; Niebauer, J. Health effects of active commuting to work: The available evidence before GISMO. Scand. J. Med. Sci. Sport. 2020, 30, 8–14. [Google Scholar] [CrossRef] [PubMed]
- Vaara, J.P.; Vasankari, T.; Fogelholm, M.; Koski, H.; Kyröläinen, H. Cycling but not walking to work or study is associated with physical fitness, body composition and clustered cardiometabolic risk in young men. BMJ Open Sport Exerc. Med. 2020, 6, 668. [Google Scholar] [CrossRef] [PubMed] [Green Version]
- Panter, J.; Mytton, O.; Brage, S.; Cummins, S.; Wijndaele, K.; Ogilvie, D. Using alternatives to the car and risk of all-cause, cardiovascular and cancer mortality Cardiac risk factors and prevention. Heart 2018, 104, 1749–1755. [Google Scholar] [CrossRef] [PubMed]
- Celis-Morales, C.A.; Lyall, D.M.; Welsh, P.; Anderson, J.; Steell, L.; Guo, Y.; Maldonado, R.; Mackay, D.F.; Pell, J.P.; Sattar, N.; et al. Association between active commuting and incident cardiovascular disease, cancer, and mortality: Prospective cohort study. BMJ 2017, 357, j1456. [Google Scholar] [CrossRef] [PubMed] [Green Version]
- Flint, E.; Cummins, S. Active commuting and obesity in mid-life: Cross-sectional, observational evidence from UK Biobank. Lancet Diabetes Endocrinol. 2016, 4, 420–435. [Google Scholar] [CrossRef] [Green Version]
- Gordon-Larsen, P.; Boone-Heinonen, J.; Sidney, S.; Sternfeld, B.; Jacobs, D.R.; Lewis, C.E. Active commuting and cardiovascular disease risk: The CARDIA study. Arch. Intern. Med. 2009, 169, 1216–1223. [Google Scholar] [CrossRef] [Green Version]
- Hamer, M.; Chida, Y. Active commuting and cardiovascular risk: A meta-analytic review. Prev. Med. 2008, 46, 9–13. [Google Scholar] [CrossRef]
- Von Huth Smith, L.; Borch-Johnsen, K.; Jørgensen, T. Commuting physical activity is favourably associated with biological risk factors for cardiovascular disease. Eur. J. Epidemiol. 2007, 22, 771–779. [Google Scholar] [CrossRef]
- Lee, P.H.; Macfarlane, D.J.; Lam, T.H.; Stewart, S.M. Validity of the international physical activity questionnaire short form (IPAQ-SF): A systematic review. Int. J. Behav. Nutr. Phys. Act. 2011, 8, 115. [Google Scholar] [CrossRef] [Green Version]
- James, P.; Weissman, J.; Wolf, J.; Mumford, K.; Contant, C.K.; Hwang, W.T.; Taylor, L.; Glanz, K. Comparing GPS, log, survey, and accelerometry to measure physical activity. Am. J. Health Behav. 2016, 40, 123–131. [Google Scholar] [CrossRef] [Green Version]
- Metcalf, K.M.; Baquero, B.I.; Coronado Garcia, M.L.; Francis, S.L.; Janz, K.F.; Laroche, H.H.; Sewell, D.K. Calibration of the global physical activity questionnaire to Accelerometry measured physical activity and sedentary behavior. BMC Public Health 2018, 18, 412. [Google Scholar] [CrossRef]
- Troiano, R.P.; Berrigan, D.; Dodd, K.W.; Masse, L.; Tilert, T.; McDowell, M. Physical activity in the United States measured by accelerometer. Med. Sci. Sports Exerc. 2008, 40, 181–188. [Google Scholar] [CrossRef]
- Zenko, Z.; Willis, E.A.; White, D.A. Proportion of adults meeting the 2018 physical activity guidelines for americans according to accelerometers. Front. Public Health 2019, 7, 135. [Google Scholar] [CrossRef] [Green Version]
- Du, Y.; Liu, B.; Sun, Y.; Snetselaar, L.G.; Wallace, R.B.; Bao, W. Trends in Adherence to the physical activity guidelines for americans for aerobic activity and time spent on sedentary behavior among US Adults, 2007 to 2016. JAMA Netw. Open 2019, 2, e197597. [Google Scholar] [CrossRef] [PubMed] [Green Version]
- Strath, S.J.; Kaminsky, L.A.; Ainsworth, B.E.; Ekelund, U.; Freedson, P.S.; Gary, R.A.; Richardson, C.R.; Smith, D.T.; Swartz, A.M. Guide to the assessment of physical activity: Clinical and research applications: A scientific statement from the American Heart association. Circulation 2013, 128, 2259–2279. [Google Scholar] [CrossRef] [PubMed]
- Jankowska, M.; Schipperijn, J.; Kerr, J. A framework for using GPS data in physical activity and sedentary behavior studies. Exerc. Sport Sci. Rev. 2015, 43, 48–56. [Google Scholar] [CrossRef] [PubMed] [Green Version]
- Carlson, J.A.; Jankowska, M.M.; Meseck, K.; Godbole, S.; Natarajan, L.; Raab, F.; Demchak, B.; Patrick, K.; Kerr, J. Validity of PALMS GPS scoring of active and passive travel compared with SenseCam. Med. Sci. Sports Exerc. 2015, 47, 662–667. [Google Scholar] [CrossRef] [PubMed] [Green Version]
- Procter, D.S.; Page, A.S.; Cooper, A.R.; Nightingale, C.M.; Ram, B.; Rudnicka, A.R.; Whincup, P.H.; Clary, C.; Lewis, D.; Cummins, S.; et al. An open-source tool to identify active travel from hip-worn accelerometer, GPS and GIS data. Int. J. Behav. Nutr. Phys. Act. 2018, 15, 1–10. [Google Scholar] [CrossRef]
- Brondeel, R.; Pannier, B.; Chaix, B. Using GPS, GIS, and accelerometer data to predict transportation modes. Med. Sci. Sports Exerc. 2015, 47, 2669–2675. [Google Scholar] [CrossRef]
- Ellis, K.; Godbole, S.; Marshall, S.; Lanckriet, G.; Staudenmayer, J.; Kerr, J. Identifying active travel behaviors in challenging environments using GPS, accelerometers, and machine learning algorithms. Front. Public Health 2014, 2, 36. [Google Scholar] [CrossRef] [Green Version]
- Stappers, N.E.H.; Schipperijn, J.; Kremers, S.P.J.; Bekker, M.P.M.; Jansen, M.W.J.; De Vries, N.K.; Van Kann, D.H.H. Combining accelerometry and GPS to assess neighborhood-based physical activity: Associations with perceived neighborhood walkability. Environ. Behav. 2020, 1–21. [Google Scholar] [CrossRef]
- de Moraes Ferrari, G.L.; Kovalskys, I.; Fisberg, M.; Gómez, G.; Rigotti, A.; Sanabria, L.Y.C.; García, M.C.Y.; Torres, R.G.P.; Herrera-Cuenca, M.; Zimberg, I.Z.; et al. Comparison of self-report versus accelerometer-measured physical activity and sedentary behaviors and their association with body composition in Latin American countries. PLoS ONE 2020, 15, e0232420. [Google Scholar]
- Celis-Morales, C.A.; Perez-Bravo, F.; Ibañez, L.; Salas, C.; Bailey, M.E.S.; Gill, J.M.R. Objective vs. self-reported physical activity and sedentary time: Effects of measurement method on relationships with risk biomarkers. PLoS ONE 2012, 7, e36345. [Google Scholar] [CrossRef] [PubMed]
- Tucker, J.M.; Welk, G.J.; Beyler, N.K.; Kim, Y. Associations between physical activity and metabolic syndrome: Comparison between self-report and accelerometry. Am. J. Health Promot. 2016, 30, 155–162. [Google Scholar] [CrossRef]
- Atienza, A.A.; Moser, R.P.; Perna, F.; Dodd, K.; Ballard-Barbash, R.; Troiano, R.P.; Berrigan, D. Self-reported and objectively measured activity related to biomarkers using NHANES. Med. Sci. Sports Exerc. 2011, 43, 815–821. [Google Scholar] [CrossRef]
- U.S. Census Bureau QuickFacts. Available online: https://www.census.gov/quickfacts/fact/table/US/PST045219 (accessed on 1 March 2021).
- Colby, S.L.; Ortman, J.M. Projections of the Size and Composition of the U.S. Population: 2014 to 2060, Current Population Reports, P25-1143; U.S. Census Bureau: Washington, DC, USA, 2014.
- Rodriguez, C.J. Disparities in ideal cardiovascular health: A challenge or an opportunity? Circulation 2012, 125, 2963–2964. [Google Scholar] [CrossRef] [PubMed] [Green Version]
- Rodriguez, C.J.; Allison, M.; Daviglus, M.L.; Isasi, C.R.; Keller, C.; Leira, E.C.; Palaniappan, L.; Piña, I.L.; Ramirez, S.M.; Rodriguez, B.; et al. Status of cardiovascular disease and stroke in hispanics/latinos in the United States a science advisory from the american heart association. Circulation 2014, 130, 593–625. [Google Scholar] [CrossRef] [Green Version]
- Balfour, P.C.; Ruiz, J.M.; Talavera, G.A.; Allison, M.A.; Rodriguez, C.J. Cardiovascular disease in Hispanics/Latinos in the United States. J. Lat. Psychol. 2016, 4, 98–113. [Google Scholar] [CrossRef]
- Menke, A.; Rust, K.F.; Savage, P.J.; Cowie, C.C. Hemoglobin A1c, fasting plasma glucose, and 2-hour plasma glucose distributions in U.S. population subgroups: NHANES 2005–2010. Ann. Epidemiol. 2014, 24, 83–89. [Google Scholar] [CrossRef] [PubMed] [Green Version]
- Strauss, J.; Miranda-Moreno, L.F.; Morency, P. Mapping cyclist activity and injury risk in a network combining smartphone GPS data and bicycle counts. Accid. Anal. Prev. 2015, 83, 132–142. [Google Scholar] [CrossRef]
- Jankowska, M.M.; Sears, D.D.; Natarajan, L.; Martinez, E.; Anderson, C.A.M.; Sallis, J.F.; Matthews, S.A.; Crist, K.; Dillon, L.; Johnson, E.; et al. Protocol for a cross sectional study of cancer risk, environmental exposures and lifestyle behaviors in a diverse community sample: The Community of mine study. BMC Public Health 2019, 19, 186. [Google Scholar] [CrossRef] [PubMed]
- Choi, L.; Ward, S.C.; Schnelle, J.F.; Buchowski, M.S. Assessment of wear/nonwear time classification algorithms for triaxial accelerometer. Med. Sci. Sports Exerc. 2012, 44, 2009–2016. [Google Scholar] [CrossRef] [Green Version]
- Meseck, K.; Jankowska, M.M.; Schipperijn, J.; Natarajan, L.; Godbole, S.; Carlson, J.A.; Takemoto, M.; Crist, K.; Kerr, J. Is missing geographic position system (GPS) data in accelerometry studies a problem, and is imputation the solution? Geospat. Health 2016, 11, 157–163. [Google Scholar] [CrossRef] [Green Version]
- Kerr, J.; Duncan, S.; Schipperjin, J. Using global positioning systems in health research: A practical approach to data collection and processing. Am. J. Prev. Med. 2011, 41, 532–540. [Google Scholar] [CrossRef]
- Craig, C.L.; Marshall, A.L.; Sjöström, M.; Bauman, A.E.; Booth, M.L.; Ainsworth, B.E.; Pratt, M.; Ekelund, U.; Yngve, A.; Sallis, J.F.; et al. International physical activity questionnaire: 12-Country reliability and validity. Med. Sci. Sports Exerc. 2003, 35, 1381–1395. [Google Scholar] [CrossRef] [Green Version]
- Guidelines for Data Processing and Analysis of the International Physical Activity Questionnaire (IPAQ)-Short and Long Forms. 2005. Available online: http://www.ipaq.ki.se/scoring.pdf (accessed on 6 April 2021).
- Mottillo, S.; Filion, K.B.; Genest, J.; Joseph, L.; Pilote, L.; Poirier, P.; Rinfret, S.; Schiffrin, E.L.; Eisenberg, M.J. The metabolic syndrome and cardiovascular risk: A systematic review and meta-analysis. J. Am. Coll. Cardiol. 2010, 56, 1113–1132. [Google Scholar] [CrossRef] [Green Version]
- Sallis, J.F.; Saelens, B.E.; Frank, L.D.; Conway, T.L.; Slymen, D.J.; Cain, K.L.; Chapman, J.E.; Kerr, J. Neighborhood built environment and income: Examining multiple health outcomes. Soc. Sci. Med. 2009, 68, 1285–1293. [Google Scholar] [CrossRef] [Green Version]
- Frank, L.; Saelens, B.E.; Powell, K.E.; Chapman, J.E. Stepping towards causation: Do built environments or neighborhood and travel prefereences explain physical activity, driving and obesity? Soc. Sci. Med. 2007, 65, 1898–1914. [Google Scholar] [CrossRef] [PubMed]
- Kerr, J.; Marinac, C.R.; Ellis, K.; Godbole, S.; Hipp, A.; Glanz, K.; Mitchell, J.; Laden, F.; James, P.; Berrigan, D. Comparison of Accelerometry Methods for Estimating Physical Activity. Med. Sci. Sports Exerc. 2017, 49, 617–624. [Google Scholar] [CrossRef] [Green Version]
- Jankowska, M.; Natarajan, L.; Godbole, S.; Meseck, K.; Sears, D.; Patterson, R.; Kerr, J. Kernel density estimation as a measure of environmental exposure related to insulin resistance in breast cancer survivors. Cancer Epidemiol. Biomarkers Prev. 2017, 26, 1078–1084. [Google Scholar] [CrossRef] [Green Version]
- Kruskal, W.H.; Wallis, W.A. Use of Ranks in one-criterion variance analysis. J. Am. Stat. Assoc. 1952, 47, 583–621. [Google Scholar] [CrossRef]
- Hidalgo, B.; Goodman, M. Multivariate or multivariable regression? Am. J. Public Health 2013, 103, 39–40. [Google Scholar] [CrossRef] [PubMed]
- Furie, G.L.; Desai, M.M. Active Transportation and cardiovascular disease risk Factors in U.S. Adults. Am. J. Prev. Med. 2012, 43, 621–628. [Google Scholar] [CrossRef] [PubMed]
- Berger, A.T.; Qian, X.L.; Pereira, M.A. Associations between bicycling for transportation and cardiometabolic risk factors among minneapolis–saint paul area commuters: A cross-sectional study in working-age adults. Am. J. Health Promot. 2018, 32, 631–637. [Google Scholar] [CrossRef] [PubMed]
- Safi, H.; Mesbah, M.; Ferreira, L. Enhancing travel data collection with an emphasis on active transport. J. Traffic Logist. Eng. 2016, 4, 117–127. [Google Scholar] [CrossRef] [Green Version]
- Shen, L.; Stopher, P.R.; Shen, L.I. Transport reviews a transnational transdisciplinary journal review of gps travel survey and GPS Data-processing methods review of GPS travel survey and GPS data-processing methods. Transp. Rev. 2014, 34. [Google Scholar] [CrossRef]
- Sahlqvist, S.; Goodman, A.; Cooper, A.R.; Ogilvie, D. Change in active travel and changes in recreational and total physical activity in adults: Longitudinal findings from the iConnect study. Int. J. Behav. Nutr. Phys. Act. 2013, 10, 28. [Google Scholar] [CrossRef] [PubMed] [Green Version]
- Donaire-Gonzalez, D.; de Nazelle, A.; Cole-Hunter, T.; Curto, A.; Rodriguez, D.A.; Mendez, M.A.; Garcia-Aymerich, J.; Basagaña, X.; Ambros, A.; Jerrett, M.; et al. The Added Benefit of Bicycle Commuting on the Regular Amount of Physical Activity Performed. Am. J. Prev. Med. 2015, 49, 842–849. [Google Scholar] [CrossRef]
- Foley, L.; Dumuid, D.; Atkin, A.J.; Olds, T.; Ogilvie, D. Patterns of health behaviour associated with active travel: A compositional data analysis. Int. J. Behav. Nutr. Phys. Act. 2018, 15, 26. [Google Scholar] [CrossRef]
- Kheiri, B.; Abdalla, A.; Osman, M.; Ahmed, S.; Hassan, M.; Bachuwa, G. Vitamin D deficiency and risk of cardiovascular diseases: A narrative review. Clin. Hypertens. 2018, 24. [Google Scholar] [CrossRef]
- Thompson Coon, J.; Boddy, K.; Stein, K.; Whear, R.; Barton, J.; Depledge, M.H. Does participating in physical activity in outdoor natural environments have a greater effect on physical and mental wellbeing than physical activity indoors? A systematic review. Environ. Sci. Technol. 2011, 45, 1761–1772. [Google Scholar] [CrossRef]
- Dalton, A.M.; Jones, A.P. Residential neighbourhood greenspace is associated with reduced risk of cardiovascular disease: A prospective cohort study. PLoS ONE 2020, 15, e0226524. [Google Scholar] [CrossRef] [Green Version]
- Lawton, E.; Brymer, E.; Clough, P.; Denovan, A. The relationship between the physical activity environment, nature relatedness, anxiety, and the psychological well-being benefits of regular exercisers. Front. Psychol. 2017, 8, 1058. [Google Scholar] [CrossRef] [Green Version]
- Gladwell, V.F.; Brown, D.K.; Wood, C.; Sandercock, G.R.; Barton, J.L. The great outdoors: How a green exercise environment can benefit all. Extrem. Physiol. Med. 2013, 2, 3. [Google Scholar] [CrossRef] [Green Version]
- South, E.C.; Kondo, M.C.; Cheney, R.A.; Branas, C.C. Neighborhood blight, stress, and health: A walking trial of urban greening and ambulatory heart rate. Am. J. Public Health 2015, 105, 909–913. [Google Scholar] [CrossRef]
- Panter, J.; Costa, S.; Dalton, A.; Jones, A.; Ogilvie, D. Development of methods to objectively identify time spent using active and motorised modes of travel to work: How do self-reported measures compare? Int. J. Behav. Nutr. Phys. Act. 2014, 11, 116. [Google Scholar] [CrossRef] [PubMed] [Green Version]
- Climate San Diego-California and Weather Averages San Diego. Available online: https://www.usclimatedata.com/climate/san-diego/california/united-states/usca0982 (accessed on 6 April 2021).
- Dinu, M.; Pagliai, G.; Macchi, C.; Sofi, F. Active commuting and multiple health outcomes: A systematic review and meta-analysis. Sport. Med. 2019, 49, 437–452. [Google Scholar] [CrossRef]
- Evenson, K.R.; Herring, A.H.; Wen, F. Self-reported and objectively measured physical activity among a cohort of postpartum women: The PIN postpartum study. J. Phys. Act. Heal. 2012, 9, 5–20. [Google Scholar] [CrossRef] [Green Version]
- Shiroma, E.J.; Cook, N.R.; Manson, J.E.; Buring, J.E.; Rimm, E.B.; Lee, I.-M. Comparison of self-reported and accelerometer-assessed physical activity in older women. PLoS ONE 2015, 10, e0145950. [Google Scholar] [CrossRef]
- Quam, V.G.M.; Rocklöv, J.; Quam, M.B.M.; Lucas, R.A.I. Assessing greenhouse gas emissions and health co-benefits: A structured review of lifestyle-related climate change mitigation strategies. Int. J. Environ. Res. Public Health 2017, 14, 468. [Google Scholar] [CrossRef]
- United Nations THE 17 GOALS|Sustainable Development. Available online: https://sdgs.un.org/goals (accessed on 6 April 2021).


| Total n = 598 | Female n = 332 | Male n = 266 | |
|---|---|---|---|
| Age (years) a | 58.8 ± 10.9 | 57.5 ± 10.7 | 60.5 ± 10.9 |
| College or above education | 497 (83.7) | 263 (79.7) | 234 (88.6) |
| Work or volunteer outside of home | 401 (67.1) | 229 (69.0) | 172 (64.7) |
| Income > $55,000 | 278 (48.4) | 131 (40.9) | 147 (57.7) |
| Hispanic/Latino ethnicity | 248 (41.5) | 151 (45.5) | 97 (36.5) |
| Race | |||
| White | 421 (70.4) | 228 (68.7) | 193 (72.6) |
| African American | 18 (3.0) | 8 (2.4) | 10 (3.8) |
| Asian | 23 (3.8) | 12 (3.6) | 11 (4.1) |
| Native American | 25 (4.2) | 13 (3.9) | 12 (4.5) |
| Other/Unknown | 111 (18.6) | 71 (21.4) | 40 (15.0) |
| Child < 18 years in household | 155 (25.9) | 99 (29.8) | 56 (21.1) |
| Access to vehicle | 569 (95.8) | 318 (96.4) | 251 (95.1) |
| Current smoker | 45 (7.6) | 20 (6.1) | 25 (9.5) |
| Consumes alcohol | 392 (66.3) | 198 (60.2) | 194 (74.1) |
| Valid device wear days a | 13.8 ± 2.0 | 13.5 ± 2.1 | 14.0 ± 1.8 |
| Average device wear time (min/day) a | 861.5 ± 75.0 | 852.5 (97.7) | 867.3 (101.0) |
| Device measured AT (min/day) b | 14.0 (18.7) | 13.4 (17.4) | 14.7 (20.5) |
| Device measured MVPA during AT trips (min/day) b | 4.4 (11.6) | 4.3 (10.5) | 4.4 (12.2) |
| Self-reported PA by domain (min/day) b | |||
| AT | 8.6 (30) | 7.1 (28.6) | 8.6 (39.3) |
| Work | 0.0 (25.7) | 0.0 (20.7) | 0.0 (29.0) |
| Recreational | 27.1 (61.4) | 25.7 (61.4) | 30.7 (62.9) |
| Home | 38.6 (90) | 50.7 (121.1) | 28.6 (77.1) |
| Total accelerometer measured MVPA (min/day) b | 21.4 (28.8) | 17.8 (27.3) | 25.7 (27.8) |
| Total self-reported MVPA (min/day) b | 148.2 (220) | 161.8 (224.3) | 140.7 (186.4) |
| >150 min/wk of accelerometer MVPA | 300 (50.2) | 148 (44.6) | 152 (57.1) |
| CVD risk factors | |||
| BMI (kg/m2) a | 28.6 ± 5.9 | 28.4 ± 6.6 | 28.9 ± 4.8 |
| HDL cholesterol (mg/dL) a | 58.7 ± 17.5 | 64.4 ± 34.7 | 51.8 ± 14.4 |
| Triglycerides (mg/dL) b | 96.0 (68.5) | 92.5 (65.0) | 99.5 (71.0) |
| Systolic blood pressure (mg/dL) a | 131.0 ± 19.8 | 128.3 20.4 | 134.3 18.5 |
| Diastolic blood pressure (mg/dL) a | 73.7 ± 10.8 | 70.5 ± 10.1 | 77.6 ± 10.2 |
| Glucose (mg/dL) a | 104.5 ± 28.3 | 102.9 ± 29.9 | 106.3 ± 26.2 |
| Device-Assessed AT | p-Value | Self-Reported AT | p-Value | |
|---|---|---|---|---|
| Hispanic Ethnicity | 0.000 | 0.067 | ||
| Hispanic | 11.0 (15.4) | 10 (40.0) | ||
| Non-Hispanic | 15.8 (21.8) | 7.1 (28.6) | ||
| Age (years) | 0.589 | 0.745 | ||
| 35–49 | 13.1 (16.9) | 5.7 (27.9) | ||
| 50–64 | 13.8 (17.9) | 8.6 (34.3) | ||
| 65–80 | 15.1 (21.4) | 8.6 (34.3) | ||
| Sex | 0.093 | 0.098 | ||
| Female | 13.4 (17.4) | 7.1 (28.6) | ||
| Male | 14.7 (20.5) | 8.6 (39.3) | ||
| Race | 0.030 | 0.653 | ||
| White | 15.2 (20.2) | 8.6 (30.0) | ||
| African American | 11.4 (17.3) | 13.6 (50.7) | ||
| Asian | 14.4 (28.3) | 3.4 (28.6) | ||
| Native American | 9.9 (11.4) | 4.3 (38.6) | ||
| Other/Unknown | 10.2 (15.6) | 5.7 (30.0) | ||
| Education | 0.004 | 0.431 | ||
| College or above | 14.7 (19.4) | 7.1 (30.0) | ||
| High school or less | 10.5 (15.9) | 11.4 (30) | ||
| Income | 0.004 | 0.171 | ||
| >$55,000 | 16.1 (22.8) | 6.4 (30.0) | ||
| ≤$55,000 | 12.3 (16.3) | 10.0 (34.3) | ||
| Employed | 0.551 | 0.537 | ||
| Yes | 13.3 (17.1) | 7.1 (30.0) | ||
| No | 15.0 (20.5) | 8.6 (38.6) | ||
| Child < 18 years in household | 0.458 | 0.443 | ||
| Yes | 13.4 (16.8) | 7.1 (28.6) | ||
| No | 14.1 (20.2) | 8.6 (34.3) | ||
| Access to vehicle | 0.666 | 0.000 | ||
| Yes | 13.9 (18.7) | 7.1 (30.0) | ||
| No | 15.1 (18.4) | 34.3 (111.4) | ||
| BMI (kg/m2) | 0.004 | 0.422 | ||
| <25 | 14.7 (20.1) | 10 (30.0) | ||
| 25–29.9 | 16.0 (20.2) | 8.6 (34.3) | ||
| ≥30 | 11.9 (14.6) | 6.4 (30.0) | ||
| Device weartime (min/day) | 0.520 | 0.439 | ||
| ≥858 | 13.9 (20.3) | 8.6 (30.0) | ||
| <858 | 14.1 (17.3) | 8.6 (30) | ||
| Walkability (KDE) | 0.138 | 0.402 | ||
| Quartile 1 | 15.9 (22.3) | 6.1 (30.0) | ||
| Quartile 2 | 11.4 (17.2) | 10.0 (40.0) | ||
| Quartile 3 | 14.1 (17.7) | 8.6 (30.0) | ||
| Quartile 4 | 13.8 (20.1) | 7.1 (25.7) |
Publisher’s Note: MDPI stays neutral with regard to jurisdictional claims in published maps and institutional affiliations. |
© 2021 by the authors. Licensee MDPI, Basel, Switzerland. This article is an open access article distributed under the terms and conditions of the Creative Commons Attribution (CC BY) license (https://creativecommons.org/licenses/by/4.0/).
Share and Cite
Crist, K.; Benmarhnia, T.; Zamora, S.; Yang, J.-A.; Sears, D.D.; Natarajan, L.; Dillon, L.; Sallis, J.F.; Jankowska, M.M. Device-Measured and Self-Reported Active Travel Associations with Cardiovascular Disease Risk Factors in an Ethnically Diverse Sample of Adults. Int. J. Environ. Res. Public Health 2021, 18, 3909. https://0-doi-org.brum.beds.ac.uk/10.3390/ijerph18083909
Crist K, Benmarhnia T, Zamora S, Yang J-A, Sears DD, Natarajan L, Dillon L, Sallis JF, Jankowska MM. Device-Measured and Self-Reported Active Travel Associations with Cardiovascular Disease Risk Factors in an Ethnically Diverse Sample of Adults. International Journal of Environmental Research and Public Health. 2021; 18(8):3909. https://0-doi-org.brum.beds.ac.uk/10.3390/ijerph18083909
Chicago/Turabian StyleCrist, Katie, Tarik Benmarhnia, Steven Zamora, Jiue-An Yang, Dorothy D. Sears, Loki Natarajan, Lindsay Dillon, James F. Sallis, and Marta M. Jankowska. 2021. "Device-Measured and Self-Reported Active Travel Associations with Cardiovascular Disease Risk Factors in an Ethnically Diverse Sample of Adults" International Journal of Environmental Research and Public Health 18, no. 8: 3909. https://0-doi-org.brum.beds.ac.uk/10.3390/ijerph18083909