
Muscle Performance Changes with Age in Active Women

 , , , and
Abstract
:1. Introduction
2. Materials and Methods
2.1. Participants
2.2. Study Design
2.3. Bioimaging Assessments
2.4. Hand Grip Strength and Jump Performance
2.5. Dynamometric Performance Assessments
2.6. Statistical Analyses
3. Results
3.1. Participants
3.2. Hand Grip Strength and Vertical Jump Performance
3.3. Dynamometric Muscle Performance
4. Discussion
5. Conclusions
Supplementary Materials
Author Contributions
Funding
Institutional Review Board Statement
Informed Consent Statement
Acknowledgments
Conflicts of Interest
References
- Rosenberg, I.H. Sarcopenia: Origins and clinical relevance. Clin. Geriatr. Med. 2011, 27, 337–339. [Google Scholar] [CrossRef] [PubMed]
- Cruz-Jentoft, A.J.; Bahat, G.; Bauer, J.; Boirie, Y.; Bruyère, O.; Cederholm, T.; Cooper, C.; Landi, F.; Rolland, Y.; Sayer, A.A.; et al. Sarcopenia: Revised European consensus on definition and diagnosis. Age Ageing 2019, 48, 16–31. [Google Scholar] [CrossRef] [PubMed] [Green Version]
- Larsson, L.; Degens, H.; Li, M.; Salviati, L.; Lee, Y.I.; Thompson, W.; Kirkland, J.L.; Sandri, M. Sarcopenia: Aging-related loss of muscle mass and function. Physiol. Rev. 2019, 99, 427–511. [Google Scholar] [CrossRef] [PubMed]
- Charlier, R.; Mertens, E.; Lefevre, J.; Thomis, M. Muscle mass and muscle function over the adult life span: A cross-sectional study in Flemish adults. Arch. Gerontol. Geriatr. 2015, 61, 161–167. [Google Scholar] [CrossRef] [PubMed]
- Van Roie, E.; Van Driessche, S.; Inglis, A.J.; Thomis, M.; Delecluse, C. Rate of power development of the knee extensors across the adult life span: A cross-sectional study in 1387 Flemish Caucasians. Exp. Gerontol. 2018, 110, 260–266. [Google Scholar] [CrossRef]
- Hunter, S.K.; Pereira, H.M.; Keenan, K.G. The aging neuromuscular system and motor performance. J. Appl. Physiol. 2016, 121, 982–995. [Google Scholar] [CrossRef]
- Avin, K.G.; Law, L.A.F. Age-related differences in muscle fatigue vary by contraction type: A meta-analysis. Phys. Ther. 2011, 91, 1153–1165. [Google Scholar] [CrossRef] [PubMed]
- Akima, H.; Kano, Y.; Enomoto, Y.; Ishizu, M.; Okada, M.; Oishi, Y.; Katsuta, S.; Kuno, S. Muscle function in 164 men and women aged 20-84 yr. Med. Sci. Sports Exerc. 2001, 33, 220–226. [Google Scholar] [CrossRef]
- Metter, E.J.; Lynch, N.; Conwit, R.; Lindle, R.; Tobin, J.; Hurley, B. Muscle quality and age: Cross-sectional and longitudinal comparisons. J. Gerontol. Biol. Sci. 1999, 54, B207–B218. [Google Scholar] [CrossRef]
- Chambers, T.L.; Burnett, T.R.; Raue, U.; Lee, G.A.; Finch, W.H.; Graham, B.M.; Trappe, T.A.; Trappe, S. Skeletal muscle size, function, and adiposity with lifelong aerobic exercise. J. Appl. Physiol. 2020, 128, 368–378. [Google Scholar] [CrossRef] [Green Version]
- Jubrias, S.A.; Odderson, I.R.; Esselman, P.C.; Conley, K.E. Decline in isokinetic force with age: Muscle cross-sectional area and specific force. Pflug. Arch. Eur. J. Physiol. 1997, 434, 246–253. [Google Scholar] [CrossRef]
- Moore, A.Z.; Caturegli, G.; Metter, E.J.; Makrogiannis, S.; Resnick, S.M.; Harris, T.B.; Ferrucci, L. Difference in muscle quality over the adult life span and biological correlates in the baltimore longitudinal study of aging. J. Am. Geriatr. Soc. 2014, 62, 230–236. [Google Scholar] [CrossRef]
- Newman, A.B.; Kupelian, V.; Visser, M.; Simonsick, E.M.; Goodpaster, B.H.; Kritchevsky, S.B.; Tylavsky, F.A.; Rubin, S.M.; Harris, T.B. Strength, but not muscle mass, is associated with mortality in the health, aging and body composition study cohort. J. Gerontol. A Biol. Sci. Med. Sci. 2006, 61, 72–77. [Google Scholar] [CrossRef]
- Volaklis, K.A.; Halle, M.; Meisinger, C. Muscular strength as a strong predictor of mortality: A narrative review. Eur. J. Intern. Med. 2015, 26, 303–310. [Google Scholar] [CrossRef]
- Roshanravan, B.; Patel, K.V.; Fried, L.F.; Robinson-Cohen, C.; de Boer, I.H.; Harris, T.; Murphy, R.A.; Satterfield, S.; Goodpaster, B.H.; Shlipak, M.; et al. Association of Muscle Endurance, Fatigability, and Strength with Functional Limitation and Mortality in the Health Aging and Body Composition Study. J. Gerontol. A Biol. Sci. Med. Sci. 2017, 72, 284–291. [Google Scholar] [CrossRef] [Green Version]
- Van Roie, E.; Verschueren, S.M.; Boonen, S.; Bogaerts, A.; Kennis, E.; Coudyzer, W.; Delecluse, C. Force-velocity characteristics of the knee extensors: An indication of the risk for physical frailty in elderly women. Arch. Phys. Med. Rehabil. 2011, 92, 1827–1832. [Google Scholar] [CrossRef] [Green Version]
- Steffl, M.; Sima, J.; Shiells, K.; Holmerova, I. The increase in health care costs associated with muscle weakness in older people without long-term illnesses in the Czech Republic: Results from the Survey of Health, Ageing and Retirement in Europe (SHARE). Clin. Interv. Aging 2017, 12, 2003–2007. [Google Scholar] [CrossRef] [PubMed] [Green Version]
- Pinedo-Villanueva, R.; Westbury, L.D.; Syddall, H.E.; Sanchez-Santos, M.T.; Dennison, E.M.; Robinson, S.M.; Cooper, C. Health Care Costs Associated with Muscle Weakness: A UK Population-Based Estimate. Calcif. Tissue Int. 2019, 104, 137–144. [Google Scholar] [CrossRef] [PubMed] [Green Version]
- Sedlmeier, A.M.; Baumeister, S.E.; Weber, A.; Fischer, B.; Thorand, B.; Ittermann, T.; Dörr, M.; Felix, S.B.; Völzke, H.; Peters, A.; et al. Relation of body fat mass and fat-free mass to total mortality: Results from 7 prospective cohort studies. Am. J. Clin. Nutr. 2021, 639–646. [Google Scholar] [CrossRef]
- Janssen, I.; Shepard, D.S.; Katzmarzyk, P.T.; Roubenoff, R. The healthcare costs of sarcopenia in the United States. J. Am. Geriatr. Soc. 2004, 52, 80–85. [Google Scholar] [CrossRef] [PubMed]
- Haynes, E.M.K.; Neubauer, N.A.; Cornett, K.M.D.; O’Connor, B.P.; Jones, G.R.; Jakobi, J.M. Age and sex-related decline of muscle strength across the adult lifespan: A scoping review of aggregated data. Appl. Physiol. Nutr. Metab. 2020, 1–12. [Google Scholar] [CrossRef] [PubMed]
- Van Driessche, S.; Van Roie, E.; Vanwanseele, B.; Delecluse, C. Test-retest reliability of knee extensor rate of velocity and power development in older adults using the isotonic mode on a Biodex System 3 dynamometer. PLoS ONE 2018, 13. [Google Scholar] [CrossRef] [Green Version]
- Pojednic, R.M.; Clark, D.J.; Patten, C.; Reid, K.; Phillips, E.M.; Fielding, R.A. The specific contributions of force and velocity to muscle power in older adults. Exp. Gerontol. 2012, 47, 608–613. [Google Scholar] [CrossRef] [Green Version]
- Gerstner, G.R.; Giuliani, H.K.; Mota, J.A.; Ryan, E.D. Age-related reductions in muscle quality influence the relative differences in strength and power. Exp. Gerontol. 2017, 99, 27–34. [Google Scholar] [CrossRef] [PubMed]
- Jenkins, N.D.M.; Housh, T.J.; Palmer, T.B.; Cochrane, K.C.; Bergstrom, H.C.; Johnson, G.O.; Schmidt, R.J.; Cramer, J.T. Relative differences in strength and power from slow to fast isokinetic velocities may reflect dynapenia. Muscle Nerve 2015, 52, 120–130. [Google Scholar] [CrossRef] [PubMed]
- Craig, C.L.; Marshall, A.L.; Sjöström, M.; Bauman, A.E.; Booth, M.L.; Ainsworth, B.E.; Pratt, M.; Ekelund, U.; Yngve, A.; Sallis, J.F.; et al. International physical activity questionnaire: 12-Country reliability and validity. Med. Sci. Sports Exerc. 2003, 35, 1381–1395. [Google Scholar] [CrossRef] [Green Version]
- Weeks, B.K.; Beck, B.R. The BPAQ: A bone-specific physical activity assessment instrument. Osteoporos. Int. 2008, 19, 1567–1577. [Google Scholar] [CrossRef] [Green Version]
- Pietrobelli, A.; Wang, Z.; Formica, C.; Heymsfield, S.B. Dual-energy X-ray absorptiometry: Fat estimation errors due to variation in soft tissue hydration. Am. J. Physiol. Metab. 1998, 274, E808–E816. [Google Scholar] [CrossRef] [PubMed]
- Blew, R.M.; Lee, V.R.; Farr, J.N.; Schiferl, D.J.; Going, S.B. Standardizing evaluation of pQCT image quality in the presence of subject movement: Qualitative versus quantitative assessment. Calcif. Tissue Int. 2014, 94, 202–211. [Google Scholar] [CrossRef] [PubMed]
- Francis, P.; Lyons, M.; Piasecki, M.; Mc Phee, J.; Hind, K.; Jakeman, P. Measurement of muscle health in aging. Biogerontology 2017, 18, 901–911. [Google Scholar] [CrossRef] [PubMed] [Green Version]
- Biodex Medical Systems, Inc. Biodex System 3 Pro Application/Operation Manual; Shirley: New York, NY, USA; Available online: http://www.biodex.com/sites/default/files/835000man_06159.pdf (accessed on 1 March 2021).
- Koo, T.K.; Li, M.Y. A guideline of selecting and reporting intraclass correlation coefficients for reliability research. J. Chiropr. Med. 2016, 15, 155–163. [Google Scholar] [CrossRef] [PubMed] [Green Version]
- Wang, Y.C.; Bohannon, R.W.; Li, X.; Sindhu, B.; Kapellusch, J. Hand-grip strength: Normative reference values and equations for individuals 18 to 85 years of age residing in the United States. J. Orthop. Sports Phys. Ther. 2018, 48, 685–693. [Google Scholar] [CrossRef] [PubMed]
- Bohannon, R.W. Muscle strength: Clinical and prognostic value of hand-grip dynamometry. Curr. Opin. Clin. Nutr. Metab. Care 2015, 18, 465–470. [Google Scholar] [CrossRef] [PubMed]
- Bohannon, R.W. Grip strength: An indispensable biomarker for older adults. Clin. Interv. Aging 2019, 14, 1681–1691. [Google Scholar] [CrossRef] [PubMed] [Green Version]
- Runge, M.; Rittweger, J.; Russo, C.R.; Schiessl, H.; Felsenberg, D. Is muscle power output a key factor in the age-related decline in physical performance? A comparison of muscle cross section, chair-rising test and jumping power. Clin. Physiol. Funct. Imaging 2004, 24, 335–340. [Google Scholar] [CrossRef]
- Siglinsky, E.; Krueger, D.; Ward, R.E.; Caserotti, P.; Strotmeyer, E.S. Effect of age and sex on jumping mechanography and other measures of muscle mass and function. J. Musculoskelet. Neuronal Interact. 2015, 15, 301–308. [Google Scholar]
- Parsons, C.M.; Edwards, M.H.; Cooper, C.; Dennison, E.M.; Ward, K.A. Are jumping mechanography assessed muscle force and power, and traditional physical capability measures associated with falls in older adults? Results from the hertfordshire cohort study. J. Musculoskelet. Neuronal Interact. 2020, 20, 168–175. [Google Scholar]
- Van Driessche, S.; Delecluse, C.; Bautmans, I.; Vanwanseele, B.; Van Roie, E. Age-related differences in rate of power development exceed differences in peak power. Exp. Gerontol. 2018, 101, 95–100. [Google Scholar] [CrossRef]
- Reid, K.F.; Clark, D.J.; Patten, C.; Carabello, R.; Cloutier, G.J.; Phillips, E.M.; Krivickas, L.S.; Frontera, W.R.; Fielding, R.A. Muscle power failure in mobility-limited older adults: Preserved single fiber function despite lower whole muscle size, quality and rate of neuromuscular activation. Eur. J. Appl. Physiol. 2012, 112, 2289–2301. [Google Scholar] [CrossRef] [Green Version]
- Foldvari, M.; Clark, M.; Laviolette, L.C.; Bernstein, M.A.; Kaliton, D.; Castaneda, C.; Pu, C.T.; Hausdorff, J.M.; Fielding, R.A.; Singh, M.A.F. Association of muscle power with functional status in community-dwelling elderly women. J. Gerontol. Med. Sci. 2000, 55, M192–M199. [Google Scholar] [CrossRef] [PubMed]
- Kistler-Fischbacher, M.; Weeks, B.K.; Beck, B.R. The effect of exercise intensity on bone in postmenopausal women (part 1): A systematic review. Bone 2021, 143, 115696. [Google Scholar] [CrossRef]
- Kistler-Fischbacher, M.; Weeks, B.K.; Beck, B.R. The effect of exercise intensity on bone in postmenopausal women (part 2): A meta-analysis. Bone 2021, 143, 115697. [Google Scholar] [CrossRef]
- Bemben, M.G.; Massey, B.; Bemben, D.; Misner, J.; Boileau, R. Isometric intermittent endurance of four muscle groups in men aged 20–74 yr. Med. Sci. Sports Exerc. 1996, 28, 145–153. [Google Scholar] [CrossRef]
- Backman, E.; Johansson, V.; Hager, B.; Sjoblom, P.; Henriksson, K.G. Isometric muscle strength and muscular endurance in normal persons aged between 17 and 70 years. Scandanavian J. Rehabil. Med. 1995, 27, 109–117. [Google Scholar]
- Larsson, L.; Karlsson, J. Isometric and dynamic endurance as a function of age and skeletal muscle characteristics. Acta Physiol. Scand. 1978, 104, 129–136. [Google Scholar] [CrossRef] [PubMed]
- Roberts, B.M.; Lavin, K.M.; Many, G.M.; Thalacker-Mercer, A.; Merritt, E.K.; Bickel, C.S.; Mayhew, D.L.; Tuggle, S.C.; Cross, J.M.; Kosek, D.J.; et al. Human neuromuscular aging: Sex differences revealed at the myocellular level. Exp. Gerontol. 2018, 106, 116–124. [Google Scholar] [CrossRef] [PubMed]
- Sundberg, C.W.; Fitts, R.H. Bioenergetic basis of skeletal muscle fatigue. Curr. Opin. Physiol. 2019, 10, 118–127. [Google Scholar] [CrossRef] [PubMed]
- Allen, D.G.; Lamb, G.D.; Westerblad, H. Skeletal muscle fatigue: Cellular mechanisms. Physiol. Rev. 2008, 88, 287–332. [Google Scholar] [CrossRef] [PubMed] [Green Version]
- Longyear, T.J.; Turner, M.A.; Davis, J.P.; Lopez, J.; Biesiadecki, B.; Debold, E.P. Ca++-sensitizing mutations in troponin, Pi, and 2-deoxyATP alter the depressive effect of acidosis on regulated thin-filament velocity. J. Appl. Physiol. 2014, 116, 1165–1174. [Google Scholar] [CrossRef] [Green Version]
- Debold, E.P.; Fitts, R.H.; Sundberg, C.W.; Nosek, T.M. Muscle fatigue from the perspective of a single crossbridge. Med. Sci. Sports Exerc. 2016, 48, 2270–2280. [Google Scholar] [CrossRef]
- Sundberg, C.W.; Kuplic, A.; Hassanlouei, H.; Hunter, S.K. Mechanisms for the age-related increase in fatigability of the knee extensors in old and very old adults. J. Appl. Physiol. 2018, 125, 146–158. [Google Scholar] [CrossRef] [PubMed]
- Callahan, D.M.; Kent-braun, J.A. Effect of old age on human skeletal muscle force-velocity and fatigue properties. J. Appl. Physiol. 2011, 111, 1345–1352. [Google Scholar] [CrossRef] [PubMed]
- Dalton, B.H.; Power, G.A.; Vandervoort, A.A.; Rice, C.L. The age-related slowing of voluntary shortening velocity exacerbates power loss during repeated fast knee extensions. Exp. Gerontol. 2012, 47, 85–92. [Google Scholar] [CrossRef] [PubMed]
- McNeil, C.J.; Rice, C.L. Fatigability is increased with age during velocity-dependent contractions of the dorsiflexors. J. Gerontol. Ser. A Biol. Sci. Med. Sci. 2007, 62, 624–629. [Google Scholar] [CrossRef] [PubMed] [Green Version]
- Häkkinen, K.; Häkkinen, A. Muscle cross-sectional area, force production and relaxation characteristics in women at different ages. Eur. J. Appl. Physiol. Occup. Physiol. 1991, 62, 410–414. [Google Scholar] [CrossRef]
- Kent-Braun, J.A.; Ng, A.V. Specific strength and voluntary muscle activation in young and elderly women and men. J. Appl. Physiol. 1999, 87, 22–29. [Google Scholar] [CrossRef] [Green Version]
- Young, A.; Stokes, M.; Crowe, M. Size and strength of the quadriceps muscles of old and young women. Eur. J. Clin. Investig. 1984, 14, 282–287. [Google Scholar] [CrossRef]
- Correa-de-Araujo, R.; Harris-Love, M.O.; Miljkovic, I.; Fragala, M.S.; Anthony, B.W.; Manini, T.M. The need for standardized assessment of muscle quality in skeletal muscle function deficit and other aging-related muscle dysfunctions: A symposium report. Front. Physiol. 2017, 8, 87. [Google Scholar] [CrossRef]
- Soysal, P.; Hurst, C.; Demurtas, J.; Firth, J.; Howden, R.; Yang, L.; Tully, M.A.; Koyanagi, A.; Ilie, P.C.; López-Sánchez, G.F.; et al. Handgrip strength and health outcomes: Umbrella review of systematic reviews with meta-analyses of observational studies. J. Sport Health Sci. 2020, 1–6. [Google Scholar] [CrossRef]
- García-Hermoso, A.; Cavero-Redondo, I.; Ramírez-Vélez, R.; Ruiz, J.R.; Ortega, F.B.; Lee, D.C.; Martínez-Vizcaíno, V. Muscular Strength as a Predictor of All-Cause Mortality in an Apparently Healthy Population: A Systematic Review and Meta-Analysis of Data From Approximately 2 Million Men and Women. Arch. Phys. Med. Rehabil. 2018, 99, 2100–2113.e5. [Google Scholar] [CrossRef]
- Francis, P.; McCormack, W.; Toomey, C.; Lyons, M.; Jakeman, P. Muscle strength can better differentiate between gradations of functional performance than muscle quality in healthy 50–70 y women. Braz. J. Phys. Ther. 2017, 21, 457–464. [Google Scholar] [CrossRef] [PubMed]
- Miller, V.M. Why are sex and gender important to basic physiology and translational and individualized medicine? Am. J. Physiol. Hear. Circ. Physiol. 2014, 306, H781–H788. [Google Scholar] [CrossRef] [PubMed] [Green Version]
- Harridge, S.D.R.; Lazarus, N.R. Physical activity, aging, and physiological function. Physiology 2017, 32, 152–161. [Google Scholar] [CrossRef] [PubMed] [Green Version]


| Parameter | Young Women | Middle-Age Women | Older Women | Age Effect | 1 Post-hoc |
|---|---|---|---|---|---|
| Participants (n) | 29 | 33 | 40 | – | – |
| Age (years) | 29.6 ± 6.3 | 50.6 ± 5.5 | 69.3 ± 7.9 | <0.001 | YW < MAW < OW |
| Height (cm) | 166.3 ± 6.7 | 166.6 ± 6.9 | 161.8 ± 6.7 | 0.004 | MAW > OW |
| Weight (kg) | 65.5 ± 7.9 | 69.3 ± 12.0 | 64.6 ± 10.4 | 0.140 | Nc |
| Body mass index (kg/m2) | 23.7 ± 3.1 | 25.0 ± 4.7 | 24.7 ± 3.6 | 0.392 | Nc |
| Total Physical Activity | 24.5 ± 30.6 | 24.9 ± 21.4 | 17.8 ± 19.2 | 0.366 | Nc |
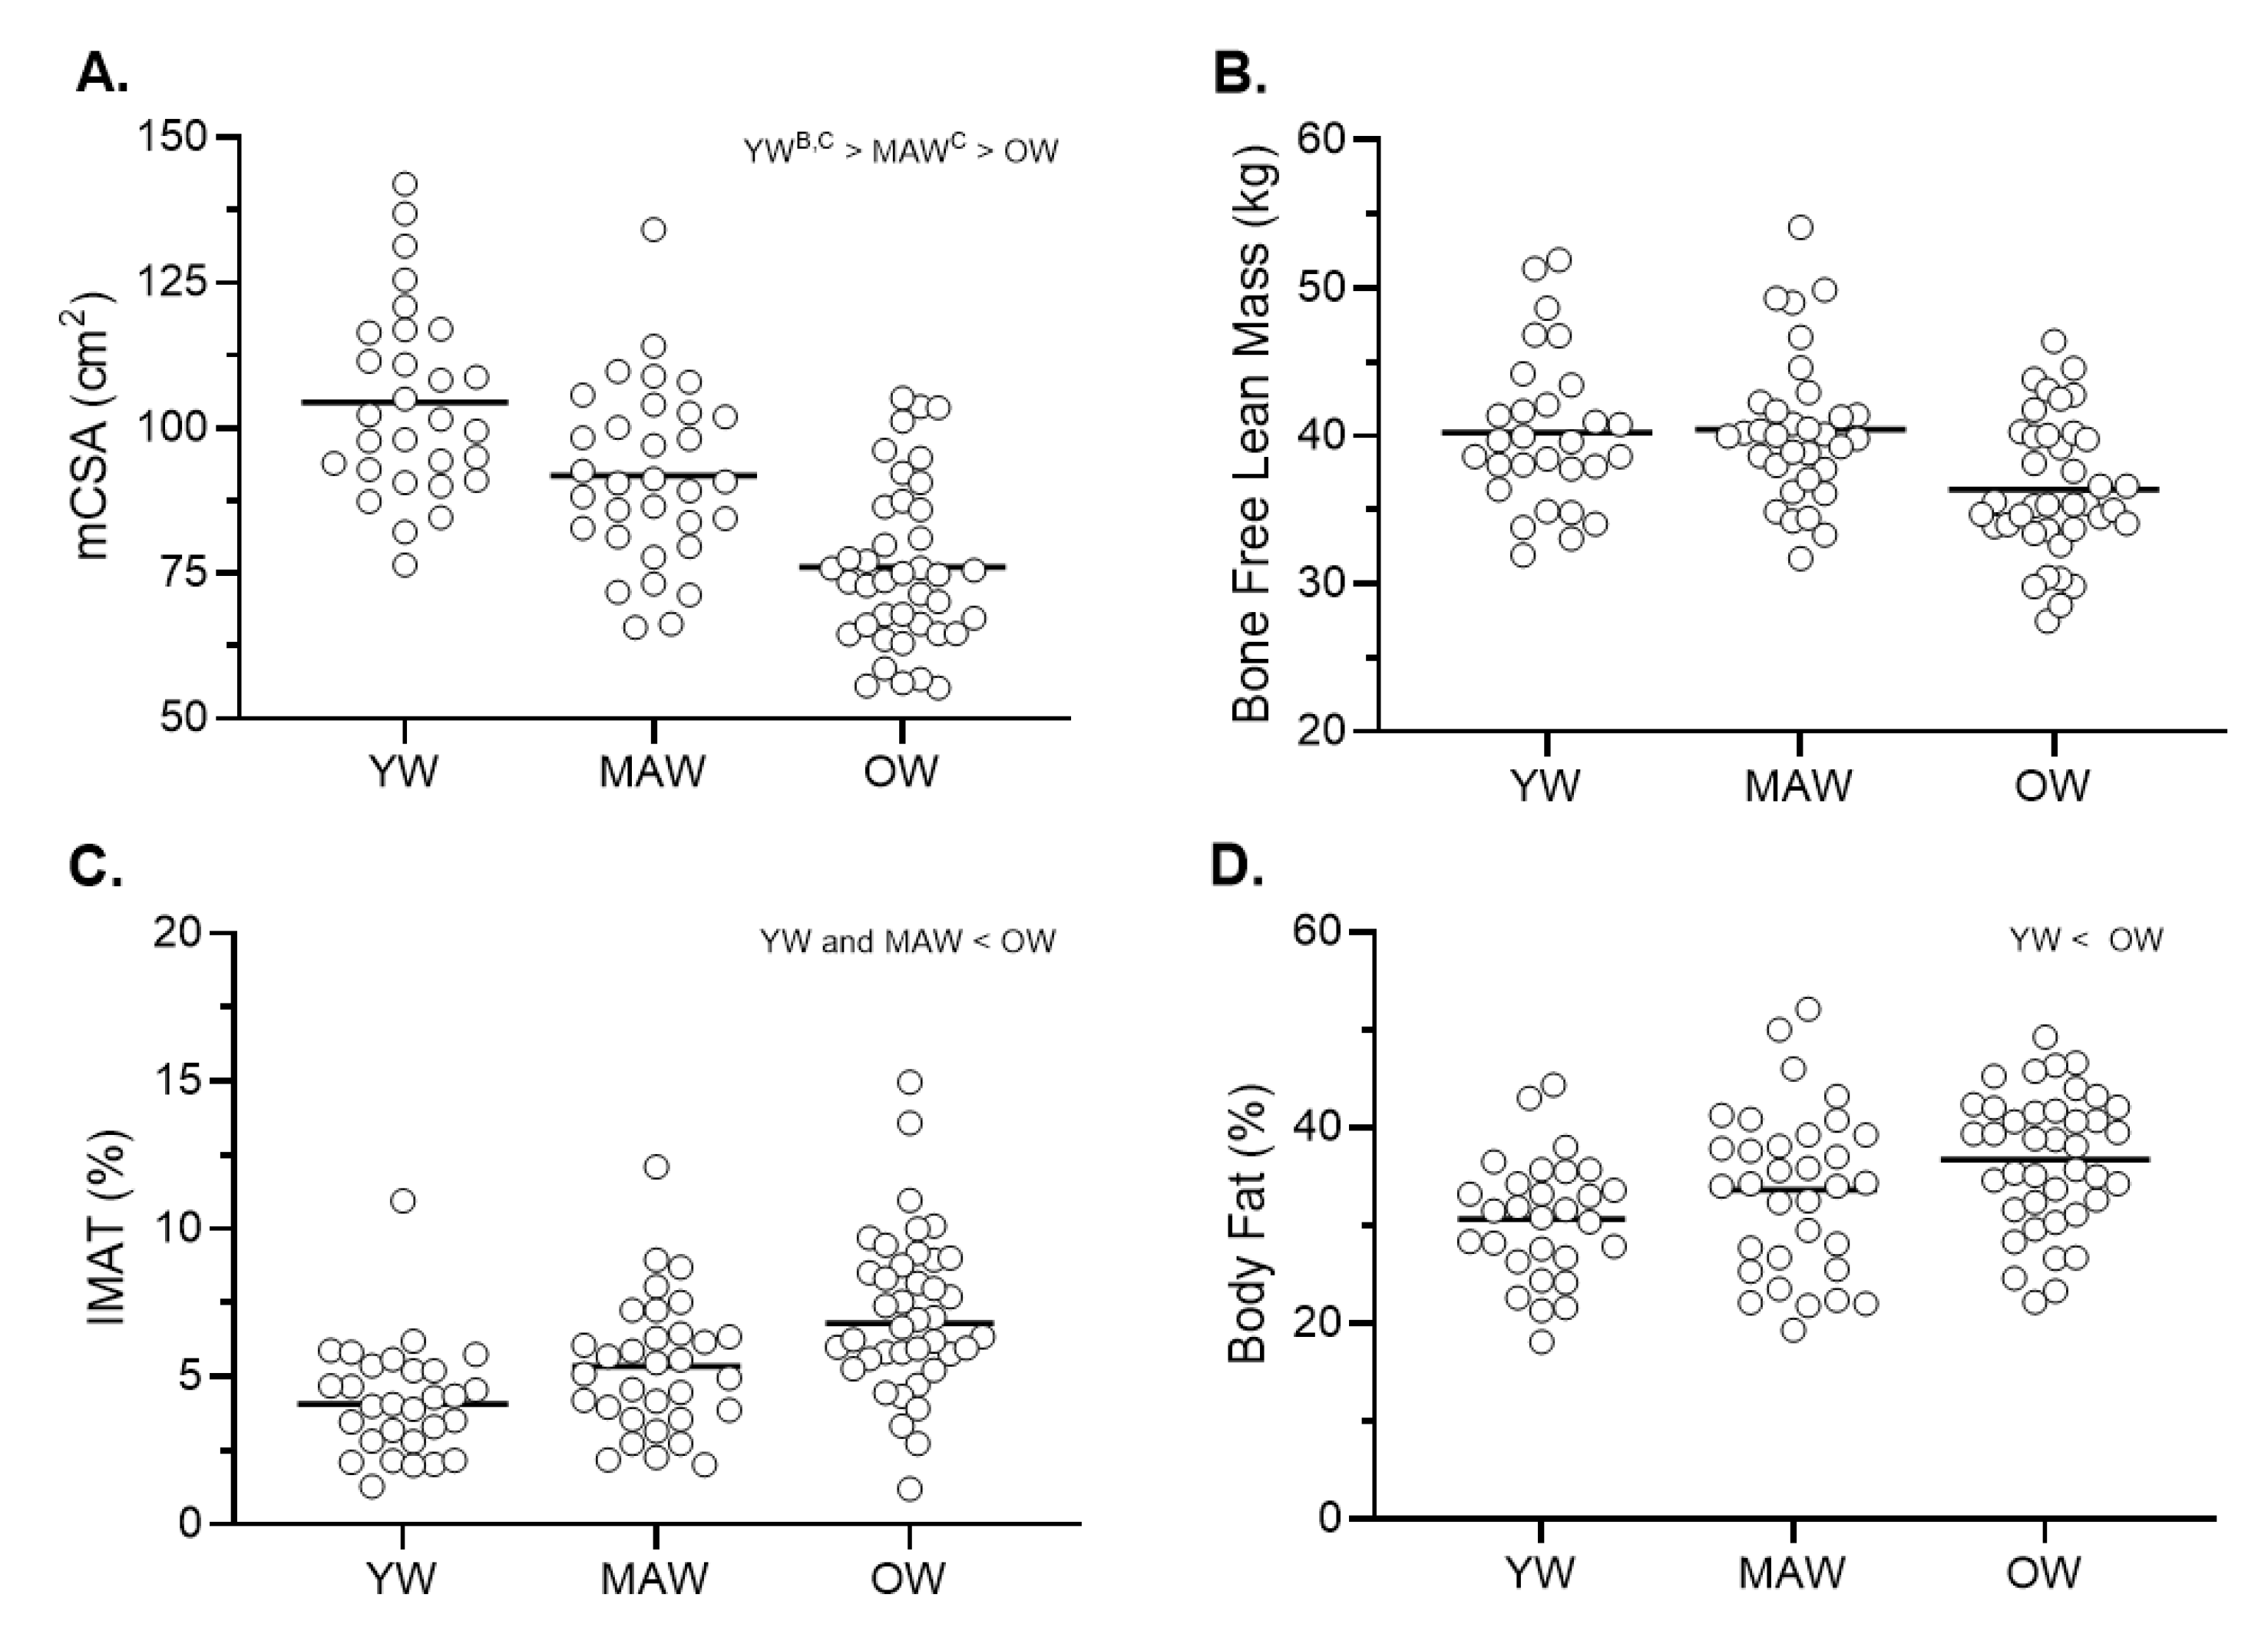
| Bone free-lean mass (kg) | 40.2 ± 5.2 | 40.4 ± 5.0 | 36.4 ± 4.6 | 0.077 | Nc |
| Fat Percent (%) | 30.7 ± 6.2 | 33.6 ± 8.4 | 36.7 ± 6.9 | 0.031 | YW < OW |
| Thigh mCSA (cm2) | 104.5 ± 16.5 | 91.8 ± 15.2 | 76 ± 14.1 | <0.001 | YW > MAW > OW |
| Thigh IMAT (%) | 4.2 ± 1.9 | 5.4 ± 2.3 | 7.2 ± 2.7 | <0.001 | YW and MAW < OW |
| Jump power (Watts) | 1129.5 ± 215.4 | 1045.1 ± 159.1 | 751.0 ± 220.3 | <0.001 | YW and MAW > OW |
| Jump velocity (m/s) | 1.3 ± 0.2 | 1.2 ± 0.1 | 1.0 ± 0.2 | <0.001 | YW and MAW > OW |
| Relative jump power (Watts/kg) | 17.5 ± 4.2 | 15.7 ± 4.2 | 12.0 ± 4.4 | <0.001 | YW and MAW > OW |
Publisher’s Note: MDPI stays neutral with regard to jurisdictional claims in published maps and institutional affiliations. |
© 2021 by the authors. Licensee MDPI, Basel, Switzerland. This article is an open access article distributed under the terms and conditions of the Creative Commons Attribution (CC BY) license (https://creativecommons.org/licenses/by/4.0/).
Share and Cite
Miller, R.M.; Freitas, E.D.S.; Heishman, A.D.; Peak, K.M.; Buchanan, S.R.; Kellawan, J.M.; Pereira, H.M.; Bemben, D.A.; Bemben, M.G. Muscle Performance Changes with Age in Active Women. Int. J. Environ. Res. Public Health 2021, 18, 4477. https://0-doi-org.brum.beds.ac.uk/10.3390/ijerph18094477
Miller RM, Freitas EDS, Heishman AD, Peak KM, Buchanan SR, Kellawan JM, Pereira HM, Bemben DA, Bemben MG. Muscle Performance Changes with Age in Active Women. International Journal of Environmental Research and Public Health. 2021; 18(9):4477. https://0-doi-org.brum.beds.ac.uk/10.3390/ijerph18094477
Chicago/Turabian StyleMiller, Ryan M., Eduardo D. S. Freitas, Aaron D. Heishman, Keldon M. Peak, Samuel R. Buchanan, J. Mikhail Kellawan, Hugo M. Pereira, Debra A. Bemben, and Michael G. Bemben. 2021. "Muscle Performance Changes with Age in Active Women" International Journal of Environmental Research and Public Health 18, no. 9: 4477. https://0-doi-org.brum.beds.ac.uk/10.3390/ijerph18094477