
Effects of Acute Microcurrent Electrical Stimulation on Muscle Function and Subsequent Recovery Strategy


Abstract
:1. Introduction
2. Materials and Methods
2.1. Participants and Inclusion Criteria
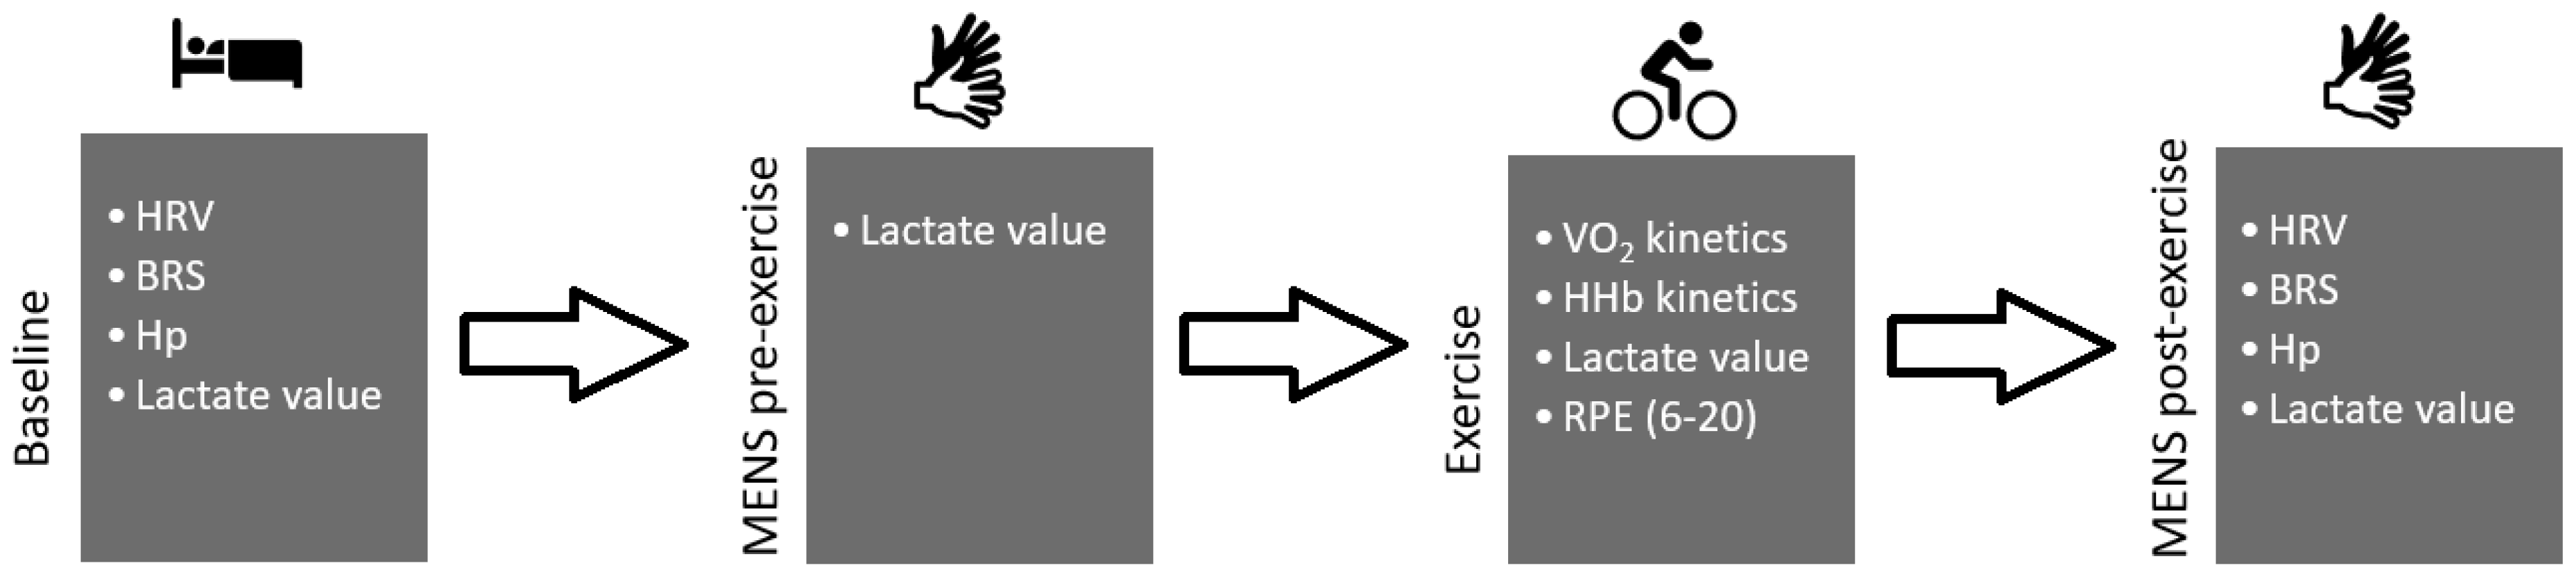
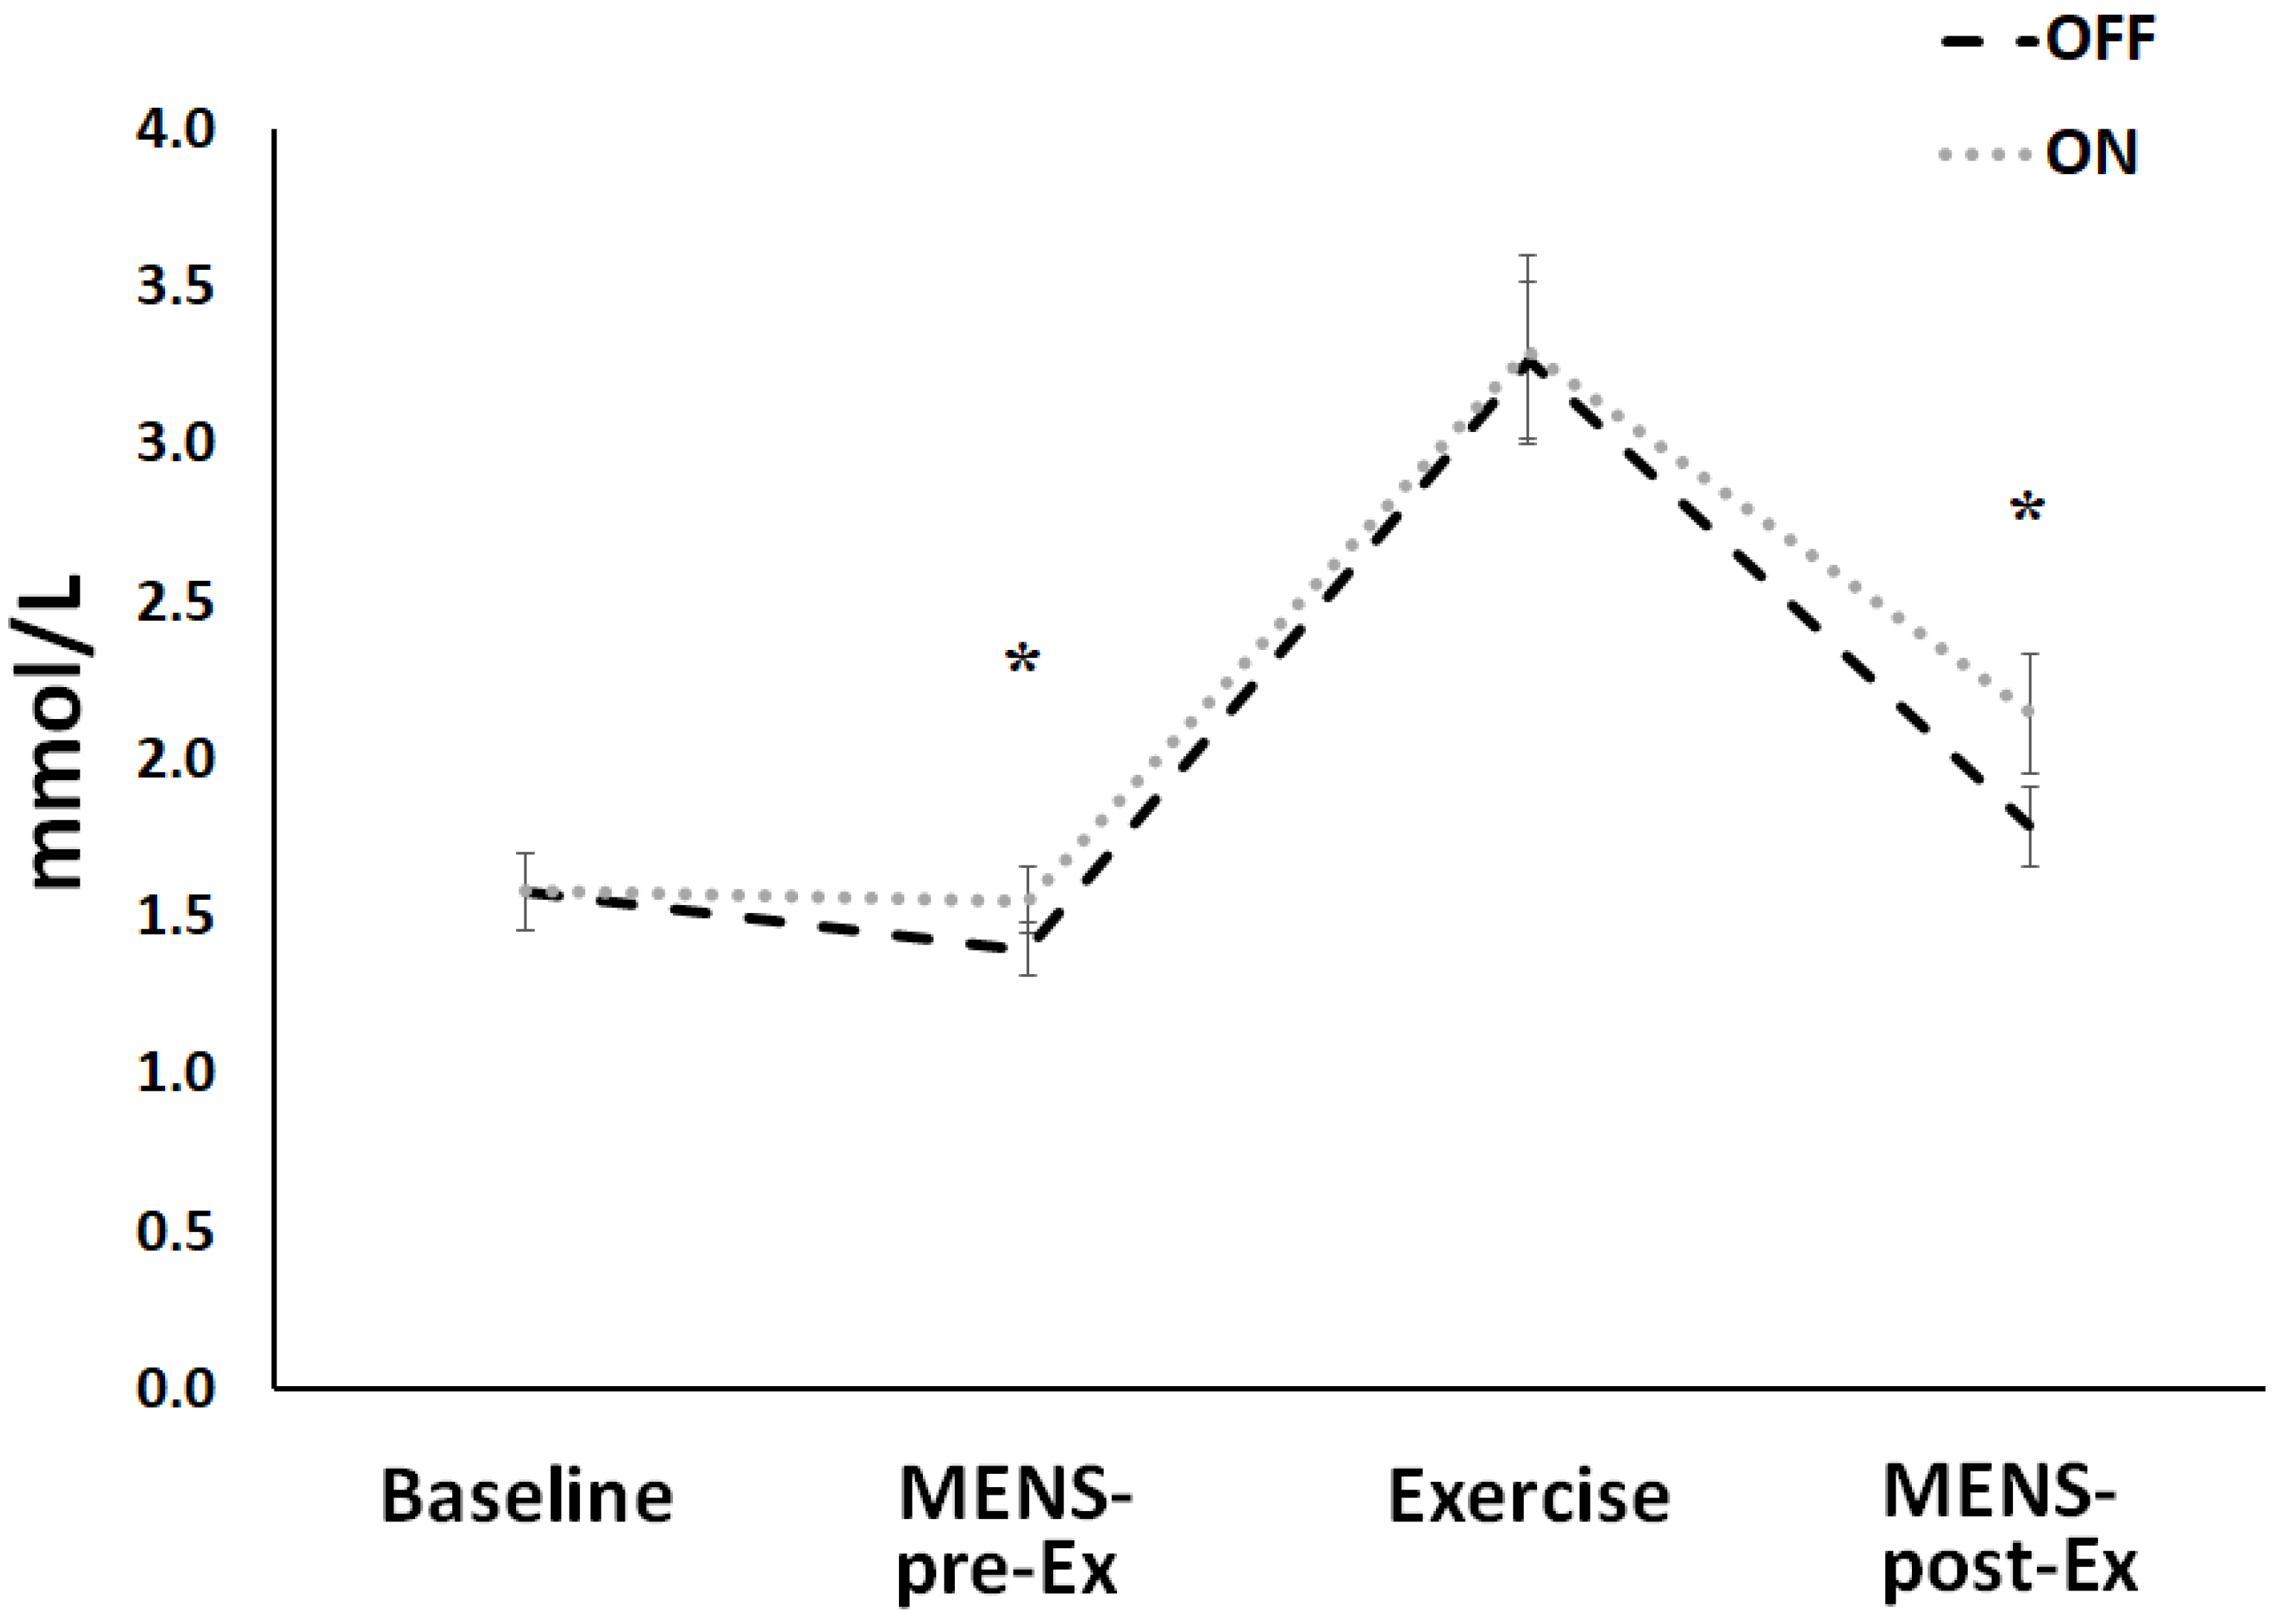
2.2. Study Design and Test Protocol
2.3. Data Analysis
As * (1 − e − (t-TDs/τs) (phase 3) (slow component)
As * (1 − e − (t-TDs/τs) (phase 3) (slow component).
2.4. Statistical Analysis
3. Results
4. Discussion
5. Conclusions
Author Contributions
Funding
Institutional Review Board Statement
Informed Consent Statement
Data Availability Statement
Acknowledgments
Conflicts of Interest
References
- Babault, N.; Cometti, C.; Maffiuletti, N.A.; Deley, G. Does electrical stimulation enhance post-exercise performance recovery? Eur. J. Appl. Physiol. 2011, 111, 2501–2507. [Google Scholar] [CrossRef] [PubMed]
- Cheng, N.; van Hoof, H.; Bockx, E.; Hoogmartens, M.J.; Mulier, J.C.; De Dijcker, F.J.; Sansen, W.M.; De Loecker, W. The effects of electric currents on ATP generation, protein synthesis, and membrane transport in rat skin. Clin. Orthop. Relat. Res. 1982, 171, 264–272. [Google Scholar] [CrossRef] [Green Version]
- Zizic, T.M.; Hoffman, K.C.; Holt, P.A.; Hungerford, D.S.; O’Dell, J.R.; Jacobs, M.A.; Lewis, C.G.; Deal, C.L.; Caldwell, J.R.; Cholewczynski, J.G.; et al. The treatment of osteoarthritis of the knee with pulsed electrical stimulation. J. Rheumatol. 1995, 22, 1757–1761. [Google Scholar]
- Cook, H.A.; Morales, M.; La Rosa, E.M.; Dean, J.; Donnelly, M.K.; McHugh, P.; Otradovec, A.; Wright, K.S.; Kula, T.; Tepper, S.H. Effects of electrical stimulation on lymphatic flow and limb volume in the rat. Phys. Ther. 1994, 74, 1040–1046. [Google Scholar] [CrossRef]
- Mitchell, P. Chemiosmotic coupling in oxidative and photosynthetic phosphorylation. Biochim. Biophys. Acta Bioenerg. 2011, 1807, 1507–1538. [Google Scholar] [CrossRef] [PubMed] [Green Version]
- Pall, M.L. Electromagnetic fields act via activation of voltage-gated calcium channels to produce beneficial or adverse effects. J. Cell. Mol. Med. 2013, 17, 958–965. [Google Scholar] [CrossRef]
- Cortis, C.; Tessitore, A.; Dartibale, E.; Meeusen, R.; Capranica, L. Effects of post-exercise recovery interventions on physiological, psychological, and performance parameters. Int. J. Sports Med. 2010, 31, 327–335. [Google Scholar] [CrossRef]
- Ohno, Y.; Fujiya, H.; Goto, A.; Nakamura, A.; Nishiura, Y.; Sugiura, T.; Ohira, Y.; Yoshioka, T.; Goto, K. Microcurrent electrical nerve stimulation facilitates regrowth of mouse soleus muscle. Int. J. Med. Sci. 2013, 10, 1286–1294. [Google Scholar] [CrossRef] [Green Version]
- Malone, J.K.; Blake, C.; Caulfield, B.M. Neuromuscular electrical stimulation during recovery from exercise: A systematic review. J. Strength Cond. Res. 2014, 28, 2478–2506. [Google Scholar] [CrossRef] [Green Version]
- Barcala-Furelos, R.; González-Represas, A.; Rey, E.; Martínez-Rodríguez, A.; Kalén, A.; Marques, O.; Rama, L. Is low-frequency electrical stimulation a tool for recovery after a water rescue? A cross-over study with lifeguards. Int. J. Environ. Res. Public Health 2020, 17, 5854. [Google Scholar] [CrossRef]
- Piras, A.; Campa, F.; Toselli, S.; Di Michele, R.; Raffi, M. Physiological responses to partial-body cryotherapy performed during a concurrent strength and endurance session. Appl. Physiol. Nutr. Metab. 2019, 44, 59–65. [Google Scholar] [CrossRef]
- Piras, A.; Persiani, M.; Damiani, N.; Perazzolo, M.; Raffi, M. Peripheral heart action (PHA) training as a valid substitute to high intensity interval training to improve resting cardiovascular changes and autonomic adaptation. Eur. J. Appl. Physiol. 2015, 115, 763–773. [Google Scholar] [CrossRef] [PubMed]
- Piras, A.; Gatta, G. Evaluation of the effectiveness of compression garments on autonomic nervous system recovery after exercise. J. Strength Cond. Res. 2017, 31, 1636–1643. [Google Scholar] [CrossRef]
- Piras, A.; Cortesi, M.; Campa, F.; Perazzolo, M.; Gatta, G. Recovery time profiling after short-, middle-and long-distance swimming performance. J. Strength Cond. Res. 2019, 33, 1408–1415. [Google Scholar] [CrossRef] [PubMed]
- Toni, G.; Belvederi Murri, M.; Piepoli, M.; Zanetidou, S.; Cabassi, A.; Squatrito, S.; Bagnoli, L.; Piras, A.; Mussi, C.; Senaldi, R.; et al. Physical Exercise for Late-Life Depression: Effects on Heart Rate Variability. Am. J. Geriatr. Psychiatry 2016, 24, 989–997. [Google Scholar] [CrossRef] [PubMed]
- Noites, A.; Nunes, R.; Gouveia, A.I.; Mota, A.; Melo, C.; Viera, Á.; Adubeiro, N.; Bastos, J.M. Effects of Aerobic Exercise Associated with Abdominal Microcurrent: A Preliminary Study. J. Altern. Complement. Med. 2015, 21, 229–236. [Google Scholar] [CrossRef] [Green Version]
- Lambert, M.I.; Marcus, P.; Burgess, T.; Noakes, T.D. Electro-membrane microcurrent therapy reduces signs and symptoms of muscle damage. Med. Sci. Sport. Exerc. 2002, 34, 602–607. [Google Scholar]
- Naclerio, F.; Seijo, M.; Karsten, B.; Brooker, G.; Carbone, L.; Thirkell, J.; Larumbe-Zabala, E. Effectiveness of combining microcurrent with resistance training in trained males. Eur. J. Appl. Physiol. 2019, 119, 2641–2653. [Google Scholar] [CrossRef] [PubMed] [Green Version]
- Kwon, D.R.; Kim, J.; Kim, Y.; An, S.; Kwak, J.; Lee, S.; Park, S.; Choi, Y.H.; Lee, Y.K.; Park, J.W. Short-term microcurrent electrical neuromuscular stimulation to improve muscle function in the elderly: A randomized, double-blinded, sham-controlled clinical trial. Medicine 2017, 96. [Google Scholar] [CrossRef]
- Hirai, D.M.; Copp, S.W.; Holdsworth, C.T.; Ferguson, S.K.; McCullough, D.J.; Behnke, B.J.; Musch, T.I.; Poole, D.C. Skeletal muscle microvascular oxygenation dynamics in heart failure: Exercise training and nitric oxide-mediated function. Am. J. Physiol. Hear. Circ. Physiol. 2014, 306. [Google Scholar] [CrossRef] [Green Version]
- Burnley, M.; Jones, A.M. Oxygen uptake kinetics as a determinant of sports performance. Eur. J. Sport Sci. 2007, 7, 63–79. [Google Scholar] [CrossRef]
- Koppo, K.; Bouckaert, J.; Jones, A.M. Effects of Training Status and Exercise Intensity on Phase II VO2 Kinetics. Med. Sci. Sport. Exerc. 2004, 36, 225–232. [Google Scholar] [CrossRef] [PubMed]
- Campa, F.; Piras, A.; Raffi, M.; Trofè, A.; Perazzolo, M.; Mascherini, G.; Toselli, S. The effects of dehydration on metabolic and neuromuscular functionality during cycling. Int. J. Environ. Res. Public Health 2020, 17, 1161. [Google Scholar] [CrossRef] [Green Version]
- Beaver, W.L.; Wasserman, K.; Whipp, B.J. A new method for detecting anaerobic threshold by gas exchange. J. Appl. Physiol. 1986, 60, 2020–2027. [Google Scholar] [CrossRef]
- Camm, A.J.; Malik, M.; Bigger, J.T.; Günter, B. Task force of the European Society of Cardiology and the North American Society of Pacing and Electrophysiology. Heart rate variability: Standards of measurement, physiological interpretation and clinical use. Circulation 1996, 93, 1043–1065. [Google Scholar]
- Bonaventura, J.M.; Sharpe, K.; Knight, E.; Fuller, K.L.; Tanner, R.K.; Gore, C.J. Reliability and accuracy of six hand-held blood lactate analysers. J. Sport. Sci. Med. 2014, 14, 203–214. [Google Scholar]
- Ferrari, M.; Muthalib, M.; Quaresima, V. The use of near-infrared spectroscopy in understanding skeletal muscle physiology: Recent developments. Trans. R. Soc. A 2011, 369, 4577–4590. [Google Scholar] [CrossRef]
- Ferrari, M.; Binzoni, T.; Quaresima, V. Oxidative metabolism in muscle. Philos. Trans. R. Soc. B Biol. Sci. 1997, 352, 677–683. [Google Scholar] [CrossRef]
- Grassi, B.; Pogliaghi, S.; Rampichini, S.; Quaresima, V.; Ferrari, M.; Marconi, C.; Cerretelli, P. Muscle oxygenation and pulmonary gas exchange kinetics during cycling exercise on-transitions in humans. J. Appl. Physiol. 2003, 95, 149–158. [Google Scholar] [CrossRef] [PubMed]
- Borg, G.; Löllgen, H. Borg’s perceived exertion and pain scales. Dtsch. Z. Sportmed. 2001, 52, 252. [Google Scholar] [CrossRef]
- Whipp, B.J.; Ward, S.A.; Lamarra, N.; Davis, J.A.; Wasserman, K. Parameters of ventilatory and gas exchange dynamics during exercise. J. Appl. Physiol. Respir. Environ. Exerc. Physiol. 1982, 52, 1506–1513. [Google Scholar] [CrossRef]
- Bos, W.J.; van Goudoever, J.; van Montfrans, G.A.; van den Meiracker, A.H.; Wesseling, K.H. Reconstruction of brachial artery pressure from noninvasive finger pressure measurements. Circulation 1996, 94, 1870–1875. [Google Scholar] [CrossRef]
- Hopkins, W.G.; Marshall, S.W.; Batterham, A.M.; Hanin, J. Progressive statistics for studies in sports medicine and exercise science. Med. Sci. Sport. Exerc. 2009, 41, 3–12. [Google Scholar] [CrossRef] [Green Version]
- Fylstra, D.; Lasdon, L.; Watson, J.; Waren, A. Design and Use of the Microsoft Excel Solver. INFORMS J. Appl. Anal. 1998, 28, 29. [Google Scholar] [CrossRef] [Green Version]
- Huckfeldt, R.; Flick, A.B.; Mikkelson, D.; Lowe, C.; Finley, P.J. Wound closure after split-thickness skin grafting is accelerated with the use of continuous direct anodal microcurrent applied to silver nylon wound contact dressings. J. Burn Care Res. 2007, 28, 703–707. [Google Scholar] [CrossRef]
- Ahmed, A.F.; Elgayed, S.S.A.; Ibrahim, I.M. Polarity effect of microcurrent electrical stimulation on tendon healing: Biomechanical and histopathological studies. J. Adv. Res. 2012, 3, 109–117. [Google Scholar] [CrossRef]
- Grassi, B.; Poole, D.C.; Richardson, R.S.; Knight, D.R.; Erickson, B.K.; Wagner, P.D. Muscle O2 uptake kinetics in humans: Implications for metabolic control. J. Appl. Physiol. 1996, 80, 988–998. [Google Scholar] [CrossRef] [PubMed]
- Wilkerson, D.P.; Campbell, I.T.; Jones, A.M. Influence of nitric oxide synthase inhibition on pulmonary O2 uptake kinetics during supra-maximal exercise in humans. J. Physiol. 2004, 561, 623–635. [Google Scholar] [CrossRef] [PubMed]
- Brown, G.C. Nitric oxide as a competitive inhibitor of oxygen consumption in the mitochondrial respiratory chain. Acta Physiol. Scand. 2000, 168, 667–674. [Google Scholar] [CrossRef] [PubMed]
- Ferreira, L.F.; Townsend, D.K.; Lutjemeier, B.J.; Barstow, T.J. Muscle capillary blood flow kinetics estimated from pulmonary O2 uptake and near-infrared spectroscopy. J. Appl. Physiol. 2005, 98, 1820–1828. [Google Scholar] [CrossRef] [PubMed] [Green Version]
- DeLorey, D.S.; Kowalchuk, J.M.; Paterson, D.H. Relationship between pulmonary O2 uptake kinetics and muscle deoxygenation during moderate-intensity exercise. J. Appl. Physiol. 2003, 95, 113–120. [Google Scholar] [CrossRef] [Green Version]
- Grassi, B.; Gladden, L.B.; Stary, C.M.; Wagner, P.D.; Hogan, M.C. Peripheral O2 diffusion does not affect V˙O2 on-kinetics in isolated in situ canine muscle. J. Appl. Physiol. 1998, 85, 1404–1412. [Google Scholar] [CrossRef]
- MacDonald, M.; Pedersen, P.K.; Hughson, R.L. Acceleration of V˙O2 kinetics in heavy submaximal exercise by hyperoxia and prior high-intensity exercise. J. Appl. Physiol. 1997, 83, 1318–1325. [Google Scholar] [CrossRef]
- Barstow, T.J.; Jones, A.M.; Nguyen, P.H.; Casaburi, R. Influence of muscle fiber type and pedal frequency on oxygen uptake kinetics of heavy exercise. J. Appl. Physiol. 1996, 81, 1642–1650. [Google Scholar] [CrossRef]
- O’Leary, D.D.; Kimmerly, D.S.; Cechetto, A.D.; Shoemaker, J.K. Differential effect of head-up tilt on cardiovagal and sympathetic baroreflex sensitivity in humans. Exp. Physiol. 2003, 88, 769–774. [Google Scholar] [CrossRef] [PubMed] [Green Version]
- Vieira, P.J.C.; Ribeiro, J.P.; Cipriano, G.; Umpierre, D.; Cahalin, L.P.; Moraes, R.S.; Chiappa, G.R. Effect of transcutaneous electrical nerve stimulation on muscle metaboreflex in healthy young and older subjects. Eur. J. Appl. Physiol. 2012, 112, 1327–1334. [Google Scholar] [CrossRef] [PubMed]
- Alamdari, N.; Constantin-Teodosiu, D.; Murton, A.J.; Gardiner, S.M.; Bennett, T.; Layfield, R.; Greenhaff, P.L. Temporal changes in the involvement of pyruvate dehydrogenase complex in muscle lactate accumulation during lipopolysaccharide infusion in rats. J. Physiol. 2008, 586, 1767–1775. [Google Scholar] [CrossRef] [PubMed]
- Nikolić, N.; Skaret Bakke, S.; Tranheim Kase, E.; Rudberg, I.; Flo Halle, I.; Rustan, A.C.; Thoresen, G.H.; Aas, V. Electrical pulse stimulation of cultured human skeletal muscle cells as an in vitro model of exercise. PLoS ONE 2012, 7, e33203. [Google Scholar] [CrossRef] [PubMed] [Green Version]
- Malone, J.K.; Coughlan, G.F.; Crowe, L.; Gissane, G.C.; Caulfield, B. The physiological effects of low-intensity neuromuscular electrical stimulation (NMES) on short-term recovery from supra-maximal exercise bouts in male triathletes. Eur. J. Appl. Physiol. 2012, 112, 2421–2432. [Google Scholar] [CrossRef] [PubMed] [Green Version]
- Grassi, B.; Quaresima, V. Near-infrared spectroscopy and skeletal muscle oxidative function in vivo in health and disease: A review from an exercise physiology perspective. J. Biomed. Opt. 2016, 21, 091313. [Google Scholar] [CrossRef] [Green Version]


| Athletes | VO2peak (mL/kg/min) | RCP (mL/kg/min) | VT (mL/kg/min) | VO2peak (Watt) | RCP (Watt) | VT (Watt) | Δ50% RCP + VT (Watt) |
|---|---|---|---|---|---|---|---|
| 1 | 38.63 | 33.68 | 25.57 | 200.00 | 160.00 | 114.00 | 137.00 |
| 2 | 49.66 | 39.99 | 33.75 | 223.00 | 160.00 | 139.00 | 150.00 |
| 3 | 47.08 | 37.91 | 26.74 | 300.00 | 220.00 | 126.00 | 173.00 |
| 4 | 55.56 | 43.44 | 34.08 | 380.00 | 279.00 | 218.00 | 248.50 |
| 5 | 41.60 | 26.65 | 21.46 | 280.00 | 170.00 | 130.00 | 150.00 |
| 6 | 44.68 | 37.60 | 24.90 | 340.00 | 260.00 | 162.00 | 211.00 |
| 7 | 61.97 | 47.10 | 42.91 | 405.00 | 305.00 | 274.00 | 290.00 |
| 8 | 47.46 | 37.09 | 30.10 | 257.00 | 193.00 | 140.00 | 166.50 |
| 9 | 50.61 | 39.04 | 32.83 | 360.00 | 253.00 | 220.00 | 236.50 |
| 10 | 61.75 | 48.84 | 41.64 | 369.00 | 274.00 | 220.00 | 247.00 |
| Mean | 49.90 | 39.13 | 31.40 | 311.40 | 227.40 | 174.30 | 200.95 |
| SD | 7.80 | 6.40 | 7.10 | 70.10 | 53.90 | 54.30 | 52.60 |
| SEM | 2.50 | 2.00 | 2.20 | 22.20 | 17.10 | 17.20 | 16.60 |
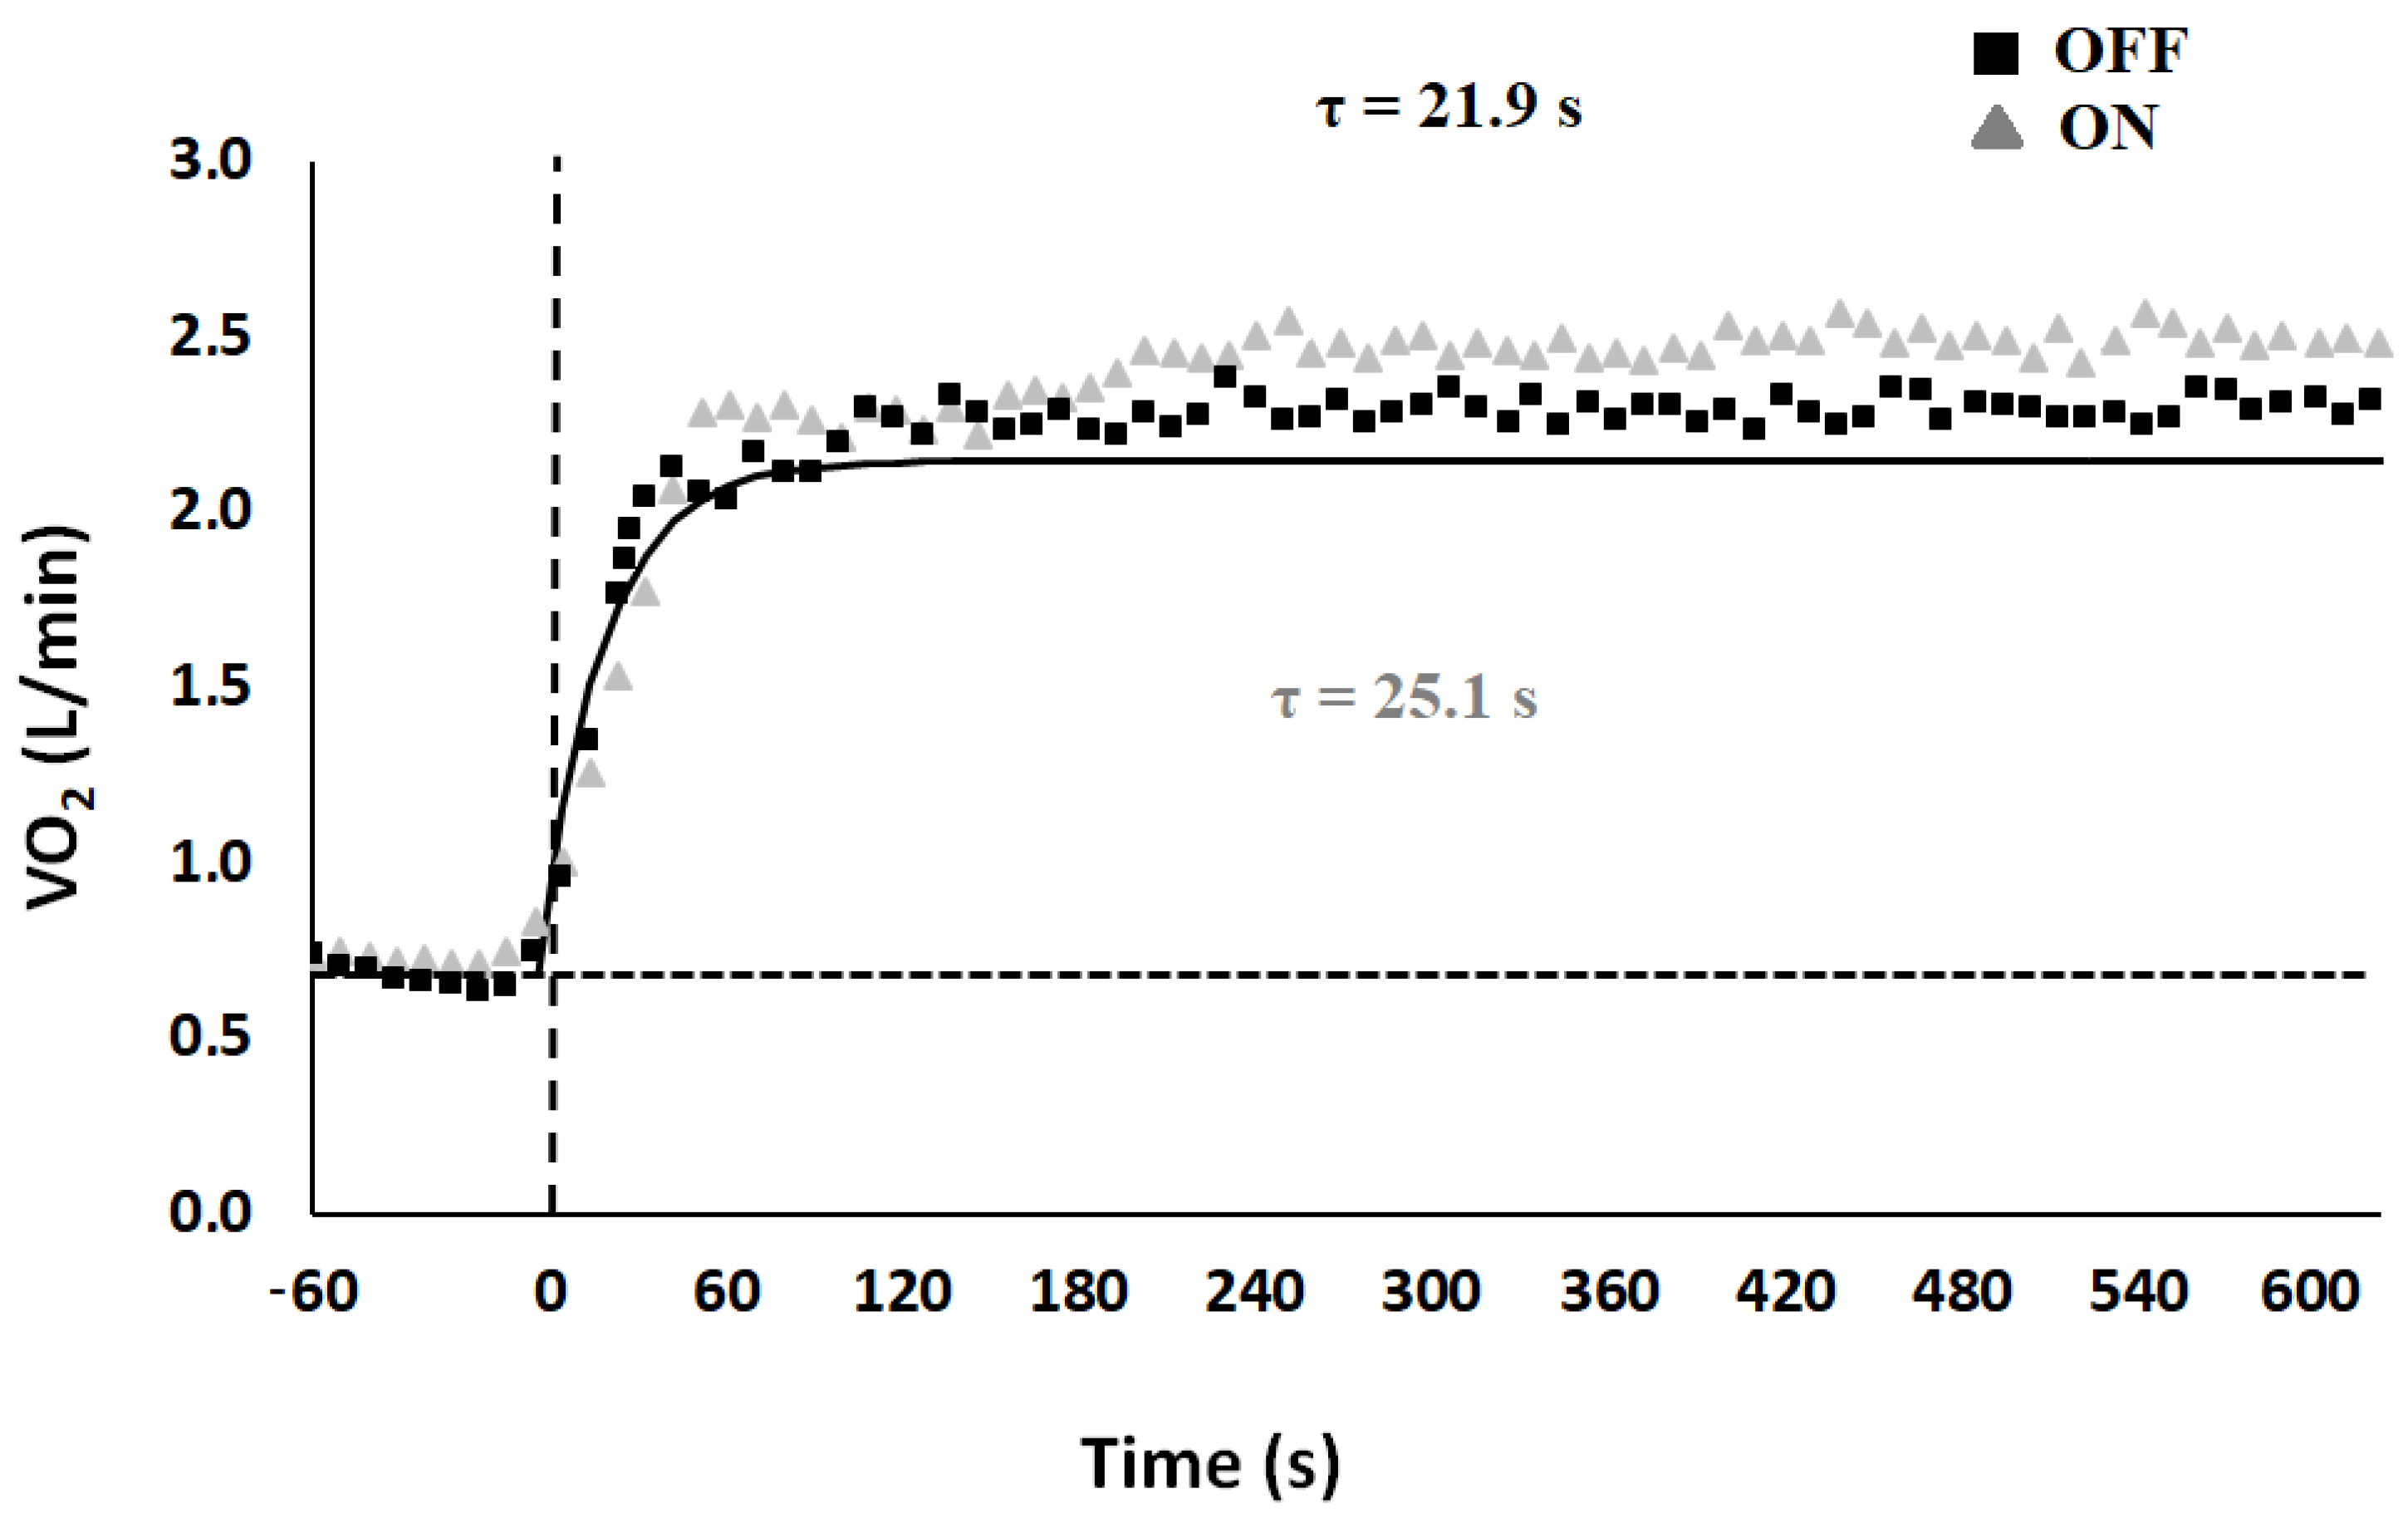
| VO2(b) (L/min) | VO2(ss) (L/min) | Ap (L/min) | TDp (s) | τp (s) | As (L/min) | TDs (s) | τs (s) | MRTp (s) | MRTs (s) | Sc (L/min) | |
|---|---|---|---|---|---|---|---|---|---|---|---|
| OFF | 0.70 ± 0.10 | 2.44 ± 0.20 | 1.80 ± 0.10 | 17.58 ± 0.90 | 21.94 ± 1.30 | 0.20 ± 0.04 | 171.70 ± 11.30 | 140.85 ± 19.40 | 39.52 ± 1.80 | 312.55 ± 27.03 | 0.12 ± 0.02 |
| ON | 0.79 ± 0.05 | 2.58 ± 0.20 * | 1.79 ± 0.10 | 19.21 ± 0.90 | 25.19 ± 2.10 * | 0.19 ± 0.04 | 141.87 ± 15.50 * | 159.61 ± 26.10 | 44.40 ± 2.80 * | 301.48 ± 25.90 | 0.10 ± 0.03 |
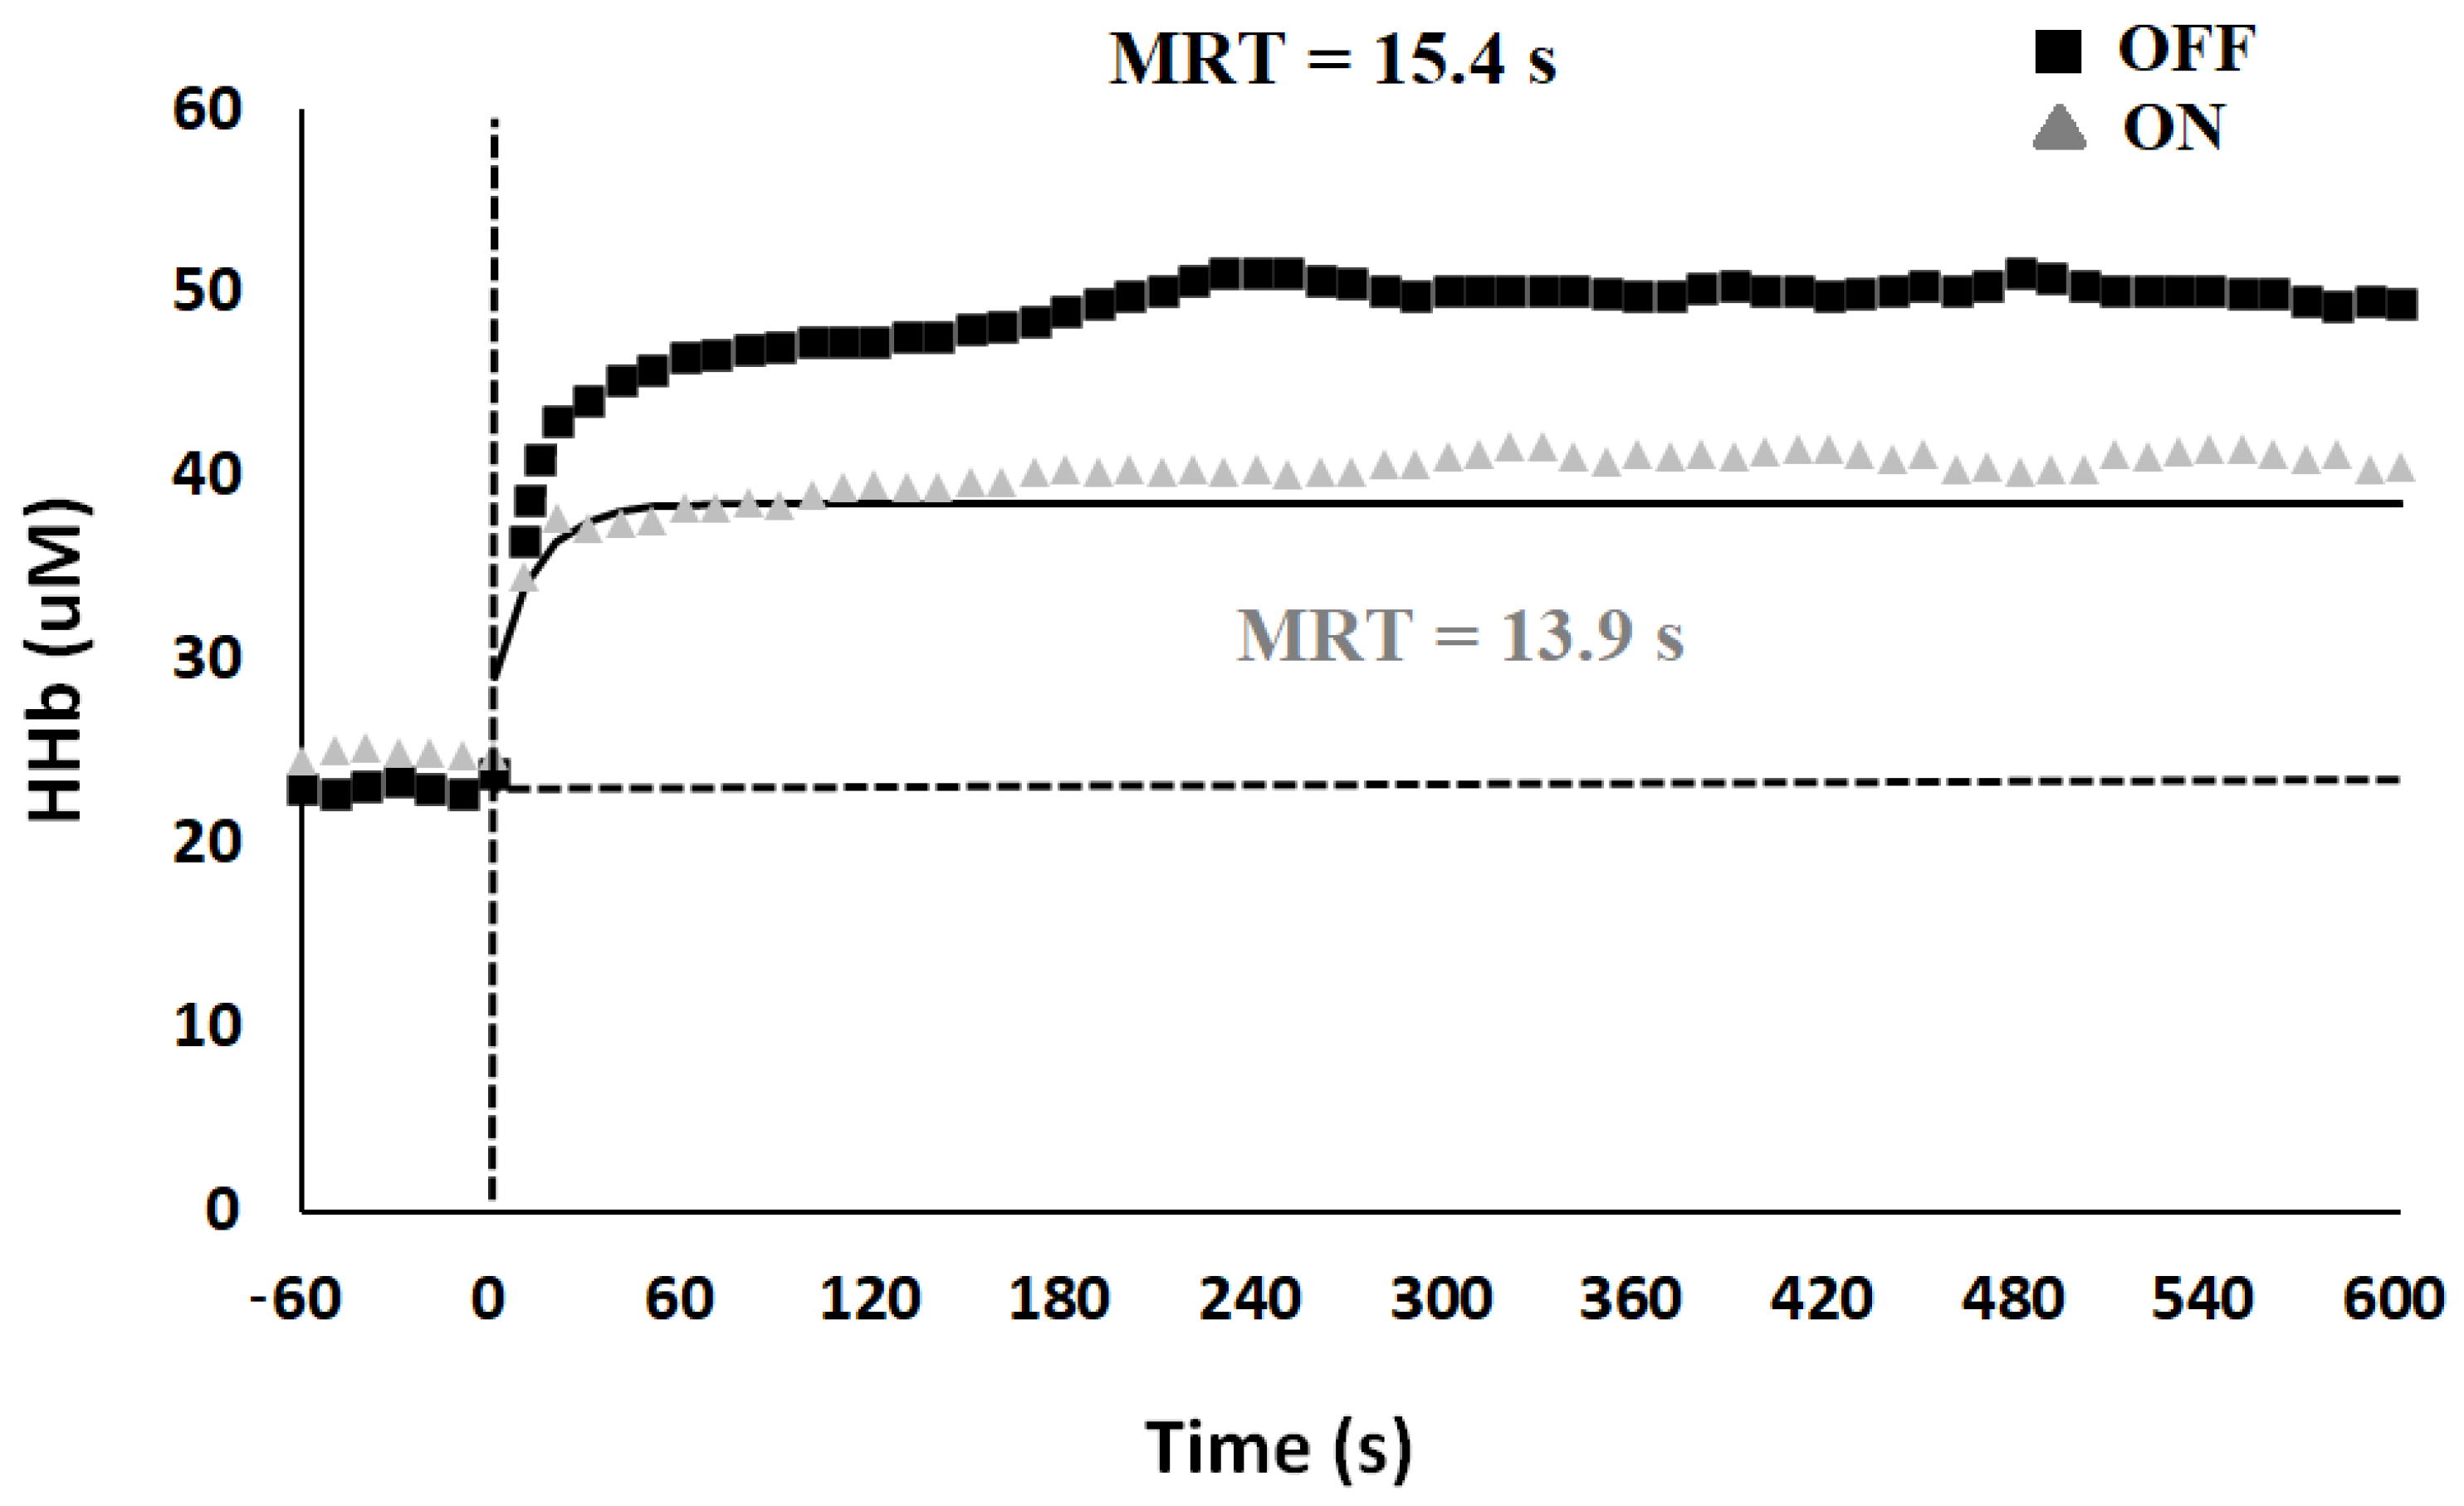
| HHb(b) (µM) | HHb(ss) (µM) | Ap (µM) | TDp (s) | Τp (s) | As (µM) | TDs (s) | Τs (s) | MRTp (s) | MRTs (s) | Sc (µM) | |
|---|---|---|---|---|---|---|---|---|---|---|---|
| OFF | 23.99 ± 3.50 | 50.40 ± 6.10 | 24.54 ± 4.10 | 9.56 ± 0.20 | 5.80 ± 0.50 | 9.96 ± 2.20 | 113.22 ± 16.40 | 110.69 ± 17.60 | 15.36 ± 0.50 | 223.91 ± 20.40 | 2.47 ± 0.40 |
| ON | 23.95 ± 3.30 | 43.08 ± 5.90 | 19.13 ± 2.80 | 9.54 ± 0.20 | 4.43 ± 0.50 * | 9.34 ± 2.20 | 90.61 ± 2.60 | 100.54 ± 11.70 | 13.97 ± 0.50 * | 191.15 ± 11.40 * | 2.11 ± 0.60 |
| OFF | ON | |
|---|---|---|
| ΔSAP (mmHg) | −4.98 ± 2.10 | 2.50 ± 2.00 * |
| ΔDAP (mmHg) | 0.01 ± 1.50 | 2.72 ± 2.10 |
| ΔMAP (mmHg) | −1.35 ± 1.50 | 1.88 ± 2.00 * |
| ΔCO (L/min) | 0.16 ± 0.20 | 0.31 ± 0.30 |
| ΔSV (mL/min) | −8.35 ± 1.60 | −5.41 ± 3.40 |
| ΔHR (beat/min) | 7.12 ± 1.70 | 7.00 ± 1.50 |
| ΔEJT (s) | −0.02 ± 0.01 | −0.02 ± 0.01 |
| ΔTPR (mmHg s/mL) | −0.04 ± 0.05 | −0.03 ± 0.10 |
| ΔHRV (ms) | −140.30 ± 30.10 | −132.25 ± 28.80 |
| ΔSDRR (ms) | −4.32 ± 4.10 | −1.60 ± 4.20 |
| ΔRMSSD (ms) | −12.97 ± 5.80 | −8.10 ± 5.20 * |
| ΔLF (Ln/ms2) | 0.02 ± 0.20 | 0.07 ± 0.30 |
| ΔHF (Ln/ms2) | −0.43 ± 0.20 | −0.13 ± 0.20 * |
| ΔLF/HF | 0.59 ± 0.20 | 0.17 ± 0.10 * |
| ΔBRS (ms/mmHg) | −2.75 ± 1.20 | −2.15 ± 1.80 |
Publisher’s Note: MDPI stays neutral with regard to jurisdictional claims in published maps and institutional affiliations. |
© 2021 by the authors. Licensee MDPI, Basel, Switzerland. This article is an open access article distributed under the terms and conditions of the Creative Commons Attribution (CC BY) license (https://creativecommons.org/licenses/by/4.0/).
Share and Cite
Piras, A.; Zini, L.; Trofè, A.; Campa, F.; Raffi, M. Effects of Acute Microcurrent Electrical Stimulation on Muscle Function and Subsequent Recovery Strategy. Int. J. Environ. Res. Public Health 2021, 18, 4597. https://0-doi-org.brum.beds.ac.uk/10.3390/ijerph18094597
Piras A, Zini L, Trofè A, Campa F, Raffi M. Effects of Acute Microcurrent Electrical Stimulation on Muscle Function and Subsequent Recovery Strategy. International Journal of Environmental Research and Public Health. 2021; 18(9):4597. https://0-doi-org.brum.beds.ac.uk/10.3390/ijerph18094597
Chicago/Turabian StylePiras, Alessandro, Lorenzo Zini, Aurelio Trofè, Francesco Campa, and Milena Raffi. 2021. "Effects of Acute Microcurrent Electrical Stimulation on Muscle Function and Subsequent Recovery Strategy" International Journal of Environmental Research and Public Health 18, no. 9: 4597. https://0-doi-org.brum.beds.ac.uk/10.3390/ijerph18094597