
On the Dynamics of the Psychosocial Work Environment and Employee Well-Being: A Latent Transition Approach


Abstract
:1. Introduction
2. Theoretical Background
2.1. Psychosocial Working Conditions
2.2. A Person-Centred Methodological Approach to Job Characteristics
2.2.1. Exploring Job Demand-Control Combinations
2.2.2. Adopting a Temporal Perspective
2.2.3. Linking Well-Being Outcomes
3. Methods
3.1. Procedure
3.2. Sample
3.2.1. Sample Characteristics
3.2.2. Selection Criteria
3.2.3. Sample Attrition
3.3. Measures
3.4. Data Analyses
3.4.1. Latent Profiles and Latent Profile Transition
3.4.2. Covariates and Outcomes
4. Results
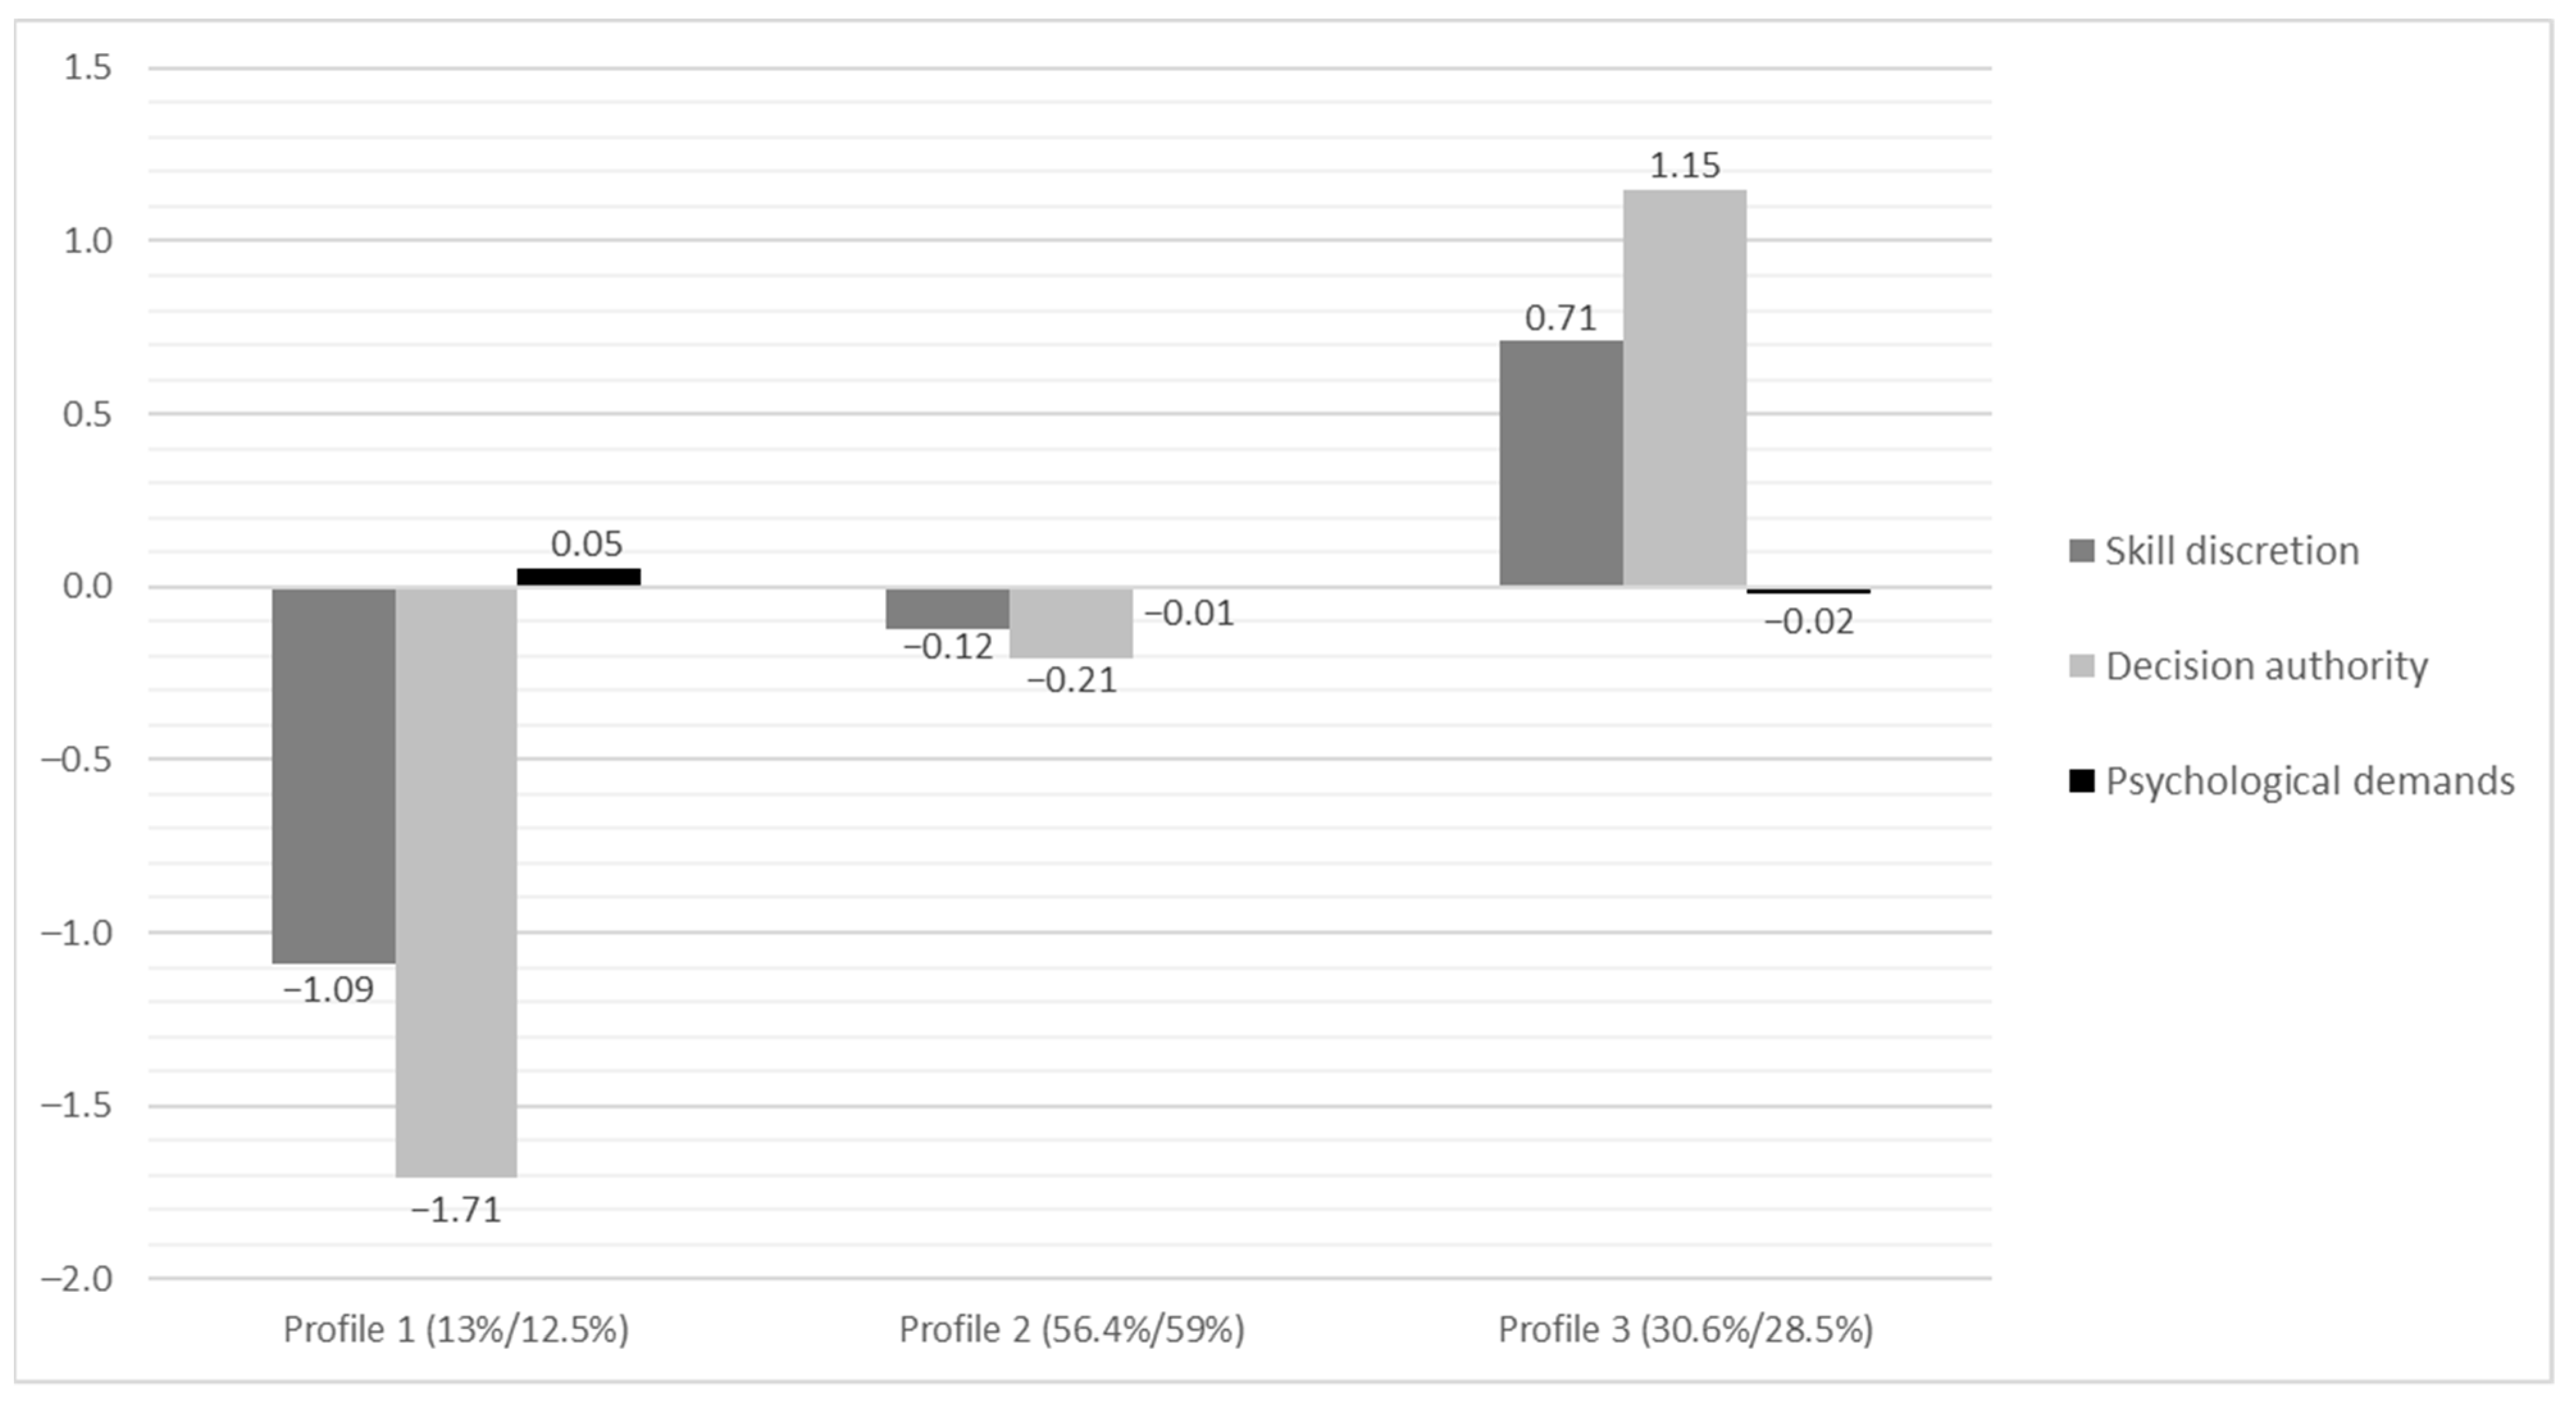
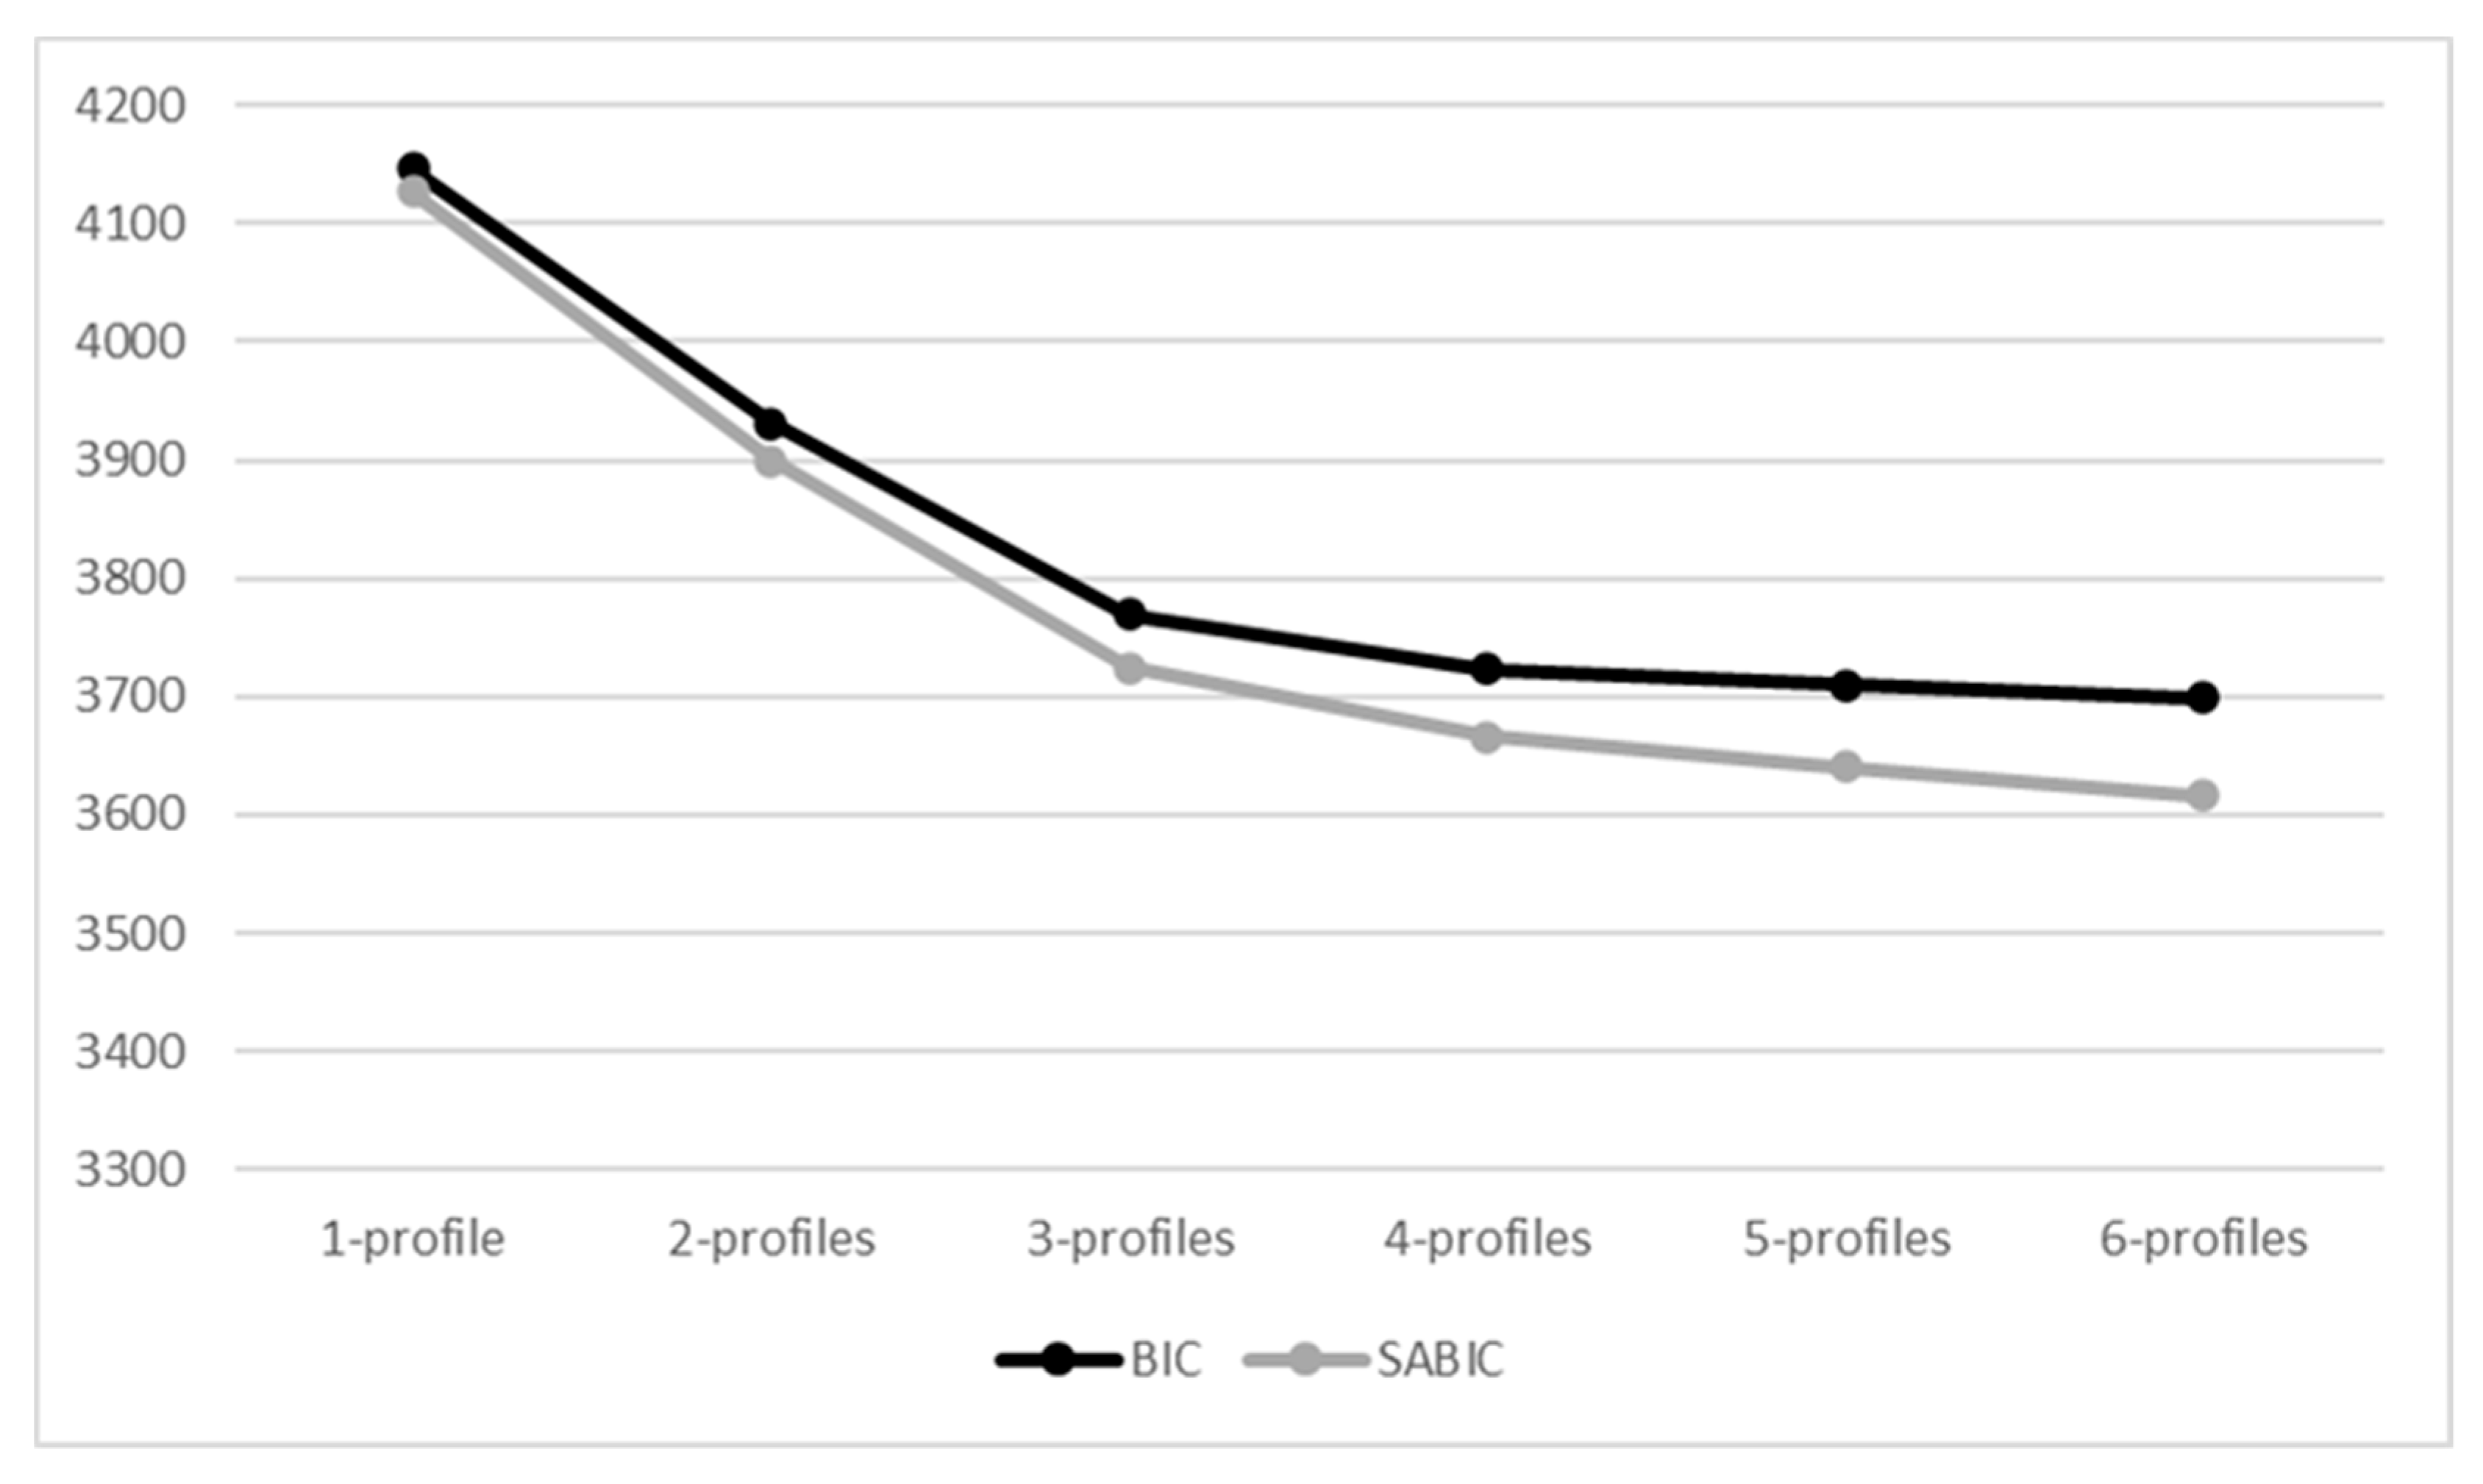
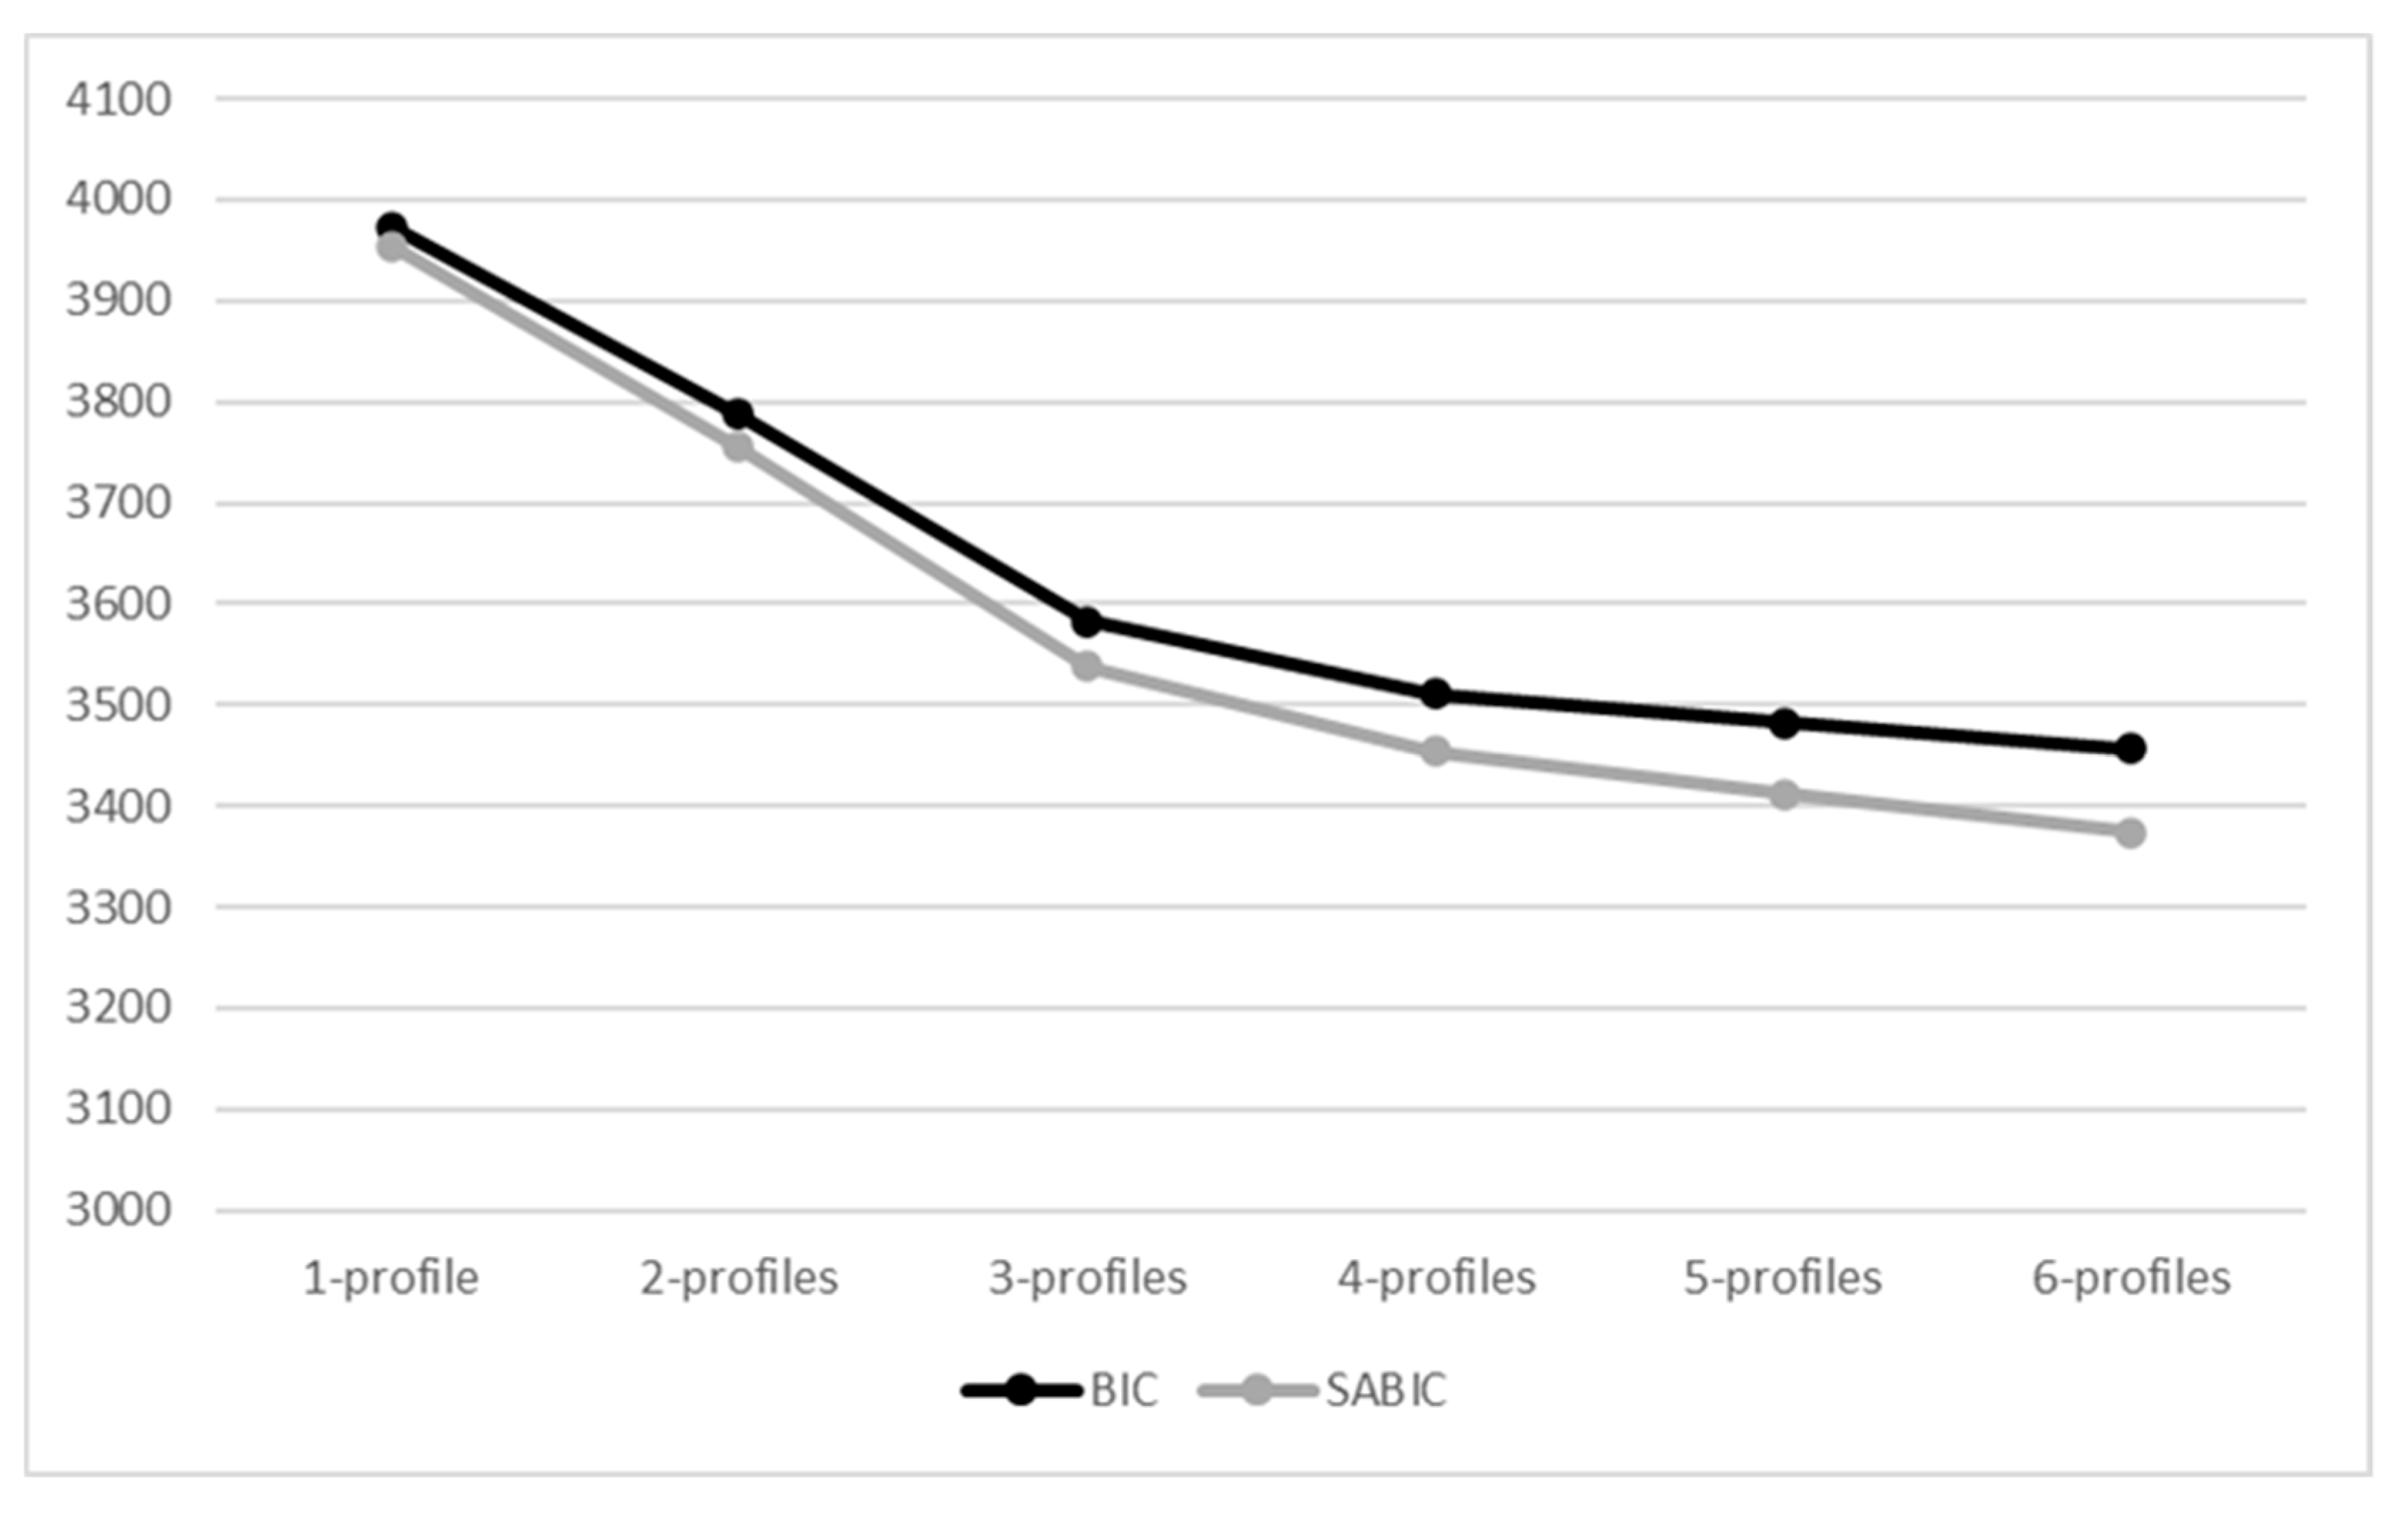
4.1. LPA Results
4.2. LTA Results
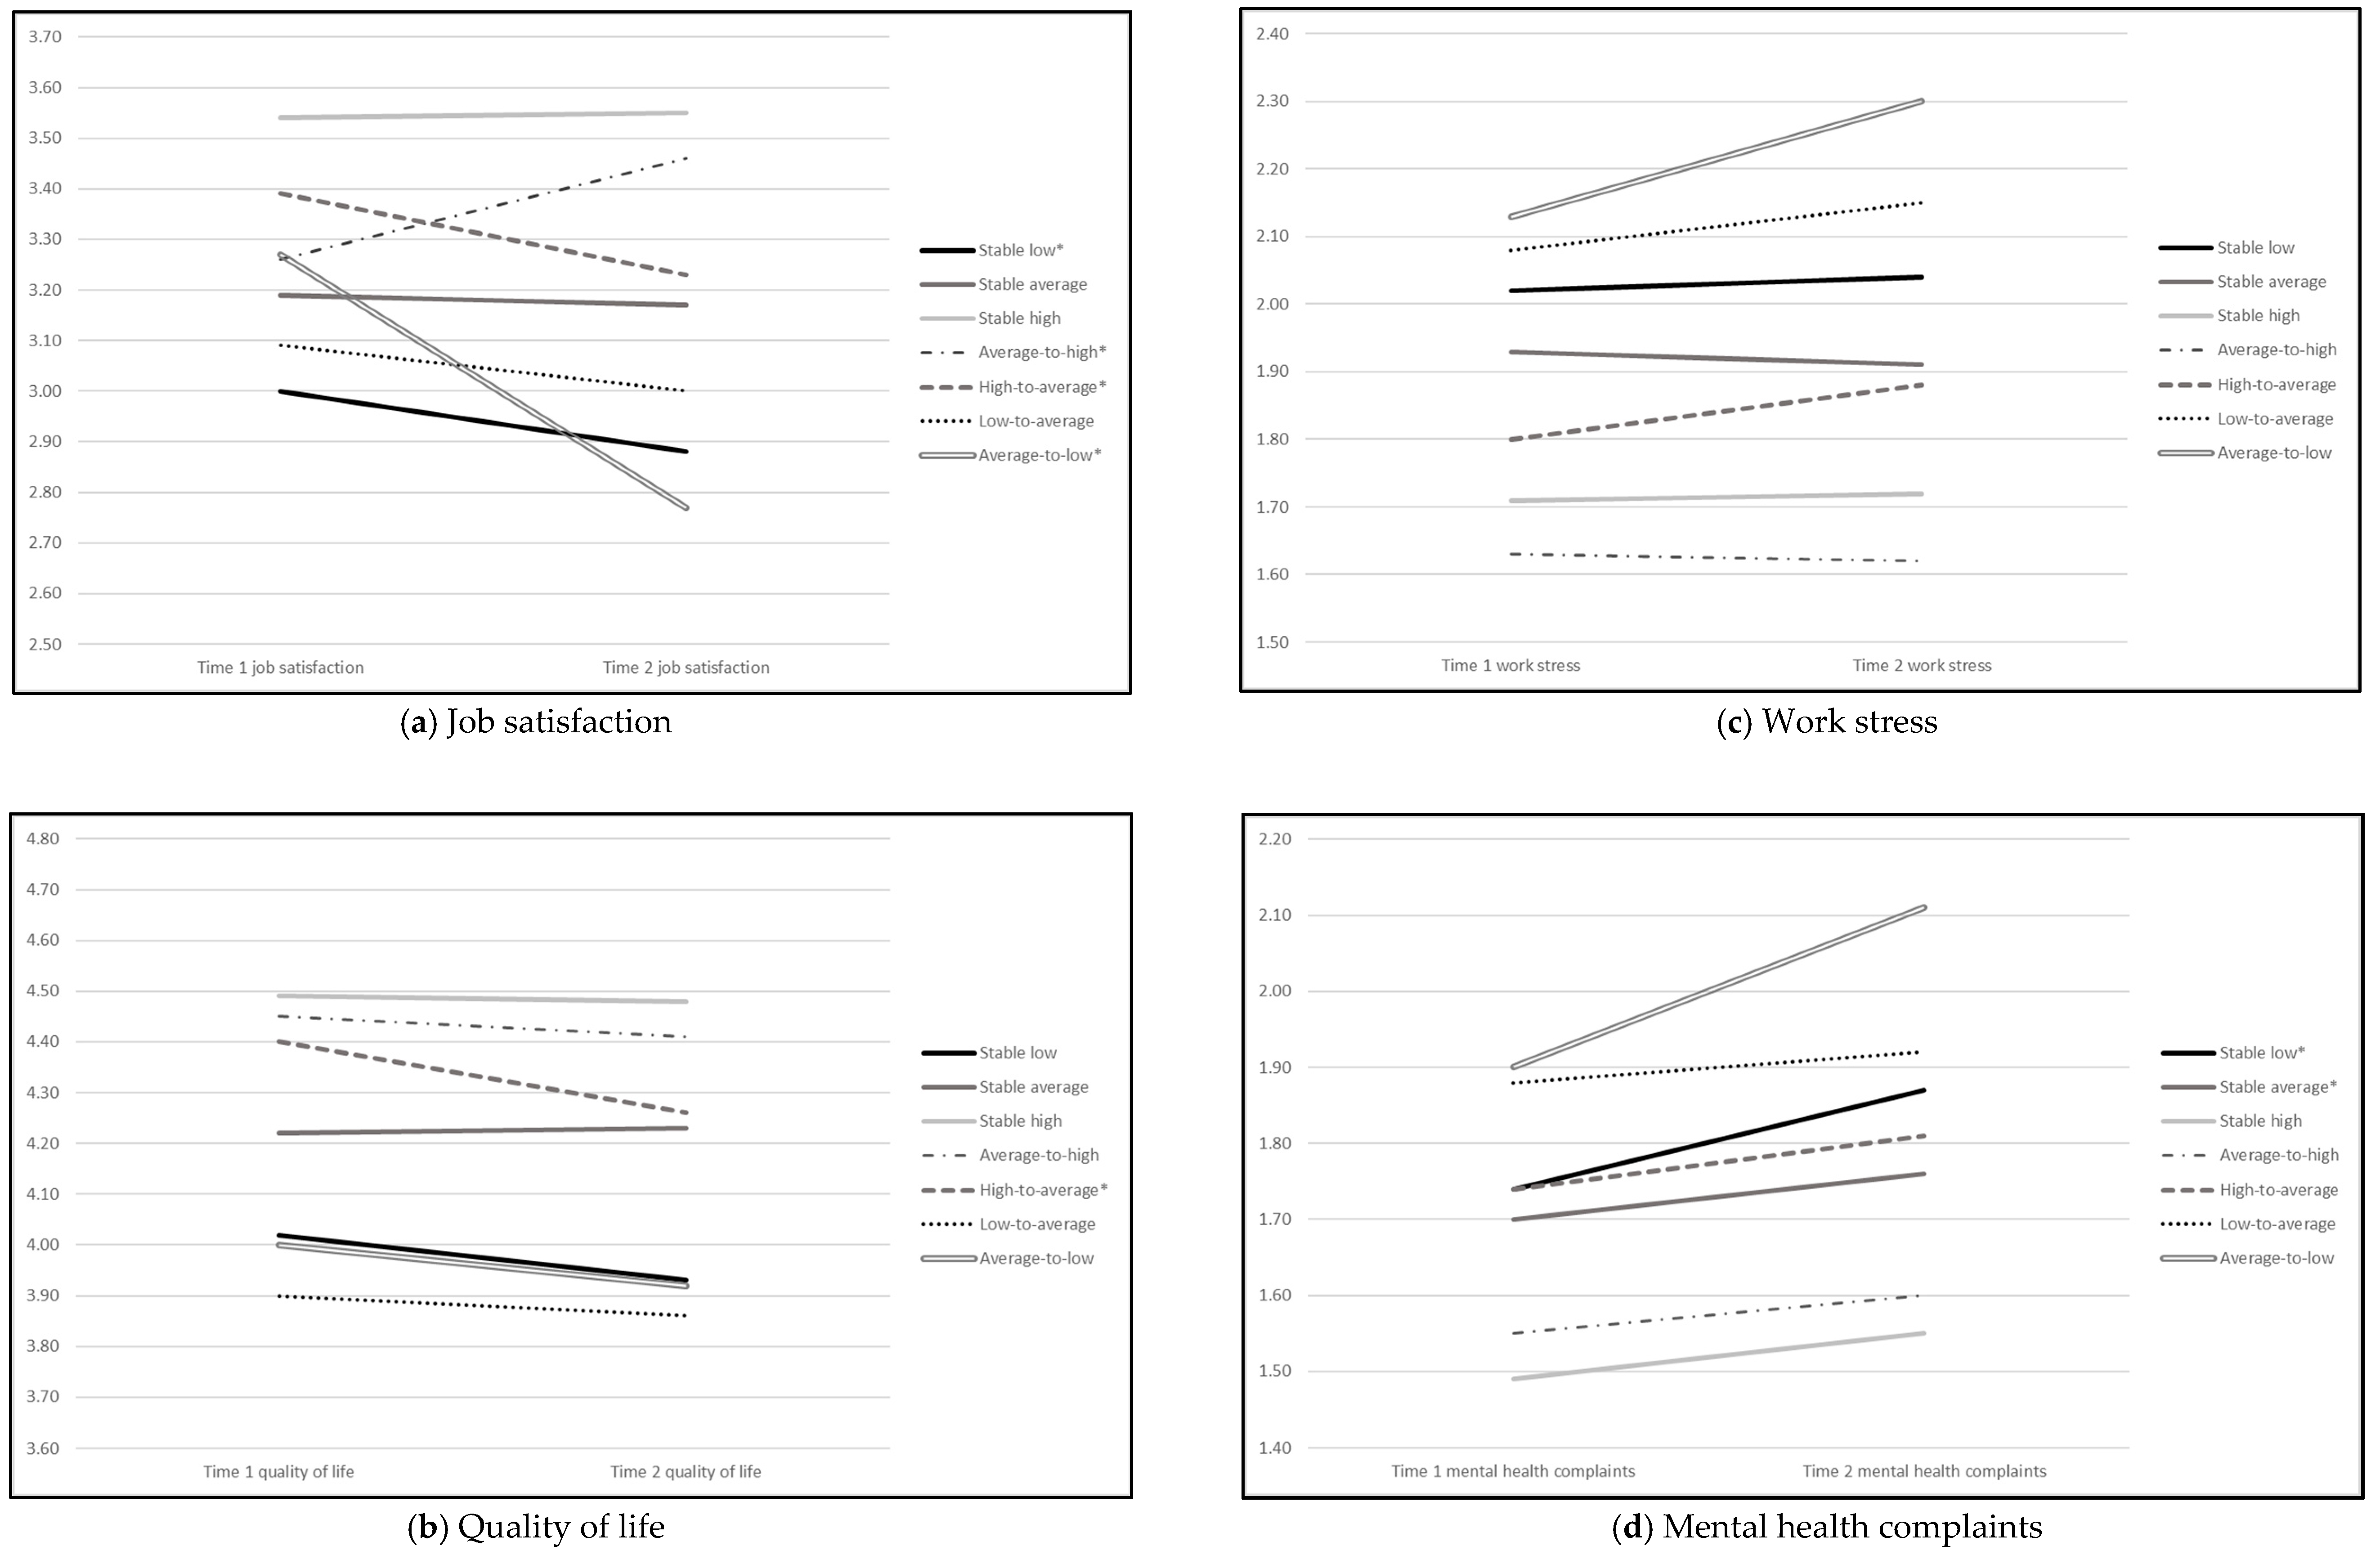
4.3. Outcome Analyses Results
5. Discussion
5.1. Interpretation of the Job Characteristics Profiles
5.2. Interpretation of Findings on Well-Being Outcomes
5.3. Implications and Limitations
6. Conclusions
Author Contributions
Funding
Ethics Statement
Informed Consent Statement
Data Availability Statement
Conflicts of Interest
Appendix A


| Variables | T1 Latent Profile Indicators | T2 Latent Profile Indicators | ||||
|---|---|---|---|---|---|---|
| JCD-Skill | JCD-Auto | JCD-Dem | JCD-Skill | JCD-Auto | JCD-Dem | |
| Age | 0.04 | 0.08 * | −0.05 | 0.05 | 0.06 | −0.05 |
| Gender | −0.04 | −0.08 ** | −0.06 | −0.05 | −0.07 * | −0.04 |
| Education | 0.36 *** | 0.19 *** | 0.08 * | 0.34 *** | 0.20 *** | 0.09 * |
| T1 Contract type | −0.02 | 0.06 | 0.02 | 0.01 | 0.06 | 0.08 * |
| T1 Household income | 0.25 *** | 0.19 *** | 0.11 ** | 0.25 *** | 0.14 *** | 0.10 ** |
| T2 Contract type | −0.01 | 0.05 | −0.03 | 0.01 | 0.06 | 0.07 * |
| T2 Household income | 0.28 *** | 0.18 *** | 0.12 *** | 0.28 *** | 0.15 *** | 0.10 ** |
| Covariates | Compared Profiles | Odds Ratio | 95%CI |
|---|---|---|---|
| Age | ns | ns | ns |
| Gender (female) | ns | ns | ns |
| Education (high) | 2 vs. 1 | 2.55 | [1.646;3.963] |
| 3 vs. 1 | 4.44 | [2.726;7.238] | |
| 3 vs. 2 | 1.74 | [1.243;2.434] | |
| Contract type (permanent) | ns | ns | ns |
| Household income (high) | 2 vs. 1 | 1.39 | [1.213;1.587] |
| 3 vs. 1 | 1.50 | [1.305;1.730] |
| Covariates | Compared Profiles | Odds Ratio | 95% CI |
|---|---|---|---|
| Age | ns | ns | ns |
| Gender (female) | 1 vs. 3 | 1.70 | [1.059;2.713] |
| Education (high) | 2 vs. 1 | 1.78 | [1.187;2.662] |
| 3 vs. 1 | 3.67 | [2.347;5.734] | |
| 3 vs. 2 | 2.06 | [1.499;2.840] | |
| Contract type (permanent) | ns | ns | ns |
| Household income (high) | 2 vs. 1 | 1.17 | [1.053;1.299] |
| 3 vs. 1 | 1.30 | [1.160;1.462] | |
| 3 vs. 2 | 1.11 | [1.025;1.209] |
| Time 2: Time 1: | Profile 1 | Profile 2 | Profile 3 |
|---|---|---|---|
| Profile 1 | 0.736 | 0.223 | 0.041 |
| Profile 2 | 0.048 | 0.860 | 0.092 |
| Profile 3 | 0.006 | 0.249 | 0.745 |
| Time 2: Time 1: | Profile 1 | Profile 2 | Profile 3 |
|---|---|---|---|
| Profile 1 | 92 | 22 | 6 |
| Profile 2 | 26 | 463 | 50 |
| Profile 3 | 2 | 79 | 219 |
References
- Ardito, C.; Leombruni, R.; Pacelli, L.; d’Errico, A. Health and Well-Being at Work: A Report Based on the Fifth European Working Conditions Survey; Eurofound: Dublin, Ireland, 2012. [Google Scholar]
- De Lange, A.H.; Taris, T.W.; Kompier, M.A.J.; Houtman, I.L.D.; Bongers, P.M. “The Very Best of the Millennium”: Longitudinal Research and the Demand-Control-(Support) Model. J. Occup. Health Psychol. 2003, 8, 282–305. [Google Scholar] [CrossRef] [PubMed] [Green Version]
- Karasek, R.A. Job Demands, Job Decision Latitude, and Mental Strain: Implications for Job Redesign. Adm. Sci. Q. 1979, 24, 285. [Google Scholar] [CrossRef]
- Bakker, A.B.; Demerouti, E. Job Demands–Resources Theory: Taking Stock and Looking Forward. J. Occup. Health Psychol. 2017, 22, 273–285. [Google Scholar] [CrossRef]
- Häusser, J.A.; Mojzisch, A.; Niesel, M.; Schulz-Hardt, S. Ten Years on: A Review of Recent Research on the Job Demand–Control (-Support) Model and Psychological Well-Being. Work Stress 2010, 24, 1–35. [Google Scholar] [CrossRef]
- Frese, M.; Zapf, D. Methodological issues in the study of work stress. In Causes, Coping and Consequences of Stress at Work; Cooper, C.L., Payne, R., Eds.; Wiley: Chichester, UK, 1988; pp. 375–411. [Google Scholar]
- Karasek, R.; Theorell, T. Healthy Work: Stress, Productivity, and the Reconstruction of Working Life; Basic Books: New York, NY, USA, 1990; ISBN 978-0-465-02897-9. [Google Scholar]
- Kain, J.; Jex, S. Karasek’s (1979) job demands-control model: A summary of current issues and recommendations for future research. In Research in Occupational Stress and Well-Being; Perrewé, P.L., Ganster, D.C., Eds.; Emerald Group Publishing Limited: Bingley, UK, 2010; Volume 8, pp. 237–268. ISBN 978-1-84950-712-7. [Google Scholar]
- Van der Doef, M.; Maes, S. The Job Demand-Control(-Support) Model and Physical Health Outcomes: A Review of the Strain and Buffer Hypotheses. Psychol. Health 1998, 13, 909–936. [Google Scholar] [CrossRef]
- Beehr, T.A.; Glaser, K.M.; Canali, K.G.; Wallwey, D.A. Back to Basics: Re-Examination of Demand-Control Theory of Occupational Stress. Work Stress 2001, 15, 115–130. [Google Scholar] [CrossRef]
- Dawson, K.M.; O’Brien, K.E.; Beehr, T.A. The Role of Hindrance Stressors in the Job Demand-Control-Support Model of Occupational Stress: A Proposed Theory Revision: Hindrance Stressors in the JDCS Model. J. Organiz. Behav. 2016, 37, 397–415. [Google Scholar] [CrossRef]
- De Jonge, J.; Van Breukelen, G.J.P.; Landeweerd, J.A.; Nijhuis, F.J.N. Comparing Group and Individual Level Assessments of Job Characteristics in Testing the Job Demand-Control Model: A Multilevel Approach. Hum. Relat. 1999, 52, 95–122. [Google Scholar] [CrossRef]
- De Jonge, J.; Dollard, M.F.; Dormann, C.; Le Blanc, P.M.; Houtman, I.L.D. The Demand-Control Model: Specific Demands, Specific Control, and Well-Defined Groups. Int. J. Stress Manag. 2000, 7, 269–287. [Google Scholar] [CrossRef]
- De Jonge, J.; Van Vegchel, N.; Shimazu, A.; Schaufeli, W.; Dormann, C. A Longitudinal Test of the Demand–Control Model Using Specific Job Demands and Specific Job Control. Int. J. Behav. Med. 2010, 17, 125–133. [Google Scholar] [CrossRef] [Green Version]
- Verhofstadt, E.; Baillien, E.; Verhaest, D.; De Witte, H. On the Moderating Role of Years of Work Experience in the Job Demand–Control Model. Econ. Ind. Democr. 2017, 38, 294–313. [Google Scholar] [CrossRef]
- Van der Doef, M.; Maes, S. The Job Demand-Control (-Support) Model and Psychological Well-Being: A Review of 20 Years of Empirical Research. Work Stress 1999, 13, 87–114. [Google Scholar] [CrossRef]
- Mervielde, I.; Asendorpf, J.B. Variable-centred and person-centred approaches to childhood personality. In Advances in Personality Psychol; Hampson, S.E., Ed.; Psychology Press: Hove, UK; Taylor & Francis Group: Abingdon, UK, 2000; pp. 37–76. [Google Scholar]
- Hofmans, J.; Wille, B.; Schreurs, B. Person-Centered Methods in Vocational Research. J. Vocat. Behav. 2020, 118, 103398. [Google Scholar] [CrossRef]
- Morin, A.J.S.; Marsh, H.W. Disentangling Shape from Level Effects in Person-Centered Analyses: An Illustration Based on University Teachers’ Multidimensional Profiles of Effectiveness. Struct. Equ. Model. A Multidiscip. J. 2015, 22, 39–59. [Google Scholar] [CrossRef]
- Van den Broeck, A.; De Cuyper, N.; Luyckx, K.; De Witte, H. Employees’ Job Demands–Resources Profiles, Burnout and Work Engagement: A Person-Centred Examination. Econ. Ind. Democr. 2012, 33, 691–706. [Google Scholar] [CrossRef] [Green Version]
- De Spiegelaere, S.; Ramioul, M.; Van Gyes, G. Good Employees through Good Jobs: A Latent Profile Analysis of Job Types and Employee Outcomes in the Belgian Electricity Sector. Empl. Relat. 2017, 39, 503–522. [Google Scholar] [CrossRef]
- Mäkikangas, A.; Tolvanen, A.; Aunola, K.; Feldt, T.; Mauno, S.; Kinnunen, U. Multilevel Latent Profile Analysis with Covariates: Identifying Job Characteristics Profiles in Hierarchical Data as an Example. Organ. Res. Methods 2018, 21, 931–954. [Google Scholar] [CrossRef]
- Keller, A.C.; Igic, I.; Meier, L.L.; Semmer, N.K.; Schaubroeck, J.M.; Brunner, B.; Elfering, A. Testing Job Typologies and Identifying At-Risk Subpopulations Using Factor Mixture Models. J. Occup. Health Psychol. 2017, 22, 503–517. [Google Scholar] [CrossRef]
- Mäkikangas, A.; Schaufeli, W.; Leskinen, E.; Kinnunen, U.; Hyvönen, K.; Feldt, T. Long-Term Development of Employee Well-Being: A Latent Transition Approach. J. Happiness Stud. 2016, 17, 2325–2345. [Google Scholar] [CrossRef]
- Moazami-Goodarzi, A.; Nurmi, J.-E.; Mauno, S.; Aunola, K.; Rantanen, J. Longitudinal Latent Profiles of Work–Family Balance: Examination of Antecedents and Outcomes. Int. J. Stress Manag. 2019, 26, 65–77. [Google Scholar] [CrossRef]
- Chawla, N.; MacGowan, R.L.; Gabriel, A.S.; Podsakoff, N.P. Unplugging or Staying Connected? Examining the Nature, Antecedents, and Consequences of Profiles of Daily Recovery Experiences. J. Appl. Psychol. 2020, 105, 19–39. [Google Scholar] [CrossRef]
- Igic, I.; Keller, A.; Elfering, A.; Tschan, F.; Kälin, W.; Semmer, N.K. Ten-Year Trajectories of Stressors and Resources at Work: Cumulative and Chronic Effects on Health and Well-Being. J. Appl. Psychol. 2017, 102, 1317–1343. [Google Scholar] [CrossRef] [PubMed] [Green Version]
- Bujacz, A.; Bernhard-Oettel, C.; Rigotti, T.; Magnusson Hanson, L.; Lindfors, P. Psychosocial Working Conditions among High-Skilled Workers: A Latent Transition Analysis. J. Occup. Health Psychol. 2018, 23, 223–236. [Google Scholar] [CrossRef] [PubMed]
- Locke, E.A. What Is Job Satisfaction? Organ. Behav. Hum. Perform. 1969, 4, 309–336. [Google Scholar] [CrossRef]
- De Bruin, G.P.; Taylor, N. Development of the Sources of Work Stress Inventory. South Afr. J. Psychol. 2005, 35, 748–765. [Google Scholar] [CrossRef]
- Felce, D.; Perry, J. Quality of Life: Its Definition and Measurement. Res. Dev. Disabil. 1995, 16, 51–74. [Google Scholar] [CrossRef]
- Leiter, M.P.; Durup, M.J. Work, Home, and In-Between: A Longitudinal Study of Spillover. J. Appl. Behav. Sci. 1996, 32, 29–47. [Google Scholar] [CrossRef]
- Maggiori, C.; Rossier, J.; Krings, F.; Johnston, C.S.; Massoudi, K. Career Pathways and Professional Transitions: Preliminary Results from the First Wave of a 7-Year Longitudinal Study. In Surveying Human Vulnerabilities across the Life Course; Oris, M., Roberts, C., Joye, D., Ernst Stähli, M., Eds.; Life Course Research and Social Policies; Springer International Publishing: Cham, Switzerland, 2016; pp. 131–157. ISBN 978-3-319-24157-9. [Google Scholar]
- Karasek, R. The Job Content Questionnaire (JCQ) and User’s Guide; University of Massachusetts: Lowell, MA, USA, 1985. [Google Scholar]
- Ursachi, G.; Horodnic, I.A.; Zait, A. How Reliable Are Measurement Scales? External Factors with Indirect Influence on Reliability Estimators. Procedia Econ. Financ. 2015, 20, 679–686. [Google Scholar] [CrossRef] [Green Version]
- Eum, K.-D.; Li, J.; Jhun, H.-J.; Park, J.-T.; Tak, S.-W.; Karasek, R.; Cho, S.-I. Psychometric Properties of the Korean Version of the Job Content Questionnaire: Data from Health Care Workers. Int. Arch. Occup. Environ. Health 2007, 80, 497–504. [Google Scholar] [CrossRef] [PubMed]
- Karasek, R.; Brisson, C.; Kawakami, N.; Houtman, I.; Bongers, P.; Amick, B. The Job Content Questionnaire (JCQ): An Instrument for Internationally Comparative Assessments of Psychosocial Job Characteristics. J. Occup. Health Psychol. 1998, 3, 322–355. [Google Scholar] [CrossRef]
- MacDonald, L.A.; Karasek, R.A.; Punnett, L.; Scharf, T. Covariation between Workplace Physical and Psychosocial Stressors: Evidence and Implications for Occupational Health Research and Prevention. Ergonomics 2001, 44, 696–718. [Google Scholar] [CrossRef] [PubMed]
- Goldberg, D.; Williams, P. General Health Questionnaire; NFER-Nelson: Windsor, UK, 1988. [Google Scholar]
- Lanza, S.T.; Bray, B.C.; Collins, L.M. An Introduction to Latent Class and Latent Transition Analysis. In Handbook of Psychology, 2nd ed.; Weiner, I., Ed.; John Wiley & Sons, Inc.: Hoboken, NJ, USA, 2012; ISBN 978-0-470-61904-9. [Google Scholar]
- Nylund, K.L.; Asparouhov, T.; Muthén, B.O. Deciding on the Number of Classes in Latent Class Analysis and Growth Mixture Modeling: A Monte Carlo Simulation Study. Struct. Equ. Model. A Multidiscip. J. 2007, 14, 535–569. [Google Scholar] [CrossRef]
- Collins, L.M.; Lanza, S.T. (Eds.) Latent Class and Latent Transition Analysis; Wiley Series in Probability and Statistics; John Wiley & Sons: Hoboken, NJ, USA, 2010; ISBN 978-0-470-22839-5. [Google Scholar]
- Muthén, L.K. and Muthén, B.O. Mplus User’s Guide, 8th ed.; Muthén & Muthén: Los Angeles, CA, USA, 1998–2017. [Google Scholar]
- Asparouhov, T.; Muthén, B. Auxiliary Variables in Mixture Modeling: Three-Step Approaches Using Mplus. Struct. Equ. Model. A Multidiscip. J. 2014, 21, 329–341. [Google Scholar] [CrossRef]
- Bakk, Z.; Vermunt, J.K. Robustness of Stepwise Latent Class Modeling with Continuous Distal Outcomes. Struct. Equ. Model. A Multidiscip. J. 2016, 23, 20–31. [Google Scholar] [CrossRef] [Green Version]
- Morin, A.J.S.; Meyer, J.P.; Creusier, J.; Biétry, F. Multiple-Group Analysis of Similarity in Latent Profile Solutions. Organ. Res. Methods 2016, 19, 231–254. [Google Scholar] [CrossRef]
- Sixth European Working Conditions Survey—Overview Report (2017 Update); Eurofound, Publications Office of the European Union: Luxembourg, 2017; p. 160.
- Hobfoll, S.E. The Influence of Culture, Community, and the Nested-Self in the Stress Process: Advancing Conservation of Resources Theory. Appl. Psychol. 2001, 50, 337–421. [Google Scholar] [CrossRef]
- Garst, H.; Frese, M.; Molenaar, P.C.M. The Temporal Factor of Change in Stressor–Strain Relationships: A Growth Curve Model on a Longitudinal Study in East Germany. J. Appl. Psychol. 2000, 85, 417–438. [Google Scholar] [CrossRef]
- Taris, T.W.; Feij, J.A. Learning and Strain Among Newcomers: A Three-Wave Study on the Effects of Job Demands and Job Control. J. Psychol. 2004, 138, 543–563. [Google Scholar] [CrossRef]
- Taris, T.W.; Kompier, M.A.J.; De Lange, A.H.; Schaufeli, W.B.; Schreurs, P.J.G. Learning New Behaviour Patterns: A Longitudinal Test of Karasek’s Active Learning Hypothesis among Dutch Teachers. Work Stress 2003, 17, 1–20. [Google Scholar] [CrossRef]
- McClenahan, C.A.; Giles, M.L.; Mallett, J. The Importance of Context Specificity in Work Stress Research: A Test of the Demand-Control-Support Model in Academics. Work Stress 2007, 21, 85–95. [Google Scholar] [CrossRef]
- Choi, B.; Kawakami, N.; Chang, S.; Koh, S.; Bjorner, J.; Punnett, L.; Karasek, R. A Cross-National Study on the Multidimensional Characteristics of the Five-Item Psychological Demands Scale of the Job Content Questionnaire. Int. J. Behav. Med. 2008, 15, 120–132. [Google Scholar] [CrossRef] [PubMed]
- Ostry, A.S.; Marion, S.A.; Demers, P.A.; Hershler, R.; Kelly, S.; Teschke, K.; Hertzman, C. Measuring Psychosocial Job Strain with the Job Content Questionnaire Using Experienced Job Evaluators. Am. J. Ind. Med. 2001, 39, 397–401. [Google Scholar] [CrossRef] [PubMed]
- Crawford, E.R.; LePine, J.A.; Rich, B.L. Linking Job Demands and Resources to Employee Engagement and Burnout: A Theoretical Extension and Meta-Analytic Test. J. Appl. Psychol. 2010, 95, 834–848. [Google Scholar] [CrossRef] [PubMed]


| Variables | M (SD) | 1 | 2 | 3 | 4 | 5 | 6 | 7 | 8 | 9 | 10 | 11 | 12 | 13 |
|---|---|---|---|---|---|---|---|---|---|---|---|---|---|---|
| 1. T1 JCD-skill | 3.04 (0.46) | |||||||||||||
| 2. T1 JCD-auto | 3.10 (0.61) | 0.54 *** | ||||||||||||
| 3. T1 JCD-dem | 2.61 (0.44) | 0.18 *** | −0.05 | |||||||||||
| 4. T1 Jobsat | 3.27 (0.58) | 0.26 *** | 0.31 *** | −0.25 *** | ||||||||||
| 5. T1 Wstress | 1.87 (0.62) | −0.02 | −0.17 *** | 0.41 *** | −0.47 *** | |||||||||
| 6. T1 QL | 4.28 (0.65) | 0.20 *** | 0.26 *** | −0.11 ** | 0.24 *** | −0.31 *** | ||||||||
| 7. T1 MH | 1.66 (0.57) | −0.08 * | −0.14 *** | 0.26 *** | −0.32 *** | 0.61 *** | −0.40 *** | |||||||
| 8. T2 JCD-skill | 3.05 (0.44) | 0.75 *** | 0.43 *** | 0.17 *** | 0.19 *** | −0.02 | 0.21 *** | −0.09 ** | ||||||
| 9. T2 JCD-auto | 3.10 (0.60) | 0.44 *** | 0.67 *** | −0.04 | 0.22 *** | −0.19 *** | 0.23 *** | −0.16 *** | 0.53 *** | |||||
| 10. T2 JCD-dem | 2.61 (0.42) | 0.17 *** | −0.02 | 0.62 *** | −0.17 *** | 0.31 *** | −0.10 ** | 0.22 *** | 0.19 *** | −0.04 | ||||
| 11. T2 Jobsat | 3.24 (0.59) | 0.21 *** | 0.29 *** | −0.19 *** | 0.48 *** | −0.35 *** | 0.24 *** | −0.29 *** | 0.29 *** | 0.38 *** | −0.23 *** | |||
| 12. T2 Wstress | 1.87 (0.64) | <0.01 | −0.15 *** | 0.32 *** | −0.31 *** | 0.69 *** | −0.27 *** | 0.49 *** | −0.03 | −0.23 *** | 0.40 *** | −0.49 *** | ||
| 13. T2 QL | 4.25 (0.68) | 0.21 *** | 0.24 *** | −0.06 | 0.22 *** | −0.26 *** | 0.61 *** | −0.32 *** | 0.25 *** | 0.25 *** | −0.13 *** | 0.35 *** | −0.36 *** | |
| 14. T2 MH | 1.73 (0.64) | −0.09 ** | −0.14 *** | 0.16 *** | −0.23 *** | 0.42 *** | −0.29 *** | 0.56 *** | −0.13 *** | −0.21 *** | 0.23 *** | −0.39 *** | 0.59 *** | −0.45 *** |
| Model Estimation Steps | AIC | BIC | SaBIC | LMR (p) | BLRT (p) | Entropy | Smallest Profile (%) |
|---|---|---|---|---|---|---|---|
| LPA Time 1 | |||||||
| 1-profile solution | 4117.309 | 4146.504 | 4127.448 | - | - | 1.000 | 100 |
| 2-profile solution | 3882.880 | 3931.539 | 3899.779 | 0.007 | <0.001 | 0.570 | 34.9 |
| 3-profile solution | 3700.847 | 3768.969 | 3724.506 | <0.001 | <0.001 | 0.847 | 11.3 |
| 4-profile solution | 3635.454 | 3723.040 | 3665.873 | 0.031 | <0.001 | 0.901 | 1.8 |
| 5-profile solution | 3603.149 | 3710.199 | 3640.328 | 0.039 | <0.001 | 0.802 | 2.0 |
| 6-profile solution | 3572.382 | 3698.895 | 3616.320 | 0.162 | <0.001 | 0.802 | 1.0 |
| LPA Time 2 | |||||||
| 1-profile solution | 3944.652 | 3973.847 | 3954.792 | - | - | 1.000 | 100 |
| 2-profile solution | 3738.577 | 3787.236 | 3755.476 | 0.007 | <0.001 | 0.509 | 43.2 |
| 3-profile solution | 3514.577 | 3582.699 | 3538.235 | <0.001 | <0.001 | 0.882 | 12.5 |
| 4-profile solution | 3423.185 | 3510.771 | 3453.604 | <0.001 | <0.001 | 0.932 | 1.2 |
| 5-profile solution | 3374.967 | 3482.017 | 3412.146 | <0.001 | <0.001 | 0.930 | 1.0 |
| 6-profile solution | 3330.157 | 3456.670 | 3374.095 | 0.007 | <0.001 | 0.940 | 0.9 |
| LPA Time 1−Time 2 tests of equivalence | |||||||
| 3-3 profile model unconstrained | 7215.424 | 7351.669 | 7262.741 | - | - | 0.864 | 11.3–12.5 |
| 3-3 profile model means constrained | 7208.188 | 7300.640 | 7240.297 | - | - | 0.863 | 12.3–11.9 |
| 3-3 profile model means and variances constrained | 7205.127 | 7282.981 | 7232.166 | - | - | 0.863 | 12.4–11.8 |
| LTA Time 1 -> Time 2 | |||||||
| 3->3 model means and variances constrained | 6741.817 | 6839.135 | 6775.616 | - | - | 0.865 | 13.0–12.5 |
| Job Characteristics Profiles | ||||
|---|---|---|---|---|
| Well-Being Indicators | Low Resources | Average Resources | High Resources | Overall Test |
| T1 Job satisfaction | 2.95 | 3.19 | 3.52 | 88.98 *** |
| T2 Job satisfaction | 2.82 | 3.17 | 3.58 | 153.46 *** |
| T1 Work stress | 2.10 | 1.91 | 1.71 | 30.26 *** |
| T2 Work stress | 2.13 | 1.91 | 1.67 | 42.10 *** |
| T1 Mental health complaints | 1.82 n | 1.70 n | 1.54 | 18.13 *** |
| T2 Mental health complaints | 1.96 | 1.78 | 1.54 | 37.87 *** |
| T1 Quality of life | 3.90 | 4.25 | 4.47 | 48.87 *** |
| T2 Quality of life | 3.84 | 4.24 | 4.45 | 49.23 *** |
Publisher’s Note: MDPI stays neutral with regard to jurisdictional claims in published maps and institutional affiliations. |
© 2021 by the authors. Licensee MDPI, Basel, Switzerland. This article is an open access article distributed under the terms and conditions of the Creative Commons Attribution (CC BY) license (https://creativecommons.org/licenses/by/4.0/).
Share and Cite
Urbanaviciute, I.; Massoudi, K.; Toscanelli, C.; De Witte, H. On the Dynamics of the Psychosocial Work Environment and Employee Well-Being: A Latent Transition Approach. Int. J. Environ. Res. Public Health 2021, 18, 4744. https://0-doi-org.brum.beds.ac.uk/10.3390/ijerph18094744
Urbanaviciute I, Massoudi K, Toscanelli C, De Witte H. On the Dynamics of the Psychosocial Work Environment and Employee Well-Being: A Latent Transition Approach. International Journal of Environmental Research and Public Health. 2021; 18(9):4744. https://0-doi-org.brum.beds.ac.uk/10.3390/ijerph18094744
Chicago/Turabian StyleUrbanaviciute, Ieva, Koorosh Massoudi, Cecilia Toscanelli, and Hans De Witte. 2021. "On the Dynamics of the Psychosocial Work Environment and Employee Well-Being: A Latent Transition Approach" International Journal of Environmental Research and Public Health 18, no. 9: 4744. https://0-doi-org.brum.beds.ac.uk/10.3390/ijerph18094744