
Dietary Acid Load, Serum Polychlorinated Biphenyl Levels, and Mortality Following Breast Cancer in the Long Island Breast Cancer Study Project

 , ,
, ,
Abstract
:1. Introduction
2. Materials and Methods
2.1. Study Design
2.2. Outcome Assessment
2.3. Dietary Assessment
2.4. PCBs Measurement
2.5. Covariates
2.6. Statistical Analysis
3. Results
4. Discussion
5. Conclusions
Author Contributions
Funding
Institutional Review Board Statement
Informed Consent Statement
Data Availability Statement
Acknowledgments
Conflicts of Interest
References
- Rock, C.L.; Doyle, C.; Demark-Wahnefried, W.; Meyerhardt, J.; Courneya, K.S.; Schwartz, A.L.; Bandera, E.V.; Hamilton, K.K.; Grant, B.; McCullough, M.; et al. Nutrition and physical activity guidelines for cancer survivors. CA Cancer J. Clin. 2012, 62, 243–274. [Google Scholar] [CrossRef] [PubMed] [Green Version]
- Wang, F.; Cai, H.; Gu, K.; Shi, L.; Yu, D.; Zhang, M.; Zheng, W.; Zheng, Y.; Bao, P.; Shu, X.O. Adherence to dietary recommendations among long-term breast cancer survivors and cancer outcome associations. Cancer Epidemiol. Biomark. Prev. 2020, 29, 386–395. [Google Scholar] [CrossRef]
- Chlebowski, R.T.; Blackburn, G.L.; Elashoff, R.E.; Thomson, C.; Goodman, M.T.; Shapiro, A.; Giuliano, A.E.; Karanja, N.; Hoy, M.K.; Nixon, D.W. Dietary fat reduction in postmenopausal women with primary breast cancer: Phase III women’s intervention nutrition study (WINS). J. Clin. Oncol. 2005, 23, 10. [Google Scholar] [CrossRef]
- Quade, B.N.; Parker, M.D.; Occhipinti, R. The therapeutic importance of acid-base balance. Biochem. Pharmacol. 2021, 183, 114278. [Google Scholar] [CrossRef] [PubMed]
- Hopkins, E.; Sanvictores, T.; Sharma, S. Physiology, Acid Base Balance [Updated 2021 Sep 14]; StatPearls Publishing: Bethesda, MD, USA, 2021. [Google Scholar]
- Wu, T.; Seaver, P.; Lemus, H.; Hollenbach, K.; Wang, E.; Pierce, J.P. Associations between dietary acid load and biomarkers of inflammation and hyperglycemia in breast cancer survivors. Nutrients 2019, 11, 1913. [Google Scholar] [CrossRef] [PubMed] [Green Version]
- Scialla, J.J.; Anderson, C.A.M. Dietary acid load: A novel nutritional target in chronic kidney disease? Adv. Chronic Kidney Dis. 2013, 20, 141–149. [Google Scholar] [CrossRef] [Green Version]
- Gupta, S.C.; Singh, R.; Pochampally, R.; Watabe, K.; Mo, Y.Y. Acidosis promotes invasiveness of breast cancer cells through ROS-AKT-NF-κB pathway. Oncotarget 2014, 5, 12070–12082. [Google Scholar] [CrossRef] [PubMed] [Green Version]
- Di Pompo, G.; Lemma, S.; Canti, L.; Rucci, N.; Ponzetti, M.; Errani, C.; Donati, D.M.; Russell, S.; Gillies, R.; Chano, T.; et al. Intratumoral acidosis fosters cancer-induced bone pain through the activation of the mesenchymal tumor-associated stroma in bone metastasis from breast carcinoma. Oncotarget 2017, 8, 54478–54496. [Google Scholar] [CrossRef]
- Boedtkjer, E.; Pedersen, S.F. The acidic tumor microenvironment as a driver of cancer. Annu. Rev. Physiol. 2020, 82, 103–126. [Google Scholar] [CrossRef] [PubMed] [Green Version]
- Remer, T.; Manz, F. Potential renal acid load of foods and its influence on urine pH. J. Am. Diet. Assoc. 1995, 95, 791–797. [Google Scholar] [CrossRef]
- Safabakhsh, M.; Imani, H.; Yaseri, M.; Omranipour, R.; Shab-Bidar, S. Higher dietary acid load is not associated with risk of breast cancer in Iranian women. Cancer Rep. 2020, 3, e1212. [Google Scholar] [CrossRef]
- Fenton, T.R.; Huang, T. Systematic review of the association between dietary acid load, alkaline water and cancer. BMJ Open 2016, 6, e010438. [Google Scholar] [CrossRef]
- Ronco, A.; Calderón, J.; Mendoza, B. Dietary acid load and breast cancer risk: A case-control study in Uruguay. Eur. J. Cancer 2020, 138, S122. [Google Scholar] [CrossRef]
- Park, Y.M.M.; Steck, S.E.; Fung, T.T.; Merchant, A.T.; Elizabeth Hodgson, M.; Keller, J.A.; Sandler, D.P. Higher diet-dependent acid load is associated with risk of breast cancer: Findings from the sister study. Int. J. Cancer 2019, 144, 1834–1843. [Google Scholar] [CrossRef]
- Wu, T.; Hsu, F.-C.; Pierce, J.P. Increased acid-producing diet and past smoking intensity are associated with worse prognoses among breast cancer survivors: A prospective cohort study. J. Clin. Med. 2020, 9, 1817. [Google Scholar] [CrossRef]
- Lee Hamm, L.; Nakhoul, N.; Hering-Smith, K.S. Acid-base homeostasis. Clin. J. Am. Soc. Nephrol. 2015, 10, 2232–2242. [Google Scholar] [CrossRef] [PubMed] [Green Version]
- Chung, A.C. Environmental Organic Pollutants Are Another Risk Factors for Chronic Kidney Diseases; SMGroup: Hong Kong, China, 2016. [Google Scholar]
- Kataria, A.; Trasande, L.; Trachtman, H. The effects of environmental chemicals on renal function. Nat. Rev. Nephrol. 2015, 11, 610–625. [Google Scholar] [CrossRef]
- Parada, H.; Sun, X.; Tse, C.K.; Engel, L.S.; Hoh, E.; Olshan, A.F.; Troester, M.A. Plasma levels of polychlorinated biphenyls (PCBs) and breast cancer mortality: The carolina breast cancer study. Int. J. Hyg. Environ. Health 2020, 227, 113522. [Google Scholar] [CrossRef]
- Parada, H.; Wolff, M.S.; Engel, L.S.; Eng, S.M.; Khankari, N.K.; Neugut, A.I.; Teitelbaum, S.L.; Gammon, M.D. Polychlorinated biphenyls and their association with survival following breast cancer. Eur. J. Cancer 2016, 56, 21–30. [Google Scholar] [CrossRef] [PubMed] [Green Version]
- Gammon, M.D.; Neugut, A.I.; Santella, R.M.; Teitelbaum, S.L.; Britton, J.A.; Terry, M.B.; Eng, S.M.; Wolff, M.S.; Stellman, S.D.; Kabat, G.C.; et al. The long island breast cancer study project: Description of a multi-institutional collaboration to identify environmental risk factors for breast cancer. Breast Cancer Res. Treat. 2002, 74, 235–254. [Google Scholar] [CrossRef] [PubMed] [Green Version]
- Gammon, M.D.; Wolff, M.S.; Neugut, A.I.; Eng, S.M.; Teitelbaum, S.L.; Britton, J.A.; Terry, M.B.; Levin, B.; Stellman, S.D.; Kabat, G.C.; et al. Environmental toxins and breast cancer on Long Island. II. Organochlorine compound levels in blood. Cancer Epidemiol. Biomark. Prev. 2002, 11, 686–697. [Google Scholar] [CrossRef]
- Gaudet, M.M.; Britton, J.A.; Kabat, G.C.; Steck-Scott, S.; Eng, S.M.; Teitelbaum, S.L.; Terry, M.B.; Neugut, A.I.; Gammon, M.D. Fruits, vegetables, and micronutrients in relation to breast cancer modified by menopause and hormone receptor status. Cancer Epidemiol. Biomark. Prev. 2004, 13, 1485–1494. [Google Scholar]
- Potischman, N.; Swanson, C.A.; Coates, R.J.; Gammon, M.D.; Brogan, D.R.; Curtin, J.; Brinton, L.A. Intake of food groups and associated micronutrients in relation to risk of early-stage breast cancer. Int. J. Cancer 1999, 82, 315–321. [Google Scholar] [CrossRef]
- National Cancer Institute. HHHQ-DietSys Analysis Software Version 3.0; National Cancer Institute: Bethesda, MD, USA, 1999. [Google Scholar]
- Remer, T.; Dimitriou, T.; Manz, F. Dietary potential renal acid load and renal net acid excretion in healthy, free-living children and adolescents. Am. J. Clin. Nutr. 2003, 77, 1255–1260. [Google Scholar] [CrossRef] [PubMed] [Green Version]
- Frassetto, L.A.; Todd, K.M.; Morris, R.C.; Sebastian, A. Estimation of net endogenous noncarbonic acid production in humans from diet potassium and protein contents. Am. J. Clin. Nutr. 1998, 68, 576–583. [Google Scholar] [CrossRef] [PubMed] [Green Version]
- Willett, W.; Stampfer, M.J. Total energy intake: Implications for epidemiologic analyses. Am. J. Epidemiol. 1986, 124, 17–27. [Google Scholar] [CrossRef] [PubMed]
- Gammon, M.D.; Wolff, M.S.; Neugut, A.I.; Terry, M.B.; Britton, J.A.; Greenebaum, E.; Hibshoosh, H.; Levin, B.; Wang, Q.; Santella, R.M. Treatment for breast cancer and blood levels of chlorinated hydrocarbons. Cancer Epidemiol. Biomark. Prev. 1996, 5, 467–471. [Google Scholar]
- Brock, J.W.; Melnyk, L.J.; Caudill, S.P.; Needham, L.L.; Bond, A.E. Serum levels of several organochlorine pesticides in farmers correspond with dietary exposure and local use history. Toxicol. Ind. Health 1998, 14, 275–289. [Google Scholar] [CrossRef]
- Wu, T.; Hsu, F.C.; Pierce, J.P. Acid-producing diet and depressive symptoms among breast cancer survivors: A longitudinal study. Cancers 2020, 12, 3183. [Google Scholar] [CrossRef]
- Hosmer, D.W.; Lemeshow, S. Confidence interval estimation of interaction. Epidemiology 1992, 3, 452–456. [Google Scholar] [CrossRef] [PubMed]
- Doyle, C.; Kushi, L.H.; Byers, T.; Courneya, K.S.; Demark-Wahnefried, W.; Grant, B.; McTiernan, A.; Rock, C.L.; Thompson, C.; Gansler, T.; et al. Nutrition and Physical Activity during and after Cancer Treatment: An American Cancer Society Guide for Informed Choices. CA. Cancer J. Clin. 2006, 56, 323–353. [Google Scholar] [CrossRef] [Green Version]
- Launay-Vacher, V.; Spano, J.P.; Janus, N.; Gligorov, J.; Ray-Coquard, I.; Oudard, S.; Pourrat, X.; Morere, J.F.; Beuzeboc, P.; Deray, G. Renal insufficiency and anticancer drugs in elderly cancer patients: A subgroup analysis of the IRMA study. Crit. Rev. Oncol. Hematol. 2009, 70, 124–133. [Google Scholar] [CrossRef]
- Launay-Vacher, V.; Chatelut, E.; Lichtman, S.M.; Wildiers, H.; Steer, C.; Aapro, M. Renal insufficiency in elderly cancer patients: International society of geriatric oncology clinical practice recommendations. Ann. Oncol. 2007, 18, 1314–1321. [Google Scholar] [CrossRef]
- Mudi, A.; Levy, C.S.; Geel, J.A.; Poole, J.E. Paediatric cancer survivors demonstrate a high rate of subclinical renal dysfunction. Pediatr. Blood Cancer 2016, 63, 2026–2032. [Google Scholar] [CrossRef]
- O’Sullivan, D. Late effects of chemotherapeutic agents on renal function in childhood cancer survivors: A review of the literature. Ir. J. Med. Sci. 2017, 186, 49–55. [Google Scholar] [CrossRef]
- Merouani, A.; Shpall, E.J.; Jones, R.B.; Archer, P.G.; Schrier, R.W. Renal function in high dose chemotherapy and autologous hematopoietic cell support treatment for breast cancer. Kidney Int. 1996, 50, 1026–1031. [Google Scholar] [CrossRef] [PubMed] [Green Version]
- Sahni, V.; Choudhury, D.; Ahmed, Z. Chemotherapy-associated renal dysfunction. Nat. Rev. Nephrol. 2009, 5, 450–462. [Google Scholar] [CrossRef] [PubMed]
- Phisitkul, S.; Hacker, C.; Simoni, J.; Tran, R.M.; Wesson, D.E. Dietary protein causes a decline in the glomerular filtration rate of the remnant kidney mediated by metabolic acidosis and endothelin receptors. Kidney Int. 2008, 73, 192–199. [Google Scholar] [CrossRef] [Green Version]
- Wesson, D.E.; Simoni, J. Increased tissue acid mediates a progressive decline in the glomerular filtration rate of animals with reduced nephron mass. Kidney Int. 2009, 75, 929–935. [Google Scholar] [CrossRef] [Green Version]
- Hejazi, E.; Emamat, H.; Sharafkhah, M.; Saidpour, A.; Poustchi, H.; Sepanlou, S.; Sotoudeh, M.; Dawsey, S.; Boffetta, P.; Abnet, C.C.; et al. Dietary acid load and mortality from all causes, CVD and cancer: Results from the golestan cohort study. Br. J. Nutr. 2021, 1–7. [Google Scholar] [CrossRef] [PubMed]
- Xu, H.; Akesson, A.; Orsini, N.; Hakansson, N.; Wolk, A.; Carrero, J.J. Modest U-shaped association between dietary acid load and risk of all-cause and cardiovascular mortality in adults. J. Nutr. 2016, 146, 1580–1585. [Google Scholar] [CrossRef] [PubMed] [Green Version]
- Akter, S.; Nanri, A. Dietary acid load and mortality among Japanese men and women: The Japan public health center–based prospective study. Am. J. Clin. Nutr. 2017, 106, 146–154. [Google Scholar] [CrossRef] [Green Version]
- Wulsin, L.R.; Vaillant, G.E.; Wells, V.E. A systematic review of the mortality of depression. Psychosom. Med. 1999, 61, 6–17. [Google Scholar] [CrossRef] [PubMed]
- Grassi, L.; Indelli, M.; Marzola, M.; Maestri, A.; Santini, A.; Piva, E.; Boccalon, M. Depressive symptoms and quality of life in home-care-assisted cancer patients. J. Pain Symptom Manag. 1996, 12, 300–307. [Google Scholar] [CrossRef]
- Kraut, J.A.; Madias, N.E. Metabolic acidosis: Pathophysiology, diagnosis and management. Nat. Rev. Nephrol. 2010, 6, 274–285. [Google Scholar] [CrossRef] [PubMed]
- Hood, V.L.; Tannen, R.L. Protection of acid–base balance by ph regulation of acid production. N. Engl. J. Med. 1998, 339, 819–826. [Google Scholar] [CrossRef] [PubMed]
- Ghosh, S.; De, S.; Chen, Y.; Sutton, D.C.; Ayorinde, F.O.; Dutta, S.K. Polychlorinated biphenyls (PCB-153) and (PCB-77) absorption in human liver (HepG2) and kidney (HK2) cells in vitro: PCB levels and cell death. Environ. Int. 2010, 36, 893–900. [Google Scholar] [CrossRef] [Green Version]
- Imamura, T.; Matsumoto, S.; Akahane, M.; Kanagawa, Y.; Koike, S.; Tajima, B.; Matsuya, S.; Uchi, H.; Shibata, S.; Furue, M. Cutaneous symptoms such as acneform eruption and pigmentation are closely associated with blood levels of 2,3,4,7,8-penta-chlorodibenzofurans in Yusho patients, using data mining analysis. BMC Res. Notes 2009, 2, 27. [Google Scholar] [CrossRef] [PubMed] [Green Version]
- Xue, J.; Liu, S.V.; Zartarian, V.G.; Geller, A.M.; Schultz, B.D. Analysis of NHANES measured blood PCBs in the general US population and application of SHEDS model to identify key exposure factors. J. Expo. Sci. Environ. Epidemiol. 2014, 24, 615–621. [Google Scholar] [CrossRef] [PubMed]


| Characteristics | Overall | PRAL | NEAP | ||
|---|---|---|---|---|---|
| ≤2.14 mEq/day | >2.14 mEq/day | ≤43.4 mEq/day | >43.4 mEq/day | ||
| n (%) | n (%) | n (%) | n (%) | n (%) | |
| n | 591 | 308 | 283 | 306 | 285 |
| Age at Diagnosis (years) | |||||
| <50 | 165 (27.9%) | 62 (20.1%) | 103 (36.4%) | 59 (19.3%) | 106 (37.2%) |
| 50–64 | 234 (39.6%) | 135 (43.8%) | 99 (35.0%) | 131 (42.8%) | 103 (36.1%) |
| ≥65 | 192 (32.5%) | 111 (36.0%) | 81 (28.6%) | 116 (37.9%) | 76 (26.7%) |
| Mean (SD) | 58.1 (12.1) | 60.0 (11.3) | 56.1 (12.6) | 60.5 (11.4) | 55.6 (12.4) |
| Education (USD) | |||||
| <HS-HS graduate | 261 (44.2%) | 127 (41.2%) | 134 (47.3%) | 130 (42.5%) | 131 (46.0%) |
| Some college/graduate | 236 (39.9%) | 134 (43.5%) | 102 (36.0%) | 128 (41.8%) | 108 (37.9%) |
| Post-college | 94 (15.9%) | 47 (15.3%) | 47 (16.6%) | 48 (15.7%) | 46 (16.1%) |
| Annual Income | |||||
| <$24,999 | 113 (19.1%) | 54 (17.5%) | 59 (20.8%) | 59 (19.3%) | 54 (18.9%) |
| $25,000–$49,999 | 176 (29.8%) | 103 (33.4%) | 73 (25.8%) | 101 (33.0%) | 75 (26.3%) |
| ≥$50,000 | 302 (51.1%) | 151 (49.0%) | 151 (53.4%) | 146 (47.7%) | 156 (54.7%) |
| BMI (kg/m2) | |||||
| <25 | 269 (45.5%) | 137 (44.5%) | 132 (46.6%) | 140 (45.8%) | 129 (45.3%) |
| 25–29 | 199 (33.7%) | 114 (37.0%) | 85 (30.0%) | 110 (35.9%) | 89 (31.2%) |
| ≥30 | 123 (20.8%) | 57 (18.5%) | 66 (23.3%) | 56 (18.3%) | 67 (23.5%) |
| Mean (SD) | 26.5 (5.5) | 26.4 (5.1) | 26.7 (6.0) | 26.3 (5.0) | 26.8 (6.1) |
| Menopausal Status | |||||
| Pre-menopausal | 202 (34.2%) | 87 (28.2%) | 115 (40.6%) | 80 (26.1%) | 122 (42.8%) |
| Post-menopausal | 389 (65.8%) | 221 (71.8%) | 168 (59.4%) | 226 (73.9%) | 163 (57.2%) |
| Parity and Lactation History | |||||
| Nulliparous | 78 (13.2%) | 38 (12.3%) | 40 (14.1%) | 36 (11.8%) | 42 (14.7%) |
| Parous/Never lactated | 310 (52.5%) | 155 (50.3%) | 155 (54.8%) | 159 (52.0%) | 151 (53.0%) |
| Parous/Ever lactated | 203 (34.3%) | 115 (37.3%) | 88 (31.1%) | 111 (36.3%) | 92 (32.3%) |
| Lifetime Alcohol Intake (g/day) | |||||
| Non-drinkers | 217 (36.7%) | 110 (35.7%) | 107 (37.8%) | 113 (36.9%) | 104 (36.5%) |
| <15 | 288 (48.7%) | 148 (48.1%) | 140 (49.5%) | 144 (47.1%) | 144 (50.5%) |
| 15–30 | 60 (10.2%) | 34 (11.0%) | 26 (9.2%) | 32 (10.5%) | 28 (9.8%) |
| ≥30 | 26 (4.4%) | 16 (5.2%) | 10 (3.5%) | 17 (5.6%) | 9 (3.2%) |
| Smoking Status | |||||
| Never smoker | 283 (47.9%) | 140 (45.5%) | 143 (50.5%) | 142 (46.4%) | 141 (49.5%) |
| Current smoker | 102 (17.3%) | 41 (13.3%) | 61 (21.6%) | 41 (13.4%) | 61 (21.4%) |
| Former smoker | 206 (34.9%) | 127 (41.2%) | 79 (27.9%) | 123 (40.2%) | 83 (29.1%) |
| Stage Status | |||||
| In situ | 169 (28.6%) | 84 (27.3%) | 85 (30.0%) | 84 (27.5%) | 85 (29.8%) |
| Invasive | 422 (71.4%) | 224 (72.7%) | 198 (70.0%) | 222 (72.5%) | 200 (70.2%) |
| Nodal Involvement | |||||
| No | 255 (43.1%) | 128 (41.6%) | 127 (44.9%) | 131 (42.8%) | 124 (43.5%) |
| Yes | 113 (19.1%) | 62 (20.1%) | 51 (18.0%) | 62 (20.3%) | 51 (17.9%) |
| Missing | 255 | 128 | 127 | 131 | 124 |
| ER/PR Status | |||||
| ER−/PR− | 261 (44.2%) | 138 (44.8%) | 123 (43.5%) | 142 (46.4%) | 119 (41.8%) |
| ER−/PR+ | 73 (12.4%) | 33 (10.7%) | 40 (14.1%) | 33 (10.8%) | 40 (14.0%) |
| ER+/PR− | 73 (12.4%) | 33 (10.7%) | 40 (14.1%) | 33 (10.8%) | 40 (14.0%) |
| ER+/PR+ | 41 (6.9%) | 27 (8.8%) | 14 (4.9%) | 26 (8.5%) | 15 (5.3%) |
| Missing | 261 | 138 | 123 | 142 | 119 |
| Vital Status | |||||
| Alive | 374 (63.3%) | 195 (63.3%) | 179 (63.3%) | 189 (61.8%) | 185 (64.9%) |
| Deceased | 217 (36.7%) | 113 (36.7%) | 104 (36.7%) | 117 (38.2%) | 100 (35.1%) |
| BRCA death | 73 (12.4%) | 39 (12.7%) | 34 (12.0%) | 41 (13.4%) | 32 (11.2%) |
| Dietary Acid Load | All-Cause Mortality | |||||
|---|---|---|---|---|---|---|
| Model 1 a | Model 2 b | |||||
| Deaths | Censored | HR (95%CI) | PTrendc | HR (95%CI) | PTrendc | |
| PRAL (mEq/day) | ||||||
| −46.5 to −3.5 (Q1) | 57 | 101 | 1.00 (Ref.) | 1.00 (Ref.) | ||
| −3.6 to 2.1 | 56 | 94 | 1.04 (0.83–1.31) | 1.19 (0.81–1.75) | ||
| 2.2 to 7.2 | 46 | 84 | 1.12 (0.89–1.40) | 1.16 (0.78–1.72) | ||
| 7.3 to 38.9 (Q4) | 58 | 95 | 1.20 (0.95–1.51) | 1.31 (0.90–1.92) | ||
| Linear (per SD) | 217 | 374 | 1.10 (0.96–1.26) | 0.19 | 1.08 (0.93–1.23) | 0.34 |
| NEAP (mEq/day) | ||||||
| 11.8 to 36.5 (Q1) | 65 | 97 | 1.00 (Ref.) | 1.00 (Ref.) | ||
| 36.6 to 43.4 | 52 | 92 | 0.97 (0.77–1.22) | 0.96 (0.66–1.40) | ||
| 43.5 to 51.0 | 44 | 90 | 1.04 (0.83–1.30) | 1.02 (0.68–1.52) | ||
| 51.1 to 112.8 (Q4) | 56 | 95 | 1.09 (0.87–1.37) | 1.07 (0.74–1.55) | ||
| Linear (per SD) | 217 | 374 | 1.10 (0.96–1.25) | 0.14 | 1.06 (0.92–1.21) | 0.42 |
| Dietary Acid Load | Breast Cancer-Specific Mortality | |||||
| Model 1 a | Model 2 b | |||||
| Deaths | Censored | HR (95%CI) | PTrendc | HR (95%CI) | PTrendc | |
| PRAL (mEq/day) | ||||||
| −46.5 to ≤ −3.5 (Q1) | 21 | 137 | 1.00 (Ref.) | 1.00 (Ref.) | ||
| −3.5 to ≤2.14 | 18 | 132 | 0.78 (0.54–1.14) | 0.96 (0.50–1.84) | ||
| 2.1 to ≤7.2 | 15 | 115 | 0.93 (0.65–1.33) | 0.81 (0.41–1.62) | ||
| 7.2 to ≤38.9 (Q4) | 19 | 134 | 0.95 (0.66–1.36) | 0.89 (0.46–1.72) | ||
| Linear (per SD) | 73 | 518 | 0.98 (0.77–1.24) | 0.49 | 0.96 (0.75–1.23) | 0.73 |
| NEAP (mEq/day) | ||||||
| 11.8 to ≤36.5 (Q1) | 22 | 140 | 1.00 (Ref.) | 1.00 (Ref.) | ||
| 36.6 to ≤43.4 | 19 | 125 | 0.96 (0.66–1.38) | 0.96 (0.51–1.81) | ||
| 43.4 to ≤51.0 | 14 | 120 | 1.00 (0.69–1.44) | 0.66 (0.32–1.34) | ||
| 51.1 to ≤112.8 (Q4) | 18 | 133 | 1.00 (0.69–1.45) | 0.78 (0.40–1.51) | ||
| Linear (per SD) | 73 | 518 | 0.96 (0.75–1.22) | 0.58 | 0.91 (0.71–1.18) | 0.49 |
| All-Cause Mortality | |||||
|---|---|---|---|---|---|
| Model 1 | Model 2 | ||||
| Dietary Acid Load | PCB Levels | HR (95%CI) a | ICR (95%CI) a | HR (95%CI) b | ICR (95%CI) b |
| NEAP (mEq/day) | PCB (μg/g lipid) | ||||
| 11.8 to 43.4 (≤med) | 0.07 to 0.87 (≤med) | 1.00 (Ref.) | - | 1.00 (Ref.) | - |
| 43.5 to 112.8 (>med) | 0.07 to 0.87 (≤med) | 0.89 (0.60–1.32) | - | 0.78 (0.52–1.16) | - |
| 11.8 to 43.4 (≤med) | 0.87 to 3.58 (>med) | 0.69 (0.48–1.00) | - | 0.74 (0.50–1.08) | - |
| 43.5 to 112.8 (>med) | 0.87 to 3.58 (>med) | 1.04 (0.72–1.52) | 0.47 (0.03, 0.90) | 1.04 (0.71–1.52) | 0.55 (0.12, 0.97) |
| PRAL (mEq/day) | PCB (μg/g lipid) | ||||
| −46.45 to 2.1 (≤med) | 0.07 to 0.87 (≤med) | 1.00. (Ref.) | - | 1.00. (Ref.) | - |
| 2.2 to 38.9 (>med) | 0.07 to 0.87 (≤med) | 1.03 (0.70–1.53) | - | 0.90 (0.61–1.35) | - |
| −46.45 to 2.1 (≤med) | 0.87 to 3.58 (>med) | 0.74 (0.51–1.09) | - | 0.79 (0.53–1.16) | - |
| 2.2 to 38.9 (>med) | 0.87 to 3.58 (>med) | 1.10 (0.75–1.61) | 0.33 (−0.15, 0.82) | 1.11 (0.75–1.63) | 0.46 (−0.01, 0.92) |
| Breast Cancer-Specific Mortality | |||||
| Model 1 | Model 2 | ||||
| Dietary Acid Load | PCB Levels | HR (95%CI) a | ICR (95%CI) a | HR (95%CI) a | ICR (95%CI) a |
| NEAP (mEq/day) | PCB (μg/g lipid) | ||||
| 11.8 to 43.4 (≤med) | 0.07 to 0.87 (≤med) | 1.00 (Ref.) | - | 1.00 (Ref.) | - |
| 43.5 to 112.8 (>med) | 0.07 to 0.87 (≤med) | 0.44 (0.22–0.89) | - | 0.40 (0.20–0.83) | - |
| 11.8 to 43.4 (≤med) | 0.87 to 3.58 (>med) | 0.63 (0.33–1.18) | - | 0.66 (0.34–1.26) | - |
| 43.5 to 112.8 (>med) | 0.87 to 3.58 (>med) | 0.92 (0.51–1.67) | 0.86 (0.28, 1.43) | 0.86 (0.47–1.59) | 0.68 (0.09, 1.27) |
| PRAL (mEq/day) | PCB (μg/g lipid) | ||||
| −46.45 to 2.1 (≤med) | 0.07 to 0.87 (≤med) | 1.00 (Ref.) | - | 1.00 (Ref.) | - |
| 2.2 to 38.9 (>med) | 0.07 to 0.87 (≤med) | 0.58 (0.30–1.14) | - | 0.54 (0.27–1.07) | - |
| −46.45 to 2.1 (≤med) | 0.87 to 3.58 (>med) | 0.68 (0.36–1.30) | - | 0.69 (0.36–1.34) | - |
| 2.2 to 38.9 (>med) | 0.87 to 3.58 (>med) | 1.04 (0.56–1.90) | 0.77 (0.13, 1.41) | 0.99 (0.53–1.86) | 0.82 (0.18, 1.46) |
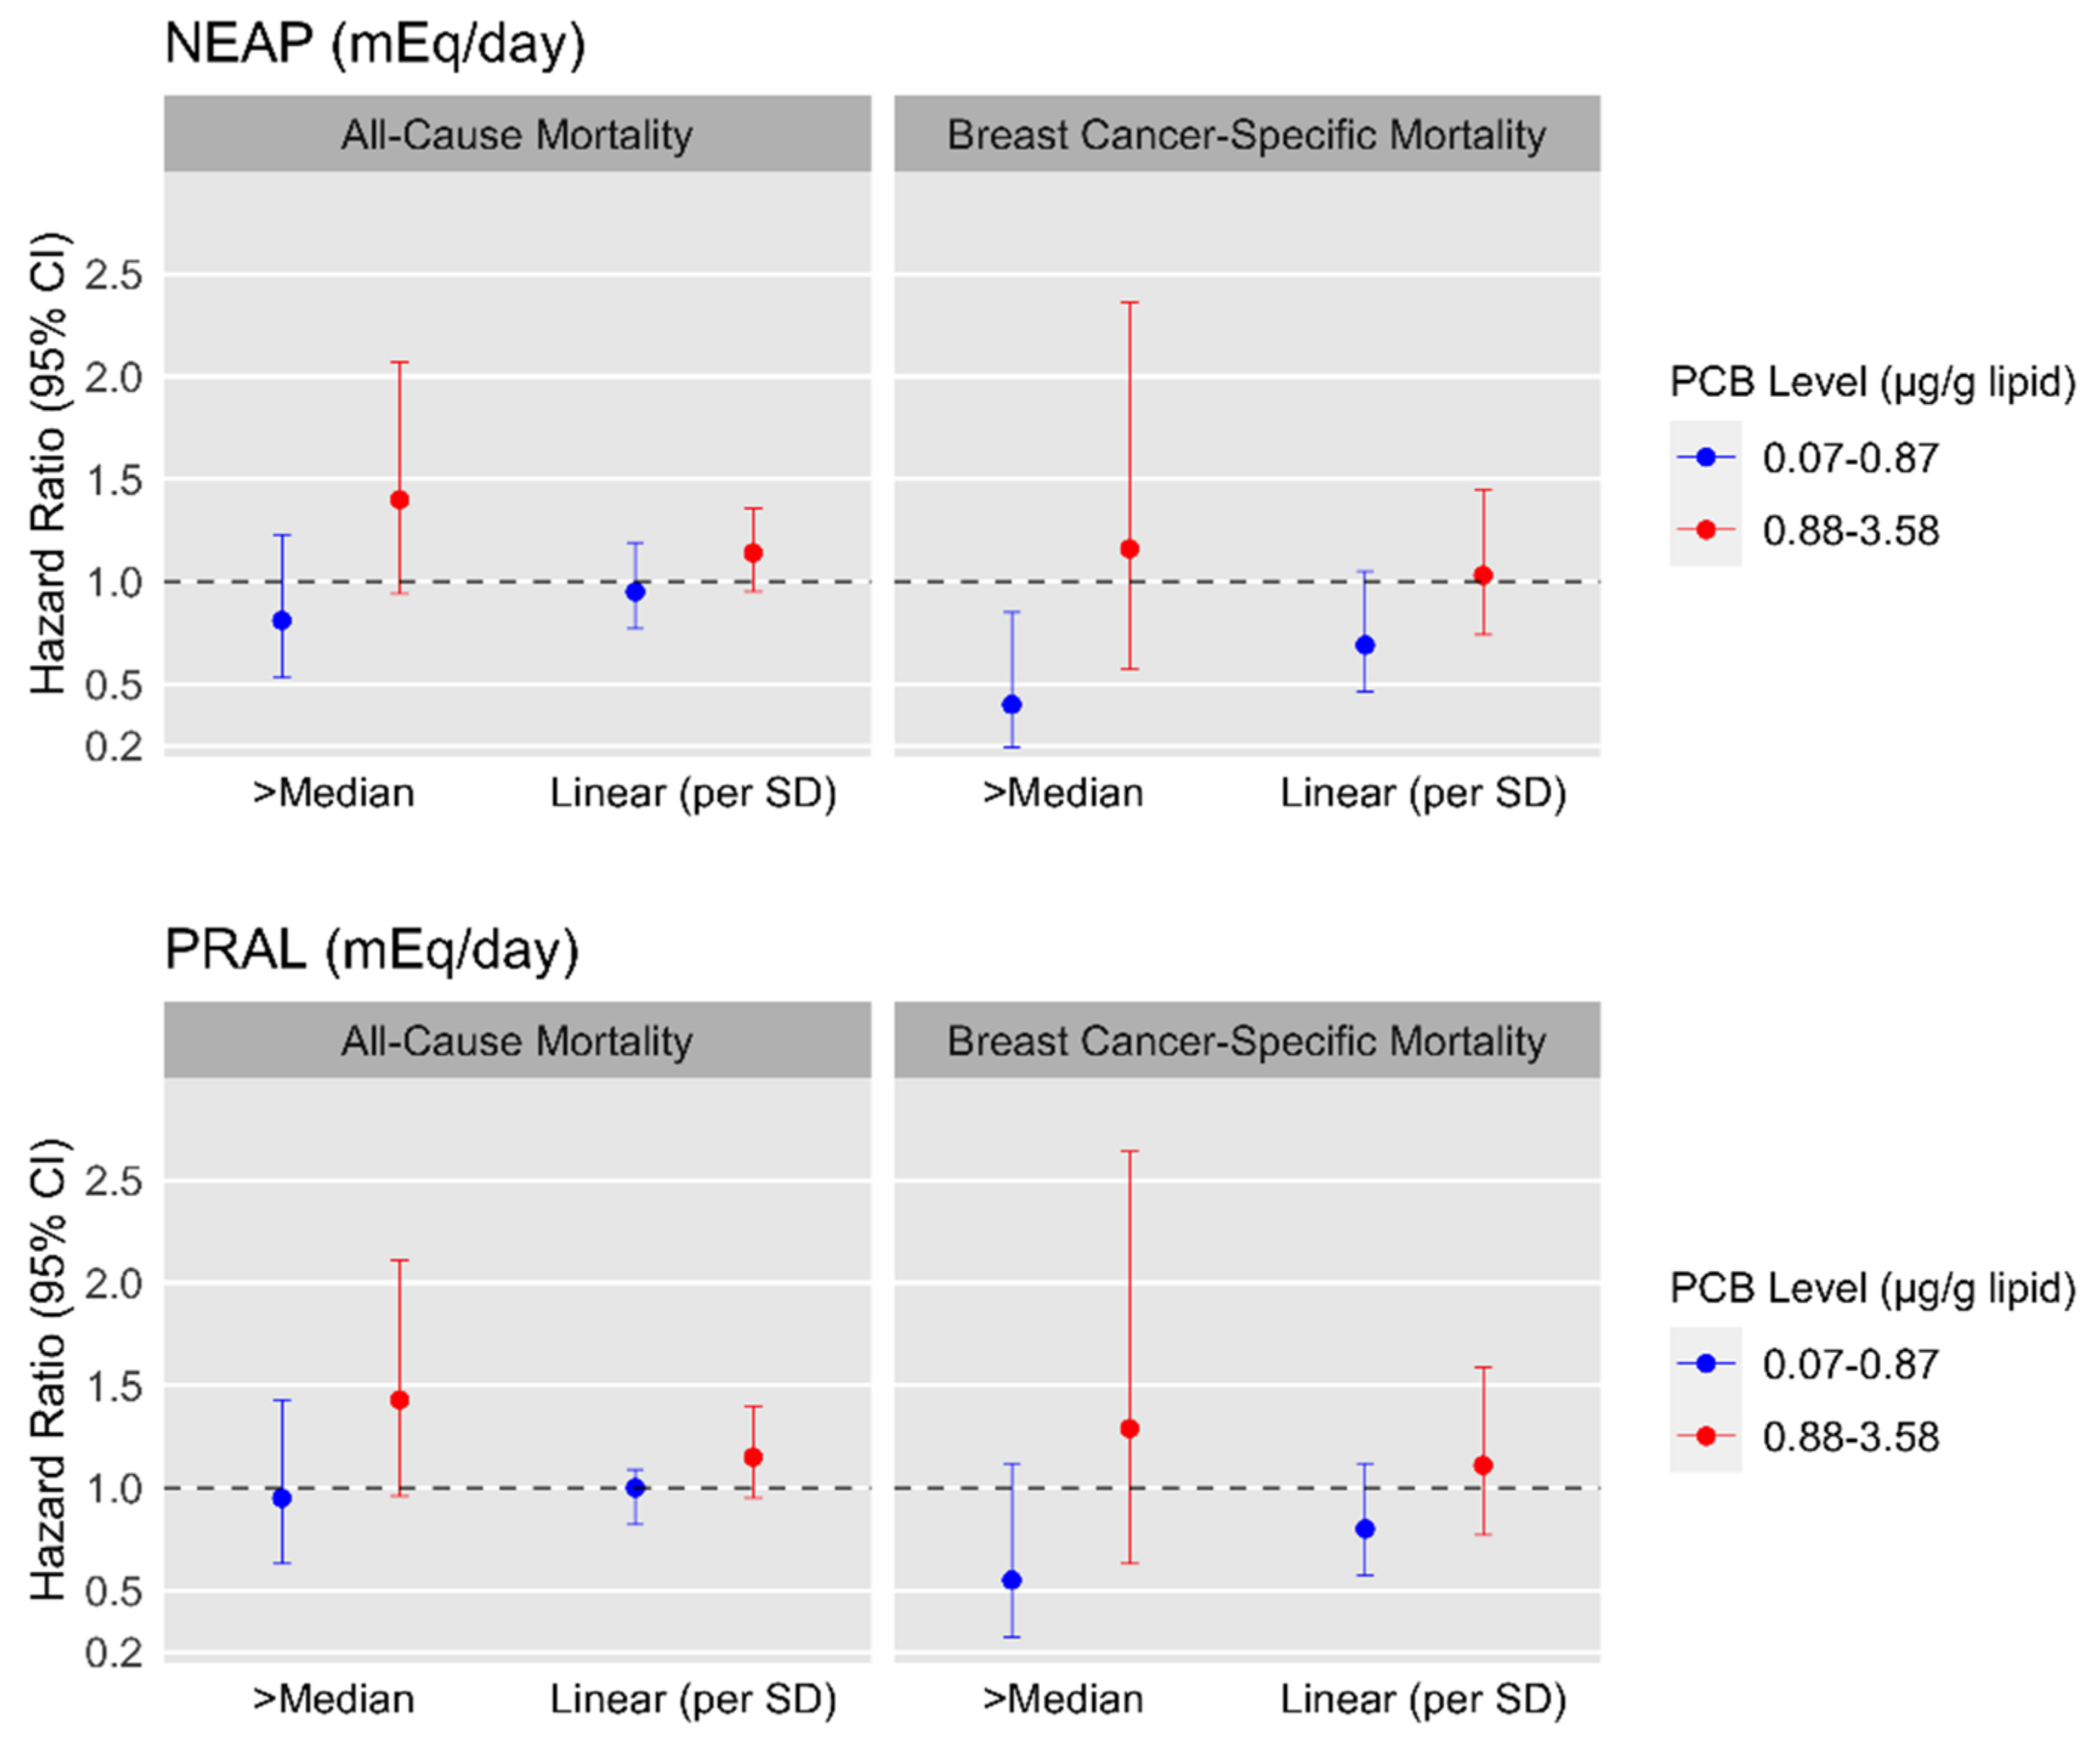
| All-Cause Mortality | |||||||||
|---|---|---|---|---|---|---|---|---|---|
| PCB Levels 0.07–0.87 μg/g Lipid (≤med) | PCB Levels 0.88–3.58 μg/g Lipid (>med) | ||||||||
| Model 1 a | Model 2 b | Model 1 a | Model 2 b | ||||||
| Deaths | Censored | HR (95%CI) | HR (95%CI) | Deaths | Censored | HR (95%CI) | HR (95%CI) | PInt.c | |
| NEAP (mEq/day) | 0.02 | ||||||||
| 11.8 to 43.4 (≤med) | 45 | 105 | 1.00 (Ref.) | 1.00 (Ref.) | 55 | 80 | 1.00 (Ref.) | 1.00 (Ref.) | |
| 43.5 to 112.8 (>med) | 55 | 91 | 0.90 (0.60–1.33) | 0.81 (0.53–1.23) | 62 | 98 | 1.50 (1.03–2.17) | 1.40 (0.94–2.07) | |
| Linear (per SD) | 100 | 196 | 0.96 (0.78–1.18) | 0.95 (0.77–1.19) | 117 | 178 | 1.19 (1.02–1.40) | 1.14 (0.95–1.36) | |
| PRAL (mEq/day) | 0.06 | ||||||||
| −46.45 to 2.1 (≤med) | 52 | 94 | 1.00 (Ref.) | 1.00 (Ref.) | 61 | 101 | 1.00 (Ref.) | 1.00 (Ref.) | |
| 2.2 to 38.9 (>med) | 48 | 102 | 1.04 (0.70–1.55) | 0.95 (0.63–1.43) | 56 | 77 | 1.47 (1.02–2.12) | 1.43 (0.96–2.11) | |
| Linear (per SD) | 100 | 196 | 1.00 (0.83–1.22) | 1.00 (0.82–1.09) | 117 | 178 | 1.19 (0.99–1.43) | 1.15 (0.95–1.40) | |
| Breast Cancer-Specific Mortality | |||||||||
| PCB Levels 0.07–0.87 μg/g Lipid (≤med) | PCB Levels 0.88–3.58 μg/g Lipid (>med) | ||||||||
| Model 1 a | Model 2 b | Model 1 a | Model 2 b | ||||||
| Deaths | Censored | HR (95%CI) | HR (95%CI) | Deaths | Censored | HR (95%CI) | HR (95%CI) | PInt.c | |
| NEAP (mEq/day) | 0.80 | ||||||||
| 11.8 to 43.4 (≤med) | 24 | 122 | 1.00 (Ref.) | 1.00 (Ref.) | 17 | 143 | 1.00 (Ref.) | 1.00 (Ref.) | |
| 43.5 to 112.8 (>med) | 12 | 138 | 0.45 (0.23–0.92) | 0.40 (0.19–0.85) | 20 | 115 | 1.44 (0.74–2.80) | 1.16 (0.57–2.36) | |
| Linear (per SD) | 36 | 260 | 0.74 (0.51–1.08) | 0.69 (0.46–1.05) | 37 | 258 | 1.14 (0.86–1.51) | 1.03 (0.74–1.45) | |
| PRAL (mEq/day) | 0.73 | ||||||||
| −46.45 to 2.1 (≤med) | 22 | 124 | 1.00 (Ref.) | 1.00 (Ref.) | 17 | 145 | 1.00 (Ref.) | 1.00 (Ref.) | |
| 2.2 to 38.9 (>med) | 14 | 136 | 0.60 (0.30–1.19) | 0.55 (0.27–1.12) | 20 | 113 | 1.48 (0.77–2.85) | 1.29 (0.63–2.64) | |
| Linear (per SD) | 36 | 260 | 0.84 (0.61–1.15) | 0.80 (0.57–1.12) | 37 | 258 | 1.15 (0.83–1.60) | 1.11 (0.77–1.59) | |
Publisher’s Note: MDPI stays neutral with regard to jurisdictional claims in published maps and institutional affiliations. |
© 2021 by the authors. Licensee MDPI, Basel, Switzerland. This article is an open access article distributed under the terms and conditions of the Creative Commons Attribution (CC BY) license (https://creativecommons.org/licenses/by/4.0/).
Share and Cite
Chronister, B.N.C.; Wu, T.; Santella, R.M.; Neugut, A.I.; Wolff, M.S.; Chen, J.; Teitelbaum, S.L.; Parada, H., Jr. Dietary Acid Load, Serum Polychlorinated Biphenyl Levels, and Mortality Following Breast Cancer in the Long Island Breast Cancer Study Project. Int. J. Environ. Res. Public Health 2022, 19, 374. https://0-doi-org.brum.beds.ac.uk/10.3390/ijerph19010374
Chronister BNC, Wu T, Santella RM, Neugut AI, Wolff MS, Chen J, Teitelbaum SL, Parada H Jr. Dietary Acid Load, Serum Polychlorinated Biphenyl Levels, and Mortality Following Breast Cancer in the Long Island Breast Cancer Study Project. International Journal of Environmental Research and Public Health. 2022; 19(1):374. https://0-doi-org.brum.beds.ac.uk/10.3390/ijerph19010374
Chicago/Turabian StyleChronister, Briana N. C., Tianying Wu, Regina M. Santella, Alfred I. Neugut, Mary S. Wolff, Jia Chen, Susan L. Teitelbaum, and Humberto Parada, Jr. 2022. "Dietary Acid Load, Serum Polychlorinated Biphenyl Levels, and Mortality Following Breast Cancer in the Long Island Breast Cancer Study Project" International Journal of Environmental Research and Public Health 19, no. 1: 374. https://0-doi-org.brum.beds.ac.uk/10.3390/ijerph19010374