
Is It Possible to Predict the Length of Stay of Patients Undergoing Hip-Replacement Surgery?


Abstract
:1. Introduction
Related Works
2. Materials and Methods
- 8151: total hip replacement,
- 8152: partial hip replacement,
- 8153: revision hip replacement
- Age,
- Gender (Male/Female),
- Date of admission, discharge, and principal procedure,
- Main and secondary diagnoses,
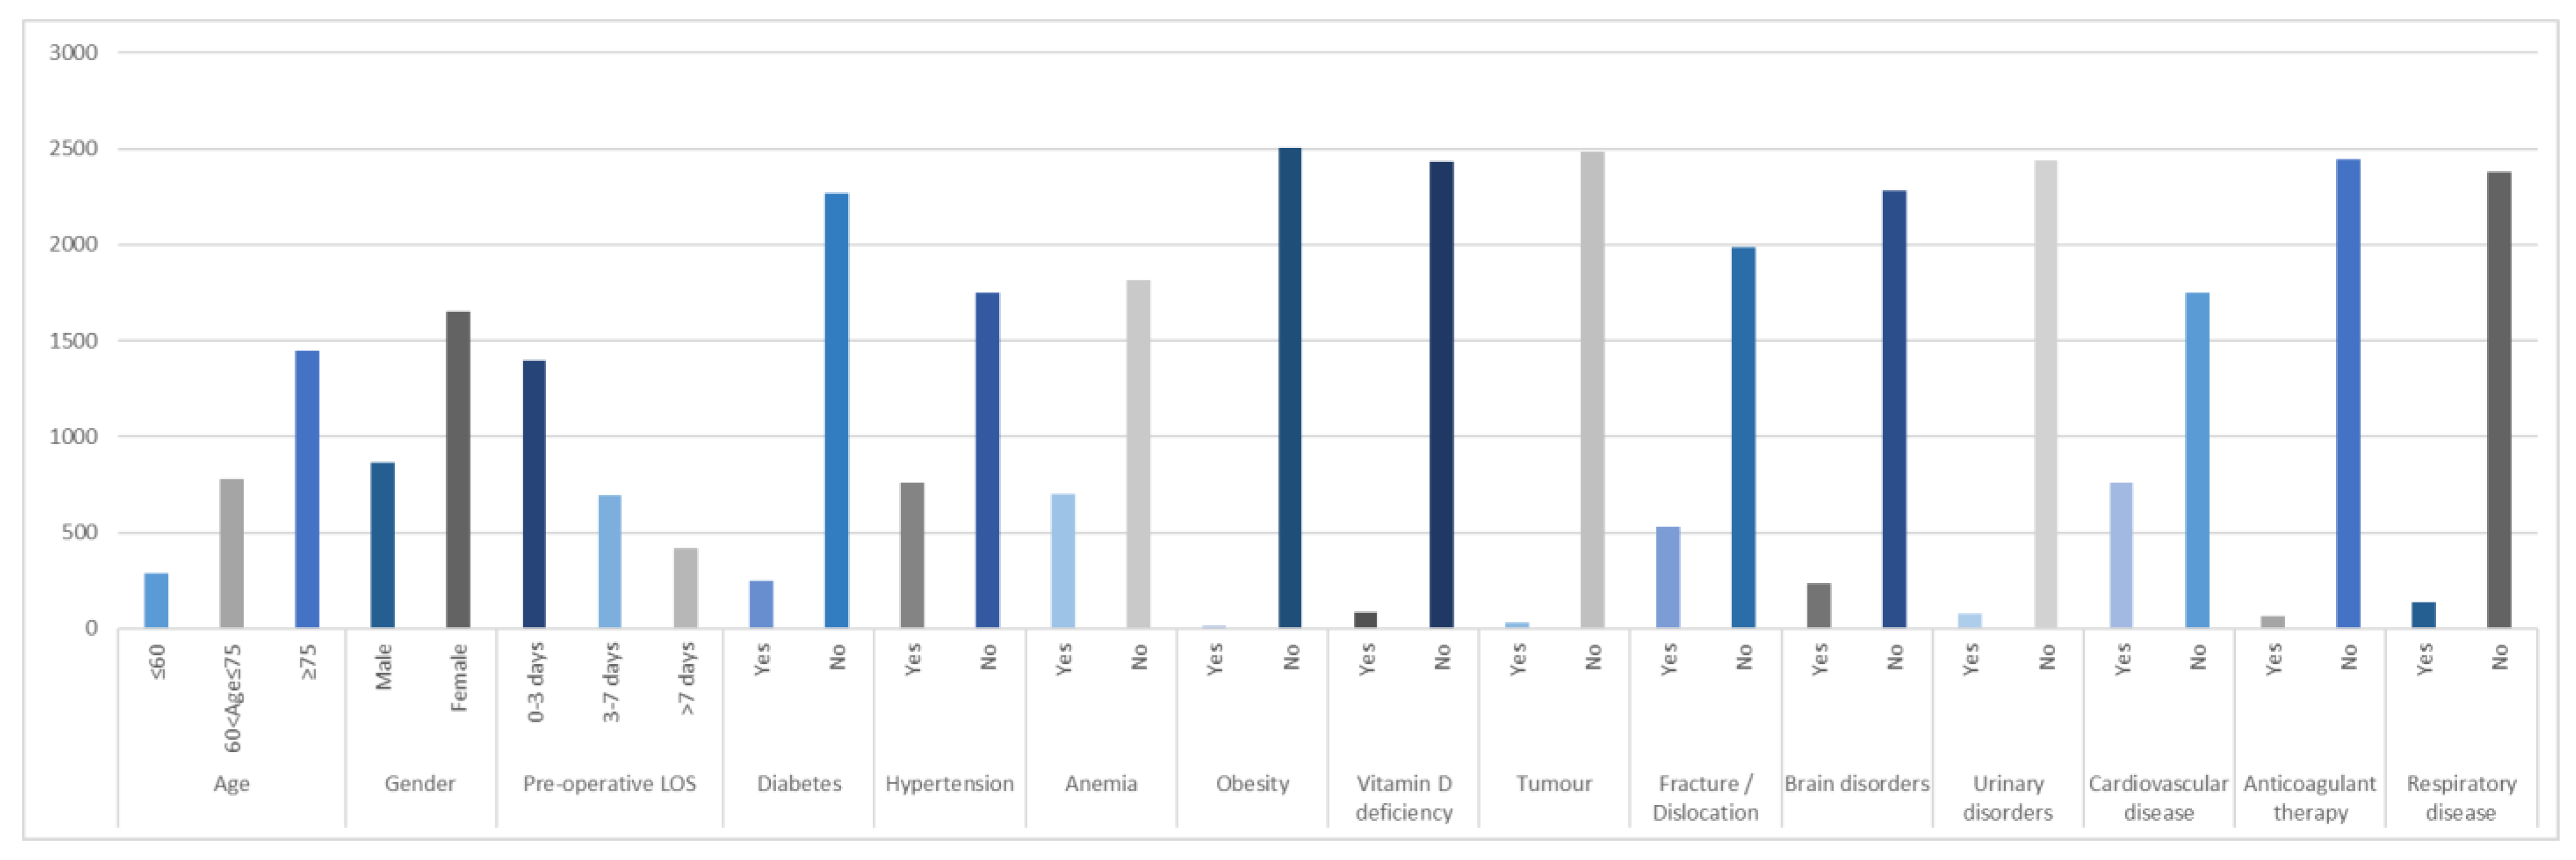
- Gender,
- Age,
- Pre-Operative LOS,
- Diabetes (yes/no),
- Hypertension (yes/no),
- Obesity (yes/no),
- Anemia (yes/no),
- Vitamin D deficiency (yes/no),
- Tumor (yes/no),
- Fracture/Dislocation (yes/no),
- Brain disorders (yes/no),
- Urinary disorders (yes/no),
- Cardiovascular disease (yes/no),
- Respiratory disease (yes/no),
- Anticoagulant therapy (yes/no).
2.1. Regression and Classification Models
2.2. Statistical Analysis
- Group 1: Patients discharged in 2019 and, therefore, before COVID-19.
- Group 2: Patients discharged in 2020 in full pandemic.
3. Results
- LOS ≤ 6 days.
- 6 days < LOS ≤ 12 days.
- LOS > 12 days.
4. Discussion
4.1. Results of Regression and Classification Models
4.2. COVID-19’s Impact
4.3. Uniqueness of the Present Study, Clinical Implications, and Limitations
5. Conclusions
Author Contributions
Funding
Institutional Review Board Statement
Informed Consent Statement
Data Availability Statement
Conflicts of Interest
References
- LeBlanc, E.S.; Hillier, T.A.; Pedula, K.L.; Rizzo, J.H.; Cawthon, P.M.; Fink, H.A.; Cauley, J.A.; Bauer, D.C.; Black, D.M.; Cummings, S.R.; et al. Hip fracture and increased short-term but not long-term mortality in healthy older women. Arch. Intern. Med. 2011, 171, 1831–1837. [Google Scholar] [CrossRef] [PubMed] [Green Version]
- Barrett, J.A.; Baron, J.A.; Beach, M.L. Mortality and pulmonary embolism after fracture in the elderly. Osteoporos. Int. 2003, 14, 889–894. [Google Scholar] [CrossRef] [PubMed]
- Johnell, O.; Kanis, J.A.; Oden, A.; Sernbo, I.; Redlund-Johnell, I.; Petterson, C.; De Laet, C.; Jonsson, B. Mortality after osteoporotic fractures. Osteoporos. Int. 2004, 15, 38–42. [Google Scholar] [CrossRef] [PubMed]
- Empana, J.P.; Dargent-Molina, P.; Breart, G. Effect of hip fracture on mortality in elderly women: The EPIDOS Prospective Study. J. Am. Geriatr. Soc. 2004, 52, 685–690. [Google Scholar] [CrossRef]
- Ström, O.; Borgström, F.; Kanis, J.A.; Compston, J.; Cooper, C.; McCloskey, E.V.; Jönsson, B. Osteoporosis: Burden, health care provision and opportunities in the EU. A report prepared in collaboration with the International Osteoporosis Foundation (IOF) and the European Federation of Pharmaceutical Industry Associations (EFPIA). Arch. Osteoporos. 2011, 6, 59–155. [Google Scholar] [CrossRef]
- Kanis, J.A.; McCloskey, E.V.; Johansson, H.; Cooper, C.; Rizzoli, R.; Reginster, J.Y. European guidance for the diagnosis and management of osteoporosis in postmenopausal women. Osteoporos. Int. 2008, 19, 399–428. [Google Scholar] [CrossRef] [Green Version]
- Kanis, J.A.; Johnell, O. Requirements for DXA for the management of osteoporosis in Europe. Osteoporos. Int. 2005, 16, 229–238. [Google Scholar] [CrossRef]
- Kanis, J.A. Assessment of Osteoporosis at the Primary Health-Care Level; Technical Report; WHO Collaborating Centre, University of Sheffield: Sheffield, UK, 2008; Available online: http://www.shef.ac.uk/FRAX/index.htm (accessed on 28 February 2022).
- Parker, M.; Antony, J. Hip fracture. BMJ 2006, 333, 27–30. [Google Scholar] [CrossRef]
- Bhandari, M.; Swiontkowski, M. Management of acute hip fracture. N. Engl. J. Med. 2017, 377, 2053–2062. [Google Scholar] [CrossRef]
- istat.it [webpage on the Internet]. Annual Italian Statistics 2020; Istituto Nazionale di Statistica: Roma, Italy, 2020; Available online: http://dati.istat.it/ (accessed on 22 November 2021).
- Programma Nazionale Esiti—Edizione 2021. Report PNE. 2021. Available online: https://pne.agenas.it/ (accessed on 28 February 2022).
- Moore, L.; Stelfox, H.T.; Turgeon, A.F.; Nathens, A.B.; Lavoie, A.; Émond, M.; Bourgeois, G.; Neveu, X. Derivation and Validation of a Quality Indicator of Acute Care Length of Stay to Evaluate Trauma Care. Ann. Surg. 2014, 260, 1121–1127. [Google Scholar] [CrossRef]
- Ponsiglione, C.; Angela Trunfio, T.; Bruno, F.; Borrelli, A. Regression and Machine Learning analysis to predict the length of stay in patients undergoing hip replacement surgery. In Proceedings of the 2021 International Symposium on Biomedical Engineering and Computational Biology (BECB 2021), New York, NY, USA, 13–15 August 2021; pp. 1–5. [Google Scholar] [CrossRef]
- Scala, A.; Loperto, I.; Carrano, R.; Federico, S.; Triassi, M.; Improta, G. Assessment of proteinuria level in nephrology patients using a machine learning approach. In Proceedings of the 2021 5th International Conference on Medical and Health Informatics (ICMHI 2021), New York, NY, USA, 14–16 May 2021; pp. 13–16. [Google Scholar] [CrossRef]
- Cesarelli, M.; Romano, M.; Bifulco, P.; Improta, G.; D’Addio, G. An application of symbolic dynamics for FHRV assessment. Stud. Health Technol. Inform. 2012, 180, 123–127. [Google Scholar] [PubMed]
- Rosa, D.; Balato, G.; Ciaramella, G.; Soscia, E.; Improta, G.; Triassi, M. Long-term clinical results and MRI changes after autologous chondrocyte implantation in the knee of young and active middle aged patients. J. Orthop. Traumatol. 2016, 17, 55–62. [Google Scholar] [CrossRef] [PubMed] [Green Version]
- Santini, S.; Pescapé, A.; Valente, A.S.; Abate, V.; Improta, G.; Triassi, M.; Ricchi, P.; Filosa, A. Using fuzzy logic for improving clinical daily-care of β-thalassemia patients. In Proceedings of the 2017 IEEE International Conference, Fuzzy Systems (FUZZ-IEEE), Naples, Italy, 9–12 July 2017; pp. 1–6. [Google Scholar]
- Raiola, E.; Triassi, M.; Improta, G.; Di Cicco, M.V.; Montella, E.; Ferraro, A.; Cerchione, R.; Centobelli, P. Implementation of lean practices to reduce healthcare associated infections. Int. J. Health Technol. Manag. 2020, 18, 51. [Google Scholar] [CrossRef]
- Ponsiglione, A.M.; Cesarelli, G.; Amato, F.; Romano, M. Optimization of an artificial neural network to study accelerations of foetal heart rhythm. In Proceedings of the 2021 IEEE 6th International Forum on Research and Technology for Society and Industry (RTSI), Naples, Italy, 6–9 September 2021; pp. 159–164. [Google Scholar] [CrossRef]
- Ponsiglione, A.M.; Romano, M.; Amato, F. A Finite-State Machine Approach to Study Patients Dropout from Medical Examinations. In Proceedings of the 2021 IEEE 6th International Forum on Research and Technology for Society and Industry (RTSI), Naples, Italy, 6–9 September2021; pp. 289–294. [Google Scholar] [CrossRef]
- Cesarelli, G.; Scala, A.; Vecchione, D.; Ponsiglione, A.M.; Guizzi, G. An Innovative Business Model for a Multi-echelon Supply Chain Inventory Management Pattern. In Journal of Physics: Conference Series, Proceedings of the 2020 International Symposium on Automation, Information and Computing (ISAIC 2020), Beijing, China, 2–4 December 2020; IOP Publishing: Bristol, UK, 2021; Volume 1828, p. 1828. [Google Scholar]
- Improta, G.; Scala, A.; Trunfio, T.A.; Guizzi, G. Application of Supply Chain Management at Drugs Flow in an Italian Hospital District. In Journal of Physics: Conference Series, Proceedings of the 2020 International Symposium on Automation, Information and Computing (ISAIC 2020), Beijing, China, 2–4 December 2020; IOP Publishing: Bristol, UK, 2021; Volume 1828, p. 012081. [Google Scholar] [CrossRef]
- Di Laura, D.; D’Angiolella, L.; Mantovani, L.; Squassabia, G.; Clemente, F.; Santalucia, I.; Improta, G.; Triassi, M. Efficiency measures of emergency departments: An Italian systematic literature review. BMJ Open Qual. 2021, 10, e001058. [Google Scholar] [CrossRef]
- Improta, G.; Luciano, M.A.; Vecchione, D.; Cesarelli, G.; Rossano, L.; Santalucia, I.; Triassi, M. Management of the Diabetic Patient in the Diagnostic Care Pathway. In IFMBE Proceedings, Proceedings of the 8th European Medical and Biological Engineering Conference, Portorož, Slovenia, 29 November 29–3 December 2020; Jarm, T., Cvetkoska, A., Mahnič-Kalamiza, S., Miklavcic, D., Eds.; Springer: Cham, Switzerland, 2020; Volume 80. [Google Scholar] [CrossRef]
- Improta, G.; Ponsiglione, A.M.; Parente, G.; Romano, M.; Cesarelli, G.; Rea, T.; Russo, M.; Triassi, M. Evaluation of Medical Training Courses Satisfaction: Qualitative Analysis and Analytic Hierarchy Process. In Proceedings of the European Medical and Biological Engineering Conference, Portorož, Slovenia, 29 November–3 December 2020; Springer: Cham, Switzerland, 2020; pp. 518–526. [Google Scholar]
- Lefaivre, K.A.; Macadam, S.A.; Davidson, D.J.; Gandhi, R.; Chan, H.; Broekhuyse, H.M. Length of stay, mortality, morbidity and delay to surgery in hip fractures. J. Bone Jt. Surgery. 2009, 91, 922–927. [Google Scholar] [CrossRef]
- Bracey, D.N.; Kiymaz, T.C.; Holst, D.C.; Hamid, K.S.; Plate, J.F.; Summers, E.C.; Emory, C.L.; Jinnah, R.H. An Orthopedic-Hospitalist Comanaged Hip Fracture Service Reduces Inpatient Length of Stay. Geriatr. Orthop. Surg. Rehabil. 2016, 7, 171–177. [Google Scholar] [CrossRef]
- Fisher, S.R. Early Ambulation and Length of Stay in Older Adults Hospitalized for Acute Illness. Arch. Intern. Med. 2010, 170, 1942–1943. [Google Scholar] [CrossRef] [Green Version]
- Husted, H.; Jensen, C.M.; Solgaard, S.; Kehlet, H. Reduced length of stay following hip and knee arthroplasty in Denmark 2000–2009: From research to implementation. Arch. Orthop. Trauma. Surg. 2011, 132, 101–104. [Google Scholar] [CrossRef]
- Piscitelli, P.; Gimigliano, F.; Gatto, S.; Marinelli, A.; Chitano, G.; Greco, M.; Di Paola, L.; Sbenaglia, E.; Benvenuto, M.; Muratore, M.; et al. Hip fractures in Italy: 2000–2005 extension study. Osteoporos. Int. 2009, 21, 1323–1330. [Google Scholar] [CrossRef]
- Piscitelli, P.; Iolascon, G.; Gimigliano, F.; Muratore, M.; Camboa, P.; Borgia, O.; Forcina, B.; Fitto, F.; Robaud, V.; Termini, G.; et al. Incidence and costs of hip fractures compared to acute myocardial infarction in the Italian population: A 4-year survey. Osteoporos. Int. 2006, 18, 211–219. [Google Scholar] [CrossRef] [Green Version]
- Latessa, I.; Ricciardi, C.; Jacob, D.; Jónssonr, H., Jr.; Gambacorta, M.; Improta, G.; Gargiulo, P. Health technology assessment through Six Sigma Methodology to assess cemented and uncemented protheses in total hip arthroplasty. Eur. J. Transl. Myol. 2021, 31, 9651. [Google Scholar] [CrossRef] [PubMed]
- Scala, A.; Ponsiglione, A.; Loperto, I.; Della Vecchia, A.; Borrelli, A.; Russo, G.; Triassi, M.; Improta, G. Lean Six Sigma Approach for Reducing Length of Hospital Stay for Patients with Femur Fracture in a University Hospital. Int. J. Environ. Res. Public Health 2021, 18, 2843. [Google Scholar] [CrossRef] [PubMed]
- Latessa, I.; Fiorillo, A.; Picone, I.; Balato, G.; Trunfio, T.A.; Scala, A.; Triassi, M. Implementing fast track surgery in hip and knee arthroplasty using the lean Six Sigma methodology. TQM J. 2021, 33, 131–147. [Google Scholar] [CrossRef]
- Ramkumar, P.N.; Navarro, S.M.; Haeberle, H.S.; Karnuta, J.M.; Mont, M.A.; Iannotti, J.P.; Patterson, B.M.; Krebs, V.E. Development and validation of a machine learning algorithm after primary total hip arthroplasty: Applications to length of stay and payment models. J. Arthroplast. 2019, 34, 632–637. [Google Scholar] [CrossRef] [PubMed]
- Johannesdottir, K.B.; Kehlet, H.; Petersen, P.B.; Aasvang, E.K.; Sørensen, H.B.D.; Jørgensen, C.C. Machine learning classifiers do not improve prediction of hospitalization > 2 days after fast-track hip and knee arthroplasty compared with a classical statistical risk model. Acta Orthop. 2022, 93, 117–123. [Google Scholar] [CrossRef] [PubMed]
- Menzies, I.B.; Mendelson, D.A.; Kates, S.L.; Friedman, S.M. The impact of comorbidity on perioperative outcomes of hip fractures in a geriatric fracture model. Geriatr. Orthop. Surg. Rehabil. 2012, 3, 129–134. [Google Scholar] [CrossRef] [Green Version]
- Colella, Y.; Scala, A.; De Lauri, C.; Bruno, F.; Cesarelli, G.; Ferrucci, G.; Borrelli, A. Studying variables affecting the length of stay in patients with lower limb fractures by means of Machine Learning. In Proceedings of the 2021 5th International Conference on Medical and Health Informatics, Kyoto, Japan, 14–16 May 2021. [Google Scholar]
- Ricci, W.M.; Brandt, A.; McAndrew, C.; Gardner, M.J. Factors Affecting Delay to Surgery and Length of Stay for Patients with Hip Fracture. J. Orthop. Trauma 2015, 29, e109–e114. [Google Scholar] [CrossRef] [Green Version]
- Husted, H.; Holm, G.; Jacobsen, S. Predictors of length of stay and patient satisfaction after hip and knee replacement surgery: Fast-track experience in 712 patients. Acta Orthop. 2008, 79, 168–173. [Google Scholar] [CrossRef]
- Clague, J.E.; Craddock, E.; Andrew, G.; Horan, M.A.; Pendleton, N. Predictors of outcome following hip fracture. Admission time predicts length of stay and in-hospital mortality. Injury 2002, 33, 1–6. [Google Scholar] [CrossRef]


| LOS | Gender | Age | Pre-Operative LOS | Diabetes | Hypertension | Obesity | Anemia | Vitamin D Deficiency | Tumor | Fracture/Dislocation | Brain Disorders | Urinary Disorders | Cardiovascular Disease | Respiratory Disease | Anticoagulant Therapy | ||
|---|---|---|---|---|---|---|---|---|---|---|---|---|---|---|---|---|---|
| Pearson Correlation | LOS | 1.000 | 0.054 | 0.137 | 0.772 | −0.027 | −0.104 | −0.023 | 0.049 | −0.054 | 0.069 | 0.248 | −0.009 | 0.046 | 0.109 | 0.024 | 0.002 |
| Gender | 0.054 | 1.000 | 0.182 | −0.010 | −0.008 | 0.080 | 0.029 | 0.104 | 0.040 | −0.008 | 0.055 | 0.011 | −0.035 | −0.016 | −0.085 | −0.029 | |
| Age | 0.137 | 0.182 | 1.000 | .088 | 0.060 | 0.189 | −0.018 | 0.126 | 0.115 | −0.005 | 0.095 | 0.119 | 0.077 | 0.218 | 0.054 | 0.064 | |
| Pre-operative LOS | 0.772 | −0.010 | 0.088 | 1.000 | −0.064 | −0.161 | −0.022 | −0.064 | −0.101 | 0.072 | 0.260 | −0.019 | 0.005 | 0.078 | −0.002 | −0.008 | |
| Diabetes | −0.027 | −0.008 | 0.060 | −0.064 | 1.000 | 0.202 | −0.020 | 0.090 | 0.036 | 0.052 | −0.024 | 0.028 | 0.033 | 0.066 | 0.079 | 0.068 | |
| Hypertension | −0.104 | 0.080 | 0.189 | −0.161 | 0.202 | 1.000 | 0.062 | 0.174 | 0.130 | −0.039 | −0.142 | 0.058 | 0.062 | 0.177 | 0.112 | 0.066 | |
| Obesity | −0.023 | 0.029 | −0.018 | −0.022 | −0.020 | 0.062 | 1.000 | 0.007 | −0.011 | −0.006 | −0.031 | −0.019 | 0.028 | 0.004 | −0.014 | 0.031 | |
| Anemia | 0.049 | 0.104 | 0.126 | −0.064 | 0.090 | 0.174 | 0.007 | 1.000 | 0.154 | 0.033 | −0.029 | 0.090 | 0.089 | 0.063 | 0.055 | 0.066 | |
| Vitamin D deficiency | −0.054 | 0.040 | 0.115 | −0.101 | 0.036 | 0.130 | −0.011 | 0.154 | 1.000 | 0.001 | −0.052 | 0.125 | 0.005 | 0.072 | 0.083 | 0.024 | |
| Tumor | 0.069 | −0.008 | −0.005 | 0.072 | 0.052 | −0.039 | −0.006 | 0.033 | 0.001 | 1.000 | 0.017 | 0.004 | 0.024 | 0.042 | 0.105 | −0.018 | |
| Fracture/Dislocation | 0.248 | 0.055 | 0.095 | 0.260 | −0.024 | −0.142 | −0.031 | −0.029 | −0.052 | 0.017 | 1.000 | −0.041 | −0.019 | 0.202 | −0.042 | −0.050 | |
| Brain disorders | −0.009 | 0.011 | 0.119 | −0.019 | 0.028 | 0.058 | −0.019 | 0.090 | 0.125 | 0.004 | −0.041 | 1.000 | −0.018 | 0.040 | 0.038 | 0.014 | |
| Urinary disorders | 0.046 | −0.035 | 0.077 | 0.005 | 0.0033 | 0.062 | 0.028 | 0.089 | 0.005 | 0.024 | −0.019 | −0.018 | 1.000 | 0.067 | 0.008 | 0.027 | |
| Cardiovascular disease | 0.109 | −0.016 | 0.218 | 0.078 | 0.066 | 0.177 | 0.004 | 0.063 | 0.072 | 0.042 | 0.202 | 0.040 | 0.067 | 1.000 | 0.040 | 0.183 | |
| Respiratory disease | 0.024 | −0.085 | 0.054 | −0.002 | 0.079 | 0.112 | −0.014 | 0.055 | 0.083 | 0.105 | −0.042 | 0.038 | 0.008 | 0.040 | 1.000 | 0.025 | |
| Anticoagulant therapy | 0.002 | −0.029 | 0.064 | −0.008 | 0.068 | 0.066 | 0.031 | 0.066 | 0.024 | −0.018 | −0.050 | 0.014 | 0.027 | 0.183 | 0.025 | 1.000 | |
| Sig. (1-tailed) | LOS | 0.003 | 0.000 | 0.000 | 0.089 | 0.000 | 0.120 | 0.007 | 0.003 | 0.000 | 0.000 | 0.326 | 0.011 | 0.000 | 0.110 | 0.465 | |
| Gender | 0.003 | 0.000 | 0.308 | 0.341 | 0.000 | 0.071 | 0.000 | 0.023 | 0.340 | 0.003 | 0.284 | 0.040 | 0.218 | 0.000 | 0.071 | ||
| Age | 0.000 | 0.000 | 0.000 | 0.001 | 0.000 | 0.190 | 0.000 | 0.000 | 0.402 | 0.000 | 0.000 | 0.000 | 0.000 | 0.004 | 0.001 | ||
| Pre-operative LOS | 0.000 | 0.308 | 0.000 | 0.001 | 0.000 | 0.132 | 0.001 | 0.000 | 0.000 | 0.000 | 0.177 | 0.394 | 0.000 | 0.451 | 0.352 | ||
| Diabetes | 0.089 | 0.341 | 0.001 | 0.001 | 0.000 | 0.160 | 0.000 | 0.036 | 0.005 | 0.117 | 0.082 | 0.048 | 0.000 | 0.000 | 0.000 | ||
| Hypertension | 0.000 | 0.000 | 0.000 | 0.000 | 0.000 | 0.001 | 0.000 | 0.000 | 0.026 | 0.000 | 0.002 | 0.001 | 0.000 | 0.000 | 0.000 | ||
| Obesity | 0.120 | 0.071 | 0.190 | 0.132 | 0.160 | 0.001 | 0.354 | 0.289 | 0.373 | 0.060 | 0.169 | 0.083 | 0.421 | 0.235 | 0.060 | ||
| Anemia | 0.007 | 0.000 | 0.000 | 0.001 | 0.000 | 0.000 | 0.354 | 0.000 | 0.050 | 0.076 | 0.000 | 0.000 | 0.001 | 0.003 | 0.000 | ||
| Vitamin D deficiency | 0.003 | 0.023 | 0.000 | 0.000 | 0.036 | 0.000 | 0.289 | 0.000 | 0.482 | 0.005 | 0.000 | 0.392 | 0.000 | 0.000 | 0.114 | ||
| Tumor | 0.000 | 0.340 | 0.402 | 0.000 | 0.005 | 0.026 | 0.373 | 0.050 | 0.482 | 0.194 | 0.420 | 0.118 | 0.017 | 0.000 | 0.183 | ||
| Fracture/dislocation | 0.000 | 0.003 | 0.000 | 0.000 | 0.117 | 0.000 | 0.060 | 0.076 | 0.005 | 0.194 | 0.021 | 0.166 | 0.000 | 0.017 | 0.006 | ||
| Brain disorders | 0.326 | 0.284 | 0.000 | 0.177 | 0.082 | 0.002 | 0.169 | 0.000 | 0.000 | 0.420 | 0.021 | 0.189 | 0.022 | 0.028 | 0.236 | ||
| Urinary disorders | 0.011 | 0.040 | 0.000 | 0.394 | 0.048 | 0.001 | 0.083 | 0.000 | 0.392 | 0.118 | 0.166 | 0.189 | 0.000 | 0.352 | 0.090 | ||
| Cardiovascular disease | 0.000 | 0.218 | 0.000 | 0.000 | 0.000 | 0.000 | 0.421 | 0.001 | 0.000 | 0.017 | 0.000 | 0.022 | 0.000 | 0.022 | 0.000 | ||
| Respiratory disease | 0.110 | 0.000 | 0.004 | 0.451 | 0.000 | 0.000 | 0.235 | 0.003 | 0.000 | 0.000 | 0.017 | 0.028 | 0.352 | 0.022 | 0.107 | ||
| Anticoagulant therapy | 0.465 | 0.071 | 0.001 | 0.352 | 0.000 | 0.000 | 0.060 | 0.000 | 0.114 | 0.183 | 0.006 | 0.236 | 0.090 | 0.000 | 0.107 | ||
| R | R2 | Adjusted R2 | Std. Error of the Estimate | |
|---|---|---|---|---|
| Model | 0.785 | 0.616 | 0.613 | 3.726 |
| Unstandardized Coefficients | Standardized Coefficients | t | p-Value | ||
|---|---|---|---|---|---|
| B | Std. Error | Beta | |||
| (Constant) | 4.405 | 0.522 | - | 8.442 | 0.000 |
| Gender | 0.609 | 0.162 | 0.048 | 3.762 | 0.000 |
| Age | 0.020 | 0.007 | 0.040 | 2.960 | 0.003 |
| Pre-operative LOS | 1.011 | 0.017 | 0.760 | 57.908 | 0.000 |
| Diabetes | 0.221 | 0.257 | 0.011 | 0.862 | 0.389 |
| Hypertension | −0.166 | 0.178 | −0.013 | −0.933 | 0.351 |
| Obesity | −0.624 | 1.250 | −0.006 | −0.499 | 0.618 |
| Anemia | 1.130 | 0.173 | 0.084 | 6.537 | 0.000 |
| Vitamin D deficiency | 0.127 | 0.430 | 0.004 | 0.295 | 0.768 |
| Tumor | 0.328 | 0.705 | 0.006 | 0.465 | 0.642 |
| Fracture/dislocation | 0.593 | 0.196 | 0.040 | 3.020 | 0.003 |
| Brain disorders | −0.159 | 0.261 | −0.008 | −0.610 | 0.542 |
| Urinary disorders | 1.115 | 0.433 | 0.032 | 2.572 | 0.010 |
| Cardiovascular disease | 0.348 | 0.176 | 0.027 | 1.983 | 0.048 |
| Respiratory disease | 0.632 | 0.335 | 0.024 | 1.888 | 0.059 |
| Anticoagulant therapy | −0.116 | 0.470 | −0.003 | −0.248 | 0.804 |
| LR | RF | GBT | XGBoost | |
|---|---|---|---|---|
| R2 | 0.552 | 0.448 | 0.543 | 0.552 |
| Root mean squared error | 3.843 | 4.497 | 3.883 | 3.843 |
| Performance Metrics | Class | DT | GBT | RF | SVM |
|---|---|---|---|---|---|
| Accuracy (%) | Overall | 71.13 | 71.76 | 71.76 | 65.06 |
| Error (%) | Overall | 28.87 | 28.24 | 28.24 | 34.94 |
| Precision (%) | 1 | 65.35 | 69.49 | 55.04 | 63.46 |
| 2 | 61.58 | 60.93 | 80.68 | 61.29 | |
| 3 | 89.19 | 89.66 | 75.14 | 67.69 | |
| Sensitivity (%) | 1 | 64.34 | 63.57 | 76.34 | 76.74 |
| 2 | 71.02 | 74.43 | 59.17 | 32.39 | |
| 3 | 76.30 | 75.14 | 89.66 | 89.60 | |
| Specificity (%) | 1 | 87.39 | 89.68 | 84.94 | 83.67 |
| 2 | 74.17 | 72.19 | 85.71 | 88.08 | |
| 3 | 94.75 | 95.08 | 87.09 | 75.74 | |
| F-measure (%) | 1 | 64.84 | 66.40 | 63.96 | 69.47 |
| 2 | 65.96 | 67.01 | 68.27 | 42.38 | |
| 3 | 82.24 | 81.76 | 81.76 | 77.11 |
| Real/Predicted | 1 | 2 | 3 |
|---|---|---|---|
| 1 | 71 | 20 | 2 |
| 2 | 57 | 142 | 41 |
| 3 | 1 | 14 | 130 |
| Variable | 2019 N = 272 | 2020 N = 185 | p-Value |
|---|---|---|---|
| Age | |||
| Mean | 77.76 | 78.22 | 0.800 |
| Gender | |||
| Male | 88 | 59 | 0.918 |
| Female | 184 | 126 | |
| Pre-operative LOS | |||
| Mean | 3.05 | 3.14 | 0.066 |
| Post-operative LOS | |||
| Mean | 7.70 | 7.09 | 0.040 |
| Diabetes | |||
| No | 233 | 155 | 0.582 |
| Yes | 39 | 30 | |
| Hypertension | |||
| No | 159 | 101 | 0.413 |
| Yes | 113 | 84 | |
| Anemia | |||
| No | 168 | 117 | 0.749 |
| Yes | 104 | 68 | |
| Obesity | |||
| No | 268 | 185 | 0.098 |
| Yes | 4 | 0 | |
| Vitamin D deficiency | |||
| No | 225 | 154 | 0.884 |
| Yes | 47 | 31 | |
| Tumor | |||
| No | 264 | 180 | 0.880 |
| Yes | 8 | 5 | |
| Fracture/dislocation | |||
| No | 262 | 142 | 0.000 |
| Yes | 10 | 43 | |
| Brain disorders | |||
| No | 218 | 155 | 0.325 |
| Yes | 54 | 30 | |
| Urinary disorders | |||
| No | 261 | 177 | 0.883 |
| Yes | 11 | 8 | |
| Cardiovascular disease | |||
| No | 192 | 101 | 0.000 |
| Yes | 80 | 84 | |
| Anticoagulant therapy | |||
| No | 257 | 178 | 0.396 |
| Yes | 15 | 7 | |
| Respiratory disease | |||
| No | 243 | 174 | 0.080 |
| Yes | 29 | 11 | |
| LOS | |||
| Mean | 10.75 | 10.22 | 0.240 |
Publisher’s Note: MDPI stays neutral with regard to jurisdictional claims in published maps and institutional affiliations. |
© 2022 by the authors. Licensee MDPI, Basel, Switzerland. This article is an open access article distributed under the terms and conditions of the Creative Commons Attribution (CC BY) license (https://creativecommons.org/licenses/by/4.0/).
Share and Cite
Trunfio, T.A.; Borrelli, A.; Improta, G. Is It Possible to Predict the Length of Stay of Patients Undergoing Hip-Replacement Surgery? Int. J. Environ. Res. Public Health 2022, 19, 6219. https://0-doi-org.brum.beds.ac.uk/10.3390/ijerph19106219
Trunfio TA, Borrelli A, Improta G. Is It Possible to Predict the Length of Stay of Patients Undergoing Hip-Replacement Surgery? International Journal of Environmental Research and Public Health. 2022; 19(10):6219. https://0-doi-org.brum.beds.ac.uk/10.3390/ijerph19106219
Chicago/Turabian StyleTrunfio, Teresa Angela, Anna Borrelli, and Giovanni Improta. 2022. "Is It Possible to Predict the Length of Stay of Patients Undergoing Hip-Replacement Surgery?" International Journal of Environmental Research and Public Health 19, no. 10: 6219. https://0-doi-org.brum.beds.ac.uk/10.3390/ijerph19106219