
Primary Factors Influencing the Decision to Vaccinate against COVID-19 in the United States: A Pre-Vaccine Analysis


Abstract
:1. Introduction
2. Materials and Methods
2.1. Data Preprocessing
2.2. Machine Learning Classification
2.3. Evaluation and Comparison of the Models
3. Results
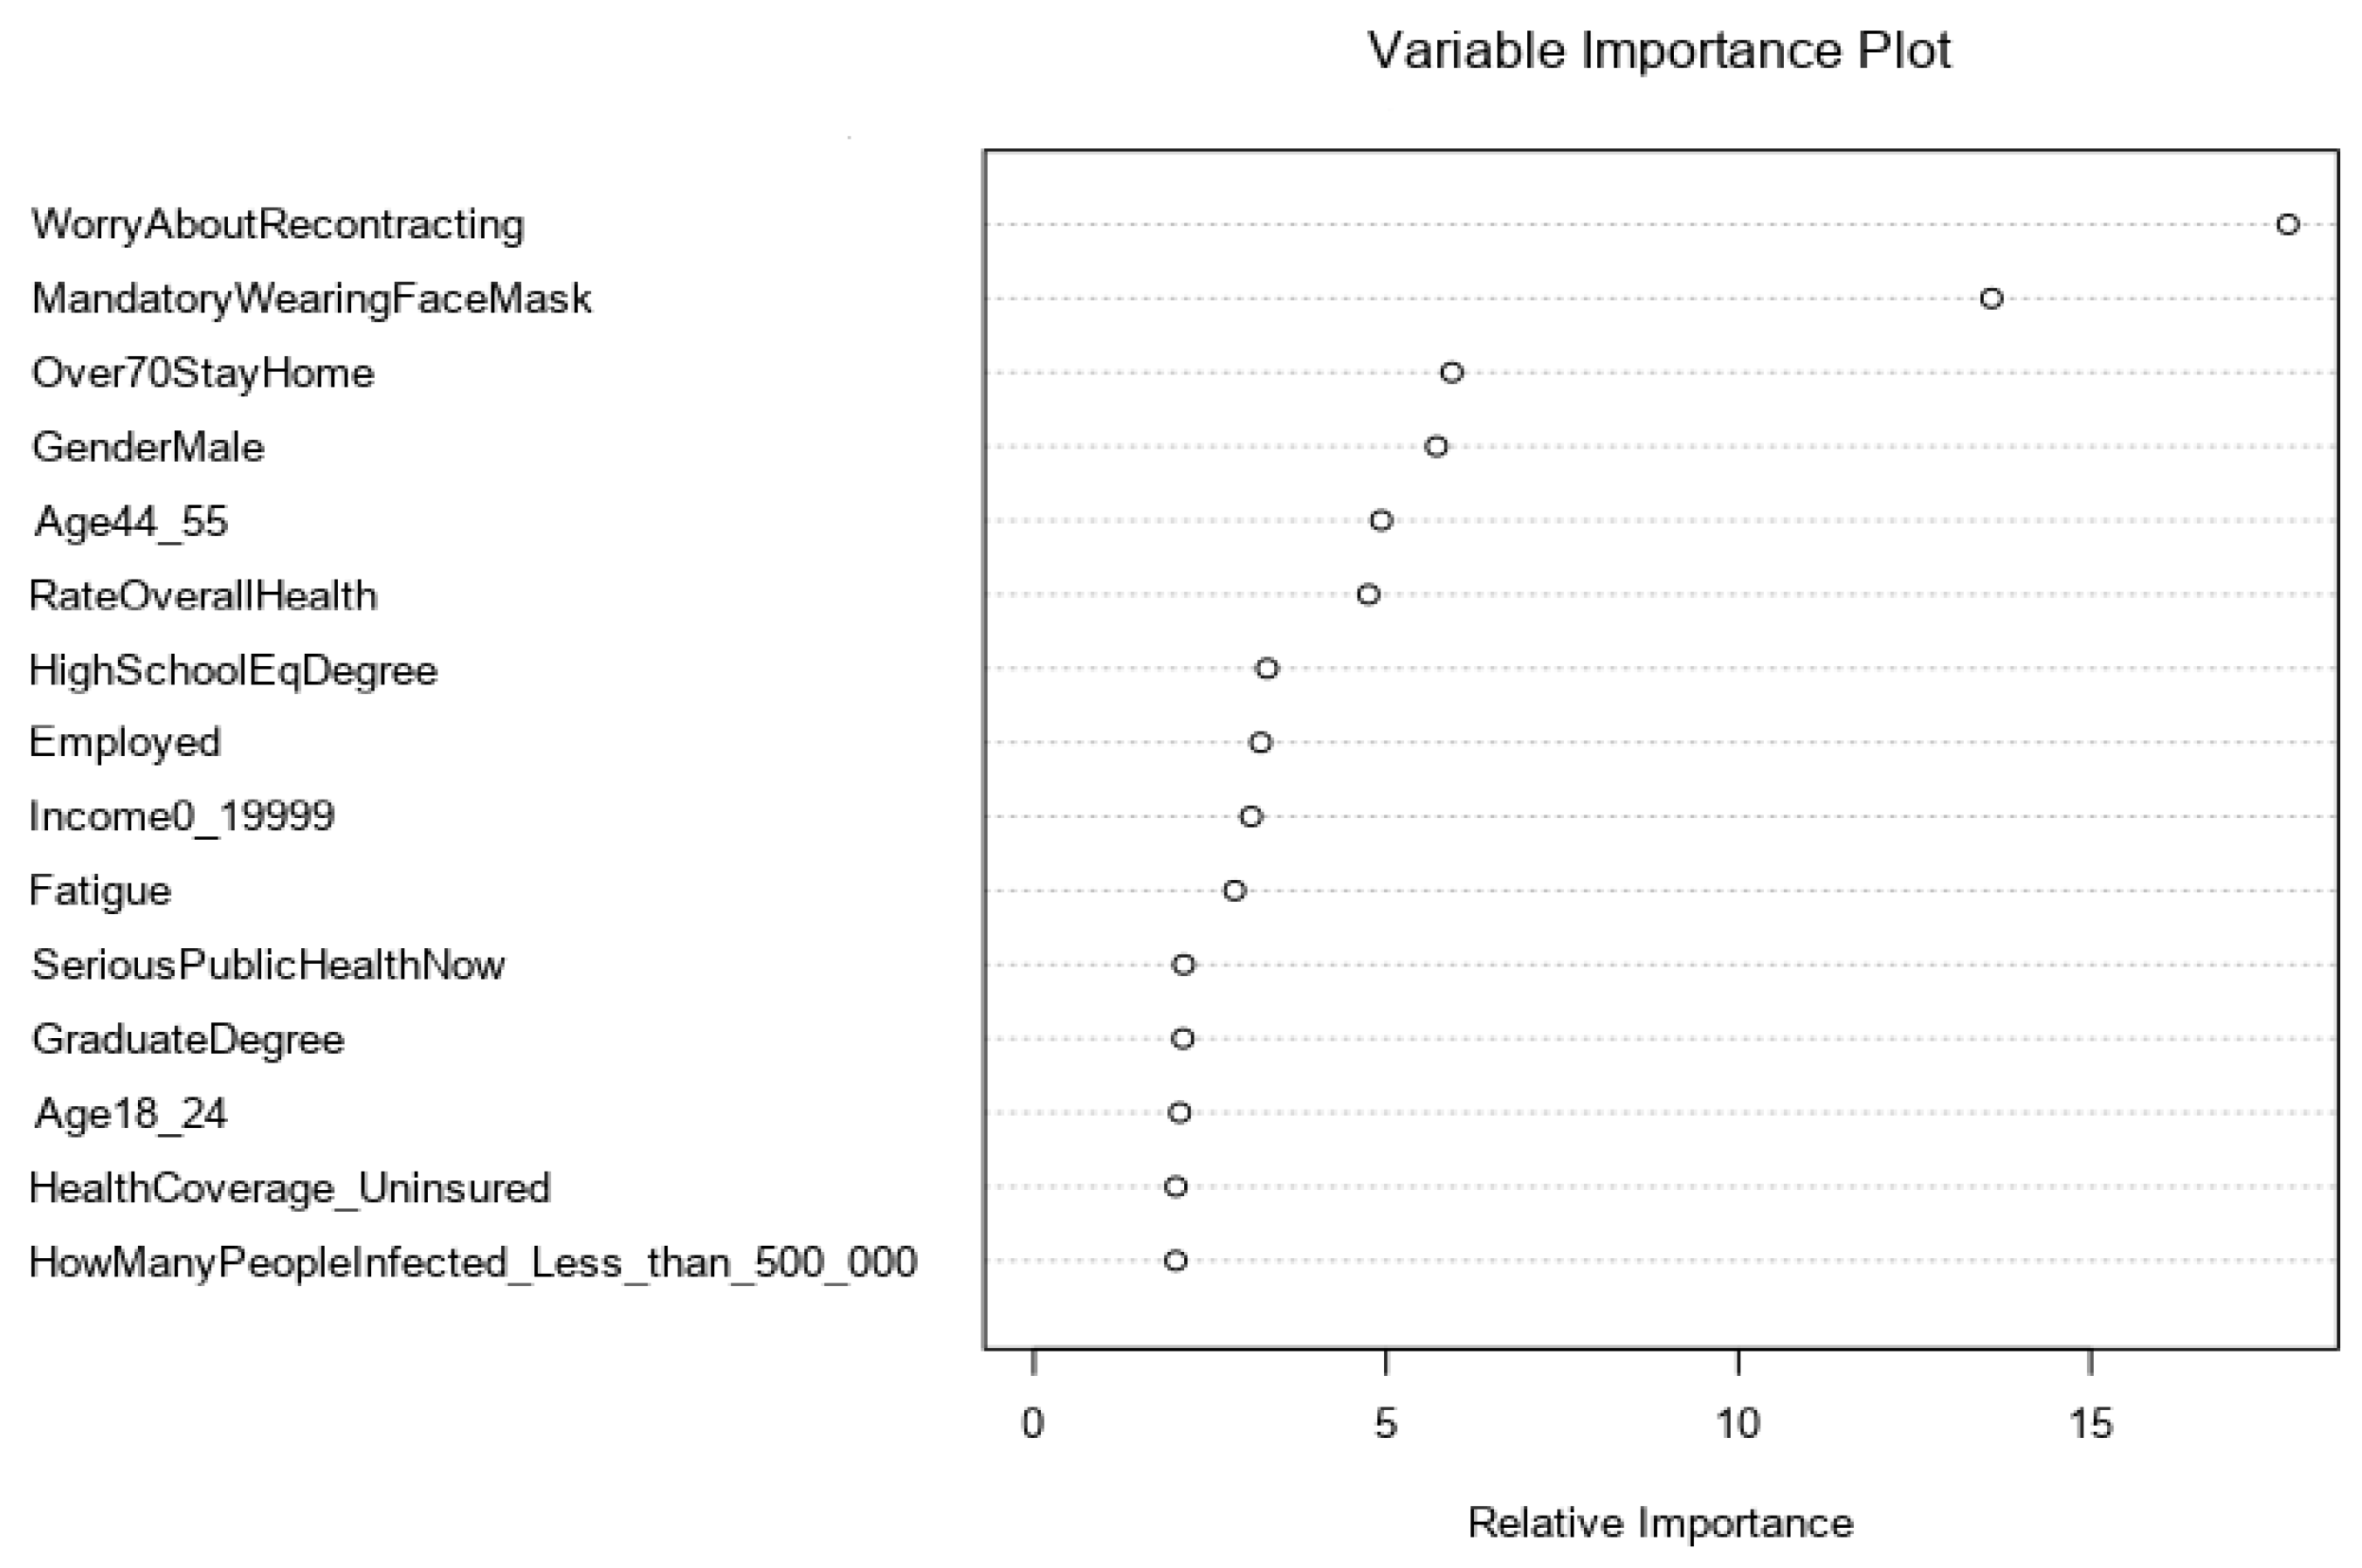
Feature Importance
4. Discussion
5. Conclusions
Author Contributions
Funding
Institutional Review Board Statement
Informed Consent Statement
Data Availability Statement
Conflicts of Interest
References
- Cucinotta, D.; Vanelli, M. WHO Declares COVID-19 a Pandemic. Acta Biomed. 2020, 91, 157–160. [Google Scholar] [CrossRef] [PubMed]
- Institute for Health Metrics and Evaluation (IHME). COVID-19 Results Briefing: [Global]. Available online: https://www.healthdata.org/covid/updates (accessed on 24 May 2021).
- Forbes. Israel’s Covid Deaths Hit Zero with Almost 60% of Population Vaccinated. Available online: https://www.forbes.com/sites/joewalsh/2021/04/23/israels-covid-deaths-hit-zero-with-almost-60-of-population-vaccinated/?sh=237874ed498f (accessed on 15 June 2021).
- Arbel, R.; Hammerman, A.; Sergienko, R.; Friger, M.; Peretz, A.; Netzer, D.; Yaron, S. BNT162b2 vaccine booster and mortality due to COVID-19. N. Engl. J. Med. 2021, 385, 2413–2420. [Google Scholar] [CrossRef] [PubMed]
- Xu, S.; Huang, R.; Sy, L.S.; Glenn, S.C.; Ryan, D.S.; Morrissette, K.; Shay, D.K.; Vazquez-Benitez, G.; Glanz, J.M.; Klein, N.P.; et al. COVID-19 Vaccination and Non–COVID-19 Mortality Risk—Seven Integrated Health Care Organizations, United States, 14 December 2020–31 July 2021. MMWR Morb. Mortal. Wkly. Rep. 2021, 70, 1520–1524. [Google Scholar] [CrossRef] [PubMed]
- Freed, M.; Cubanski, J.; Neuman, T. COVID-19 Deaths Among Older Adults During the Delta Surge Were Higher in States with Lower Vaccination Rates. Available online: https://www.kff.org/policy-watch/covid-19-deaths-among-older-adults-during-the-delta-surge-were-higher-in-states-with-lower-vaccination-rates/ (accessed on 14 December 2021).
- Siegler, A.J.; Luisi, N.; Hall, E.W.; Bradley, H.; Sanchez, T.; Lopman, B.A.; Sullivan, P.S. Trajectory of COVID-19 Vaccine Hesitancy Over Time and Association of Initial Vaccine Hesitancy with Subsequent Vaccination. JAMA Netw. Open 2021, 4, e2126882. [Google Scholar] [CrossRef] [PubMed]
- Jarrett, C.; Wilson, R.; O’Leary, M.; Eckersberger, E.; Larson, H.J.; SAGE Working Group on Vaccine Hesitancy. Strategies for addressing vaccine hesitancy—A systematic review. Vaccine 2015, 33, 4180–4190. [Google Scholar] [CrossRef] [PubMed] [Green Version]
- Wouters, O.J.; Shadlen, K.C.; Salcher-Konrad, M.; Pollard, A.J.; Larson, H.J.; Teerawattananon, Y.; Jit, M. Challenges in ensuring global access to COVID-19 vaccines: Production, affordability, allocation, and deployment. Lancet 2021, 397, 1023–1034. [Google Scholar] [CrossRef]
- Fernandes, N.; Costa, D.; Costa, D.; Keating, J.; Arantes, J. Predicting COVID-19 Vaccination Intention: The Determinants of Vaccine Hesitancy. Vaccines 2021, 9, 1161. [Google Scholar] [CrossRef] [PubMed]
- Jennings, W.; Stoker, G.; Bunting, H.; Valgarðsson, V.O.; Gaskell, J.; Devine, D.; McKay, L.; Mills, M.C. Lack of Trust, Conspiracy Beliefs, and Social Media Use Predict COVID-19 Vaccine Hesitancy. Vaccines 2021, 9, 593. [Google Scholar] [CrossRef] [PubMed]
- Leevy, J.; Khoshgoftaar, T.M.; Bauder, R.A.; Seliya, N. A survey on addressing high-class imbalance in big data. J. Big Data 2018, 5, 42. [Google Scholar] [CrossRef]
- Fernández, A.; Garcia, S.; Herrera, F.; Chawla, N.V. SMOTE for Learning from Imbalanced Data: Progress and Challenges, Marking the 15-year Anniversary. J. Artif. Intell. Res. 2018, 61, 863–905. [Google Scholar] [CrossRef]
- Chern, C.C.; Chen, Y.J.; Hsiao, B. Decision tree–Based classifier in providing telehealth service. BMC Med. Inform. Decis. Mak. 2019, 19, 104. [Google Scholar] [CrossRef] [PubMed] [Green Version]
- Svetnik, V.; Liaw, A.; Tong, C.; Culberson, J.C.; Sheridan, R.P.; Feuston, B.P. Random forest: A classification and regression tool for compound classification and QSAR modeling. J. Chem. Inf. Comput. Sci. 2003, 43, 1947–1958. [Google Scholar] [CrossRef] [PubMed]
- Muhammad, Y.; Kani, Y.A.; Iliya, S.; Muhammad, J.B.; Binji, A.; Ahmad, A.E.-F.; Kabir, M.B.; Bindawa, K.U.; Ahmed, A. Deficiency of antioxidants and increased oxidative stress in COVID-19 patients: A cross-sectional comparative study in Jigawa, Northwestern Nigeria. SAGE Open Med. 2021, 9, 2050312121991246. [Google Scholar] [CrossRef] [PubMed]
- Heinson, A.I.; Ewing, R.M.; Holloway, J.; Woelk, C.H.; Niranjan, M. An evaluation of different classification algorithms for protein sequence-based reverse vaccinology prediction. PLoS ONE 2019, 14, e0226256. [Google Scholar] [CrossRef] [PubMed] [Green Version]
- Arshadi, A.K.; Webb, J.; Salem, M.; Cruz, E.; Calad-Thomson, S.; Ghadirian, N.; Collins, J.; Diez-Cecilia, E.; Kelly, B.; Goodarzi, H.; et al. Artificial Intelligence for COVID-19 Drug Discovery and Vaccine Development. Front. Artif. Intell. 2020, 3, 65. [Google Scholar] [CrossRef] [PubMed]
- Mansour, N.A.; Saleh, A.I.; Badawy, M.; Ali, H.A. Accurate detection of COVID-19 patients based on Feature Correlated Naïve Bayes (FCNB) classification strategy. J. Ambient Intell. Humaniz. Comput. 2021, 1-33. [Google Scholar] [CrossRef] [PubMed]
- Son, Y.J.; Kim, H.G.; Kim, E.H.; Choi, S.; Lee, S.K. Application of support vector machine for prediction of medication adherence in heart failure patients. Healthc. Inform. Res. 2010, 16, 253–259. [Google Scholar] [CrossRef] [PubMed]
- Louppe, G.; Wehenkel, L.; Sutera, A.; Geurts, P. Understanding variable importances in forests of randomized trees. In Proceedings of the 26th International Conference on Neural Information Processing Systems (NIPS, 2013), Lake Tahoe, NV, USA, 5–10 December 2013; Volume 1. [Google Scholar]
- MacDonald, N.E. Vaccine hesitancy: Definition, scope and determinants. Vaccine 2015, 33, 4161–4164. [Google Scholar] [CrossRef] [PubMed]
- Simons-Morton, B.; McLeroy, K.R.; Wendel, M.L. Behavior Theory in Health Promotion Practice and Research; Jones & Bartlett Learning: Burlington, MA, USA, 2011. [Google Scholar]


| Variable | Definition | N (%) |
|---|---|---|
| Age | Age of the respondent: | |
| 1 if between 18 and 24 | 179 (13%) | |
| 2 if between 25 and 35 | 312 (23%) | |
| 3 if between 36 and 45 | 227 (17%) | |
| 4 if between 46 and 55 | 188 (14%) | |
| 5 if between 56 and 65 | 197 (15%) | |
| 6 if more than 65 | 240 (18%) | |
| Gender | 1 if respondent is male, 0 = female | 415 (31%) |
| Ethnicity | 1 if respondent is White, 0 = otherwise | 996 (74%) |
| Marital Status | 1 if respondent is married, 0 = otherwise | 601 (45%) |
| Education | Highest level of education of the respondent: | |
| Less than high school | 33 (2%) | |
| High school | 260 (19%) | |
| Some college | 316 (24%) | |
| Associate degree | 197 (15%) | |
| Bachelor’s degree | 362 (27%) | |
| Graduate degree | 175 (13%) | |
| Income | Annual family income: | |
| 1 if <$20,000 | 280 (21%) | |
| 2 if between $20,000 and $39,999 | 295 (22%) | |
| 3 if between $40,000 and $59,999 | 266 (20%) | |
| 4 if between $60,000 and $79,999 | 186 (14%) | |
| 5 if between $80,000 and $99,999 | 102 (8%) | |
| 6 if more than $100,000 | 214 (16%) | |
| Employment Status | 1 if respondent is employed, 0 = otherwise | 1032 (77%) |
| Health Care Worker | 1 if respondent is a health-care worker, 0 = otherwise | 338 (25%) |
| Variable | Levels |
|---|---|
| Socio-Demographic | |
| Age | [(18–24), (25–35), (36–45), (46–55), (56–65), (>65)] |
| Gender | 1 = Male, 0 = Female |
| Ethnicity | 1 = White, 0 = Others |
| Marital status | 1 = Married, 0 = Others |
| Education | Less than high school, High school diploma, Some college education, Associate degree, Bachelor’s degree, Graduate degree (Master’s or Doctorate) |
| Income | Less than $20,000, $20,000–$39,999, $40,000–$50,999, $60,000–$79,999; $80,000–$99,999, Equal to or more than $100,000 |
| Employment status | 1 = Employed, 0 = Not employed |
| Healthcare worker | 1 = Healthcare worker, 0=Not healthcare worker |
| Health Background | |
| Health insurance coverage | Affordable Care Act, Medicaid, Medicare, Private health insurance, Uninsured, Other health coverage. |
| Self-rated overall health of the participant | Excellent, Very good, Good, Fair, Poor |
| Living with anyone with at least one pre-existing condition | 1 = Yes, 0 = No |
| Respondent was tested positive for COVID-19 | 1 = Yes, 0 = No |
| Respondent was hospitalized for COVID-19 | 1 = Yes, 0 = No |
| Respondent was worried about re-contracting the virus | 1 = Yes, 0 = No |
| Living with anyone who was tested positive for COVID-19 | 1 = Yes, 0 = No |
| Family member died because of COVID-19 | 1 = Yes, 0 = No |
| Awareness and Knowledge of COVID-19 | |
| How many people do you think have been infected with COVID-19 in the US? | Less than 500,000, 500,001–1,000,000, 1,000,001–3,000,000, 3,000,001–5,000,000, More than 5,000,000, I do not know |
| Which of the following do you think are the symptoms of COVID-19 (select all that apply)? | Fever or chills, Cough, Shortness of breath or difficulty breathing, Fatigue, Muscle or body aches, Headache, New loss of taste or smell, Sore throat, Congestion or runny nose, Nausea or vomiting, Diarrhea, I do not know |
| What measures do you think should be taken to prevent the spread of COVID-19 virus? | Wash hands with water and soap for 20 s, Avoid touching the eyes, nose and mouth with unwashed hands, Avoid close contacts with infected people, Covering mouth and nose when coughing or sneezing, Covering mouth and nose with a mask when around others, Avoid shaking hands, Clean and disinfect frequently touched surfaces daily, Closing windows at home, Wearing gloves all times, I do not know |
| What are the ways through which COVID-19 Virus is contracted? | Close contact (within 6 feet) with an infected person who has symptoms, Close contact (within 6 feet) with an infected person even if they aren’t showing symptoms of infection, Contact with surfaces an infected person has touched, I do not know |
| Perceptions and Attitude towards COVID-19 | |
| How serious of a public health threat did you think the coronavirus was when you first heard about it? | Not serious at all, Not too serious, Somewhat serious, Serious, Very serious |
| How serious of a public health threat do you think the coronavirus is now? | Not serious at all, Not too serious, Somewhat serious, Serious, Very serious |
| How would you rate the federal government’s efforts to control the COVID-19 Pandemic? | Not effective at all, Hardly effective, Somewhat effective, Effective, Very effective |
| Please state the effectiveness of the following policy measures: | |
| Close schools and daycares | Not effective at all, Hardly effective, Somewhat effective, Effective, Very effective |
| Close gyms/restaurants | Not effective at all, Hardly effective, Somewhat effective, Effective, Very effective |
| Close all shops except for supermarkets and pharmacies | Not effective at all, Hardly effective, Somewhat effective, Effective, Very effective |
| Don’t allow visitors in hospitals, nursing homes, and elderly homes | Not effective at all, Hardly effective, Somewhat effective, Effective, Very effective |
| Oblige people aged 70 and over or with a medical condition to stay at home except to do basic shopping or because urgent medical attention is required | Not effective at all, Hardly effective, Somewhat effective, Effective, Very effective |
| Oblige everyone who does not work in a crucial professional group (for example, people who work in healthcare, public transport, the food chain) to stay at home except to do basic shopping or because urgent medical care is required | Not effective at all, Hardly effective, Somewhat effective, Effective, Very effective |
| Mandatory wearing of face masks | Not effective at all, Hardly effective, Somewhat effective, Effective, Very effective |
| Mandatory self-quarantine for travelers from a state with high infection rate | Not effective at all, Hardly effective, Somewhat effective, Effective, Very effective |
| Restrict international travel | Not effective at all, Hardly effective, Somewhat effective, Effective, Very effective |
| Metric Name | Formulas for Confusion Matrix |
|---|---|
| Accuracy | |
| Precision | |
| Sensitivity | |
| Specificity |
| Model | Accuracy | F1 | AUC | Specificity | Sensitivity |
|---|---|---|---|---|---|
| Decision Tree | 0.6681 | 0.6637 | 0.5817 | 0.6573 | 0.6807 |
| Forest Model | 0.7662 | 0.7538 | 0.6910 | 0.7170 | 0.8170 |
| Logistic Regression | 0.7543 | 0.7380 | 0.7415 | 0.6981 | 0.8138 |
| Neural Network | 0.7134 | 0.7109 | 0.6998 | 0.7067 | 0.7197 |
| Naïve Bayes | 0.7338 | 0.7178 | 0.6671 | 0.6798 | 0.7883 |
| Support Vector Machine | 0.7740 | 0.7612 | 0.7199 | 0.7230 | 0.8260 |
Publisher’s Note: MDPI stays neutral with regard to jurisdictional claims in published maps and institutional affiliations. |
© 2022 by the authors. Licensee MDPI, Basel, Switzerland. This article is an open access article distributed under the terms and conditions of the Creative Commons Attribution (CC BY) license (https://creativecommons.org/licenses/by/4.0/).
Share and Cite
Varol, S.; Catma, S.; Reindl, D.; Serieux, E. Primary Factors Influencing the Decision to Vaccinate against COVID-19 in the United States: A Pre-Vaccine Analysis. Int. J. Environ. Res. Public Health 2022, 19, 1026. https://0-doi-org.brum.beds.ac.uk/10.3390/ijerph19031026
Varol S, Catma S, Reindl D, Serieux E. Primary Factors Influencing the Decision to Vaccinate against COVID-19 in the United States: A Pre-Vaccine Analysis. International Journal of Environmental Research and Public Health. 2022; 19(3):1026. https://0-doi-org.brum.beds.ac.uk/10.3390/ijerph19031026
Chicago/Turabian StyleVarol, Serkan, Serkan Catma, Diana Reindl, and Elizabeth Serieux. 2022. "Primary Factors Influencing the Decision to Vaccinate against COVID-19 in the United States: A Pre-Vaccine Analysis" International Journal of Environmental Research and Public Health 19, no. 3: 1026. https://0-doi-org.brum.beds.ac.uk/10.3390/ijerph19031026