
Controlling Non-Grain Production Based on Cultivated Land Multifunction Assessment

Abstract
:1. Introduction
2. Materials and Methods
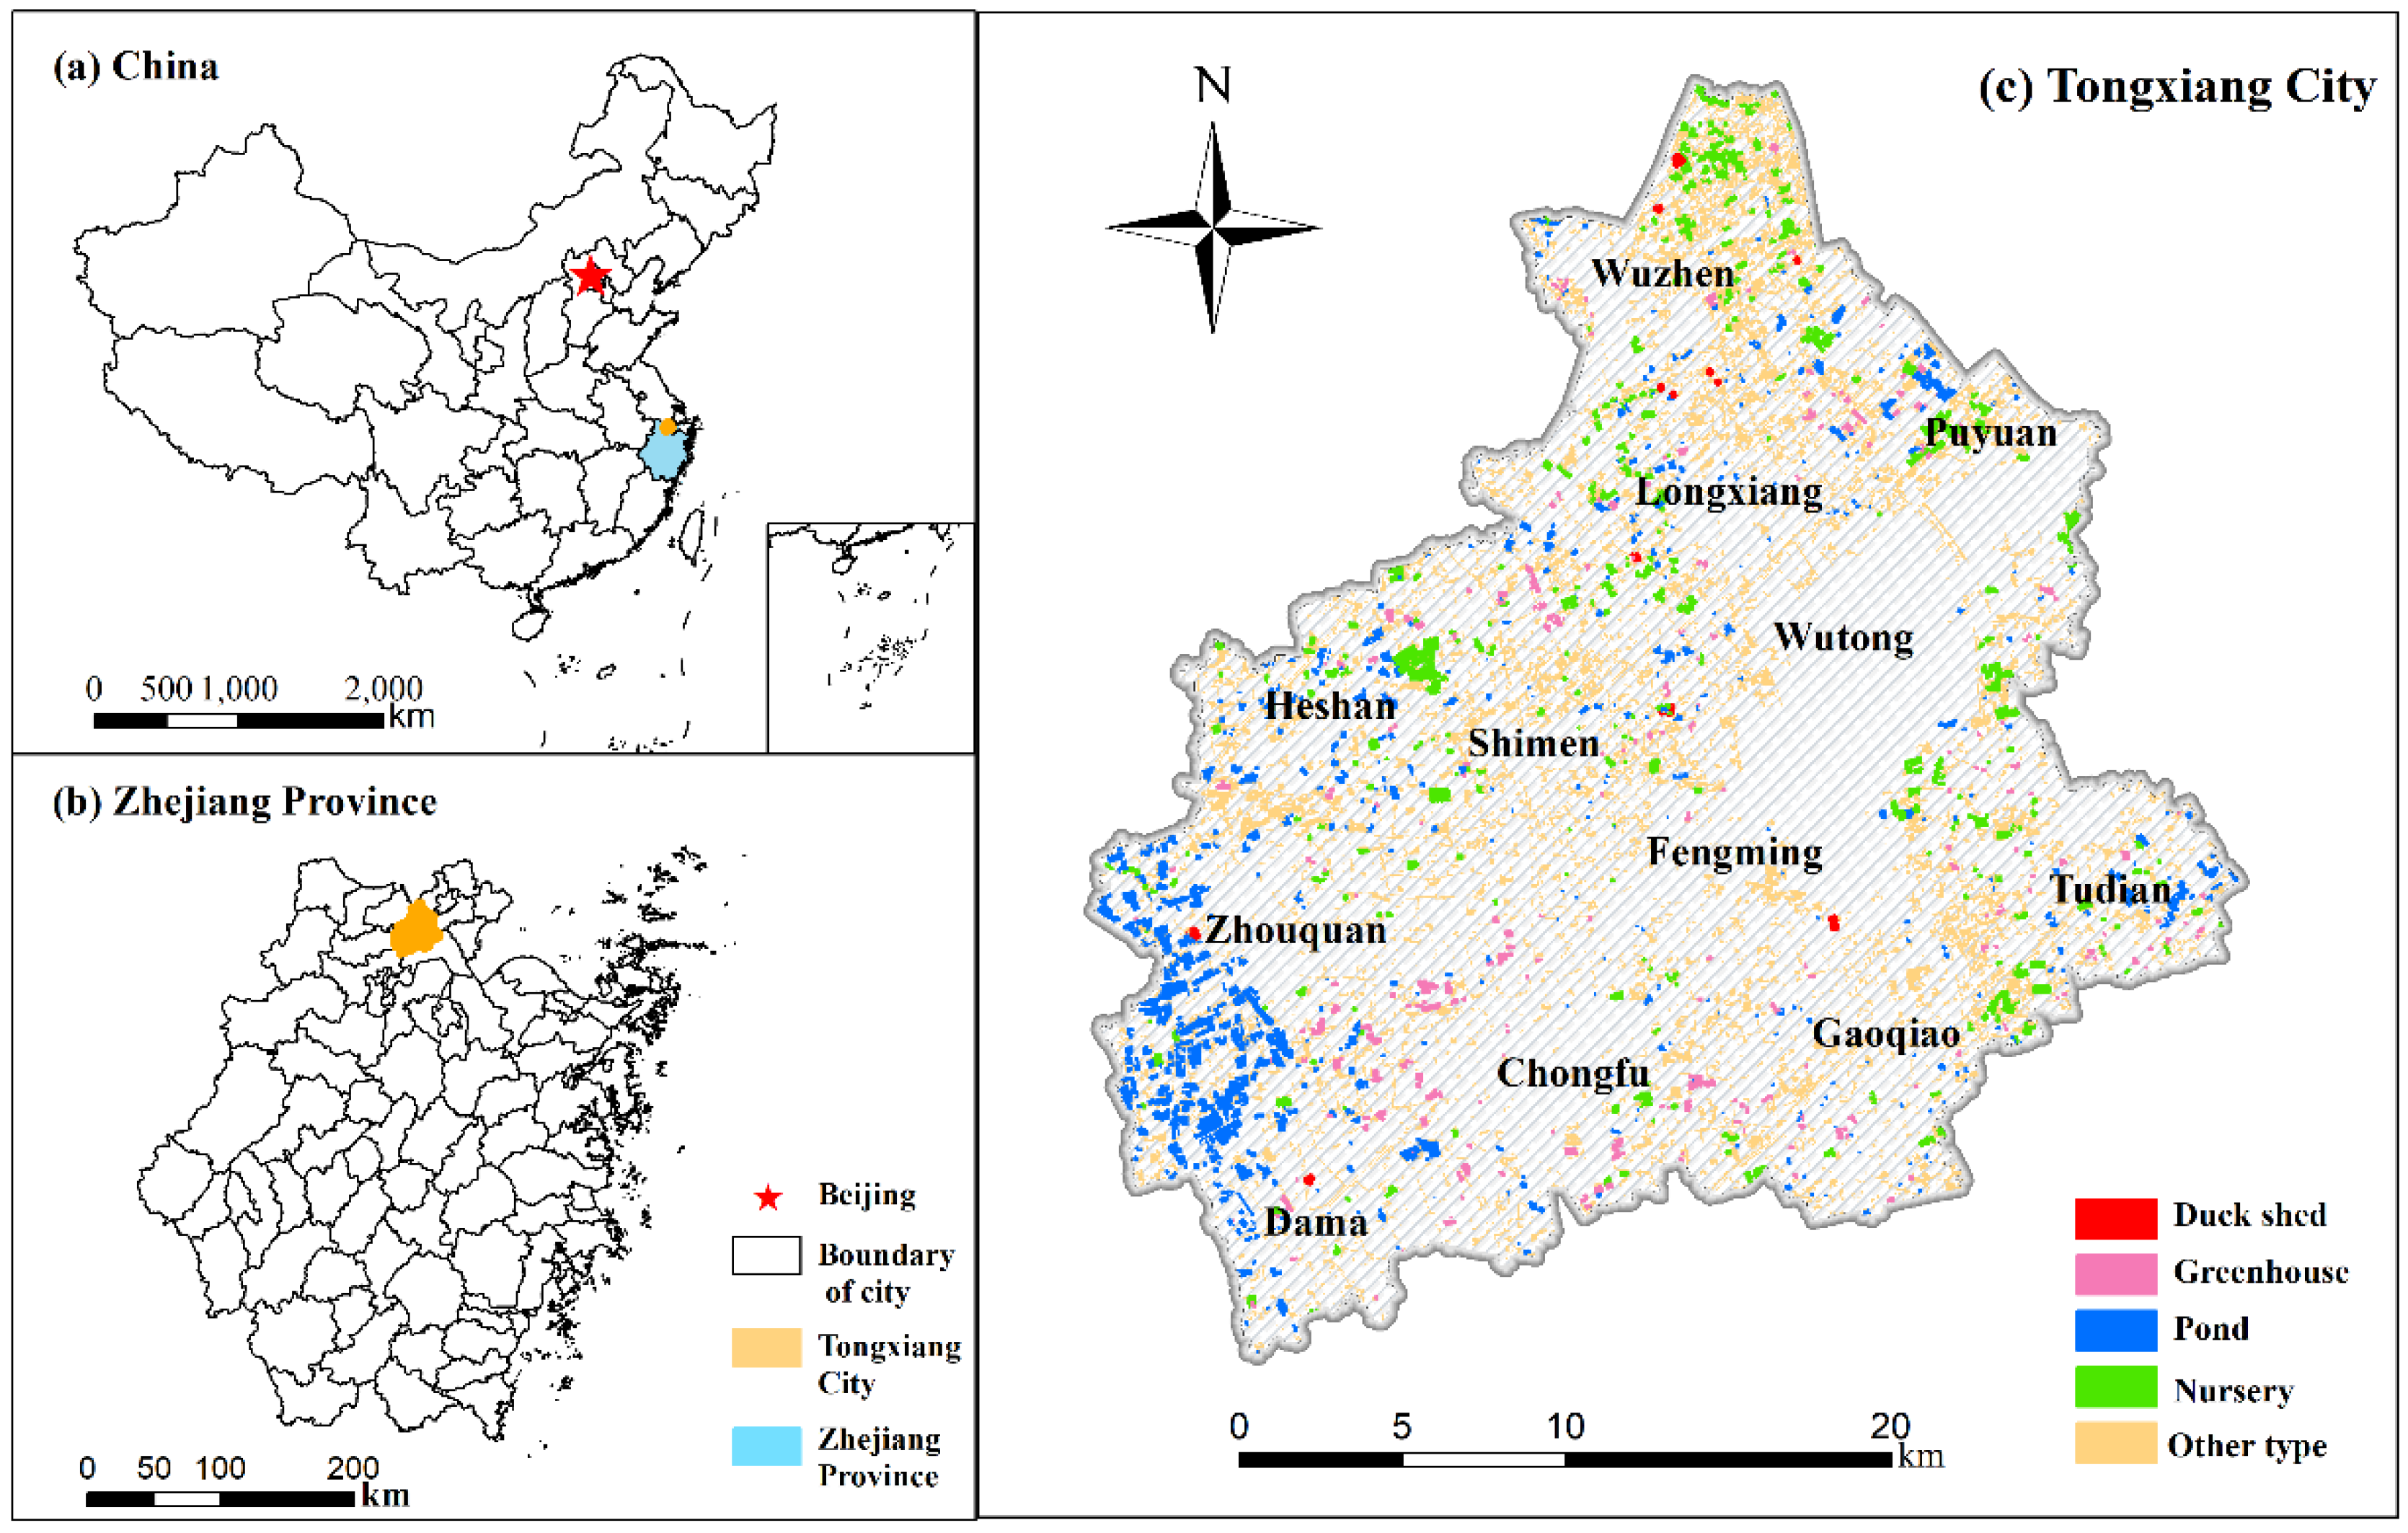
2.1. Study Area
2.2. Data Source and Processing
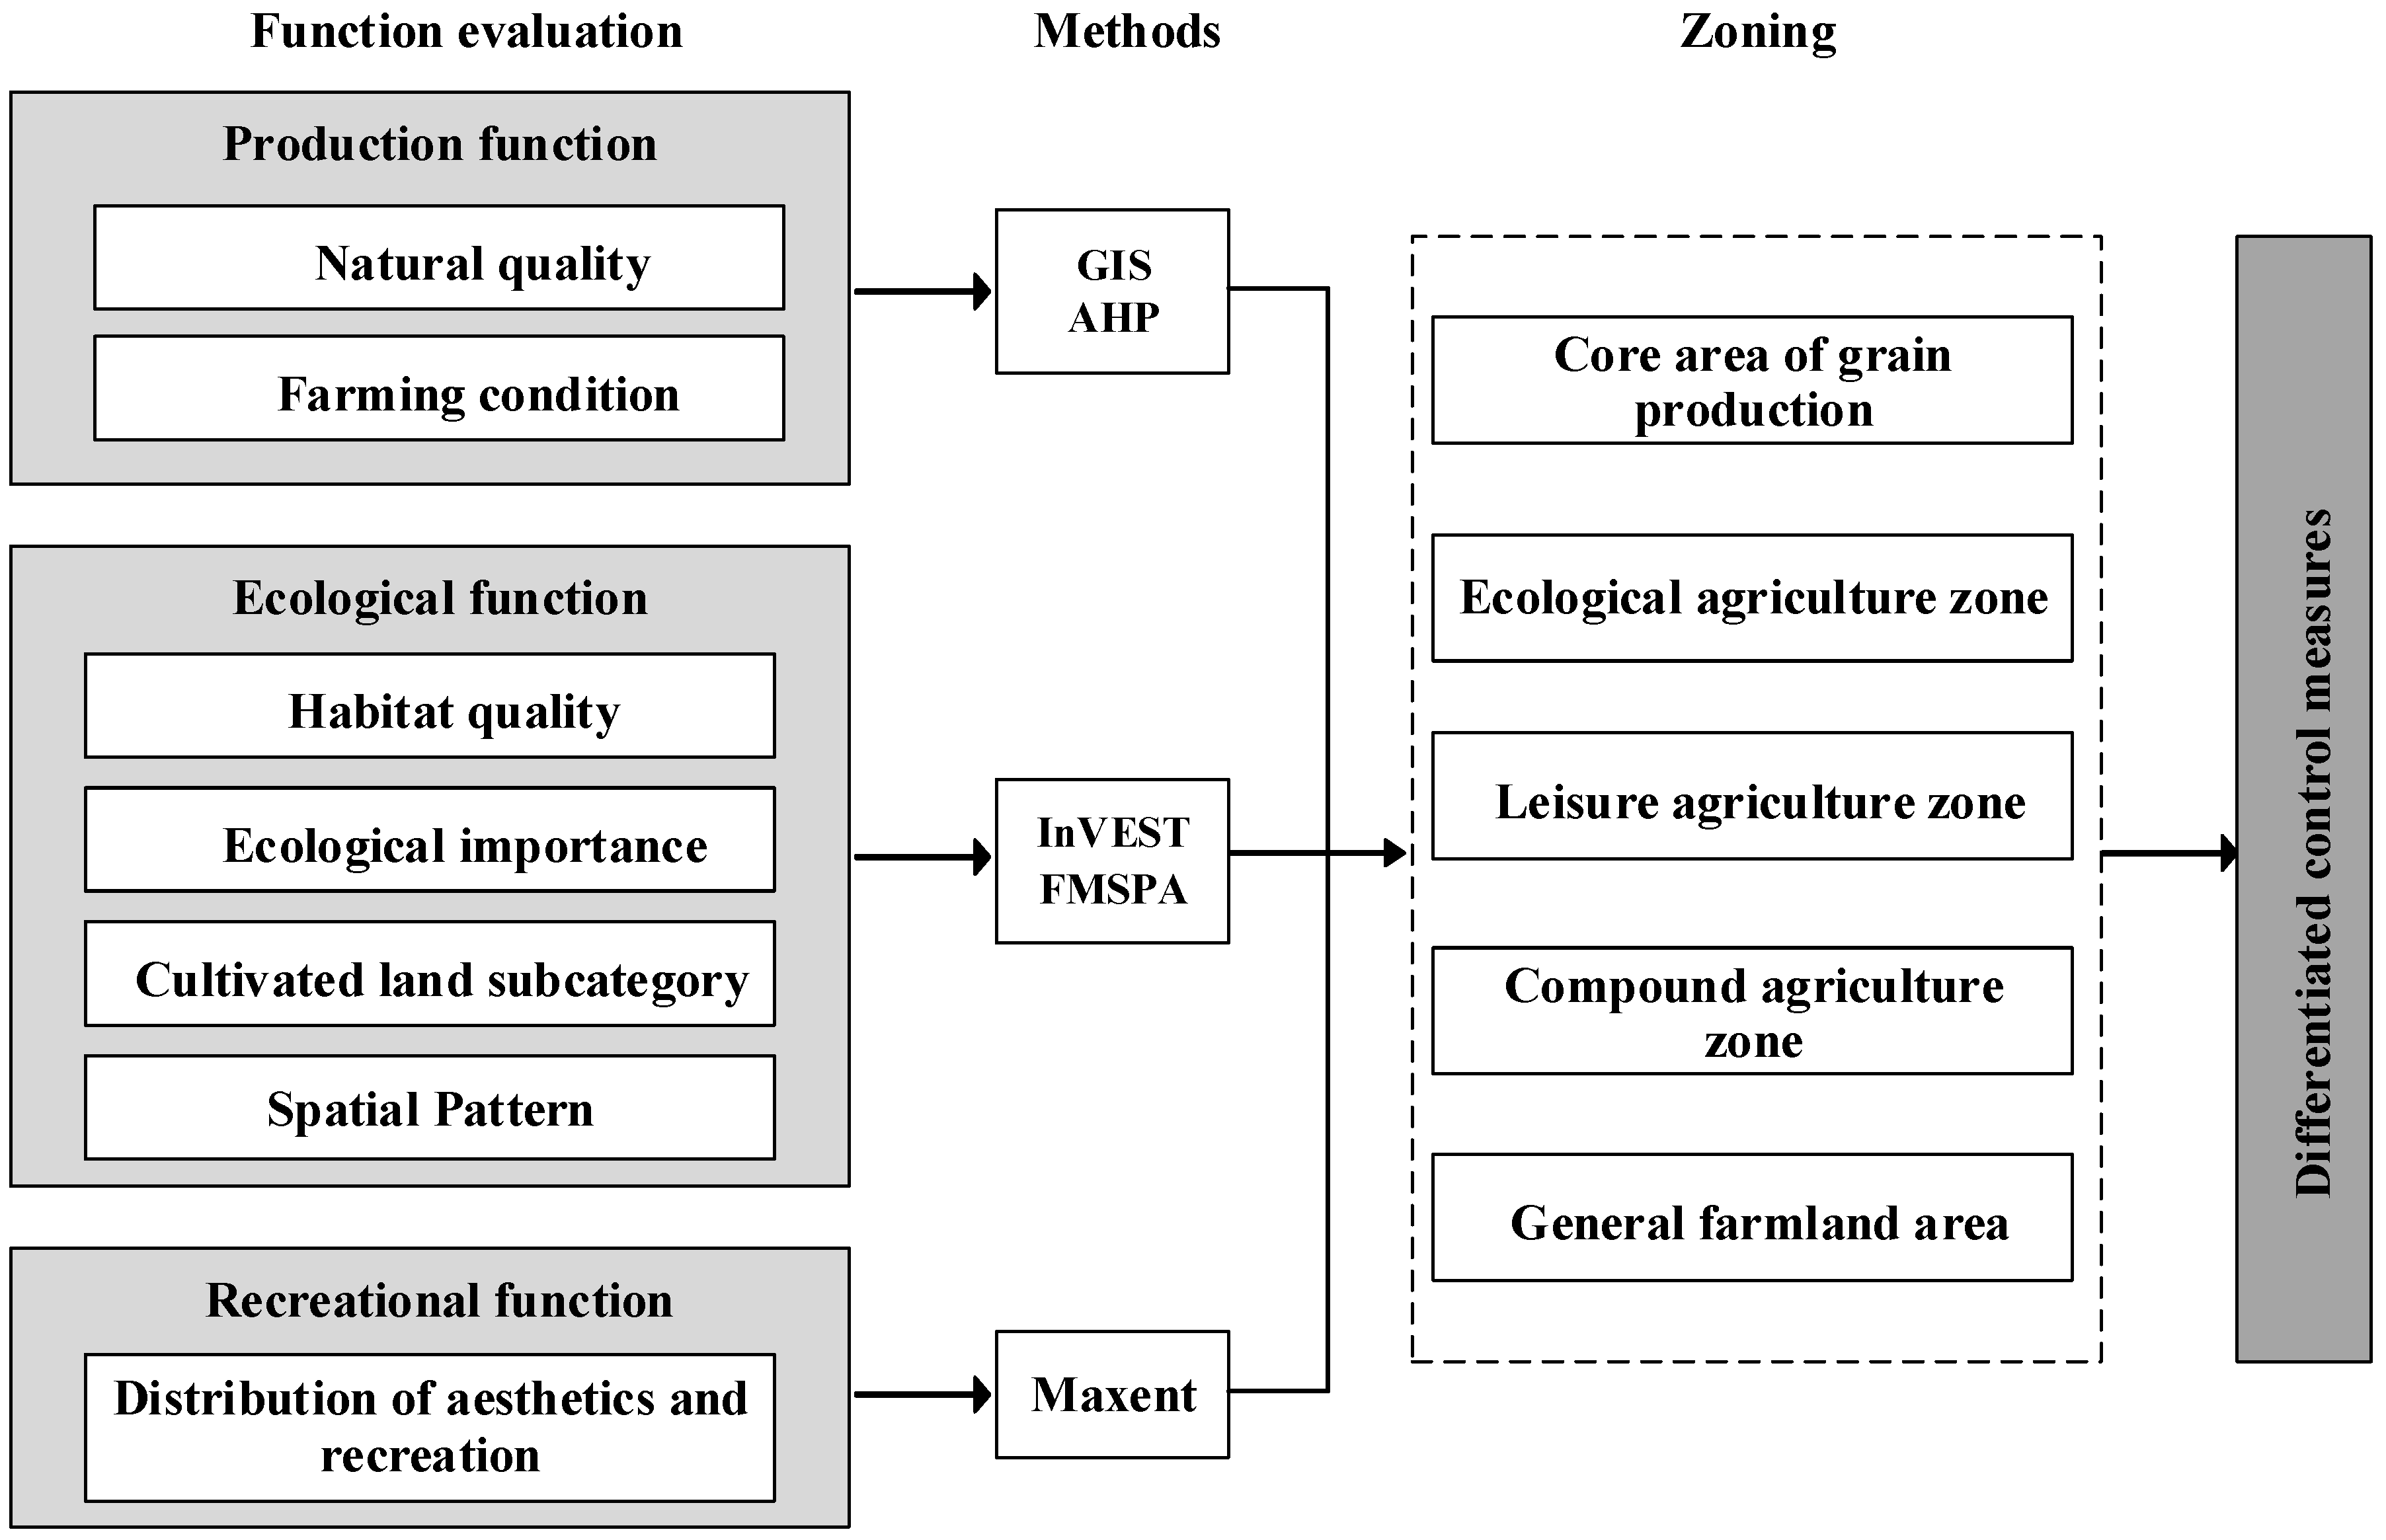
2.3. Research Methodology
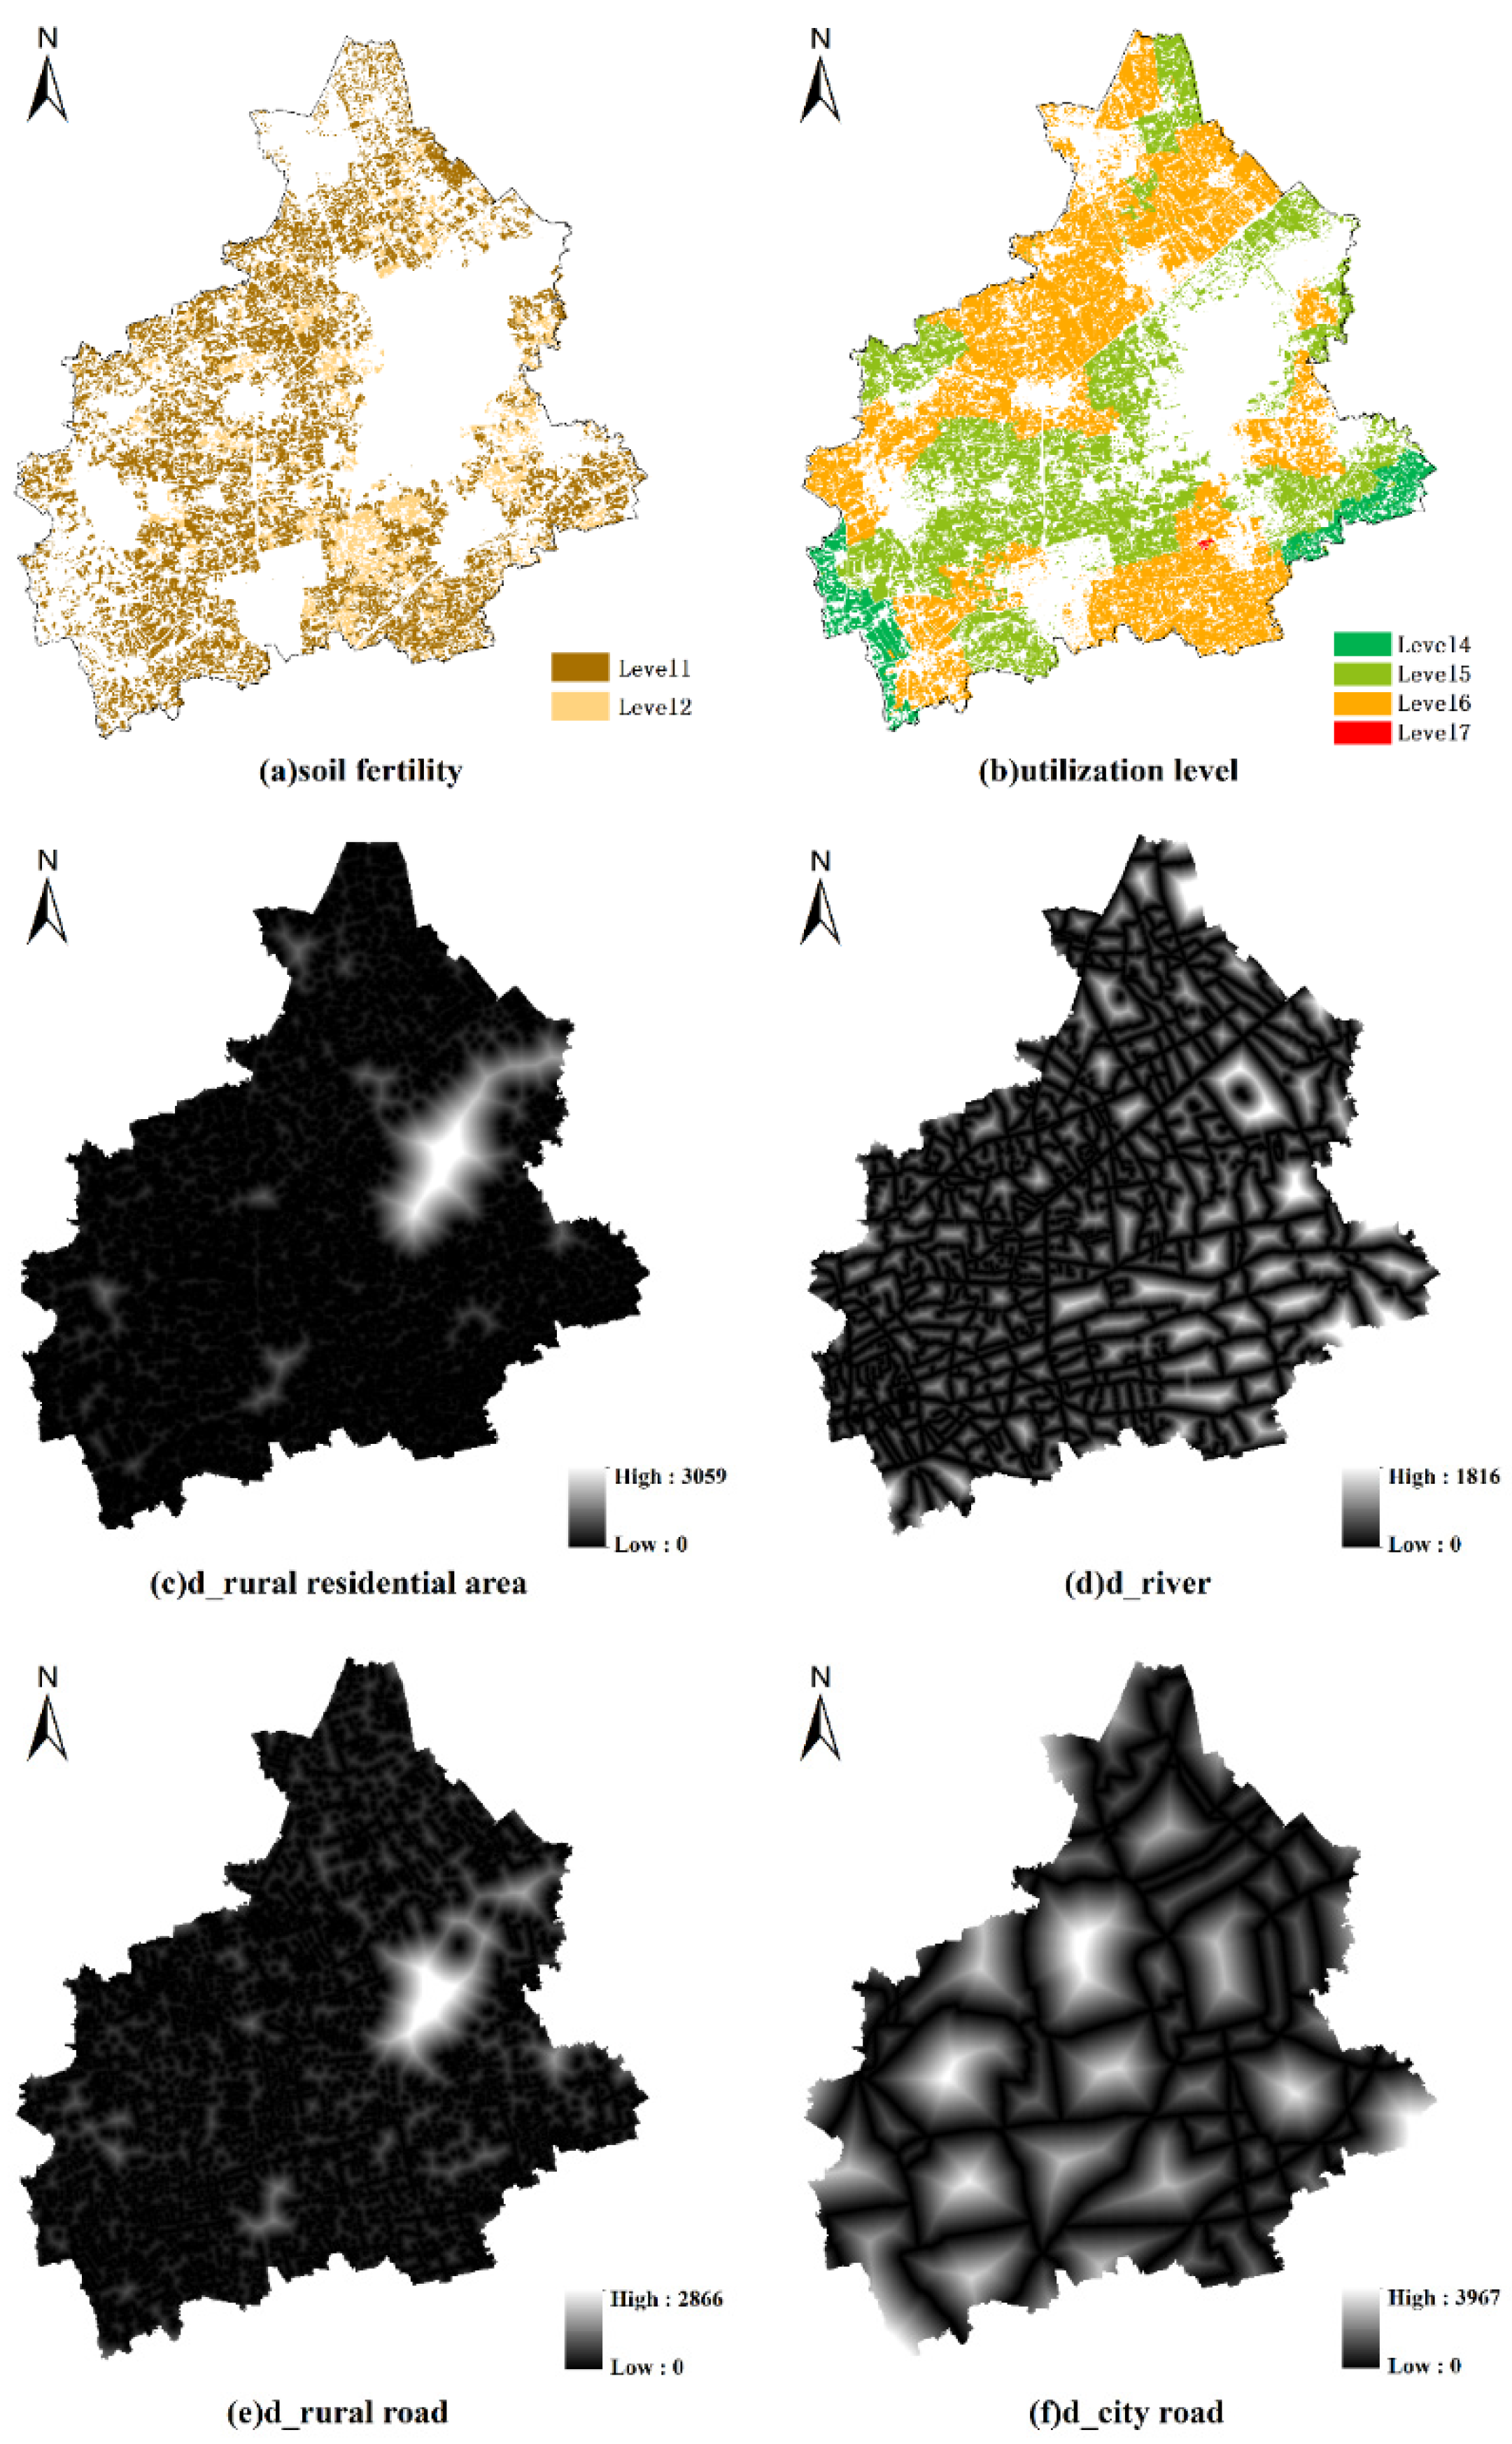
2.3.1. Evaluation of Production Function
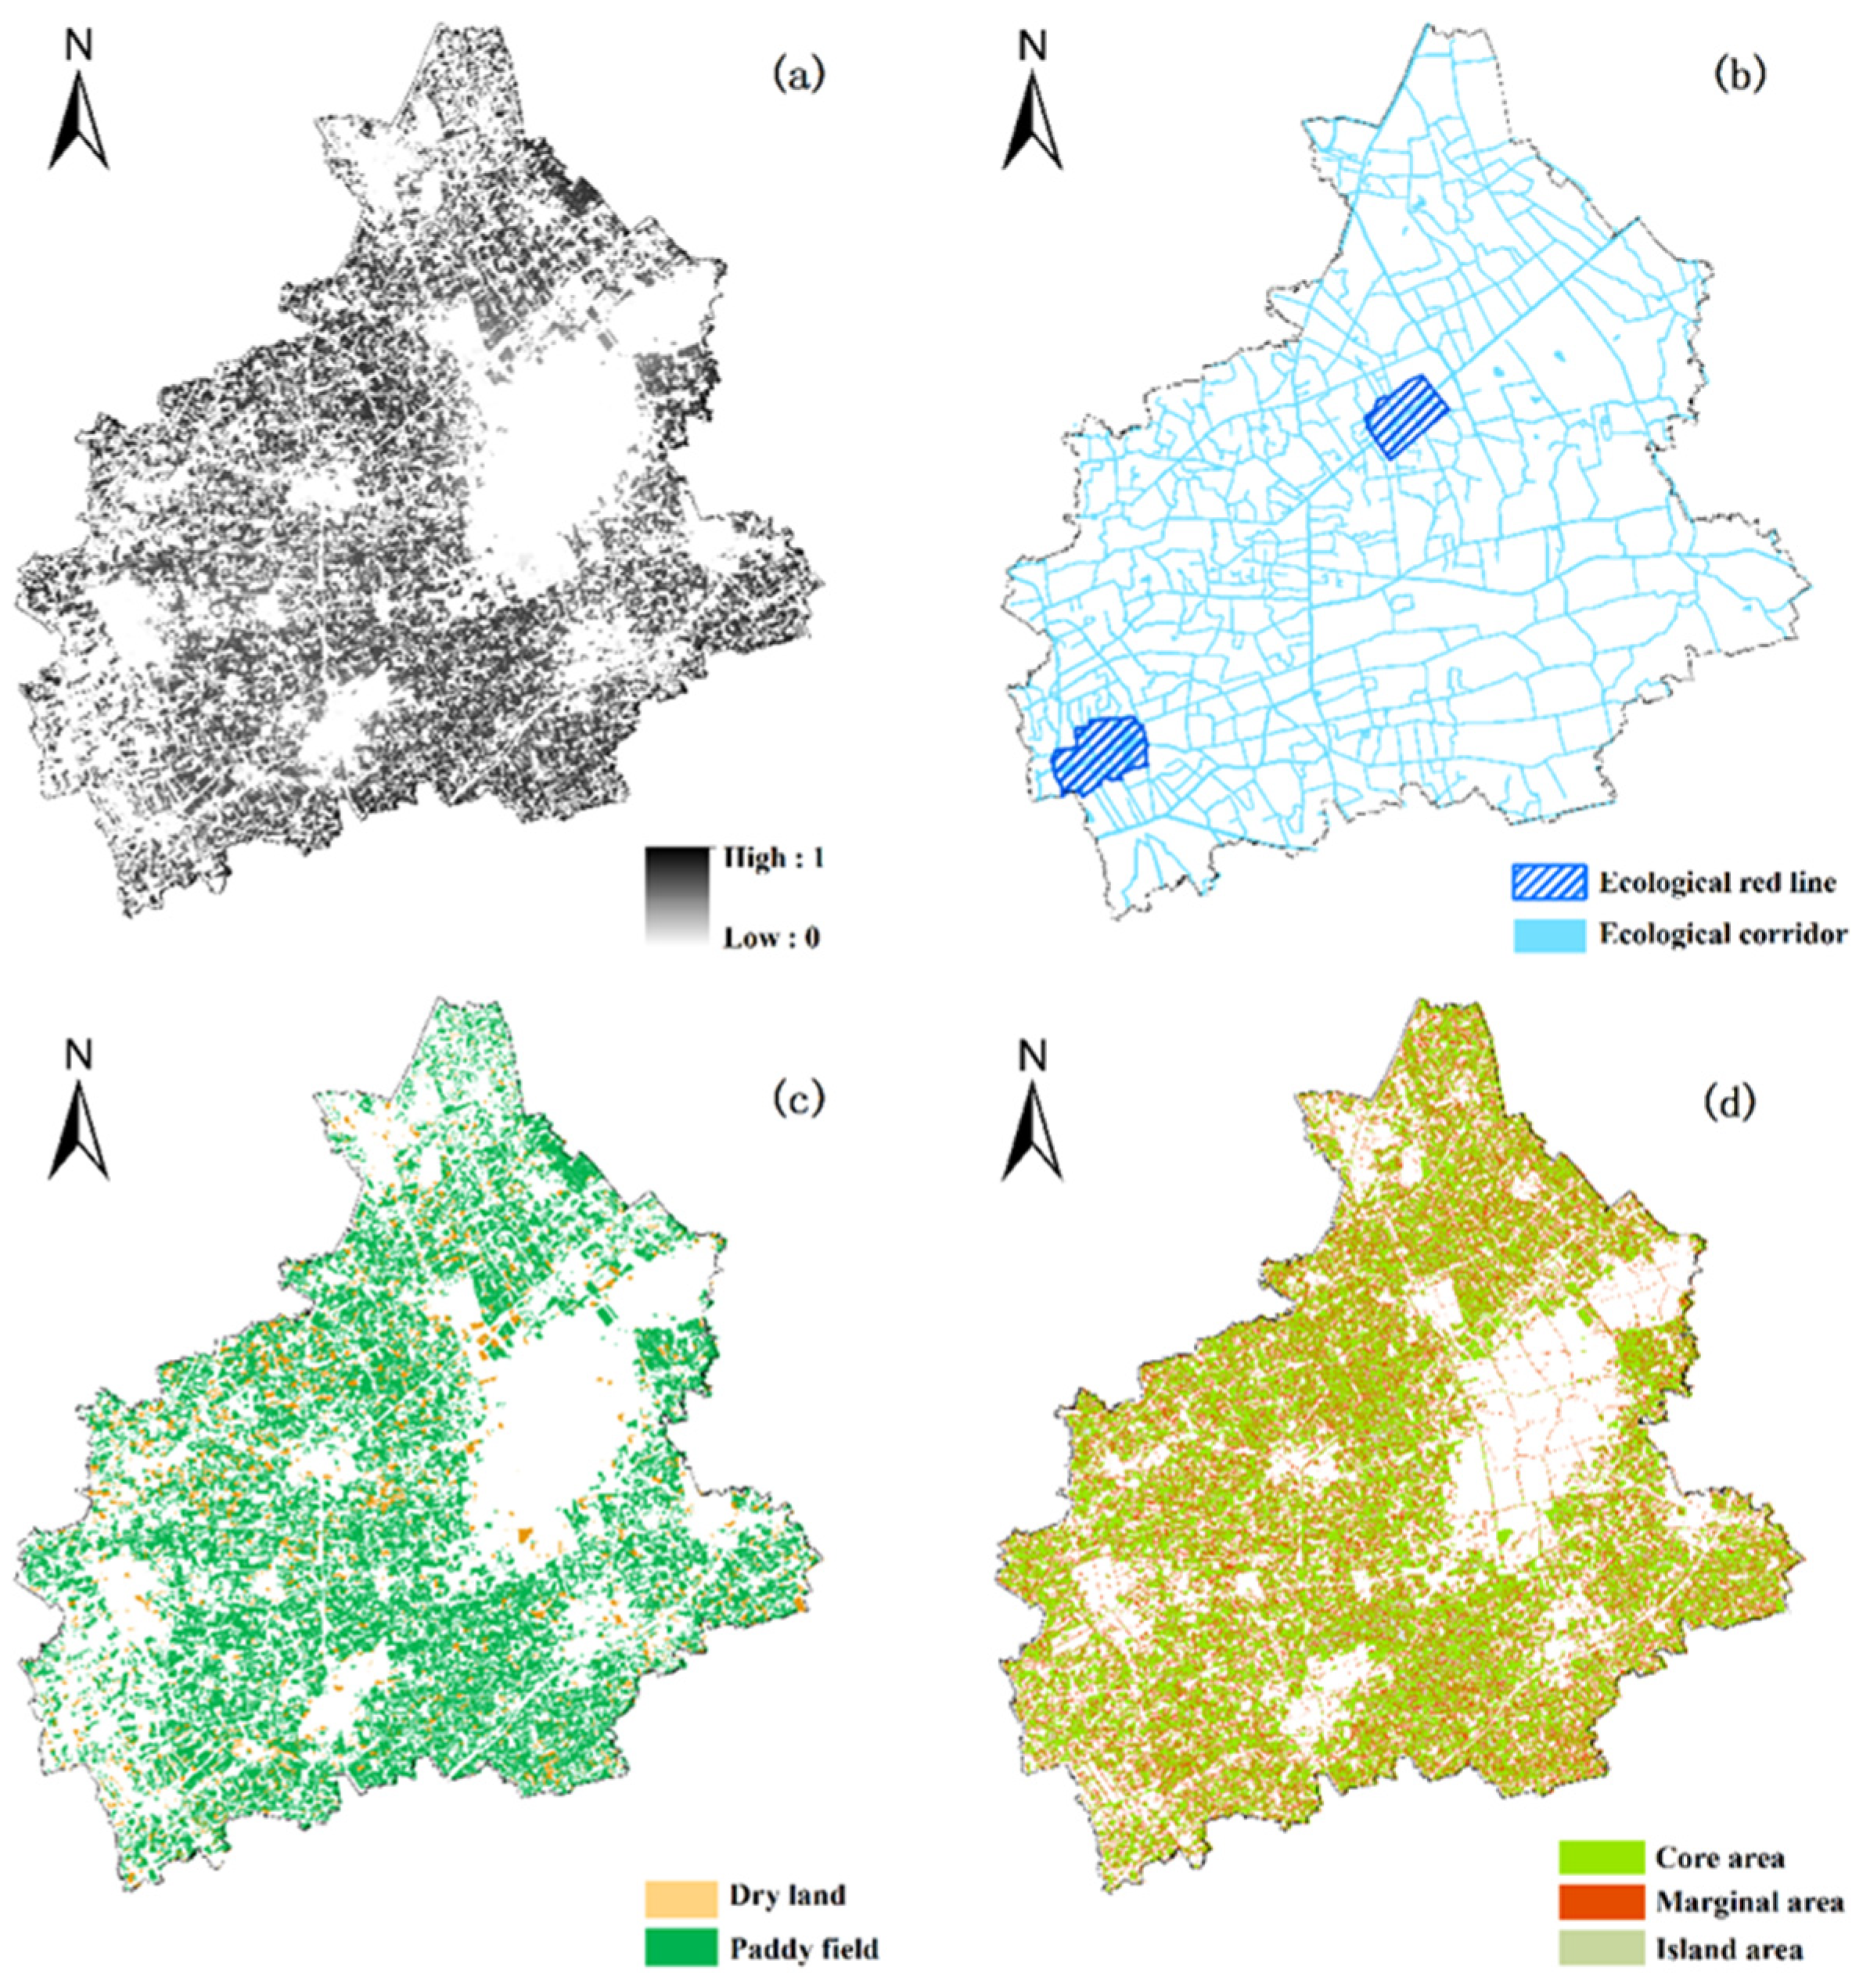
2.3.2. Evaluation of Ecological Function
- (a)
- Habitat Quality
- (b)
- Ecological Importance
- (c)
- Cultivated Land Subcategory
- (d)
- Spatial Pattern of Cultivated Land
2.3.3. Evaluation of Recreational Function
3. Results
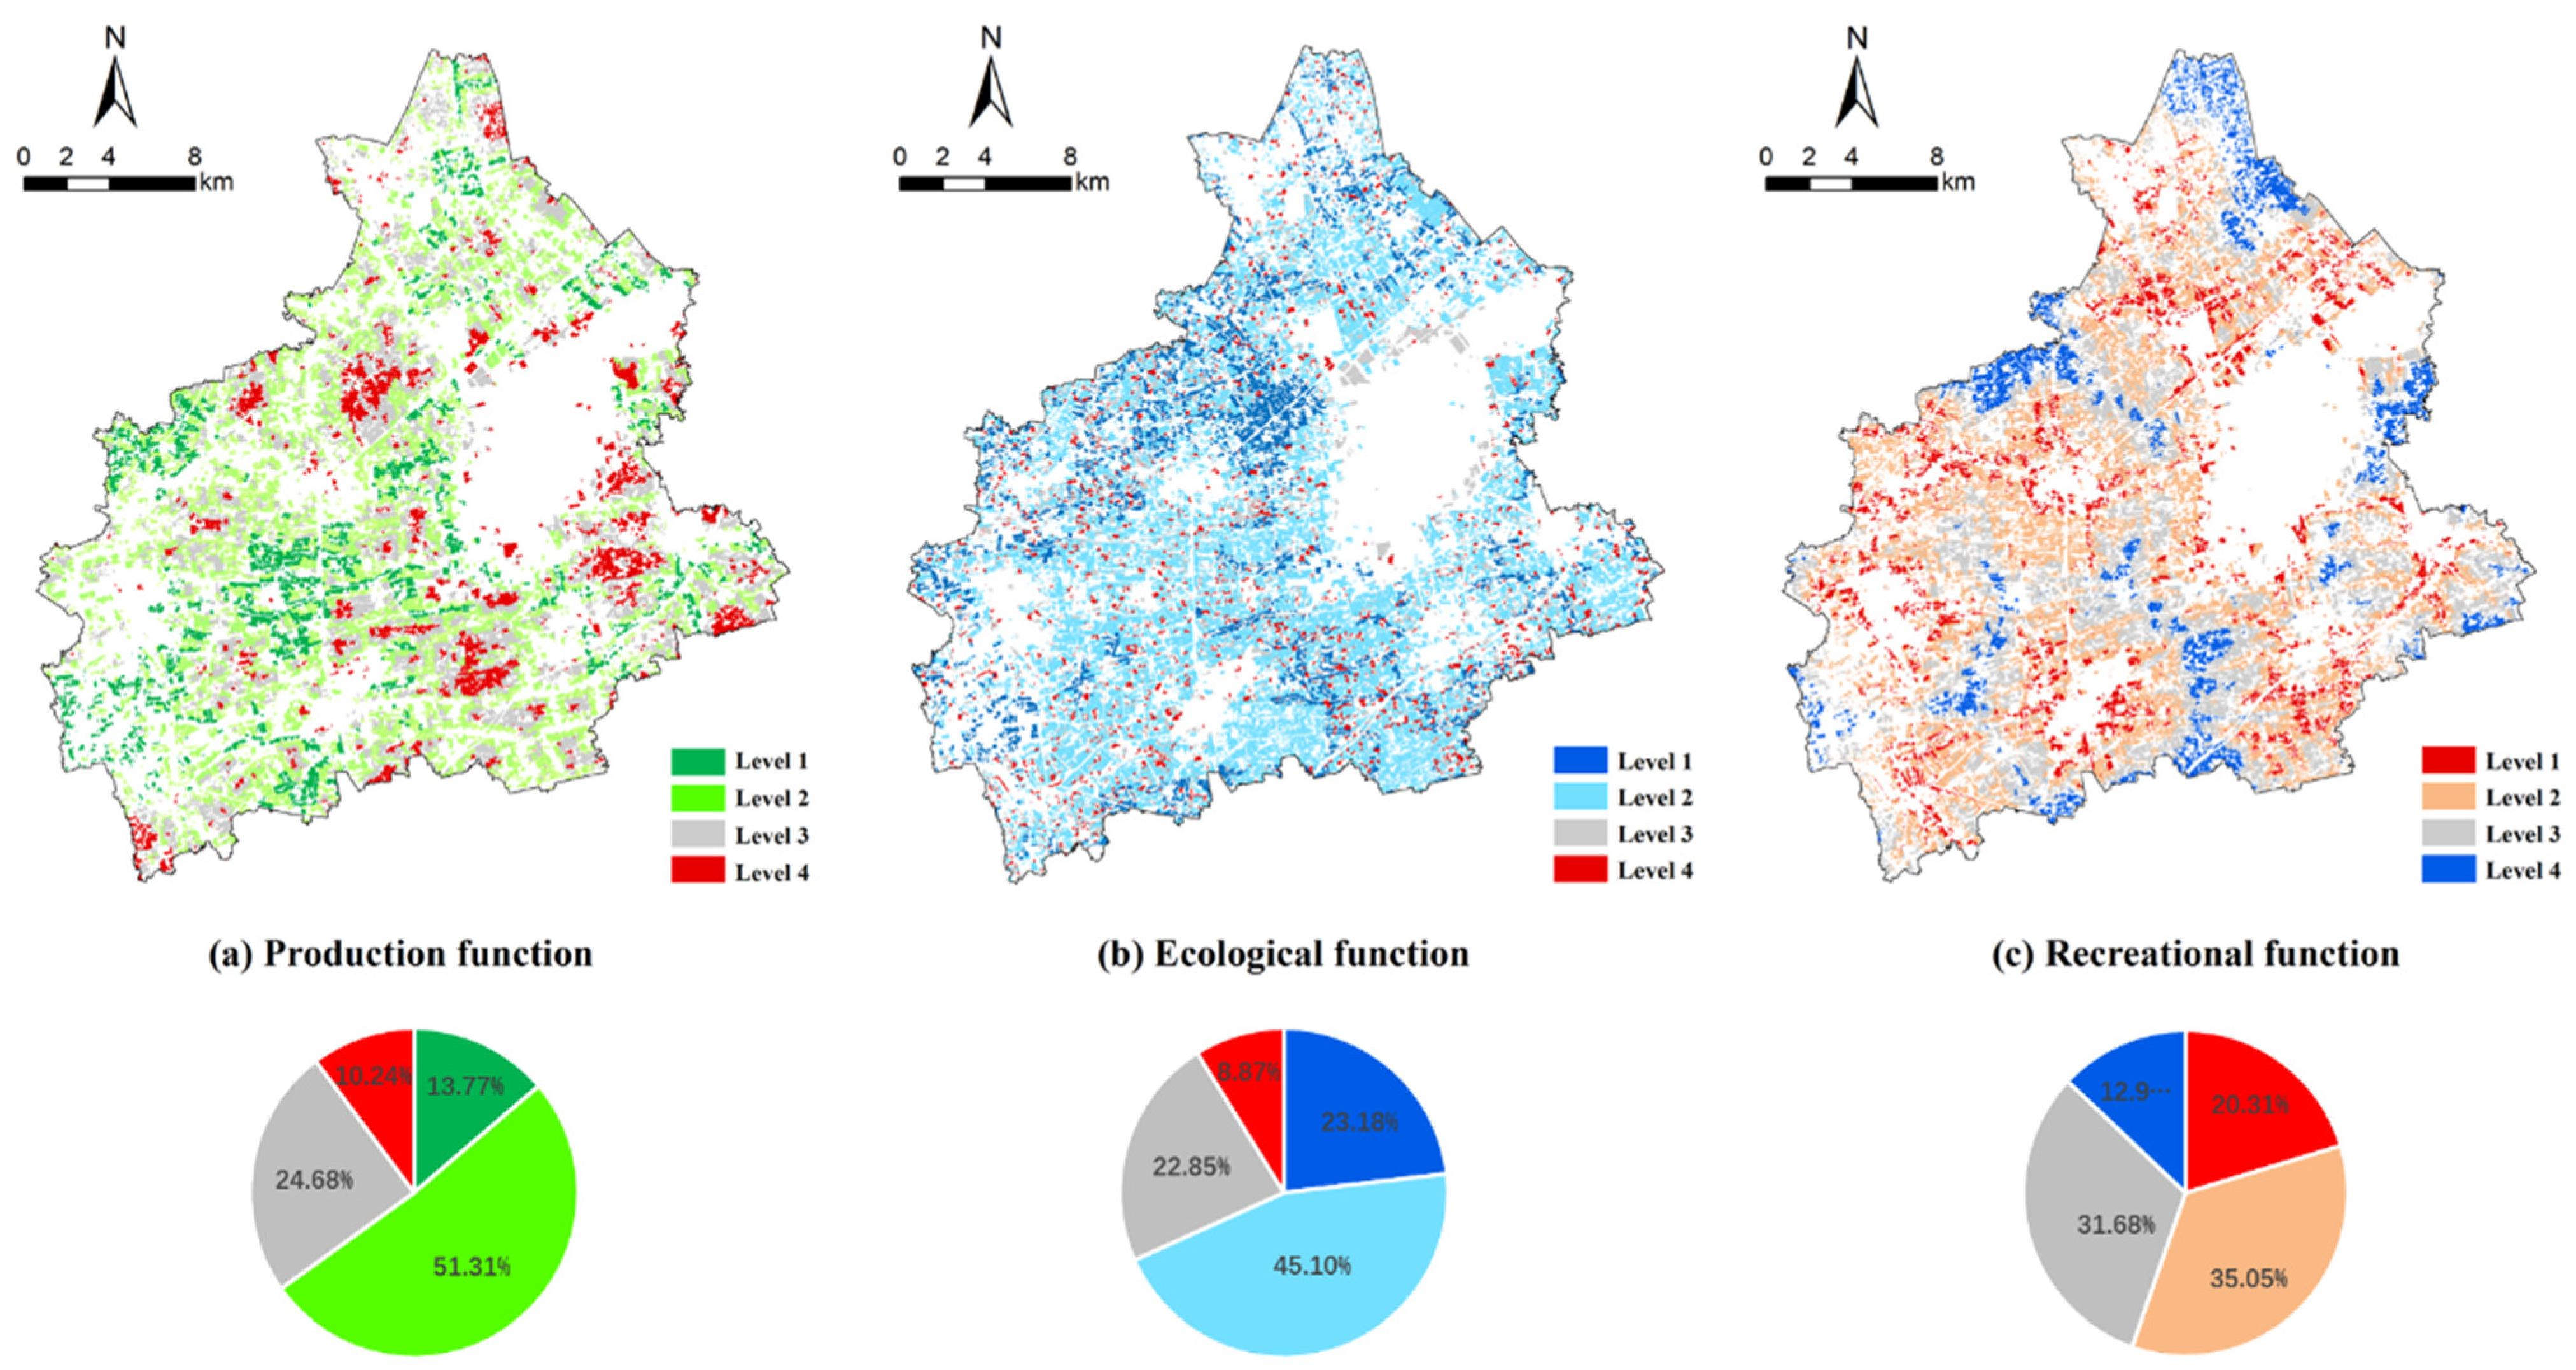
3.1. Evaluation of Production Function
3.2. Evaluation of Ecological Function
3.3. Evaluation of Recreational Function
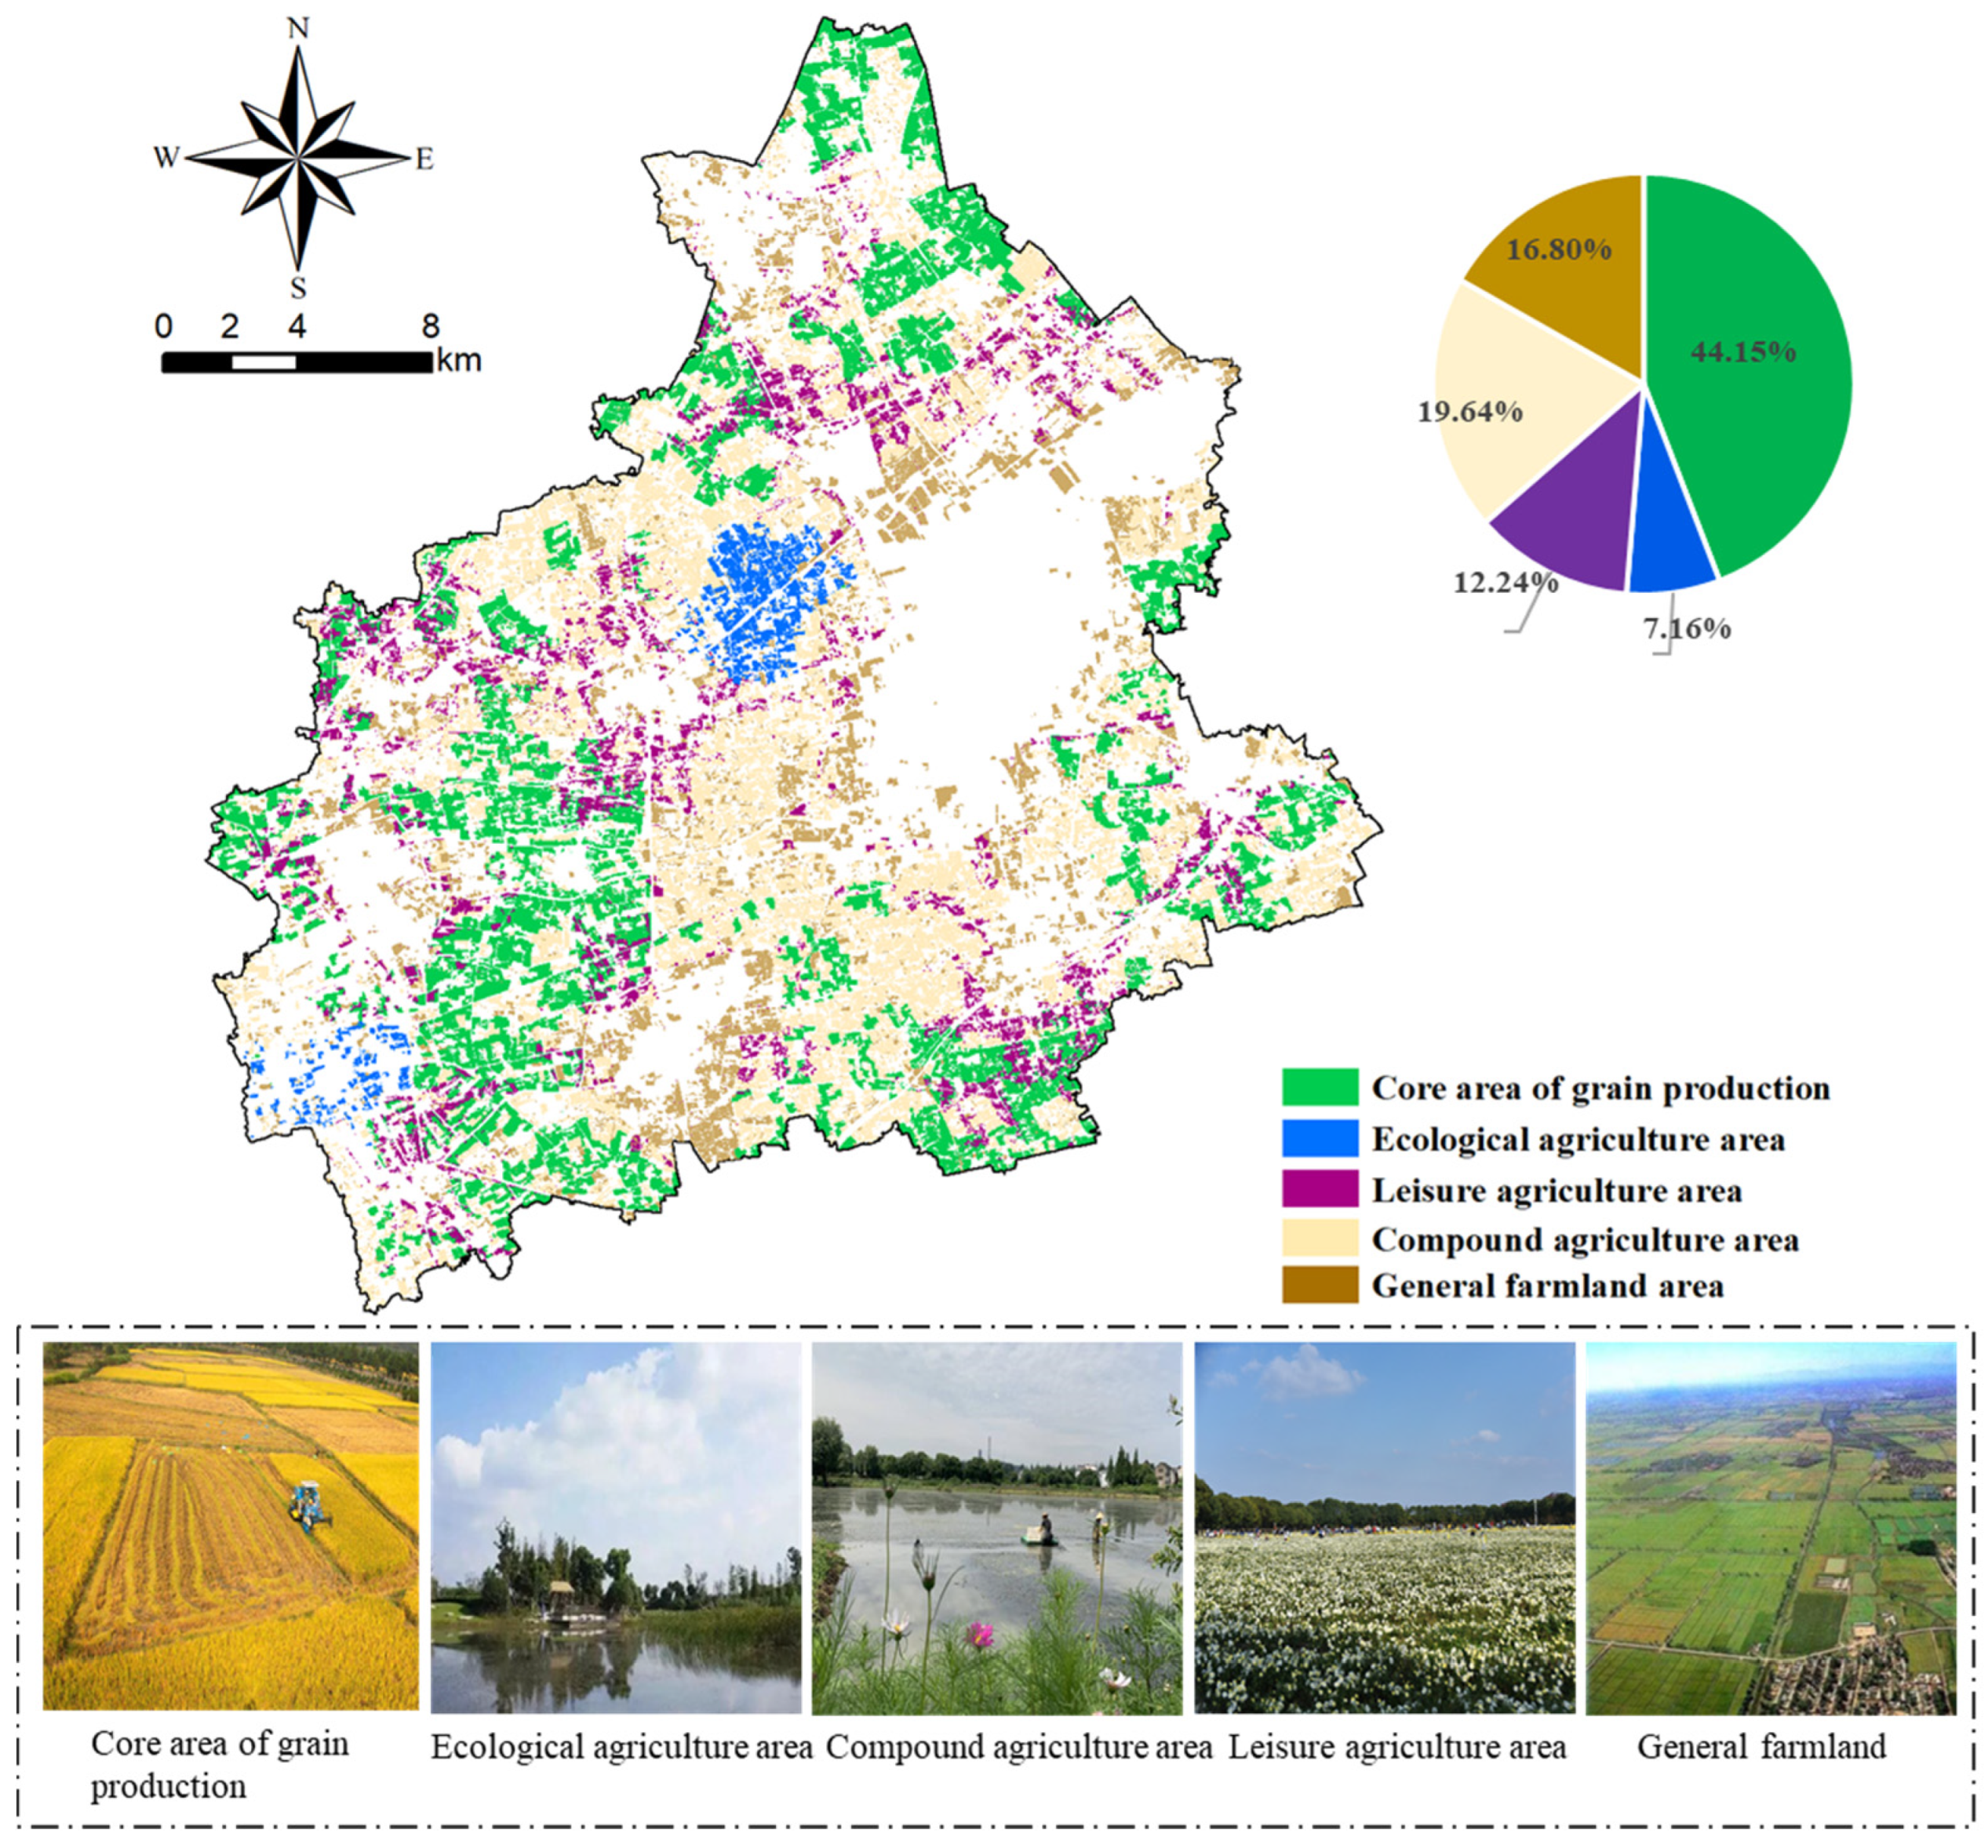
3.4. Multifunctional Comprehensive Zoning
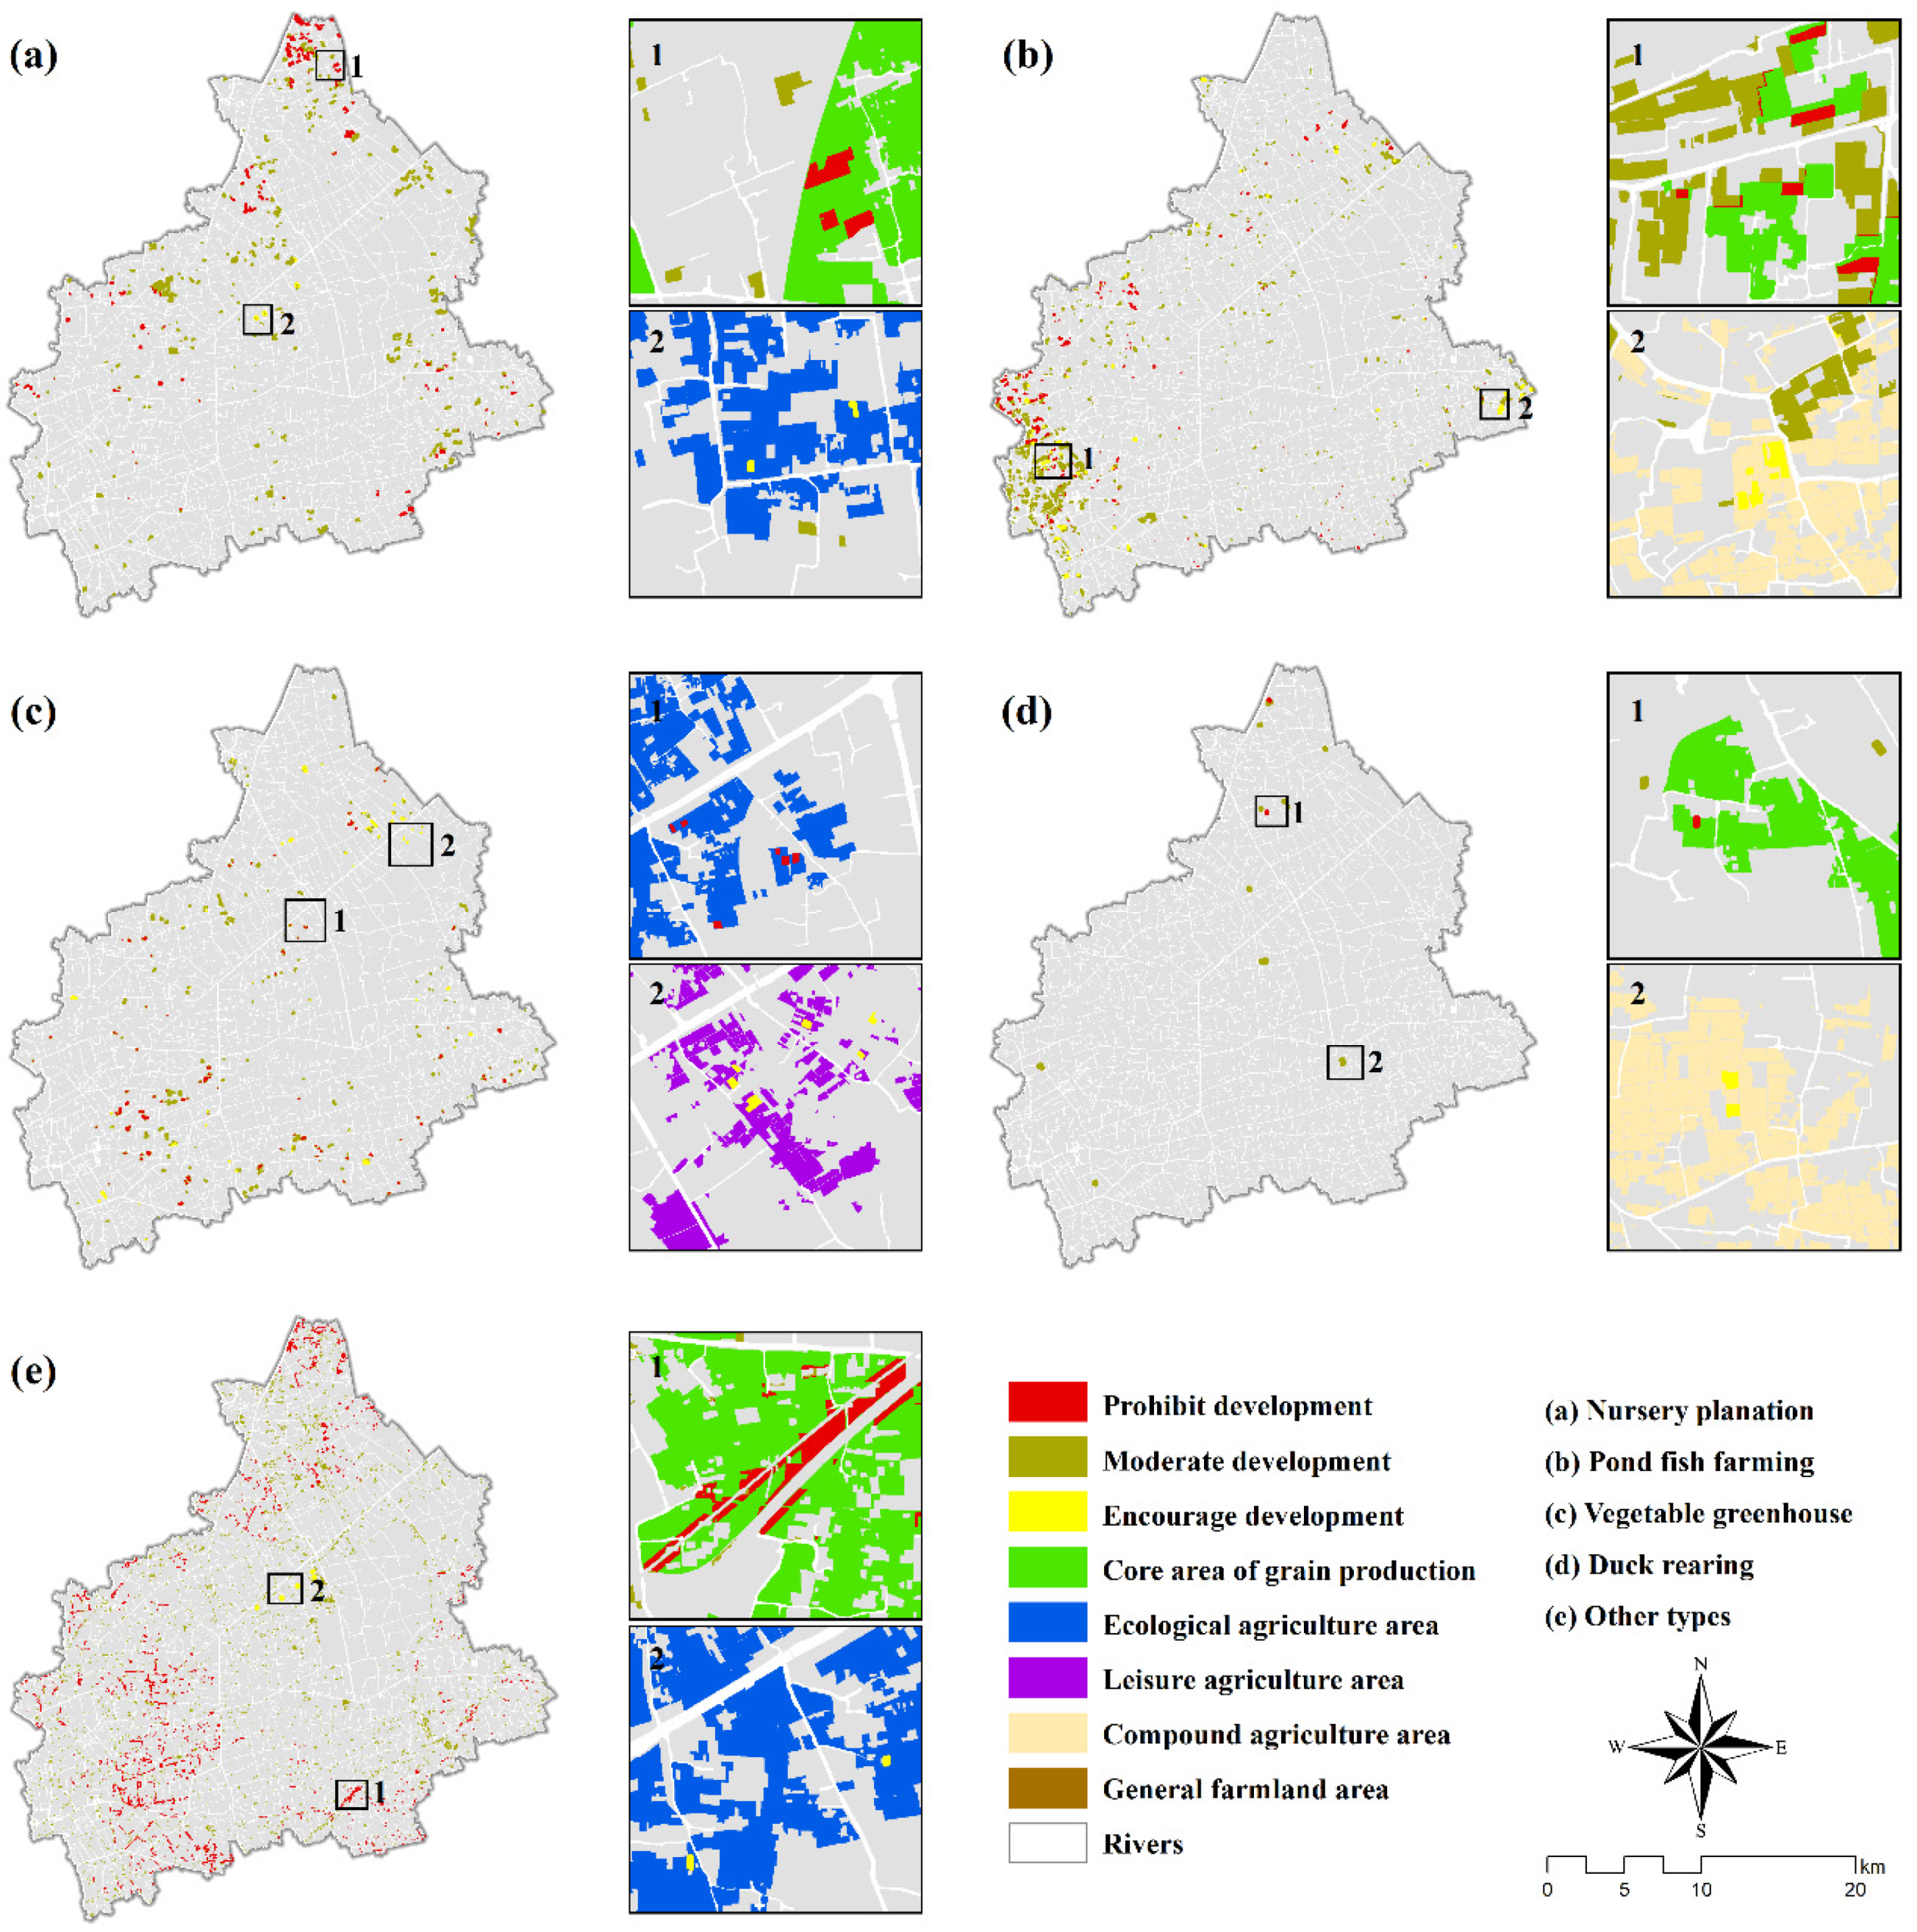
3.5. Results of Spatial Overlay Analysis
4. Discussion
4.1. Exploration of the Control and Management Measures for NGP Development
4.2. NGP Development and Rural Revitalization
4.3. Limitations and Research Prospective
5. Conclusions
Author Contributions
Funding
Institutional Review Board Statement
Informed Consent Statement
Data Availability Statement
Acknowledgments
Conflicts of Interest
References
- Kong, X. China must protect high-quality arable land. Nature 2014, 506, 7. [Google Scholar] [CrossRef]
- Chen, L.; Zhao, H.; Song, G.; Liu, Y. Optimization of cultivated land pattern for achieving cultivated land system security: A case study in Heilongjiang Province, China. Land Use Policy 2021, 108, 105589. [Google Scholar] [CrossRef]
- Liu, X.; Zhao, C.; Song, W. Review of the evolution of cultivated land protection policies in the period following China’s reform and liberalization. Land Use Policy 2017, 67, 660–669. [Google Scholar] [CrossRef]
- Zhou, B.-B.; Aggarwal, R.; Wu, J.; Lv, L. Urbanization-associated farmland loss: A macro-micro comparative study in China. Land Use Policy 2021, 101, 105228. [Google Scholar] [CrossRef]
- Su, Y.; Li, C.; Wang, K.; Deng, J.; Shahtahmassebi, A.R.; Zhang, L.; Ao, W.; Guan, T.; Pan, Y.; Gan, M. Quantifying the spatiotemporal dynamics and multi-aspect performance of non-grain production during 2000–2015 at a fine scale. Ecol. Indic. 2019, 101, 410–419. [Google Scholar] [CrossRef]
- Zhao, X.; Zheng, Y.; Huang, X.; Kwan, M.P.; Zhao, Y. The Effect of Urbanization and Farmland Transfer on the Spatial Patterns of Non-Grain Farmland in China. Sustainability 2017, 9, 1438. [Google Scholar] [CrossRef] [Green Version]
- Su, Y.; Qian, K.; Lin, L.; Wang, K.; Guan, T.; Gan, M. Identifying the driving forces of non-grain production expansion in rural China and its implications for policies on cultivated land protection. Land Use Policy 2020, 92, 104435. [Google Scholar] [CrossRef]
- Su, Y.; He, S.; Wang, K.; Shahtahmassebi, A.R.; Zhang, L.; Zhang, J.; Zhang, M.; Gan, M. Quantifying the sustainability of three types of agricultural production in China: An emergy analysis with the integration of environmental pollution. J. Clean. Prod. 2020, 252, 119650. [Google Scholar] [CrossRef]
- Yang, Q.; Zhang, D. The influence of agricultural industrial policy on non-grain production of cultivated land: A case study of the “one village, one product” strategy implemented in Guanzhong Plain of China. Land Use Policy 2021, 108, 105579. [Google Scholar] [CrossRef]
- Liu, Y.; Li, Y. Revitalize the world’s countryside. Nature 2017, 548, 275–277. [Google Scholar] [CrossRef]
- Chen, M.Q.; Xiao, H.L.; He, W.J.; Den, A.Z.; Zhou, B.J. An empirical study on factors affecting the households’ behavior in cultivated land transfer. J. Nat. Resour. 2008, 23, 369–374. [Google Scholar]
- Zhou, Y.; Song, Y. Causes and solving measures of non-food during the process of farmland circulation-From the perspective of national food security. J. Guangdong Agric. Sci. 2016, 1, 189–192. [Google Scholar]
- Su, B.; Li, Y.; Li, L.; Wang, Y. How does nonfarm employment stability influence farmers’ farmland transfer decisions? Implications for China’s Land Use Policy. Land Use Policy 2018, 74, 66–72. [Google Scholar] [CrossRef]
- Li, Y.; Li, Y.; Westlund, H.; Liu, Y. Urban–rural transformation in relation to cultivated land conversion in China: Implications for optimizing land use and balanced regional development. Land Use Policy 2015, 47, 218–224. [Google Scholar] [CrossRef]
- He, S.; Su, Y.; Shahtahmassebi, A.R.; Huang, L.; Zhou, M.; Gan, M.; Deng, J.; Zhao, G.; Wang, K. Assessing and mapping cultural ecosystem services supply, demand and flow of farmlands in the Hangzhou metropolitan area, China. Sci. Total Environ. 2019, 692, 756–768. [Google Scholar] [CrossRef] [PubMed]
- Zhu, Q.; Hu, W.; Zhao, Z. Dynamic analysis on spatial-temporal pattern of trade-offs and synergies of multifunctional cultivated land—Evidence from Hubei Province. Econ. Geogr. 2018, 38, 143–153. [Google Scholar]
- Zhu, C.; Dong, B.; Li, S.; Lin, Y.; Shahtahmassebi, A.; You, S.; Zhang, J.; Gan, M.; Yang, L.; Wang, K. Identifying the trade-offs and synergies among land use functions and their influencing factors from a geospatial perspective: A case study in Hangzhou, China. J. Clean. Prod. 2021, 314, 128026. [Google Scholar] [CrossRef]
- Yu, F.; Hu, Y.; Liu, Z.; Li, B.; Wang, L. The coordination and evolution of farmland multifunctionality based on a mechanical model: A case study of the Pearl River Delta. J. Agric. Resour. Environ. 2019, 36, 728–737. [Google Scholar]
- Jiang, G.; Wang, M.; Qu, Y.; Zhou, D.; Ma, W. Towards cultivated land multifunction assessment in China: Applying the “influencing factors-functions-products-demands” integrated framework. Land Use Policy 2020, 99, 104982. [Google Scholar] [CrossRef]
- Cheng, Q.; Jiang, P.; Cai, L.; Shan, J.; Zhang, Y.; Wang, L.; Li, M.; Li, F.; Zhu, A.; Chen, D. Delineation of a permanent basic farmland protection area around a city centre: Case study of Changzhou City, China. Land Use Policy 2017, 60, 73–89. [Google Scholar]
- Yang, X.; Sun, W.; Li, P.; Mu, X.; Gao, P.; Zhao, G. Integrating agricultural land, water yield and soil conservation trade-offs into spatial land use planning. Ecol. Indic. 2019, 104, 219–228. [Google Scholar] [CrossRef]
- Zheng, Q.; Yang, X.; Wang, K.; Huang, L.; Shahtahmassebi, A.R.; Gan, M.; Weston, M.V. Delimiting Urban Growth Boundary through Combining Land Suitability Evaluation and Cellular Automata. Sustainability 2017, 9, 2213. [Google Scholar] [CrossRef] [Green Version]
- Su, S.; Wan, C.; Li, J.; Jin, X.; Pi, J.; Zhang, Q.; Weng, M. Economic benefit and ecological cost of enlarging tea cultivation in subtropical China: Characterizing the trade-off for policy implications. Land Use Policy 2017, 66, 183–195. [Google Scholar] [CrossRef]
- Tang, F.; Fu, M.; Wang, L.; Zhang, P. Land-use change in Changli County, China: Predicting its spatio-temporal evolution in habitat quality. Ecol. Indic. 2020, 117, 106719. [Google Scholar] [CrossRef]
- Caro, C.; Marques, J.C.; Cunha, P.P.; Teixeira, Z. Ecosystem services as a resilience descriptor in habitat risk assessment using the InVEST model. Ecol. Indic. 2020, 115, 106426. [Google Scholar] [CrossRef]
- Li, M.; Liang, D.; Xia, J.; Song, J.; Cheng, D.; Wu, J.; Cao, Y.; Sun, H.; Li, Q. Evaluation of water conservation function of Danjiang River Basin in Qinling Mountains, China based on InVEST model. J. Environ. Manag. 2021, 286, 112212. [Google Scholar] [CrossRef]
- Xu, X.; Yang, G.; Tan, Y. Identifying ecological red lines in China’s Yangtze River Economic Belt: A regional approach. Ecol. Indic. 2019, 96, 635–646. [Google Scholar] [CrossRef]
- Tang, X.; Chen, B.; Lu, Q.; Han, F. The ecological location correction of ecosystem service value: A case study of Beijing City. Acta Ecol. Sin. 2010, 30, 3526–3535. [Google Scholar]
- Xu, W.; Jin, X.; Liu, J.; Zhou, Y. Analysis of influencing factors of cultivated land fragmentation based on hierarchical linear model: A case study of Jiangsu Province, China. Land Use Policy 2021, 101, 105119. [Google Scholar] [CrossRef]
- Riitters, K.H.; Vogt, P.; Soille, P.; Kozak, J.; Estreguil, C. Neutral model analysis of landscape patterns from mathematical morphology. Landsc. Ecol. 2007, 22, 1033–1043. [Google Scholar] [CrossRef]
- Cao, Y.; Li, G.; Tian, Y.; Fang, X.; Li, Y.; Tan, Y. Linking ecosystem services trade-offs, bundles and hotspot identification with cropland management in the coastal Hangzhou Bay area of China. Land Use Policy 2020, 97, 104689. [Google Scholar] [CrossRef]
- Liu, K.; Yin, L.; Lu, F.; Mou, N. Visualizing and exploring POI configurations of urban regions on POI-type semantic space. Cities 2020, 99, 102610. [Google Scholar] [CrossRef]
- Schirpke, U.; Meisch, C.; Marsoner, T.; Tappeiner, U. Revealing spatial and temporal patterns of outdoor recreation in the European Alps and their surroundings. Ecosyst. Serv. 2018, 31, 336–350. [Google Scholar] [CrossRef]
- Clemente, P.; Calvache, M.; Antunes, P.; Santos, R.; Cerdeira, J.O.; Martins, M.J. Combining social media photographs and species distribution models to map cultural ecosystem services: The case of a Natural Park in Portugal. Ecol. Indic. 2019, 96, 59–68. [Google Scholar] [CrossRef]
- Saura, S.; Torné, J. Conefor Sensinode 2.2: A software package for quantifying the importance of habitat patches for landscape connectivity. Environ. Model. Softw. 2009, 24, 135–139. [Google Scholar] [CrossRef]
- Kong, X. Problems, causes and countermeasures of non-grain production within cultivated Land. China Land 2020, 11, 17–19. [Google Scholar]
- Li, S.; Zhao, X.; Pu, J.; Miao, P.; Wang, Q.; Tan, K. Optimize and control territorial spatial functional areas to improve the ecological stability and total environment in karst areas of Southwest China. Land Use Policy 2021, 100, 104940. [Google Scholar] [CrossRef]
- Cui, Z.; Zhang, H.; Chen, X.; Zhang, C.; Ma, W.; Huang, C.; Zhang, W.; Mi, G.; Miao, Y.; Li, X.; et al. Pursuing sustainable productivity with millions of smallholder farmers. Nature 2018, 555, 363–366. [Google Scholar] [CrossRef]
- Zhong, T.; Mitchell, B.; Scott, S.; Huang, X.; Li, Y.; Lu, X. Growing centralization in China’s farmland protection policy in response to policy failure and related upward-extending unwillingness to protect farmland since 1978. Environ. Plan. C 2017, 35, 1075–1097. [Google Scholar] [CrossRef]
- Yang, Z.; Cai, J.; Sliuzas, R. Agro-tourism enterprises as a form of multi-functional urban agriculture for peri-urban development in China. Habitat Int. 2010, 34, 374–385. [Google Scholar] [CrossRef]
- Zhang, L.; Song, B.; Chen, B. Emergy-based analysis of four farming systems: Insight into agricultural diversification in rural China. J. Clean. Prod. 2012, 28, 33–44. [Google Scholar] [CrossRef]
- Patrizi, N.; Niccolucci, V.; Castellini, C.; Pulselli, F.M.; Bastianoni, S. Sustainability of agro-livestock integration: Implications and results of Emergy evaluation. Sci. Total Environ. 2018, 622, 1543–1552. [Google Scholar] [CrossRef]
- Liu, Z.; Liu, C. The Post-productivist Countryside: A Theoretical Perspective of Rural Revitalization. China Rural. Surv. 2018, 5, 2–13. [Google Scholar]
- Huang, Y.; Hui, E.; Zhou, J.; Lang, W.; Li, X. Rural Revitalization in China: Land-Use Optimization through the Practice of Place-making. Land Use Policy 2020, 97, 104788. [Google Scholar] [CrossRef]
- Spocter, M. Rural gated developments as a contributor to post-productivism in the Western Cape. South Afr. Geogr. J. 2013, 95, 165–186. [Google Scholar] [CrossRef]
- Pittelkow, C.M.; Liang, X.; Linquist, B.A.; van Groenigen, K.J.; Lee, J.; Lundy, M.E.; van Gestel, N.; Six, J.; Venterea, R.T.; van Kessel, C. Productivity limits and potentials of the principles of conservation agriculture. Nature 2015, 517, 365–368. [Google Scholar] [CrossRef]
- Lu, Y.; Jenkins, A.; Ferrier, R.C.; Bailey, M.; Gordon, I.J.; Song, S.; Huang, J.; Jia, S.; Zhang, F.; Liu, X.; et al. Addressing China’s grand challenge of achieving food security while ensuring environmental sustainability. Sci. Adv. 2015, 1, 1400039. [Google Scholar] [CrossRef] [PubMed] [Green Version]
- Liu, J.; Jin, X.; Xu, W.; Fan, Y.; Ren, J.; Zhang, X. Spatial coupling differentiation and development zoing trade-off of land space utilization efficiency in eastern China. Land Use Policy 2019, 85, 310–327. [Google Scholar] [CrossRef]
- Fagerholm, N.; Eilola, S.; Kisanga, D.; Arki, V.; Käyhkö, N. Place-based landscape services and potential of participatory spatial planning in multifunctional rural landscapes in southern highlands, tanzania. Landsc. Ecol. 2019, 34, 1769–1787. [Google Scholar] [CrossRef] [Green Version]


| Data | Resolution | Source |
|---|---|---|
| Land use survey data | 1:10,000 | Land and Resources Bureau of Tongxiang |
| Aerial photographs | 0.5 m | Land and Resources Bureau of Tongxiang |
| Google Earth images | 0.13 m | Google Earth |
| Road network | 1:10,000 | Extracted from the land use survey data |
| Rural residential area | 1:10,000 | Extracted from the land use survey data |
| Rivers | 1:10,000 | Extracted from the land use survey data |
| Soil fertility data | 1:10,000 | Land and Resources Bureau of Tongxiang |
| Point of interest | 91 points | Open platform of the Gaode map |
| Criterion Layer (Weight) | Index Level | Weight | Combined Weight |
|---|---|---|---|
| Natural quality (0.6250) | Soil fertility (SF) | 0.5375 | 0.3359 |
| The utilization level of cultivated land (ULCL) | 0.4625 | 0.2891 | |
| Farming condition (0.3750) | The distance to river (D_r) | 0.2690 | 0.1009 |
| The distance to rural residential area (D_rra) | 0.3184 | 0.1194 | |
| The distance to rural road (D_rr) | 0.2216 | 0.0831 | |
| The distance to city road (D_cr) | 0.1910 | 0.0716 |
| Score | SF | ULCL | D_rra (km) | D_r (km) | D_rr (km) | D_cr (km) |
|---|---|---|---|---|---|---|
| 100 | 1 | 1 | ≤0.5 | ≤0.2 | ≤0.2 | ≤1 |
| 95 | 2 | |||||
| 90 | 2 | 3 | ||||
| 85 | 4 | |||||
| 80 | 3 | 5 | 0.2~0.5 | 1~1.5 | ||
| 75 | 6 | 0.5~1 | 0.2~0.5 | |||
| 70 | 4 | 7 | ||||
| 65 | 8 | |||||
| 60 | 5 | 9 | 0.5~1 | 1.5~2 | ||
| 55 | 10 | |||||
| 50 | 6 | 11 | 1~1.5 | 0.5~1 | ||
| 45 | ||||||
| 40 | 7 | 12 | ||||
| 35 | 1~1.5 | 2~3 | ||||
| 30 | 8 | 13 | ||||
| 25 | ||||||
| 20 | >1.5 | >1 | ||||
| 15 | 9 | 14 | ||||
| 10 | >1.5 | >3 | ||||
| 5 | 10 | 15 |
| Type Code | Habitat Types | Habitat Suitability | Urban Land | Rural Residential Area | Traffic Land | Other Construction Land |
|---|---|---|---|---|---|---|
| 1 | Paddy filed | 0.9 | 0.6 | 0.5 | 0.2 | 0.3 |
| 2 | Dry land | 0.8 | 0.8 | 0.6 | 0.3 | 0.5 |
| 3 | Uncultivated area | 0 | 0 | 0 | 0 | 0 |
| Threat Source | Maximum Impact Distance (km) | Weight | Linear Correlation of Decline |
|---|---|---|---|
| Urban land | 1.6 | 0.9 | exponent |
| Rural residential area | 1 | 0.8 | exponent |
| Other construction land | 0.5 | 0.5 | exponent |
| Traffic land | 2 | 1 | linear |
| Score | Habitat Quality | Ecological Importance | Cultivated Land Subcategory | Spatial Pattern of Cultivated Land |
|---|---|---|---|---|
| 100 | ≥0.85 | Ecological red line | Paddy field | Core area |
| 90 | ||||
| 80 | Dry land | |||
| 70 | 0.80~0.85 | Marginal area | ||
| 60 | ||||
| 50 | Ecological corridor | |||
| 40 | ||||
| 30 | ≤0.80 | Island area | ||
| 20 | Other areas | |||
| 10 | ||||
| 0 | ||||
| Combined weight | 0.2217 | 0.3612 | 0.2198 | 0.1973 |
| Type | Variable | Calculation |
|---|---|---|
| Natural | Shape of cultivated land patches | Based on the perimeter and area of the farmland patches |
| Cultivated land contiguity | Conefor Inputs for ArcGIS 10.x [35]. | |
| Distance to the water | Euclidean distance [34]. | |
| Human | Distance to the town center | Euclidean distance [34]. |
| Distance to the village | ||
| Distance to the scenic spot | ||
| Travel time | Cost distance [33]. |
Publisher’s Note: MDPI stays neutral with regard to jurisdictional claims in published maps and institutional affiliations. |
© 2022 by the authors. Licensee MDPI, Basel, Switzerland. This article is an open access article distributed under the terms and conditions of the Creative Commons Attribution (CC BY) license (https://creativecommons.org/licenses/by/4.0/).
Share and Cite
Su, Y.; Su, C.; Xie, Y.; Li, T.; Li, Y.; Sun, Y. Controlling Non-Grain Production Based on Cultivated Land Multifunction Assessment. Int. J. Environ. Res. Public Health 2022, 19, 1027. https://0-doi-org.brum.beds.ac.uk/10.3390/ijerph19031027
Su Y, Su C, Xie Y, Li T, Li Y, Sun Y. Controlling Non-Grain Production Based on Cultivated Land Multifunction Assessment. International Journal of Environmental Research and Public Health. 2022; 19(3):1027. https://0-doi-org.brum.beds.ac.uk/10.3390/ijerph19031027
Chicago/Turabian StyleSu, Yue, Chong Su, Yan Xie, Tan Li, Yongjun Li, and Yuanyuan Sun. 2022. "Controlling Non-Grain Production Based on Cultivated Land Multifunction Assessment" International Journal of Environmental Research and Public Health 19, no. 3: 1027. https://0-doi-org.brum.beds.ac.uk/10.3390/ijerph19031027