
Marginal Bone Loss around Implant-Retaining Overdentures versus Implant-Supported Fixed Prostheses 12-Month Follow-Up: A Retrospective Study

 , ,
, ,
Abstract
:1. Introduction
2. Materials and Methods
2.1. Data Collection
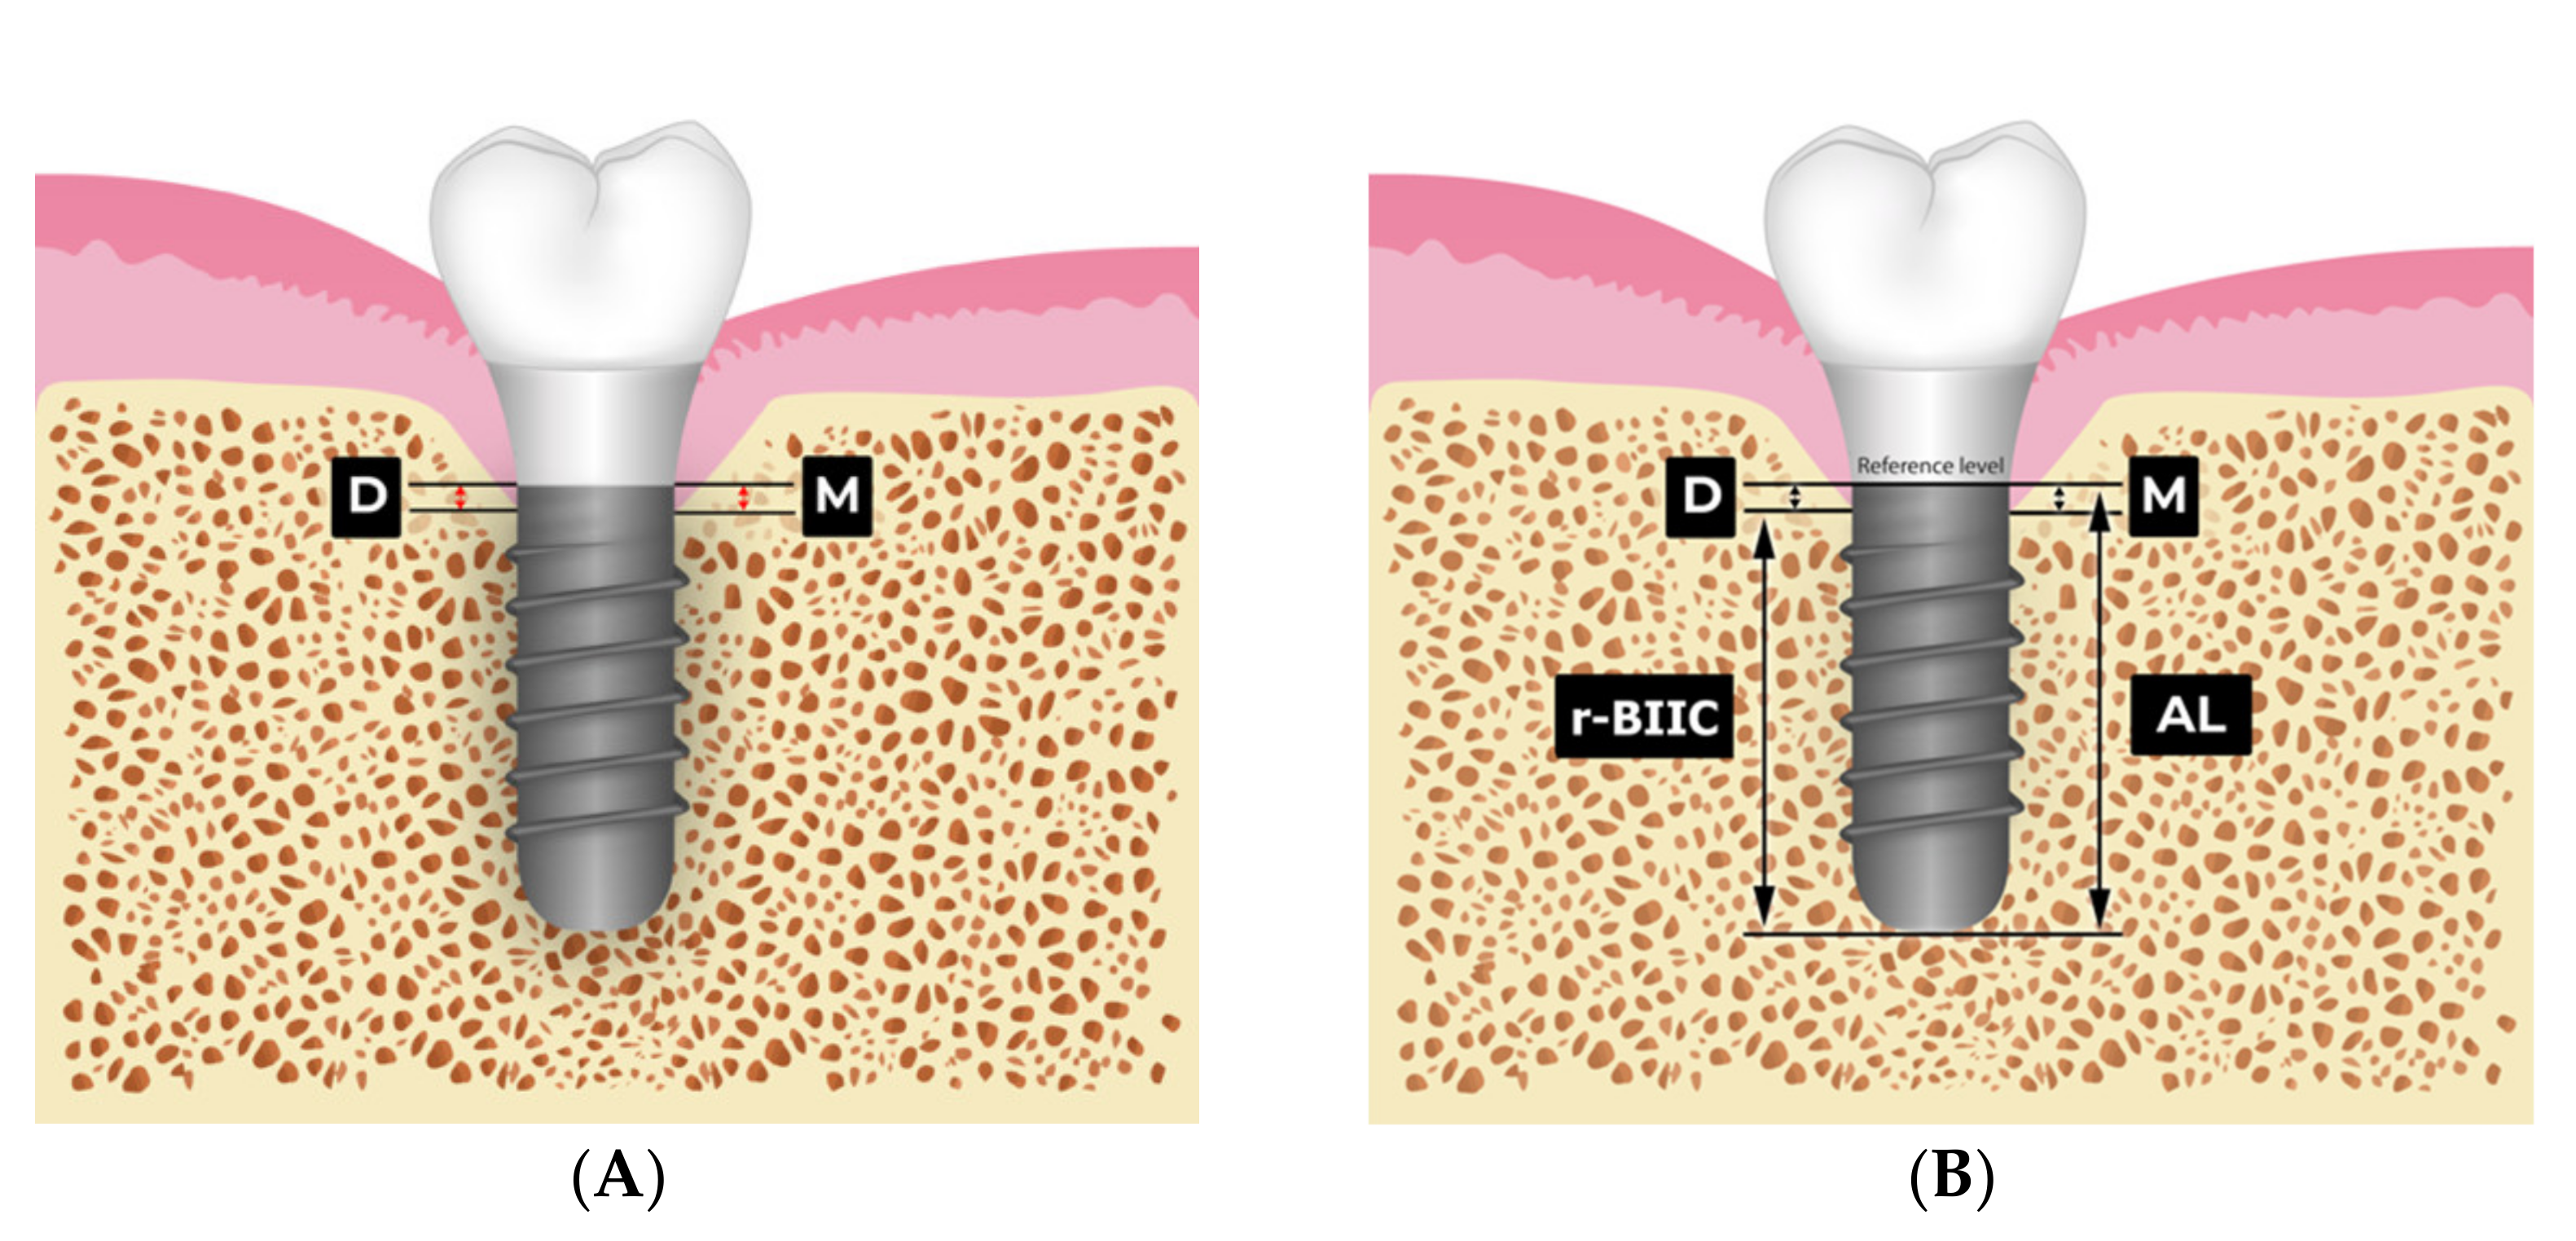
2.2. MBL and r-BIIC Measurements
2.3. Statistical Methods
3. Results
3.1. Demographic Data and Implant Distribution
3.2. Marginal Bone Loss Assessment
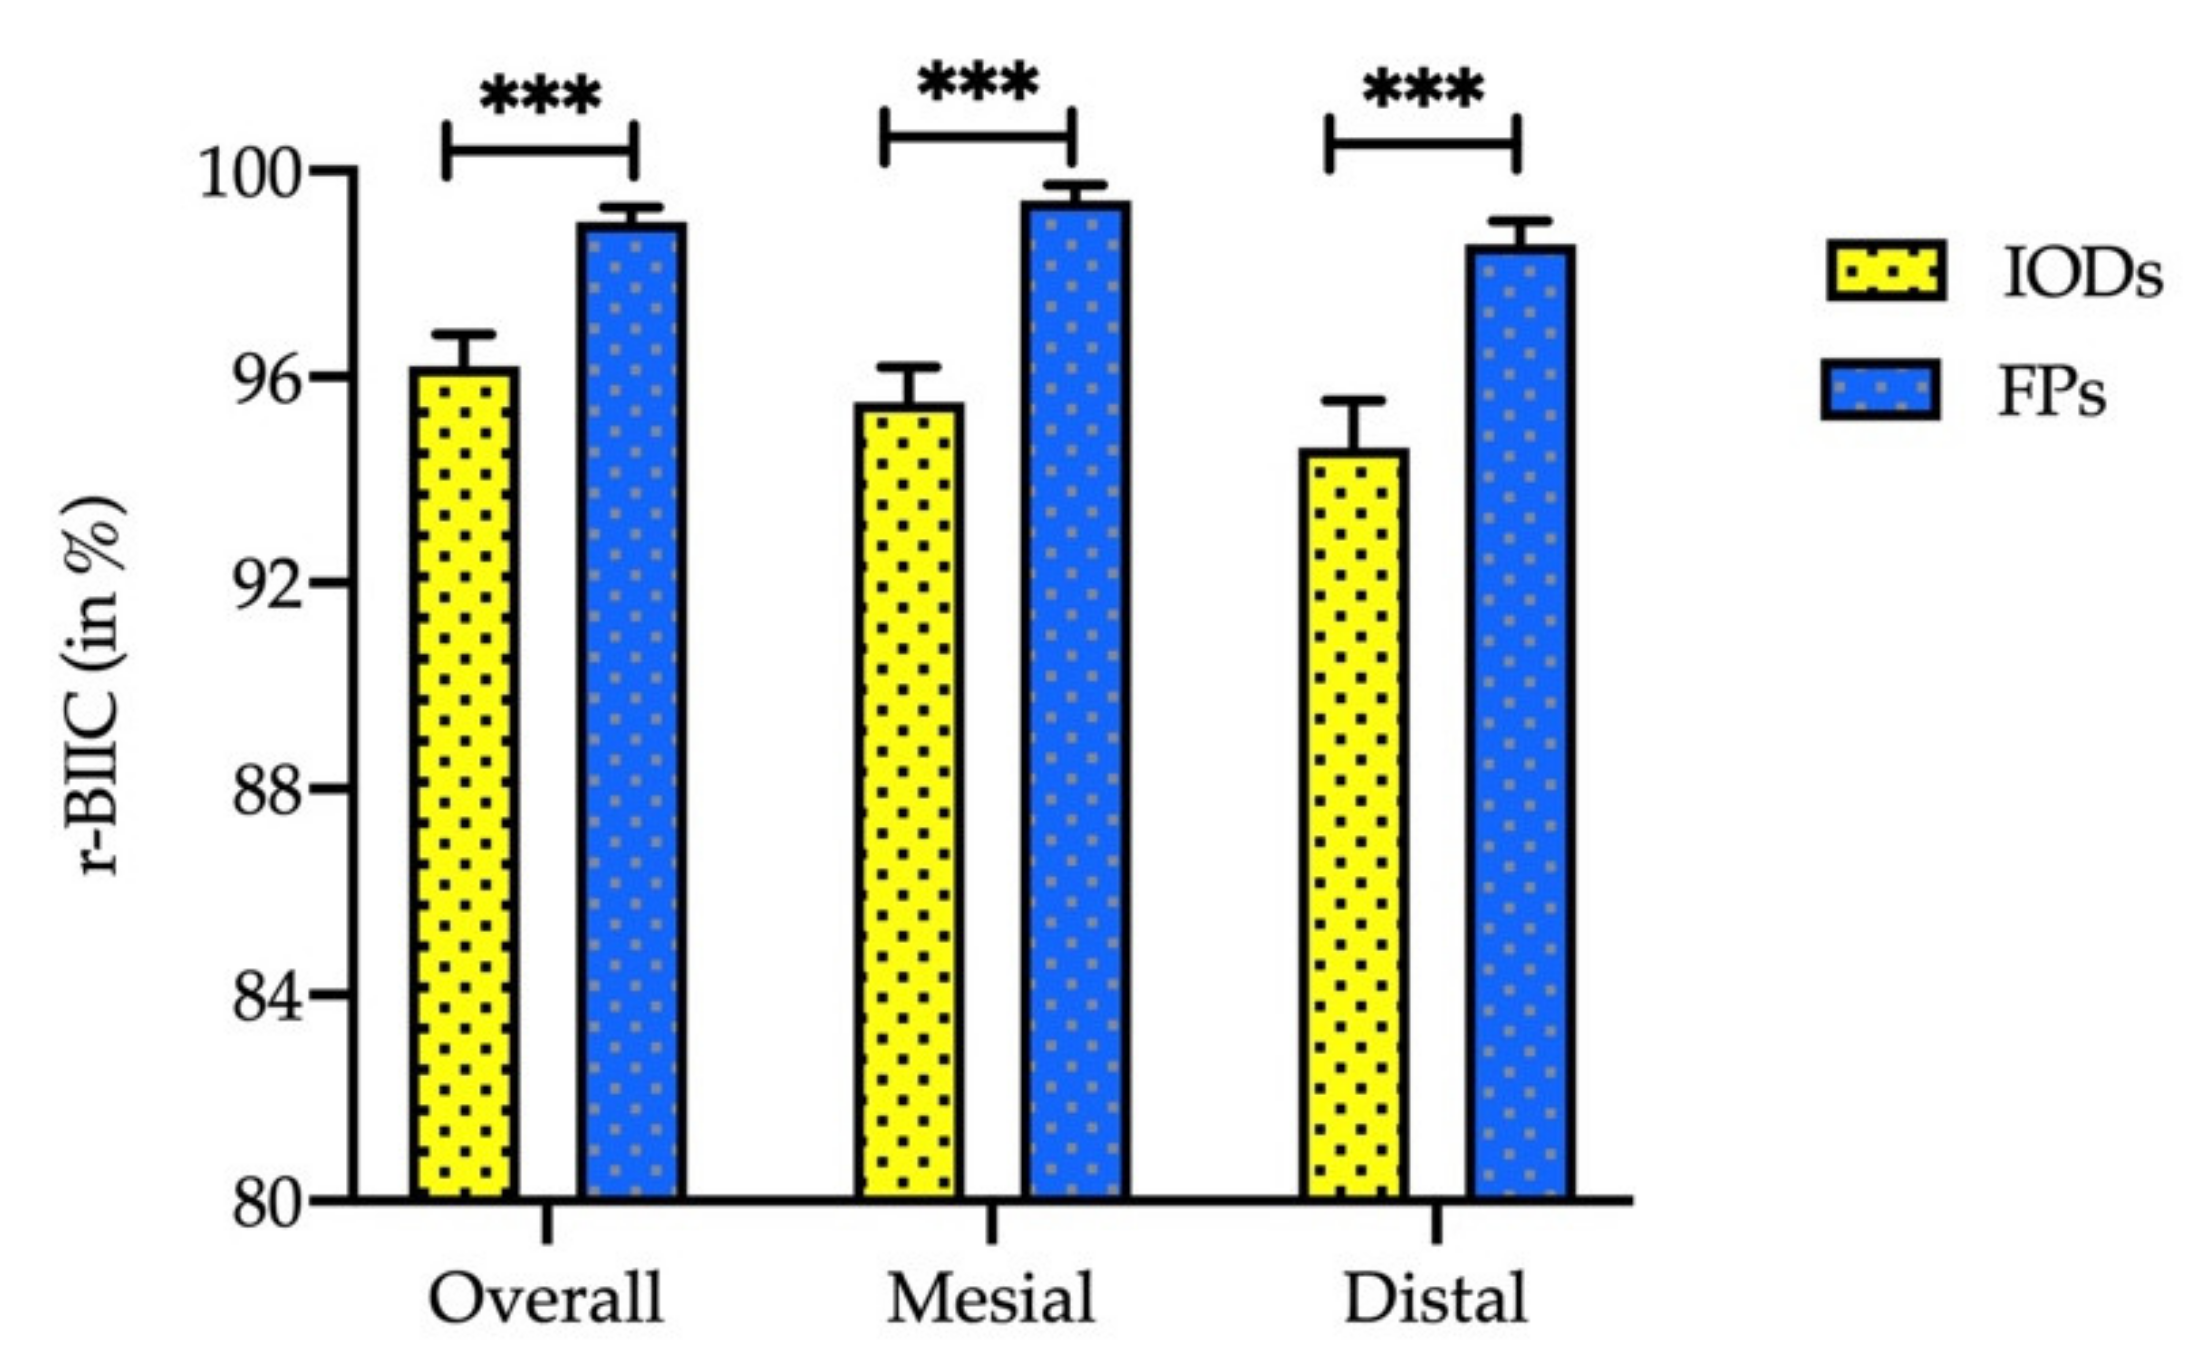
3.3. Bone-Implant Interface Contact Analysis
3.4. The Effect of Implant Parameters According to Gender, Diameter and Length of the Implant
3.5. The Effect of Implant Parameters on Osseointegration and MBL Outcomes
4. Discussion
5. Conclusions
Author Contributions
Funding
Institutional Review Board Statement
Informed Consent Statement
Data Availability Statement
Conflicts of Interest
References
- Thomason, J.M.; Kelly, S.A.; Bendkowski, A.; Ellis, J.S. Two implant retained overdentures--a review of the literature supporting the McGill and York consensus statements. J. Dent. 2012, 40, 22–34. [Google Scholar] [CrossRef]
- Gotfredsen, K.; Holm, B. Implant-supported mandibular overdentures retained with ball or bar attachments: A randomized prospective 5-year study. Int. J. Prosthodont. 2000, 13, 125–130. [Google Scholar] [PubMed]
- Yoo, S.Y.; Kim, S.K.; Heo, S.J.; Koak, J.Y.; Jeon, H.R. Clinical Performance of Implant Crown Retained Removable Partial Dentures for Mandibular Edentulism-A Retrospective Study. J. Clin. Med. 2021, 10, 2170. [Google Scholar] [CrossRef] [PubMed]
- Kang, S.H.; Kim, S.K.; Heo, S.J.; Koak, J.Y. Survival rate and clinical evaluation of the implants in implant assisted removable partial dentures: Surveyed crown and overdenture. J. Adv. Prosthodont. 2020, 12, 239–249. [Google Scholar] [CrossRef] [PubMed]
- Selim, K.; Ali, S.; Reda, A. Implant Supported Fixed Restorations versus Implant Supported Removable Overdentures: A Systematic Review. Open Access Maced. J. Med. Sci. 2016, 4, 726–732. [Google Scholar] [CrossRef] [Green Version]
- Segal, P.; Makhoul, A.; Eger, M.; Lucchina, A.G.; Winocur, E.; Mijiritsky, E. Preliminary Study to Evaluate Marginal Bone Loss in Cases of 2- and 3-Implant-Supported Fixed Partial Prostheses of the Posterior Mandible. J. Craniofac. Surg. 2019, 30, 1068–1072. [Google Scholar] [CrossRef]
- Firme, C.T.; Vettore, M.V.; Melo, M.; Vidigal, G.M., Jr. Peri-implant bone loss around single and multiple prostheses: Systematic review and meta-analysis. Int. J. Oral Maxillofac. Implant. 2014, 29, 79–87. [Google Scholar] [CrossRef] [Green Version]
- De Brandão, M.L.; Vettore, M.V.; Vidigal Júnior, G.M. Peri-implant bone loss in cement- and screw-retained prostheses: Systematic review and meta-analysis. J. Clin. Periodontol. 2013, 40, 287–295. [Google Scholar] [CrossRef]
- Zimmermann, J.; Sommer, M.; Grize, L.; Stubinger, S. Marginal bone loss 1 year after implantation: A systematic review for fixed and removable restorations. Clin. Cosmet. Investig. Dent. 2019, 11, 195–218. [Google Scholar] [CrossRef]
- Lian, Z.; Guan, H.; Ivanovski, S.; Loo, Y.-C.; Johnson, N.W.; Zhang, H. Effect of bone to implant contact percentage on bone remodelling surrounding a dental implant. Int. J. Oral Maxillofac. Surg. 2010, 39, 690–698. [Google Scholar] [CrossRef] [Green Version]
- Papavasiliou, G.; Kamposiora, P.; Bayne, S.C.; Felton, D.A. 3D-FEA of osseointegration percentages and patterns on implant-bone interfacial stresses. J. Dent. 1997, 25, 485–491. [Google Scholar] [CrossRef]
- Buser, D.; Mericske-Stern, R.; Pierre Bernard, J.P.; Behneke, A.; Behneke, N.; Hirt, H.P.; Belser, U.C.; Lang, N.P. Long-term evaluation of non-submerged ITI implants. Part 1: 8-year life table analysis of a prospective multi-center study with 2359 implants. Clin. Oral Implant. Res. 1997, 8, 161–172. [Google Scholar] [CrossRef] [PubMed]
- Duan, X.-B.; Wu, T.-X.; Guo, Y.-C.; Zhou, X.-D.; Lei, Y.-L.; Xu, X.; Mo, A.-C.; Wang, Y.-Y.; Yuan, Q. Marginal bone loss around non-submerged implants is associated with salivary microbiome during bone healing. Int. J. Oral Sci. 2017, 9, 95–103. [Google Scholar] [CrossRef] [PubMed] [Green Version]
- Albrektsson, T.; Zarb, G.; Worthington, P.; Eriksson, A.R. The long-term efficacy of currently used dental implants: A review and proposed criteria of success. Int. J. Oral Maxillofac. Implant. 1986, 1, 11–25. [Google Scholar]
- Alhammadi, S.H.; Burnside, G.; Milosevic, A. Clinical outcomes of single implant supported crowns versus 3-unit implant-supported fixed dental prostheses in Dubai Health Authority: A retrospective study. BMC Oral Health 2021, 21, 171. [Google Scholar] [CrossRef] [PubMed]
- Saravi, B.E.; Putz, M.; Patzelt, S.; Alkalak, A.; Uelkuemen, S.; Boeker, M. Marginal bone loss around oral implants supporting fixed versus removable prostheses: A systematic review. Int. J. Implant. Dent. 2020, 6, 20. [Google Scholar] [CrossRef]
- Chang, H.-S.; Hsieh, Y.-D.; Hsu, M.-L. Long-term survival rate of implant-supported overdentures with various attachment systems: A 20-year retrospective study. J. Dent. Sci. 2015, 10, 55–60. [Google Scholar] [CrossRef] [Green Version]
- Bae, E.-B.; Kim, S.-J.; Choi, J.-W.; Jeon, Y.-C.; Jeong, C.-M.; Yun, M.-J.; Lee, S.-H.; Huh, J.-B. A Clinical Retrospective Study of Distal Extension Removable Partial Denture with Implant Surveyed Bridge or Stud Type Attachment. BioMed Res. Int. 2017, 2017, 1–7. [Google Scholar] [CrossRef]
- Geckili, O.; Mumcu, E.; Bilhan, H. The Effect of Maximum Bite Force, Implant Number, and Attachment Type on Marginal Bone Loss around Implants Supporting Mandibular Overdentures: A Retrospective Study. Clin. Implant. Dent. Relat. Res. 2012, 14, e91–e97. [Google Scholar] [CrossRef]
- Strub, J.R.; Kern, M.; Türp, J.C.; Witkowski, S.; Heydecke, G.; Wolfart, S. Curriculum Prothetik Band III. Berlin. Quintessenz Verlag 2011. [Google Scholar]
- Quirynen, M.; Naert, I.; van Steenberghe, D. Fixture design and overload influence marginal bone loss and future success in the Brånemark® system. Clin. Oral Implant. Res. 1992, 3, 104–111. [Google Scholar] [CrossRef] [PubMed]
- Hameed, M.; Khan, F.; Ghafoor, R.; Azam, S. Marginal bone loss around cement and screw-retained fixed implant prosthesis. J. Clin. Exp. Dent. 2018, 10, e949. [Google Scholar] [CrossRef]
- Nissan, J.; Narobai, D.; Gross, O.; Ghelfan, O.; Chaushu, G. Long-term outcome of cemented versus screw-retained implant-supported partial restorations. Int. J. Oral Maxillofac. Implant. 2011, 26, 1102–1107. [Google Scholar]
- Lemos, C.A.A.; De Souza Batista, V.E.; Almeida, D.A.D.F.; Santiago Júnior, J.F.; Verri, F.R.; Pellizzer, E.P. Evaluation of cement-retained versus screw-retained implant-supported restorations for marginal bone loss. J. Prosthet. Dent. 2016, 115, 419–427. [Google Scholar] [CrossRef] [Green Version]
- Koller, C.D.; Pereira-Cenci, T.; Boscato, N. Parameters Associated with Marginal Bone Loss around Implant after Prosthetic Loading. Braz. Dent. J. 2016, 27, 292–297. [Google Scholar] [CrossRef] [Green Version]
- Sailer, I.; Mühlemann, S.; Zwahlen, M.; Hämmerle, C.H.F.; Schneider, D. Cemented and screw-retained implant reconstructions: A systematic review of the survival and complication rates. Clin. Oral Implant. Res. 2012, 23, 163–201. [Google Scholar] [CrossRef] [PubMed]
- Sherif, S.; Susarla, H.K.; Kapos, T.; Munoz, D.; Chang, B.M.; Wright, R.F. A Systematic Review of Screw- versus Cement-Retained Implant-Supported Fixed Restorations. J. Prosthodont. 2014, 23, 1–9. [Google Scholar] [CrossRef]
- Park, J.-C.; Ha, S.-R.; Kim, S.-M.; Kim, M.-J.; Lee, J.-B.; Lee, J.-H. A randomized clinical 1-year trial comparing two types of non-submerged dental implants. Clin. Oral Implant. Res. 2010, 21, 228–236. [Google Scholar] [CrossRef]
- Huang, T.Y.; Hsia, Y.J.; Sung, M.Y.; Wu, Y.T.; Hsu, P.C. Three-dimensional measurement of radiographic bone-implant contact lengths of zygomatic implants in zygomatic bone: A retrospective study of 66 implants in 28 patients. Int. J. Oral Maxillofac. Surg. 2021, 50, 1100–1106. [Google Scholar] [CrossRef]
- Ozgur, G.O.; Kazancioglu, H.O.; Demirtas, N.; Deger, S.; Ak, G. Risk Factors Associated With Implant Marginal Bone Loss: A Retrospective 6-Year Follow-Up Study. Implant. Dent. 2016, 25, 122–127. [Google Scholar] [CrossRef]
- Norton, M.R. Multiple single-tooth implant restorations in the posterior jaws: Maintenance of marginal bone levels with reference to the implant-abutment microgap. Int. J. Oral Maxillofac. Implant. 2006, 21, 777–784. [Google Scholar]
- Negri, M.; Galli, C.; Smerieri, A.; Macaluso, G.M.; Manfredi, E.; Ghiacci, G.; Toffoli, A.; Bonanini, M.; Lumetti, S. The Effect of Age, Gender, and Insertion Site on Marginal Bone Loss around Endosseous Implants: Results from a 3-Year Trial with Premium Implant System. BioMed Res. Int. 2014, 2014, 1–7. [Google Scholar] [CrossRef] [PubMed]


| Characteristics | Total | IOD Group | FP Group | |||
| n = 46 | n = 16 | n = 30 | ||||
| Age, mean (SEM) | 66.31 (2.54) | 48.07 (1.75) | ||||
| Gender (n, %) | ||||||
| Male | 22 | 47.8% | 10 | 62.5% | 12 | 40.0% |
| Female | 24 | 52.2% | 6 | 37.5% | 18 | 60.0% |
| Implant Parameters | n = 60 | n = 30 | n = 30 | |||
| Location (n, %) | ||||||
| Upper jaw | 18 | 30.0% | 7 | 23.3% | 11 | 36.7% |
| Lower jaw | 42 | 70.0% | 23 | 76.7% | 19 | 63.3% |
| Diameter (n, %) | ||||||
| 3.3 mm | 6 | 10.0% | 6 | 20.0% | 0 | 0.0% |
| 4.1 mm | 29 | 48.3% | 22 | 73.3% | 7 | 23.3% |
| 4.8 mm | 25 | 41.7% | 2 | 6.7% | 23 | 76.7% |
| Length (n, %) | ||||||
| 10 mm | 58 | 96.7% | 28 | 93.3% | 30 | 100.0% |
| 8 mm | 2 | 3.3% | 2 | 6.7% | 0 | 0.0% |
| Time Period | IOD Group | FP Group |
|---|---|---|
| Average | ||
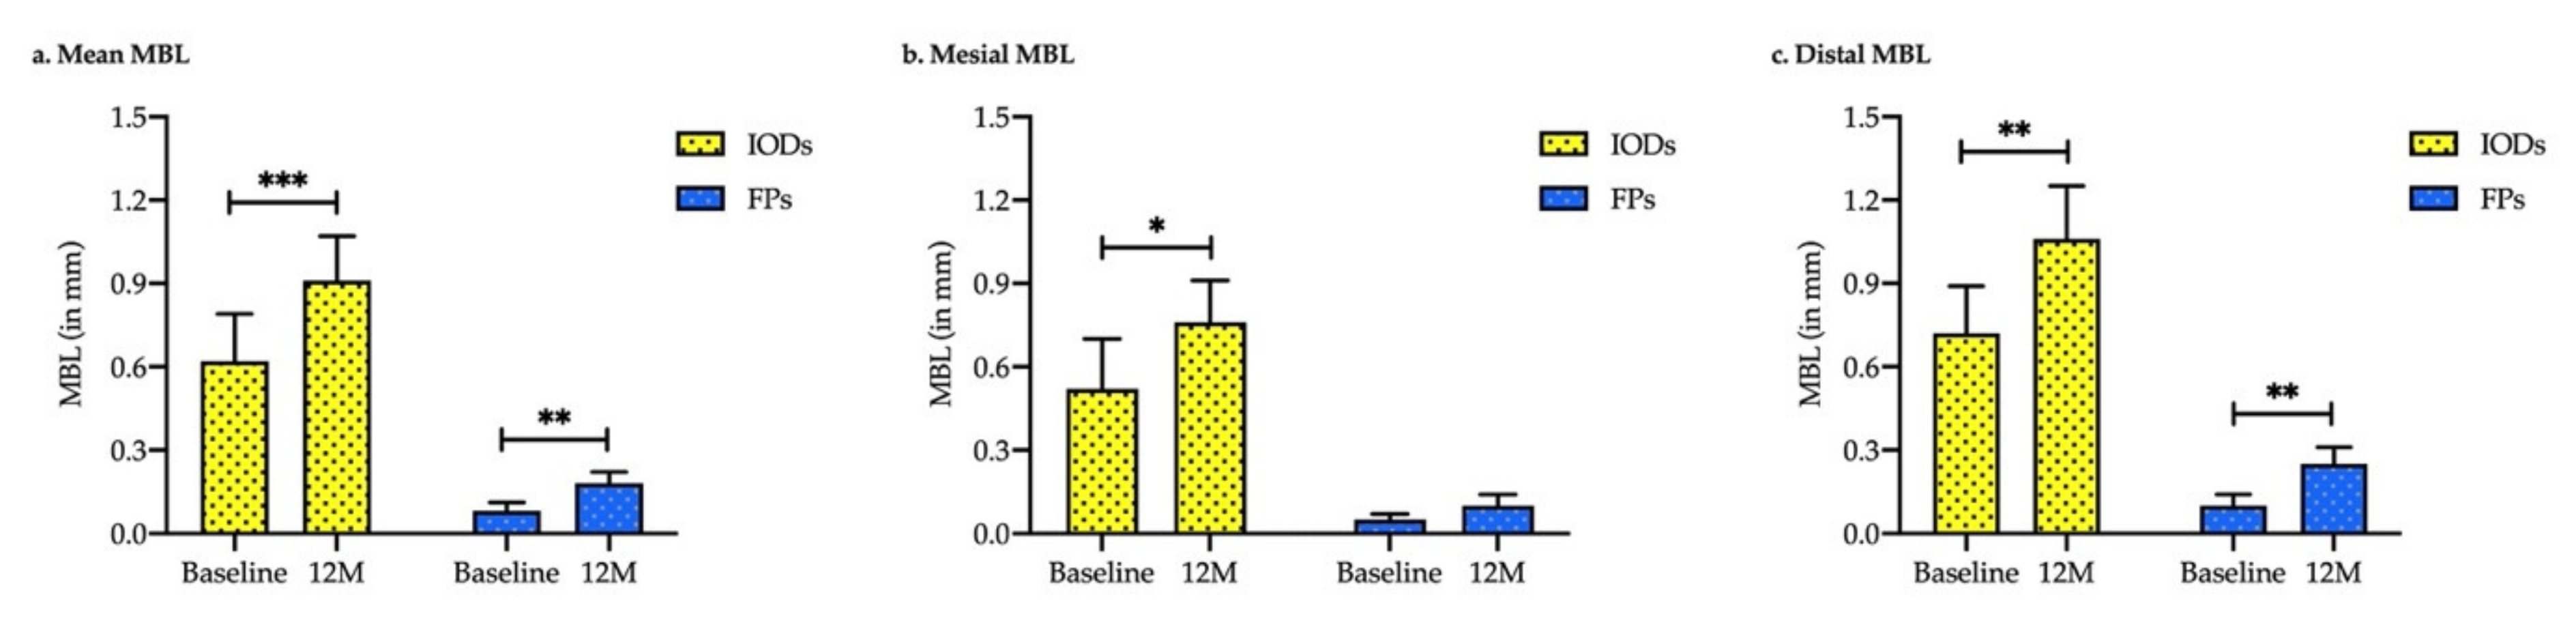
| Baseline | 0.62 ± 0.17 | 0.08 ± 0.03 |
| 12-month | 0.91 ± 0.16 | 0.18 ± 0.04 |
| p | <0.001 *** | <0.002 ** |
| Mesial site | ||
| Baseline | 0.52 ± 0.19 | 0.05 ± 0.02 |
| 12-month | 0.76 ± 0.15 | 0.10 ± 0.04 |
| p | 0.017 * | 0.061 |
| Distal site | ||
| Baseline | 0.72 ± 0.17 | 0.10 ± 0.04 |
| 12-month | 1.06 ± 0.20 | 0.25 ± 0.06 |
| p | 0.006 ** | 0.004 ** |
| Time Period | IOD Group | FP Group | p-Value |
|---|---|---|---|
| Average | |||
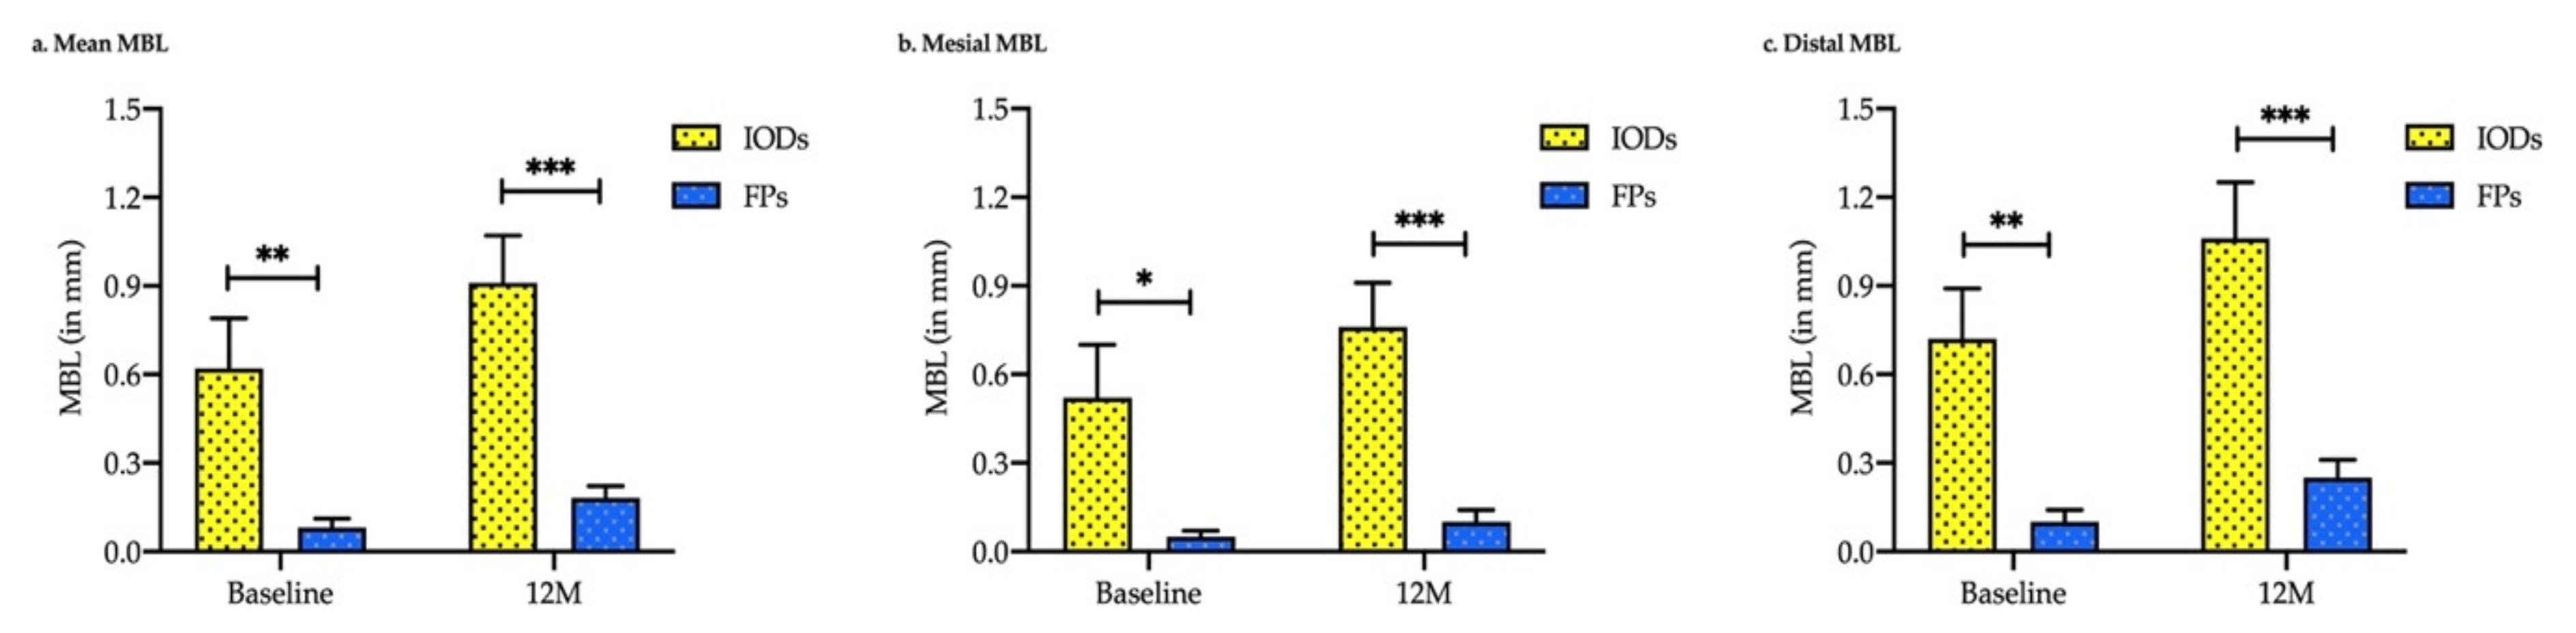
| Baseline | 0.62 ± 0.17 | 0.08 ± 0.03 | 0.003 ** |
| 12-month | 0.91 ± 0.16 | 0.18 ± 0.04 | <0.001 *** |
| Mesial site | |||
| Baseline | 0.52 ± 0.19 | 0.05 ± 0.02 | 0.016 * |
| 12-month | 0.76 ± 0.15 | 0.10 ± 0.04 | <0.001 *** |
| Distal site | |||
| Before | 0.72 ± 0.17 | 0.10 ± 0.04 | 0.001 ** |
| 12-month | 1.06 ± 0.20 | 0.25 ± 0.06 | <0.001 *** |
| Index | Gender | n | IOD Group | n | FP Group | p |
|---|---|---|---|---|---|---|
| MBL (mm) | Male | 17 | 0.91 ± 0.12 | 12 | 0.03 ± 0.02 | <0.001 *** |
| Female | 13 | 0.92 ± 0.35 | 18 | 0.28 ± 0.06 | 0.092 | |
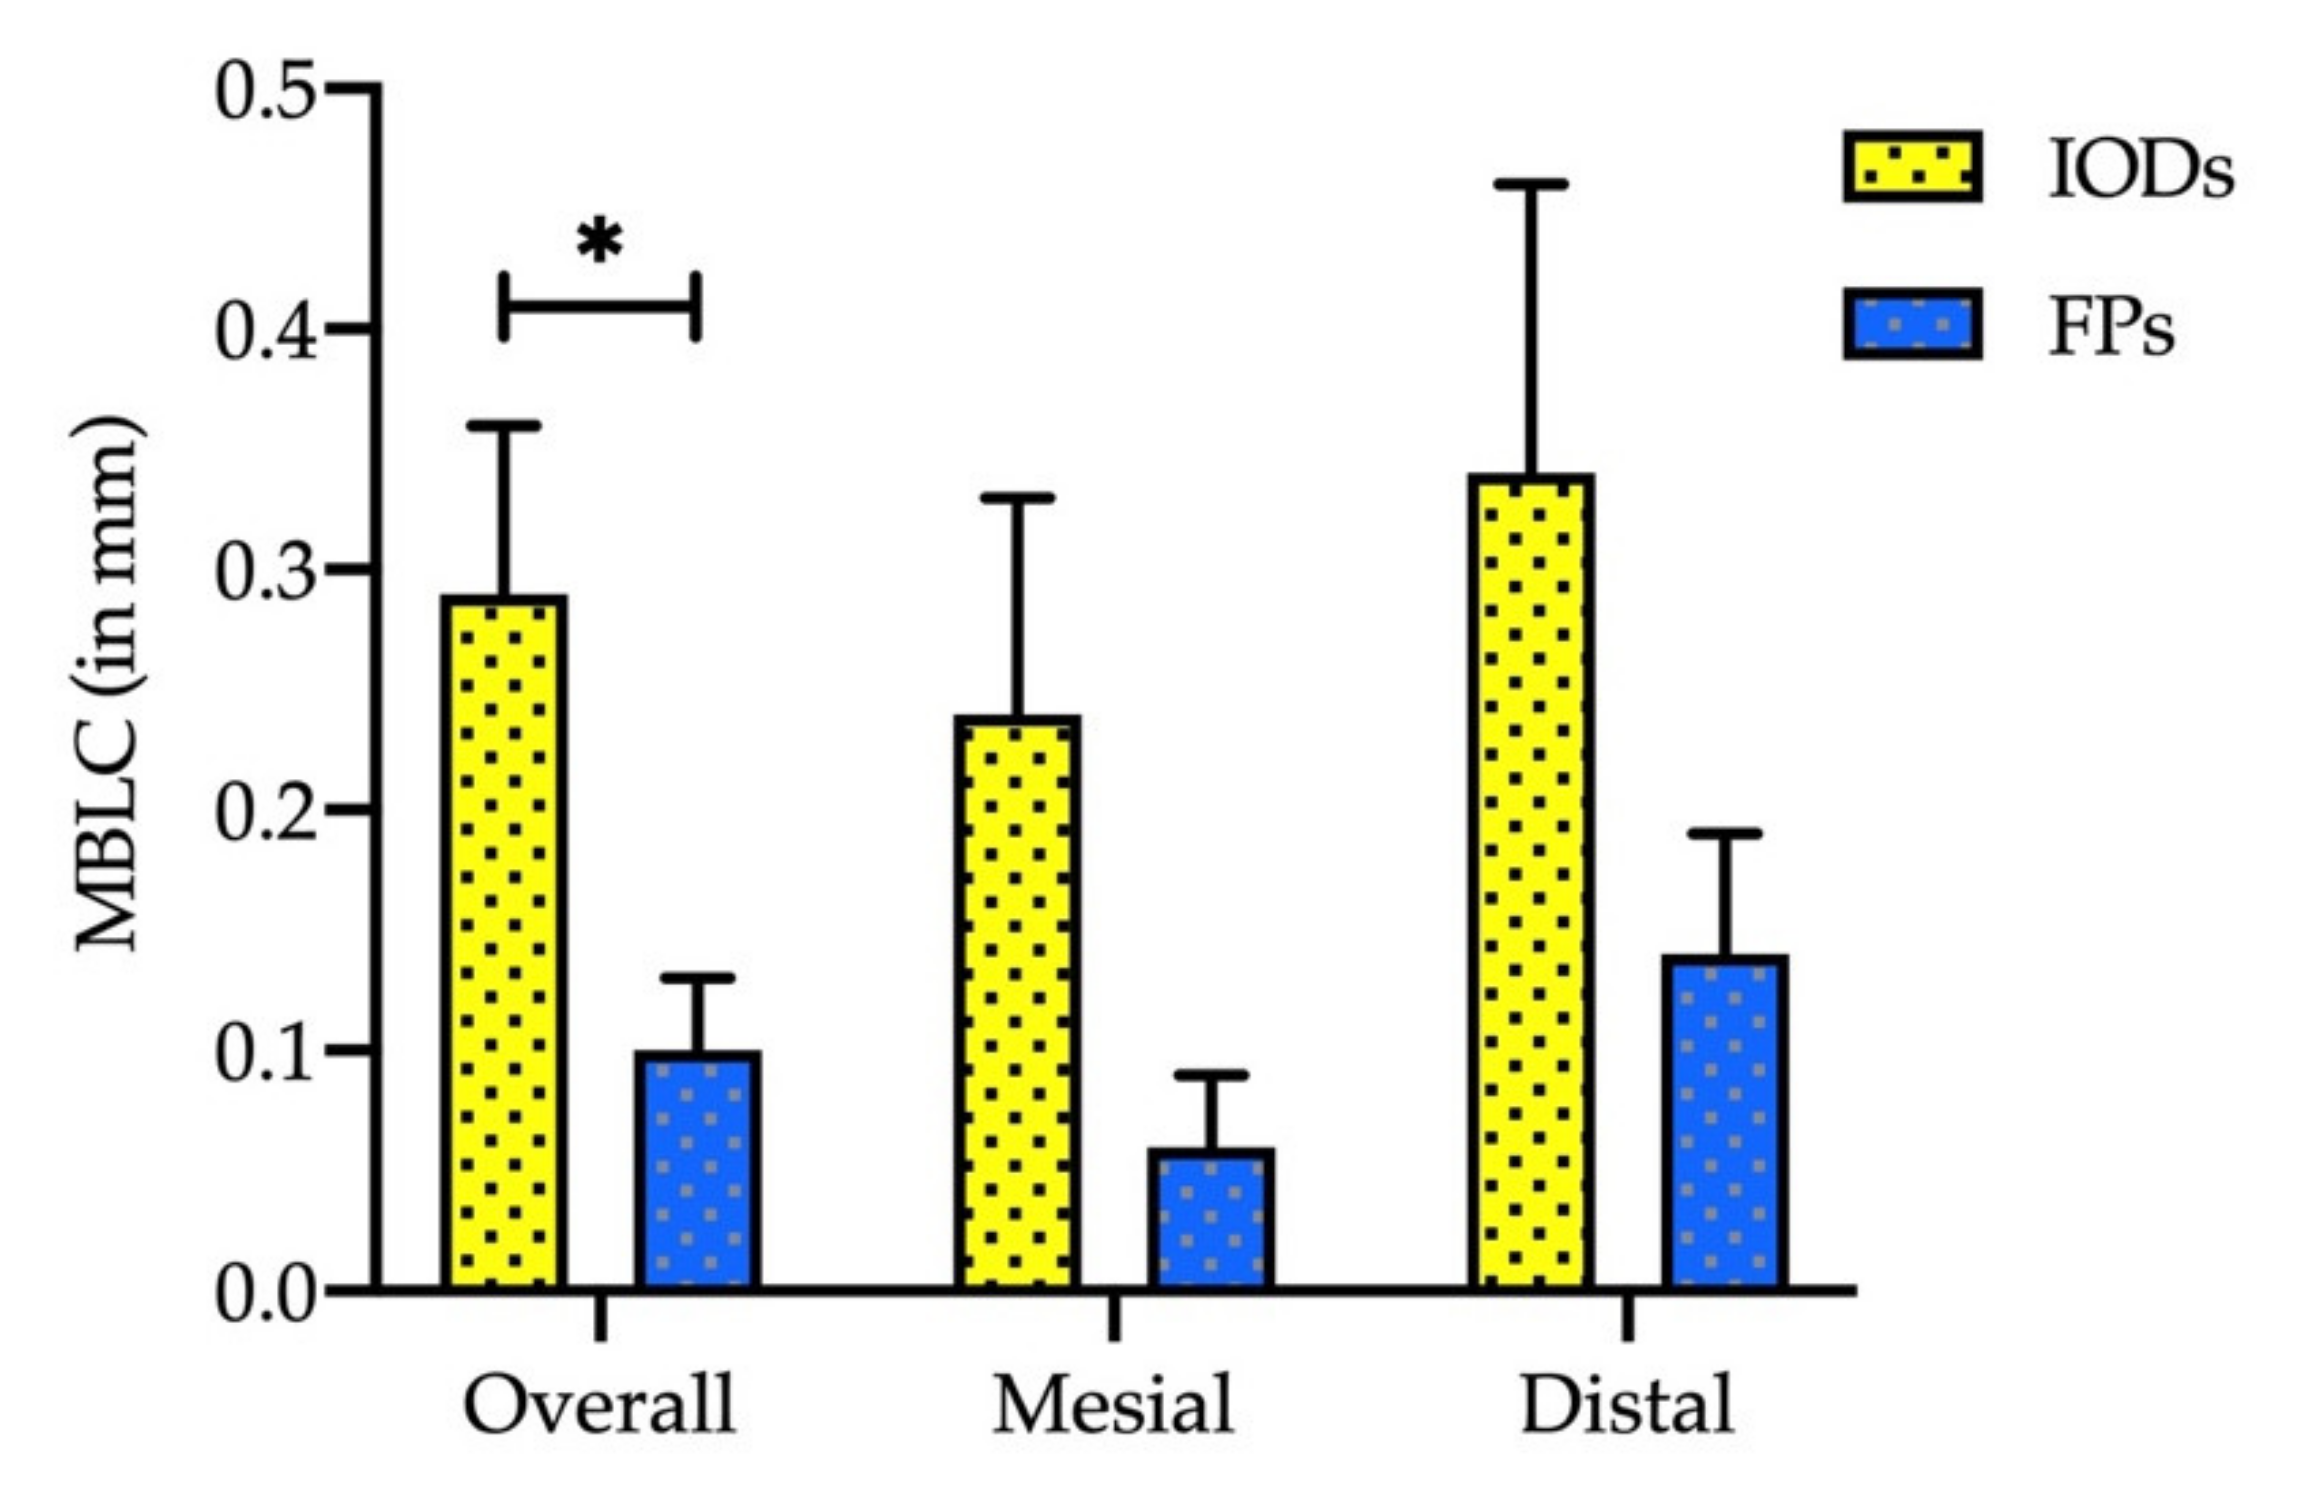
| MBLC (mm) | Male | 17 | 0.34 ± 0.11 | 12 | 0.03 ± 0.02 | 0.015 * |
| Female | 13 | 0.22 ± 0.07 | 18 | 0.15 ± 0.04 | 0.383 | |
| r-BIIC (%) | Male | 17 | 95.40 ± 0.99 | 12 | 99.75 ± 0.25 | <0.001 *** |
| Female | 13 | 97.24 ± 0.53 | 18 | 98.50 ± 0.42 | 0.077 |
| Index | Location | n | IOD Group | N | FP Group | p |
|---|---|---|---|---|---|---|
| MBL (mm) | Lower jaw | 23 | 1.16 ± 0.14 | 19 | 0.13 ± 0.04 | <0.001 *** |
| MBLC (mm) | Lower jaw | 23 | 0.28 ± 0.09 | 19 | 0.12 ± 0.04 | 0.115 |
| r-BIIC (%) | Lower jaw | 23 | 96.08 ± 0.79 | 19 | 98.79 ± 0.43 | 0.005 ** |
| Index | Length | n | IOD Group | N | FP Group | p |
|---|---|---|---|---|---|---|
| MBL (mm) | 10 mm | 28 | 0.90 ± 0.17 | 30 | 0.18 ± 0.04 | <0.001 *** |
| MBLC (mm) | 10 mm | 28 | 0.26 ± 0.07 | 30 | 0.10 ± 0.03 | 0.036 * |
| r-BIIC (%) | 10 mm | 28 | 96.50 ± 0.54 | 30 | 99.00 ± 0.29 | <0.001 *** |
| Characteristics | MBL (mm) | p | MBLC (mm) | p | r-BIIC (%) | p |
|---|---|---|---|---|---|---|
| Gender | ||||||
| Male | 0.91 ± 0.12 | 0.970 | 0.34 ± 0.11 | 0.391 | 95.40 ± 0.99 | 0.115 |
| Female | 0.92 ± 0.34 | 0.22 ± 0.07 | 97.24 ± 0.53 | |||
| Location | ||||||
| Upper jaw | 0.09 ± 0.41 | 0.042 * | 0.32 ± 0.09 | 0.797 | 96.59 ± 0.72 | 0.639 |
| Lower jaw | 1.16 ± 0.14 | 0.28 ± 0.09 | 96.08 ± 0.79 |
| Parameter | MBL (mm) | p | MBLC (mm) | p | r-BIIC (%) | p |
|---|---|---|---|---|---|---|
| Gender | ||||||
| Male | 0.03 ± 0.03 | 0.001 | 0.03 ± 0.03 | 0.018 * | 99.75 ± 0.25 | 0.018 * |
| Female | 0.28 ± 0.06 | 0.15 ± 0.04 | 98.50 ± 0.42 | |||
| Location | ||||||
| Upper jaw | 0.25 ± 0.09 | 0.293 | 0.06 ± 0.03 | 0.272 | 99.36 ± 0.27 | 0.272 |
| Lower jaw | 0.13 ± 0.04 | 0.12 ± 0.04 | 98.79 ± 0.43 | |||
| Diameter | ||||||
| 4.1 mm | 0.13 ± 0.06 | 0.483 | 0.13 ± 0.06 | 0.620 | 98.71 ± 0.64 | 0.620 |
| 4.8 mm | 0.19 ± 0.05 | 0.09 ± 0.03 | 99.09 ± 0.33 |
Publisher’s Note: MDPI stays neutral with regard to jurisdictional claims in published maps and institutional affiliations. |
© 2022 by the authors. Licensee MDPI, Basel, Switzerland. This article is an open access article distributed under the terms and conditions of the Creative Commons Attribution (CC BY) license (https://creativecommons.org/licenses/by/4.0/).
Share and Cite
Dorj, O.; Lin, C.-K.; Salamanca, E.; Pan, Y.-H.; Wu, Y.-F.; Hsu, Y.-S.; Lin, J.C.-Y.; Lin, H.-K.; Chang, W.-J. Marginal Bone Loss around Implant-Retaining Overdentures versus Implant-Supported Fixed Prostheses 12-Month Follow-Up: A Retrospective Study. Int. J. Environ. Res. Public Health 2022, 19, 1750. https://0-doi-org.brum.beds.ac.uk/10.3390/ijerph19031750
Dorj O, Lin C-K, Salamanca E, Pan Y-H, Wu Y-F, Hsu Y-S, Lin JC-Y, Lin H-K, Chang W-J. Marginal Bone Loss around Implant-Retaining Overdentures versus Implant-Supported Fixed Prostheses 12-Month Follow-Up: A Retrospective Study. International Journal of Environmental Research and Public Health. 2022; 19(3):1750. https://0-doi-org.brum.beds.ac.uk/10.3390/ijerph19031750
Chicago/Turabian StyleDorj, Odontuya, Chin-Kai Lin, Eisner Salamanca, Yu-Hwa Pan, Yi-Fan Wu, Yung-Szu Hsu, Jerry C.-Y. Lin, Hsi-Kuei Lin, and Wei-Jen Chang. 2022. "Marginal Bone Loss around Implant-Retaining Overdentures versus Implant-Supported Fixed Prostheses 12-Month Follow-Up: A Retrospective Study" International Journal of Environmental Research and Public Health 19, no. 3: 1750. https://0-doi-org.brum.beds.ac.uk/10.3390/ijerph19031750