Article

Microbial Profile of the Leachate from Mexico City’s Bordo Poniente Composting Plant: An Inoculum to Digest Organic Waste

by
Aixa Kari Gállego Bravo
1,2,
Daniel Alejandro Salcedo Serrano
1,3,
Gloria López Jiménez
4,
Khemlal Nirmalkar
5,
Selvasankar Murugesan
5,6,
Jaime García-Mena
5,
María Eugenia Gutiérrez Castillo
1 and
Luis Raúl Tovar Gálvez
1,*
1
Instituto Politécnico Nacional, Centro Interdisciplinario de Investigaciones y Estudios sobre Medio Ambiente y Desarrollo, Calle 30 de Junio de 1520 s/n, 07340 Ciudad de México, Mexico
2
Instituto Politécnico Nacional, Centro Mexicano para la Producción más Limpia, Av. Acueducto s/n, 07340 Ciudad de México, Mexico
3
Departamento de Horticultura, Universidad Autónoma Agraria Antonio Narro, Unidad Laguna, Periférico Raúl López Sánchez s/n, 27054 Torreón Coahuila, Mexico
4
Departamento de Ciencias Básicas, Instituto Politécnico Nacional, Unidad Profesional Interdisciplinaria de Biotecnología, Av. Acueducto s/n, 07340 Ciudad de México, Mexico
5
Departamento de Genética y Biología Molecular, Centro de Investigación y de Estudios Avanzados del IPN, Av. Instituto Politécnico Nacional 2508, 07360 Ciudad de México, Mexico
6
Division of Translational Medicine, Research Department, Sidra Medicine, Doha 26999, Qatar
*
Author to whom correspondence should be addressed.
Submission received: 7 May 2019 / Revised: 11 June 2019 / Accepted: 11 June 2019 / Published: 19 June 2019
(This article belongs to the Special Issue Techniques in Waste Recovery)

Abstract

:
In recent years, municipal solid waste (MSW) management has become a complex problem worldwide. Similarly, Mexico City is facing such a situation for the management and treatment of organic fraction of municipal solid waste (OFMSW). Therefore, in this work, we investigated whether leachate from the composting plant, Bordo Poniente, located in Mexico City can be used as an inoculum for the treatment of OFMSW using thermophilic anaerobic digestion (AD) with a hydraulic retention time of 30 days. We analyzed the physicochemical properties of the leachate and performed a biochemical methane potential test. Archaeal and bacterial diversity was also identified using high throughput DNA sequencing of 16S rDNA libraries. Methane yield was 0.29 m3 CH4/kg VSadded in the positive control and 0.16 m3 CH4/kg VSadded in the treatment group. The phylum, Bacteroidetes, and genus, Methanosarcina, prevailed in the leachate. However, in thermophilic conditions, the microbial communities changed, and the phylum, Firmicutes, genera, Methanoculleus, and candidate genus, vadinCA11, were dominant in the treatment group. We concluded that the leachate contains a suitable initial charge of many active bacteria and methanogenic archaea which contribute to the AD process, hence it can be used as an inoculum for the treatment of OFMSW.

Graphical Abstract

1. Introduction

The production of solid waste is growing around the world due to economic expansion, urbanization, and a constant rise in population, leading to an increased risk for humans and the environment [1]. According to the Global Review of Solid Waste Management 2012, municipal solid waste (MSW) production is nearly 1.3 billion tons per year, and it is expected to escalate to around 2.2 billion tons per year by 2025 [2]. Thus, its management has become a complex problem worldwide. It has also been reported that MSW generation in Latin America and the Caribbean is 1.09 kg per capita with a high content of organic waste (54%) [3]. For the management of organic wastes, some researchers have suggested several techniques, like the application of buybacks to reinforce MSW management [4], installation of small-scale biogas plants [5], or the use of waste stream mapping as a tool to identify with more certainty the management strategies that can be implemented [6]. Similarly, Mexico City is also facing MSW management challenges. This metropolitan area produces more than 12,000 tons of MSW per day, and from this MSW, approximately 8000 tons are disposed in five landfills in the neighboring states of Mexico City. It should be noted that 44% of the generated waste corresponds to the organic waste fraction of municipal solid waste (OFMSW) [7]. In 2004, the government of the city implemented for the first time an Integral Solid Waste Management Program (ISWMP) from 2004 to 2008. The goal of this program was the separation of MSW into biodegradable and non-degradable fractions. Due to the unavailability of space, the city’s only landfill, Bordo Poniente, was closed in 2011; because of this, the ISWMP program was strengthened from 2010 to 2015 to encourage society to participate in waste separation at the source, and with this, the final disposal of MSW was reduced. In 2016, new approaches were introduced based on the principle of zero waste, which relies on the reduction of waste, and the implementation of technologies in the treatment and use of waste.
Regarding the treatment of OFMSW, Mexico City has eight composting plants with a capacity of 922,275 tons per year. The composting plant Bordo Poniente (CPBP) is the largest one, receiving more than 1200 tons of biodegradable waste and yard trimmings per day. Recently, the program has also proposed the installation of anaerobic digestion reactors to treat this kind of waste, including energy generation [7].
Anaerobic digestion (AD) is a biological process for various organic wastes, like animal manure, food waste, and municipal sludge, and it produces biogas and digestate as a soil conditioner [8,9,10]. During AD, microbes transform organic substrates into biogas through four important digestion stages: Hydrolysis, acidogenesis, acetogenesis, and methanogenesis [11]. This process is accomplished syntrophically by bacterial and archaeal communities [12]. During hydrolysis and acidogenesis, complex organic substrates are the first to degrade into simpler compounds and are then transformed into volatile fatty acids or other small molecules [13]. There are many different bacteria involved in these stages, such as Clostridium, Bacteroides, Butyrivibrio, Proteobacteria, Bacillus, Streptococcus, and Eubacterium [14]. Similarly, in acetogenesis, genera, like Syntrophomonas, Smithllea, Syntrophus, and Syntrophobacter, transform the products from acidogenesis into acetate and hydrogen, and that can be further utilized by methanogens, like Methanobacterium, Methanococcus, Methanobrevibacter, Methanosarcina, and Methanosaeta [15].
The composition of the microbial community in the inoculum is a highly useful parameter to be considered in AD, because of their importance in the degradation process of organic matter, and the production of biogas [16,17]. Generally, manure [8,18], sewage sludge [19,20], or digestate [21,22] are used as the inoculum for AD. Also, many researchers have worked with leachates from both landfills and composting plants for various purposes regarding organic waste degradation. The use of a landfill leachate along with compost has been used to improve stability in a thermophilic AD process of OFMSW, achieving a 90% performance recovery within 3 months [23]. In another study, a landfill leachate was used as a co-substrate in an AD process with OFMSW, where the methane yield was 0.232 m3/kg; this result suggests that an AD process is a possible alternative treatment for leachates [24]. Similarly, a compost leachate was used as a sole substrate in AD using different organic loading rates, and its biodegradability was evaluated through the removal efficiencies of 5-day biochemical oxygen demand (BOD5 )and chemical oxygen demand (COD), achieving values of 99.43% and 97.33%, respectively, and a maximum biogas production of 9.99 L [25]. Another study re-inoculated a combination of compost leachate with a nutrient solution in compost piles in order to accelerate the composting process and this was more effective due to the presence of microorganisms with a high capacity for degradation [26]. Furthermore, it has been reported that some strains, like Bacillus spp., that were isolated from a composting plant have proteolytic enzymes which can be used for industrial functions [27].
We aimed to study the use of compost leachate from CPBP as inoculum to treat OFMSW and assess the performance of AD at the lab-scale using thermophilic conditions. Furthermore, the microbial diversity of the bacteria and archaea communities involved in AD processes were determined by high-throughput DNA sequencing.

2. Materials and Methods

This project was carried out in Mexico City, Mexico. The samples were collected from CPBP located 2.1 km on Peñón Texcoco Highway, Federal Zone Ex Lago de Texcoco, Bordo Poniente, State of Mexico, with coordinates 19.273581° N 99.1324° W [28].

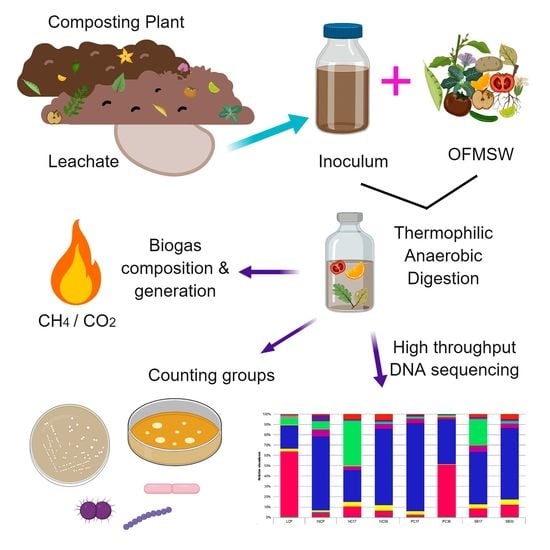
2.1. Sampling and Preparation of Substrate and Inoculum

Source-sorted OFMSW was used as a substrate, collected from the CPBP. After sampling, the OFMSW was homogenized by a mixer and kept at 4 °C until the experiment started. Mature compost leachate was collected from a deposit of CPBP (residence time, minimum 30-days), and pre-incubated at 55 °C for 2 weeks to acclimate the initial seed microbial consortia to thermophilic conditions and reduce background biogas and methane production [29,30]. Both mature compost leachate (LCP) and inoculum (INCP) were handled for all chemical and microbiological characterizations.

2.2. Biochemical Methane Potential (BMP) Assay

The BMP assay was used to evaluate the methane production and degradability of the OFMSW and the inoculum (INCP) [31]. The BMP was made in a batch for 30-days in 125 mL serum bottles. Each bottle was filled with a substrate:inoculum ratio of 1:1 volatile solids (VS), with a working volume of 60 mL [19]. The bottles were locked with butyl rubber stoppers and aluminum crimps, flushed with helium for 20 s at 20 psi, and incubated at 55 °C and 60 rpm. This assay was performed using three different groups: Negative control (NC), i.e., inoculum and water only; positive control (PC), i.e., inoculum and Whatman filter paper (97% cellulose Cat# 1440-110) as a quality control [32]; and the substrate (SB), i.e., inoculum and the OFMSW. All experiments were done in triplicate. For the chemical analysis, samples were collected at the beginning and at the end of the assay, and for the microbiological tests, at days 1, 17, and 30.

2.3. Chemical Analysis

Standard methods were used to characterize the leachate and inoculum (LCP, INCP), the substrate (OFMSW), and all treatment groups (NC, PC, SB). The analyses were done in triplicate with different parameters, such as: pH and electric conductivity (EC) using a pH electrode (Hanna Instruments HI99300), and the oxidation-reduction potential (ORP) using an electrode (Hanna Instruments H1003). A gravimetric method was used to characterize the total solids (TS) and volatile solids (VS). For the TS, samples were dried at 70 °C for 48 h, and for the VS, the dried samples were calcined in the furnace at 550 °C for 2 h [33].

2.4. Generation and Composition of Biogas

Biogas production was quantified using a syringe displacement method [34] and biogas composition (CO2, CH4, and N2) was measured by gas chromatography (GC). The GC system (PerkinElmer Autosystem, Waltham, MA, USA) is equipped with a Porapack QS SS 80/100 12′ × 1/8″ × 0.085″ column (Alltech), helium was used as the carrier gas at a flow rate of 35 mL/min and a thermal conductivity detector (TCD) was calibrated against reference gases. The biogas/methane values were standardized at normal conditions (0 °C, 1 atm) and are presented as m3 CH4/ kg VSadded. The methane production from the negative control (NC), was deducted from the methane production of the PC and SB assays; cellulose standard was used as a positive and quality control of the inoculum performing activity test. The measurements were done every 2 days during a 30-day period and analytical tests were performed in triplicate.

2.5. Counting Mesophilic and Thermophilic Groups

Total aerobic bacteria (TAB) and cellulolytic bacteria (CA) were subjected to both mesophilic and thermophilic conditions. The plate count technique was used for the mesophilic condition with an incubation temperature of 35 °C. TAB were incubated for 48 h and CA for 5 days. Nutrient agar was used for the TAB and modified mineral-based agar [35] with cellulose paper for the CA. Each sample was inoculated in duplicates, using 3 serial dilutions. Subsequently, bacterial colonies were counted, and results are expressed in colony forming units (CFU) mL−1. For the thermophilic condition, the 3-tube most probable number (MPN) technique was used and incubated at 55 °C for 5 days. The culture media were the same as described above but in the broth form and also 3 serial dilutions were used. The results were calculated using a standardized MPN table and are expressed as MPN mL−1.

2.6. Biochemical Tests

After counting the colonies, a macroscopic analysis was performed, considering the color, size, edge, shape, and elevation. Afterwards, the microscopic morphology was determined by Gram stain, and based on the results, we proceeded to make some specific biochemical tests for rods or cocci bacteria. For Gram-positive rods, we performed: Catalase, citrate, growth in hypersaline broth, Voges-Proskauer (VP), methyl red, nitrate reduction, and starch hydrolysis tests. For Gram-negative rods, citrate, VP, methyl red, sulfide, indole, motility (SIM), and triple sugar iron (TSI) agar tests were performed. For Gram-positive and Gram-negative cocci, the commercial system, API (Analytical Profile Index), was used, applying the API20 Strep kit.

2.7. DNA Extraction and 16S rDNA Library Preparation

To analyze the microbial profile, including bacteria and archaea, genomic DNA was extracted from 400 µL of sample using the PowerSoil DNA isolation 100-prep kit (MoBio Laboratories Inc., USA, Cat. #12888-100) according to the kit guidelines. The quantity and quality of the extracted DNA were determined by a NanoDrop Lite Spectrophotometer (ThermoScientific, USA) and electrophoresis migration on a 0.5% agarose gel. In total, 16S rDNA genes segments were amplified by PCR: Primers for bacteria, forward V3-341F (5′-CCTACGGGAGGCAGCAG-3′), reverse V3-518R (5′-CCAGCAGCCGCGGTAAT-3′) [36]; whereas for the archaea the primers used were forward Arc787F (5′-ATTAGATACCCGGGTAGTCC-3′) and reverse Arc1059R (5′-GGTGGTGCATGGC -3′) [37,38]. The thermocycler program for bacteria was: Initial denaturation at 95 °C for 5 min, subsequently 25 cycles of denaturation at 94 °C for 15 s, annealing at 62 °C for 15 s, and extension at 72 °C for 15 s, with a final extension of 7 min at 72 °C. The program for the archaea was the same as for the bacteria except that the annealing temperature was at 56 °C. A full list of the bacterial and archaeal primers of this study are shown in Table S1. Likewise, the map of 16S rDNA gene and primer positions of the Archaea domain is shown in Figure S1, and for bacteria as previously described [39].

2.8. High Throughput Sequencing and Analysis

In total, 16S rDNA libraries of the bacteria and archaea were taken for each sample in the equivalent of 10 µg in concentration and a massive pool was made by combining them. With this massive pool, high throughput sequencing was performed using the Ion 318 Chip Kit v2 and Ion Torrent PGM System (ThermoFisher Scientific, Waltham, MA, USA) massive sequencer [36,40]. Later, sequences were processed using QIIME pipeline (v1.9.0) [41]. Operational taxonomic units (OTUs) were picked against the Greengenes (v13.8) database. Raw reads were deposited to National Center for Biotechnology Information (NCBI) with BioProject number PRJNA521228 and the accessing link is: https://0-www-ncbi-nlm-nih-gov.brum.beds.ac.uk/bioproject/?term=PRJNA521228.

2.9. Bacterial and Archaeal Relative Abundance and Diversity

Bacterial and archaeal relative abundance were calculated using the QIIME (v1.9.0) pipeline. Alpha-diversity, including the Shannon, Simpson, and Chao1 indexes and observed species, was calculated using phyloseq (v1.22.3) and ggplot2 (v3.1.0) packages in R (v3.4.4) [42], while beta-diversity was measured using UniFrac analysis and plotted by principal coordinate analysis (PCoA) [43].

2.10. Predicted Metabolic Pathways of Bacteria and Archaea

Metabolic pathways were predicted by PICRUSt (Phylogenetic Investigation of Communities by Reconstruction of Unobserved States, v1.1.2) with 97% similarities of closed OTUs references against the Greengenes database (v13.8) in QIIME (v1.9.0) pipeline. The Kyoto Encyclopedia of Genes and Genomes (KEGG) database was used for the prediction, and STAMP (v2.1.3) was used for statistical analysis and for the visualization [43]. Statistical significant values were calculated using G-test (w/Yates’) and Fisher’s method with at least p < 0.05, and q < 0.05 using Benjamini-Hochberg correction.

2.11. Statistical Analysis

For the chemical analysis, one way ANOVA was done using SigmaPlot (v12.0) software. The t-student test was used for the cumulative biogas and methane production.

3. Results

3.1. Chemical Characteristics of the OFMSW, Inoculum, and Reactor Mixtures at the End of the 30-Day Period

The chemical properties of the OFMSW, LCP, and INCP are shown in Table 1. The OFMSW was acidic (pH = 4.55) and had 80.54% of the VS/TS ratio which shows an abundance of organic contents in this substrate. Chemical analysis between LCP and INCP showed some differences. The pH changed from acidic (LCP; pH = 6.89) to alkaline (INCP; pH = 8.33). The ORP value was more negative for INCP, and there was a reduction (12.90%) in volatile solids.
Table 2 displays the chemical characteristics of NC, PC, and SB on day 30. The pH remained slightly alkaline (7.7–8.3) in all cases. The ORP continued to have negative values which indicated that anaerobic conditions were maintained until the end of the test. The PC disclosed a highly noteworthy VS reduction (86.46%) after 30 days, followed by the NC (54.96%), whereas SB presented a lower reduction rate (49.58%), considering the amount of substrate initially added. Among treatments, there were significant differences in some parameters. The pH was more acidic (7.75) in SB and the conductivity had the highest value in this group (40 mS/cm) in comparison with the rest of the groups. In terms of volatile solids, the PC had the lowest value (8.22) which means the reduction of VS was higher. In the ORP and TS, there were no significant differences.

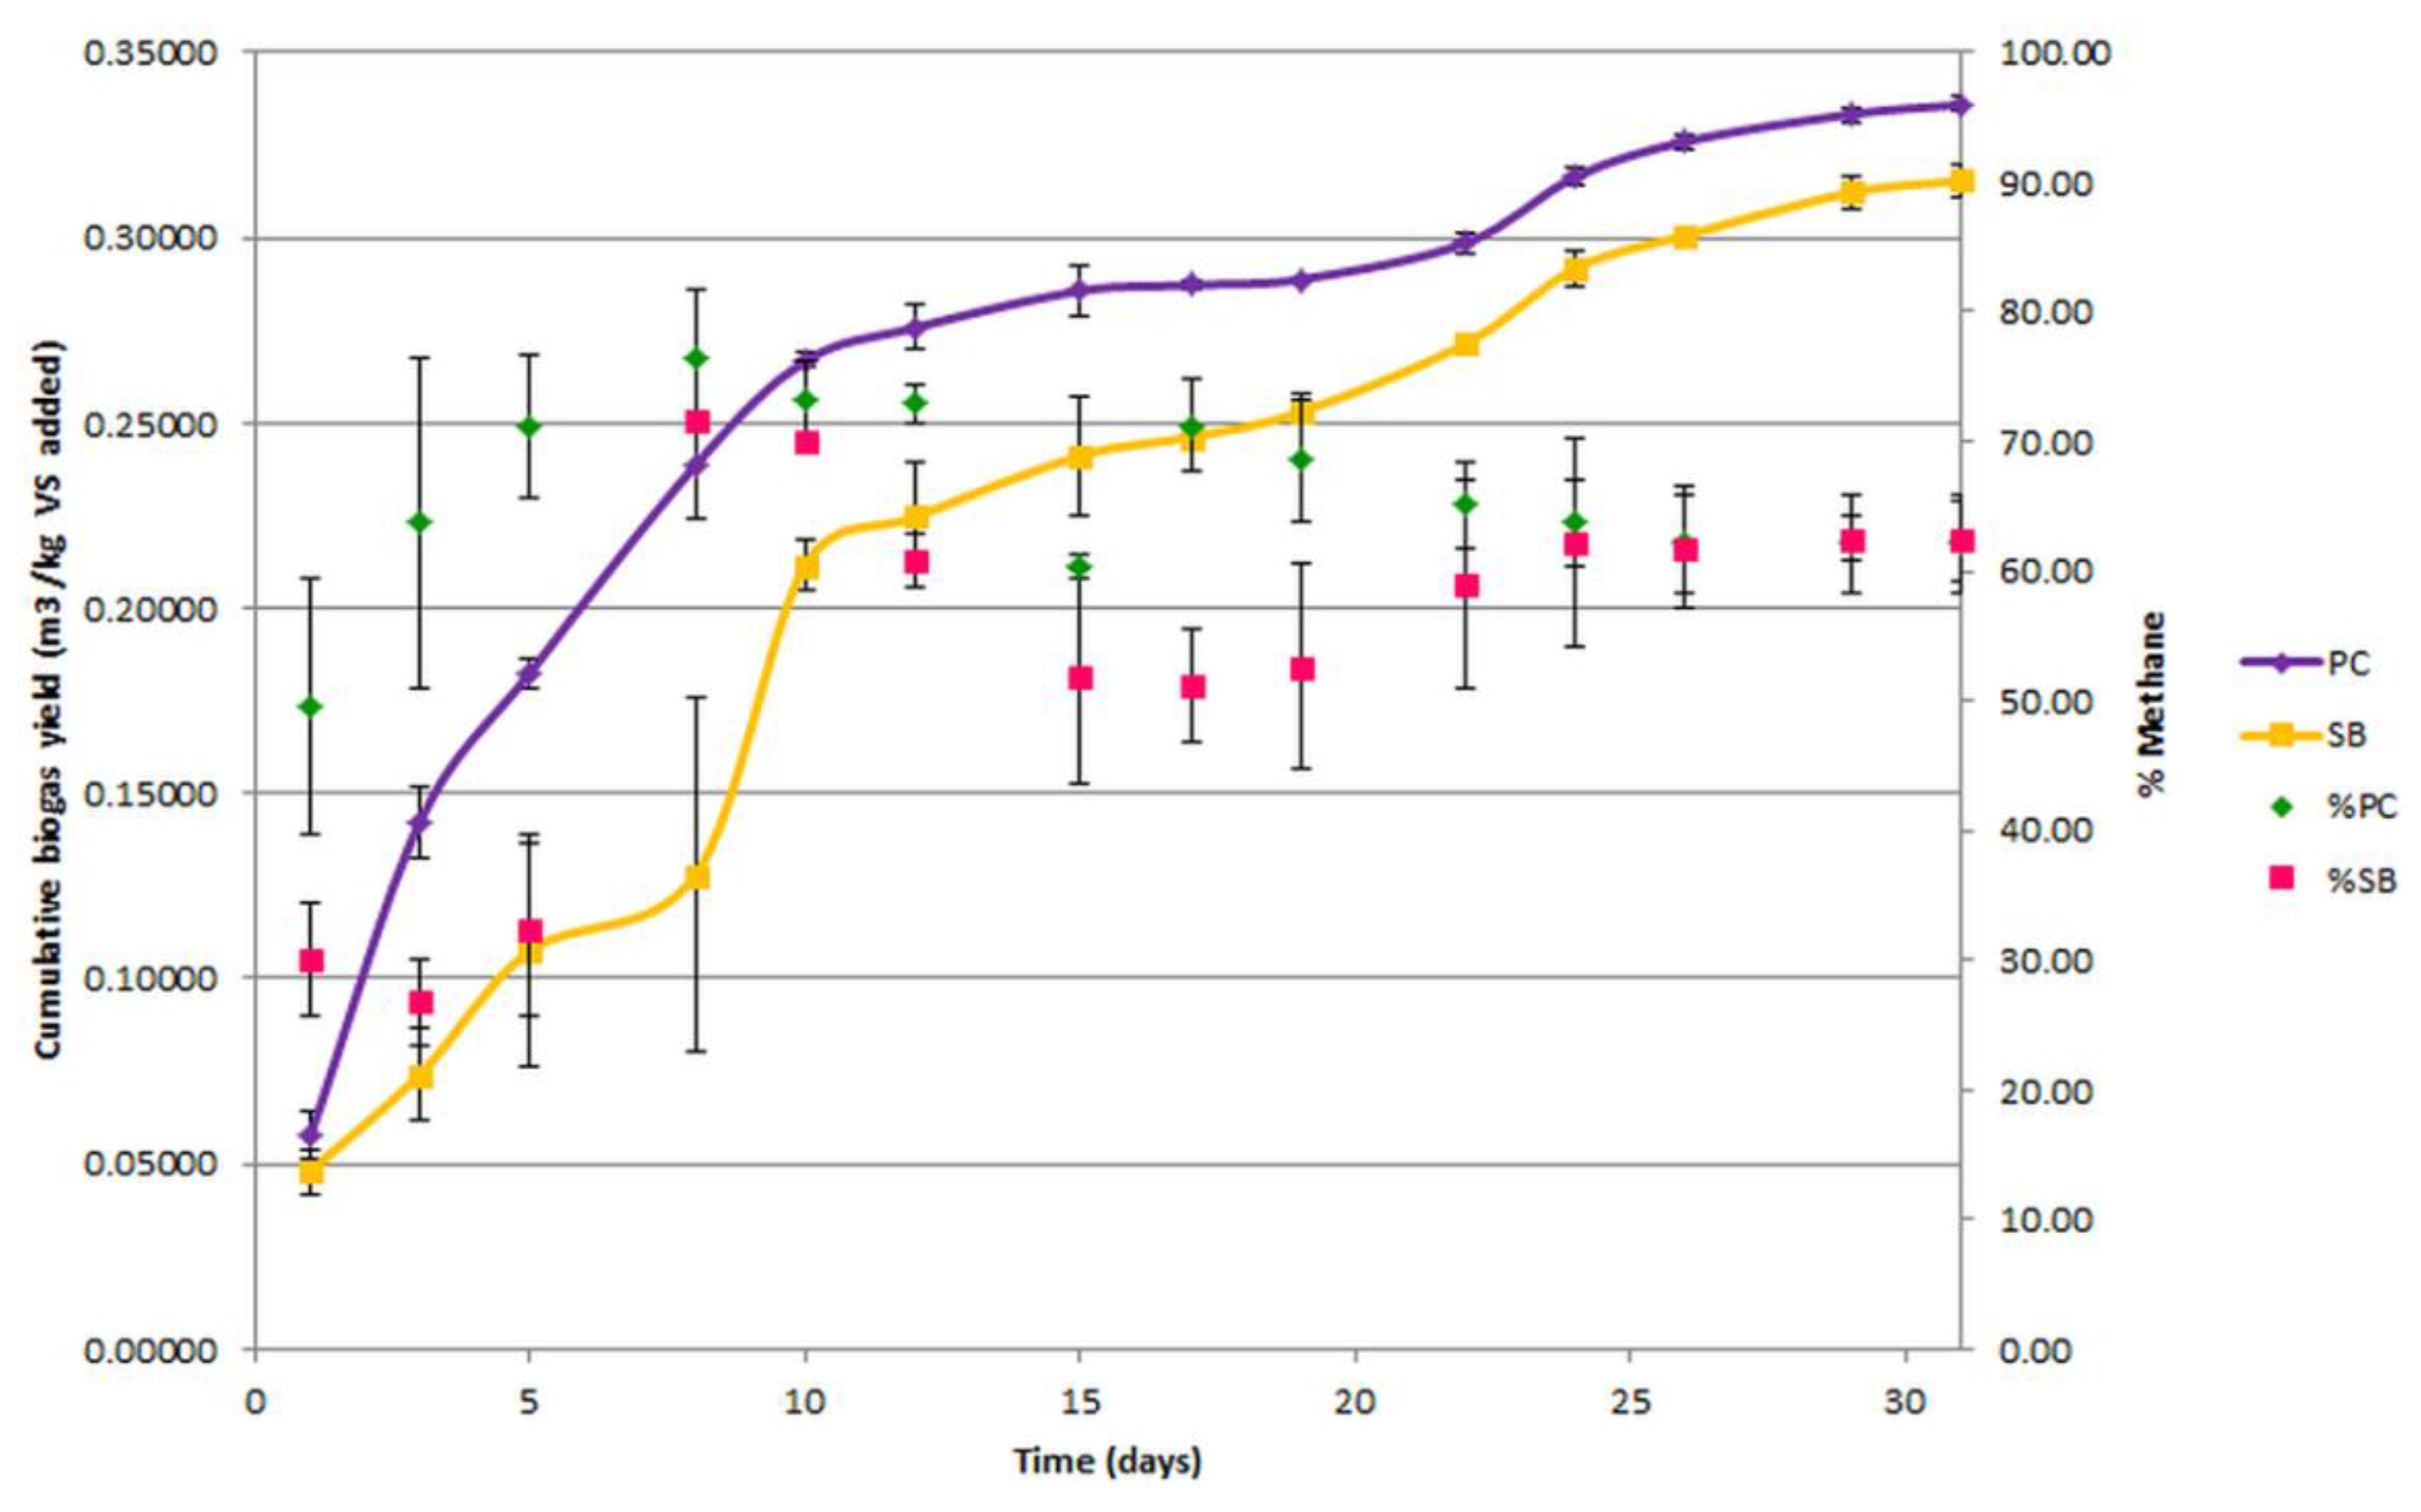
3.2. Biochemical Methane Potential Assay

The average cumulative generation of biogas and methane composition was analyzed during the digestion time in all treatment groups (Figure 1). The biogas yield of PC was higher than SB, and the average was 0.34 ± 0.04 m3/kg VSadded and 0.32 ± 0.05 m3/kg VSadded, respectively. Between these two treatments, no statistical significance (p = 0.612) was observed. During the first 15 days of operation, biogas was generated from the PC (85.04%) and SB (76.48%) treatments of the total biogas generated during the assay. Furthermore, in the biogas composition, PC presented on average 65.91% and SB 53.93% of methane, which led to a significant methane yield of 0.29 ± 0.06 m3 CH4/kg VSadded in PC (p = 0.026) versus 0.16 ± 0.02 m3 CH4/kg VSadded in SB.

3.3. Counting Mesophilic and Thermophilic Groups

Mesophilic and thermophilic groups of bacteria were counted for all samples (Table 3). The mesophilic population of TAB in LCP (6.4 × 10⁵ CFU mL−1) was slightly decreased when it was subjected to pre-incubation (5.9 × 10⁵ CFU mL−1). While for the CA group, the population decreased when LCP was pre-incubated, passing from 4.6 × 10⁶ to 8.9 × 10⁴ CFU mL−1. In TAB, the samples showed a tendency to decrease on day 17 (104 CFU mL−1) and a rebound took place at day 30 (105 CFU mL−1). In CA, PC17 presented the largest population (4.9 × 10⁷ CFU mL−1); however, at day 30, it decreased to 1.5 × 10⁵ CFU mL−1. SB17 showed the same trend as PC, but with a lower order of magnitude in each case (106 to 104 CFU mL−1); in contrast, in the NC, it went from 9.1 × 10⁴ (NC17) to 6.9 × 10⁶ CFU mL−1 on day 30.
The thermophilic TAB group in LCP and INCP maintained the same population (4.3 × 10⁴ MPN mL−1), but for the treatments (NC, PC, and SB), from day 17 to day 30, it showed a descending order, like NC and PC, which decreased one order of magnitude from 9.5 × 10⁴ to 2.9 × 10³ MPN mL−1, and from 2.4 × 10⁵ to 1.5 × 10⁴ MPN mL−1, respectively. However, SB showed a cut back of two orders of magnitude (2.4 × 10⁵ to 1.6 × 10³ MPN mL−1). In the CA group, LCP disclosed the lowest population (35 MPN mL−1), though when it was pre-incubated for 2 weeks, the population grew to 1.1 × 10³ MPN mL−1. The CA populations in the treatments, NC and SB, remained stable throughout the process at 103 MPN mL−1, while in PC, there was a slight growth at day 30, going from 3.5 × 10³ to 2.1 × 10⁴ MPN mL−1.

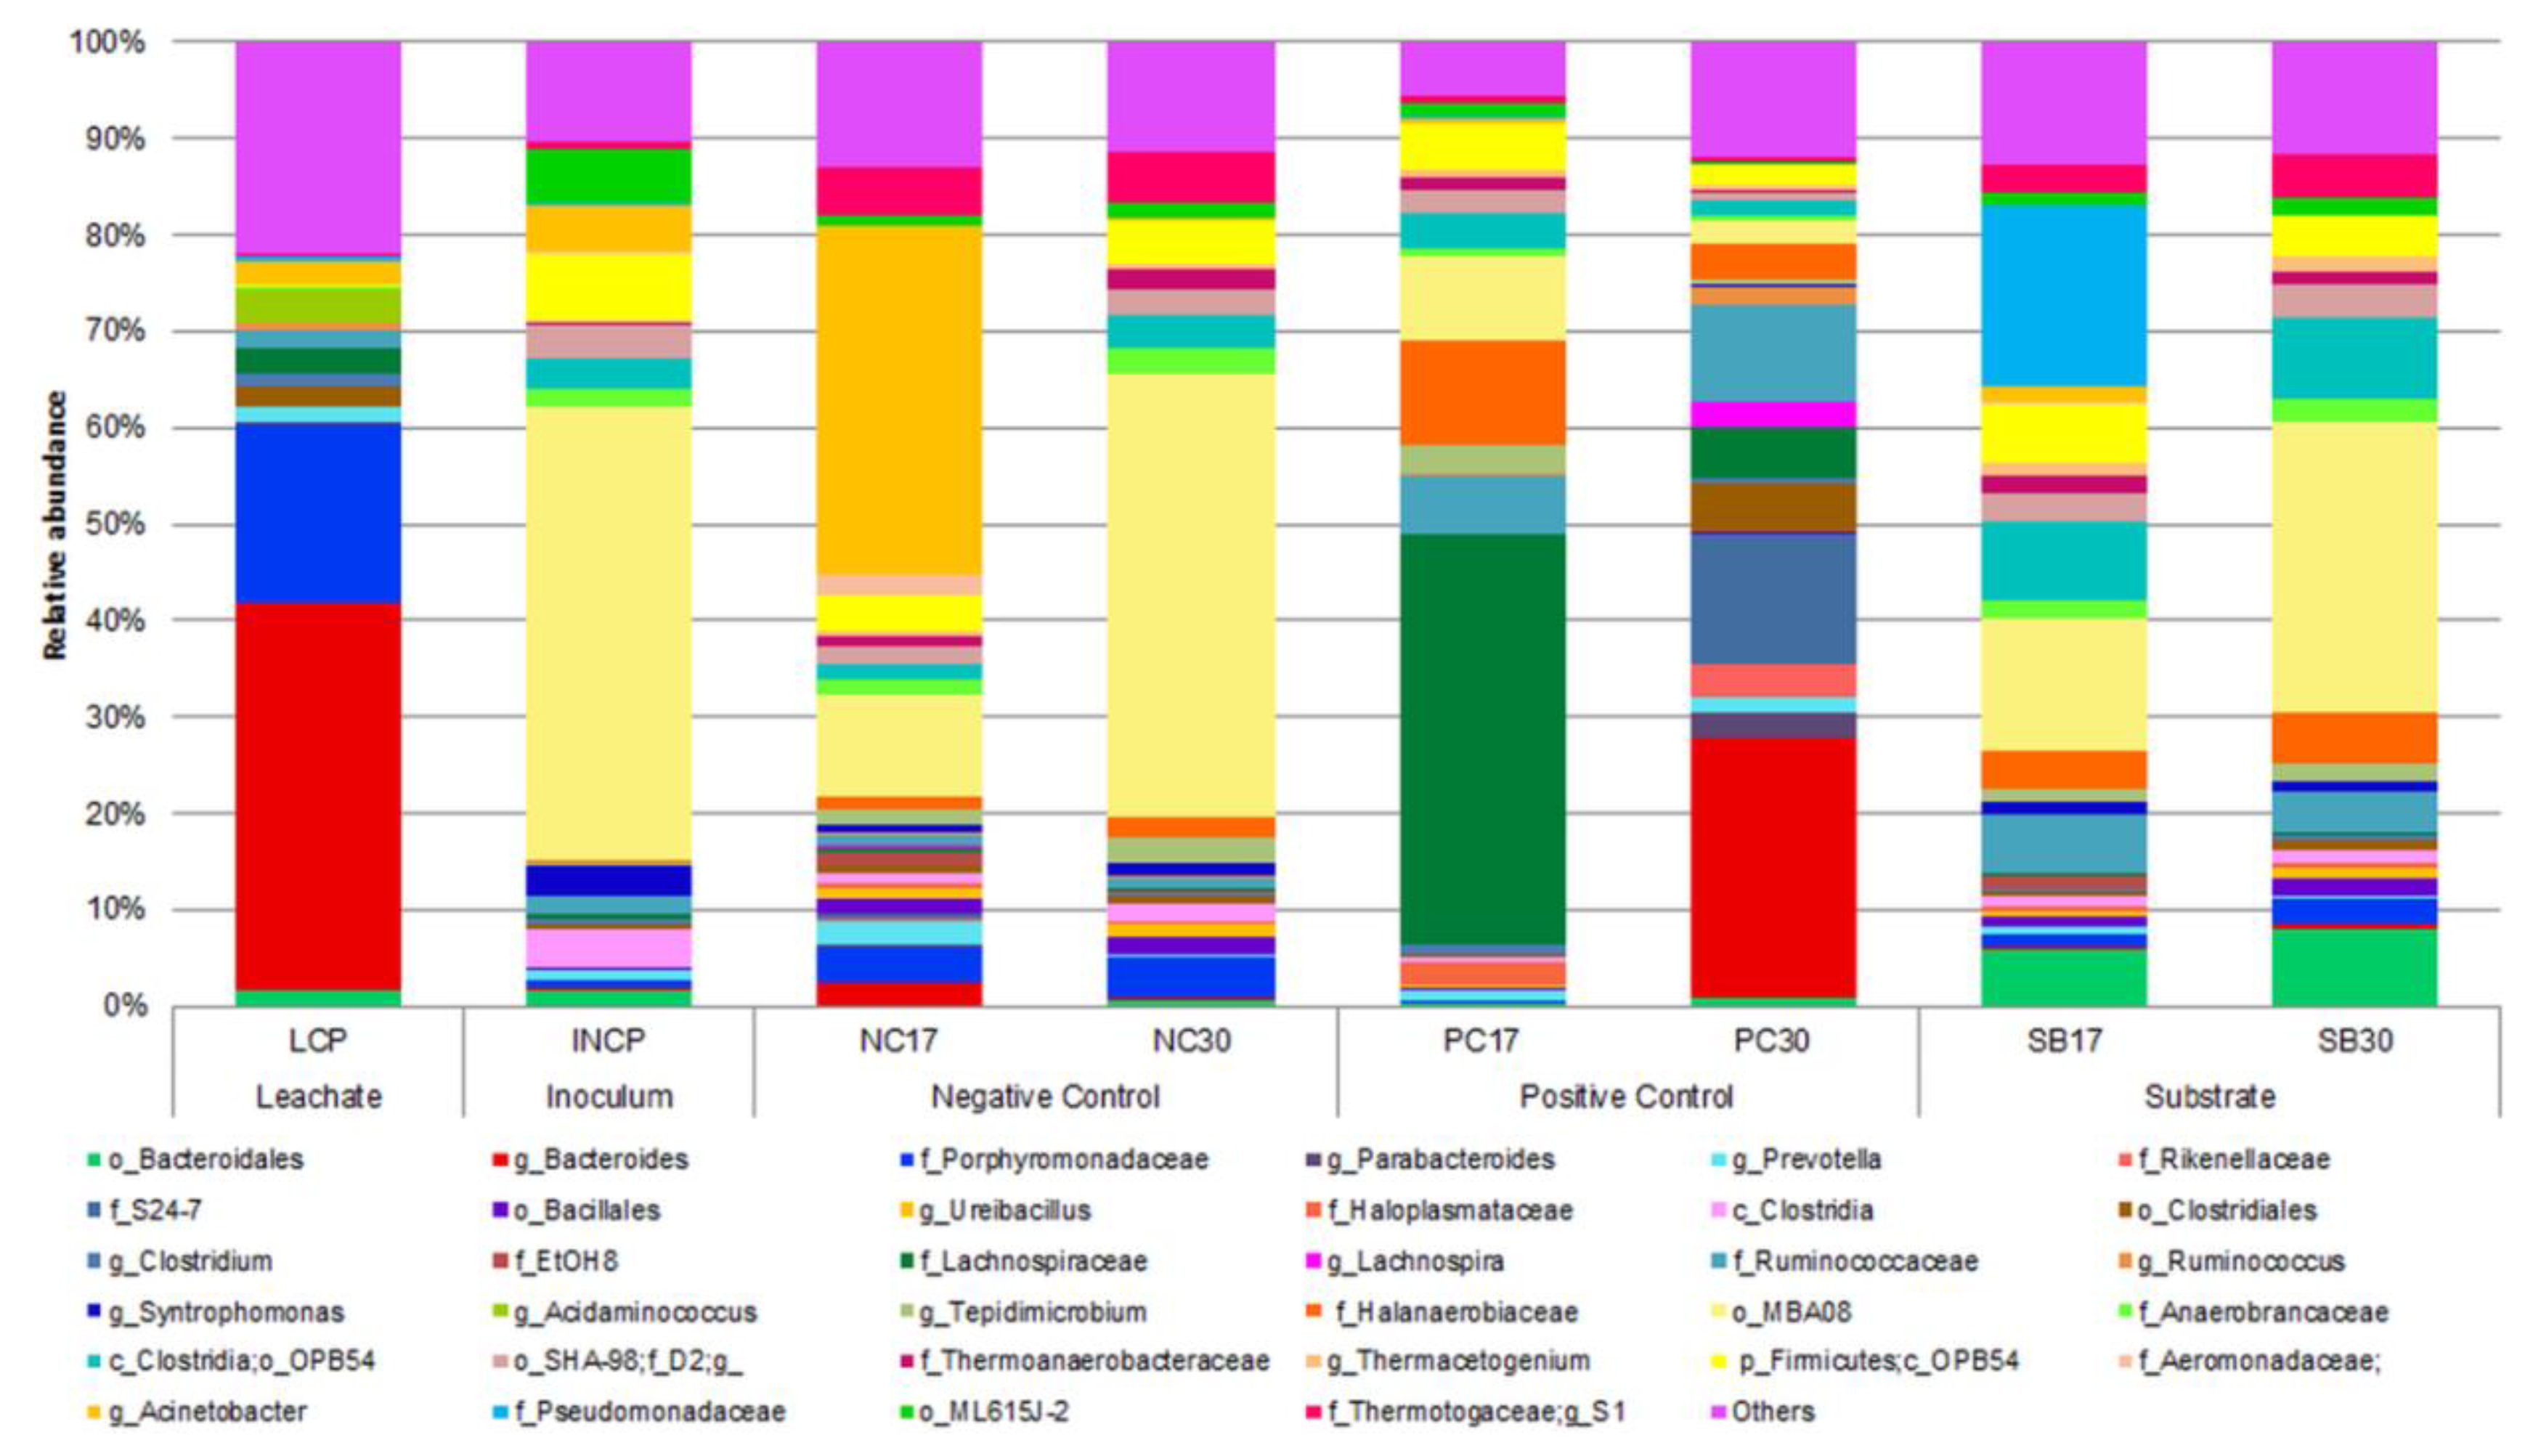
3.4. Bacterial Identification

From the TAB group, 246 colonies were isolated (considering mesophilic and thermophilic), in which 84.15% corresponded to Gram-positive rods, 3.25% to Gram-negative rods, and 12.6% to Gram-positive cocci. In the CA group, 104 colonies were isolated; 60.48% belonged to Gram-positive rods, 6.73% to Gram-negative rods, and 31.73% to Gram-positive cocci. Based on the macro- and microscopic morphology and biochemical test, colonies were classified. In total, 42 bacteria were assigned to TAB and 29 bacteria to CA. From these two groups, TAB and CA, we found the following bacterial genera: Bacillus, Paenibacillus, Aneurinibacillus, Lysinibacillus, Psychrobacillus, Lactobacillus, Streptococcus, Enterococcus, and Lactococcus.

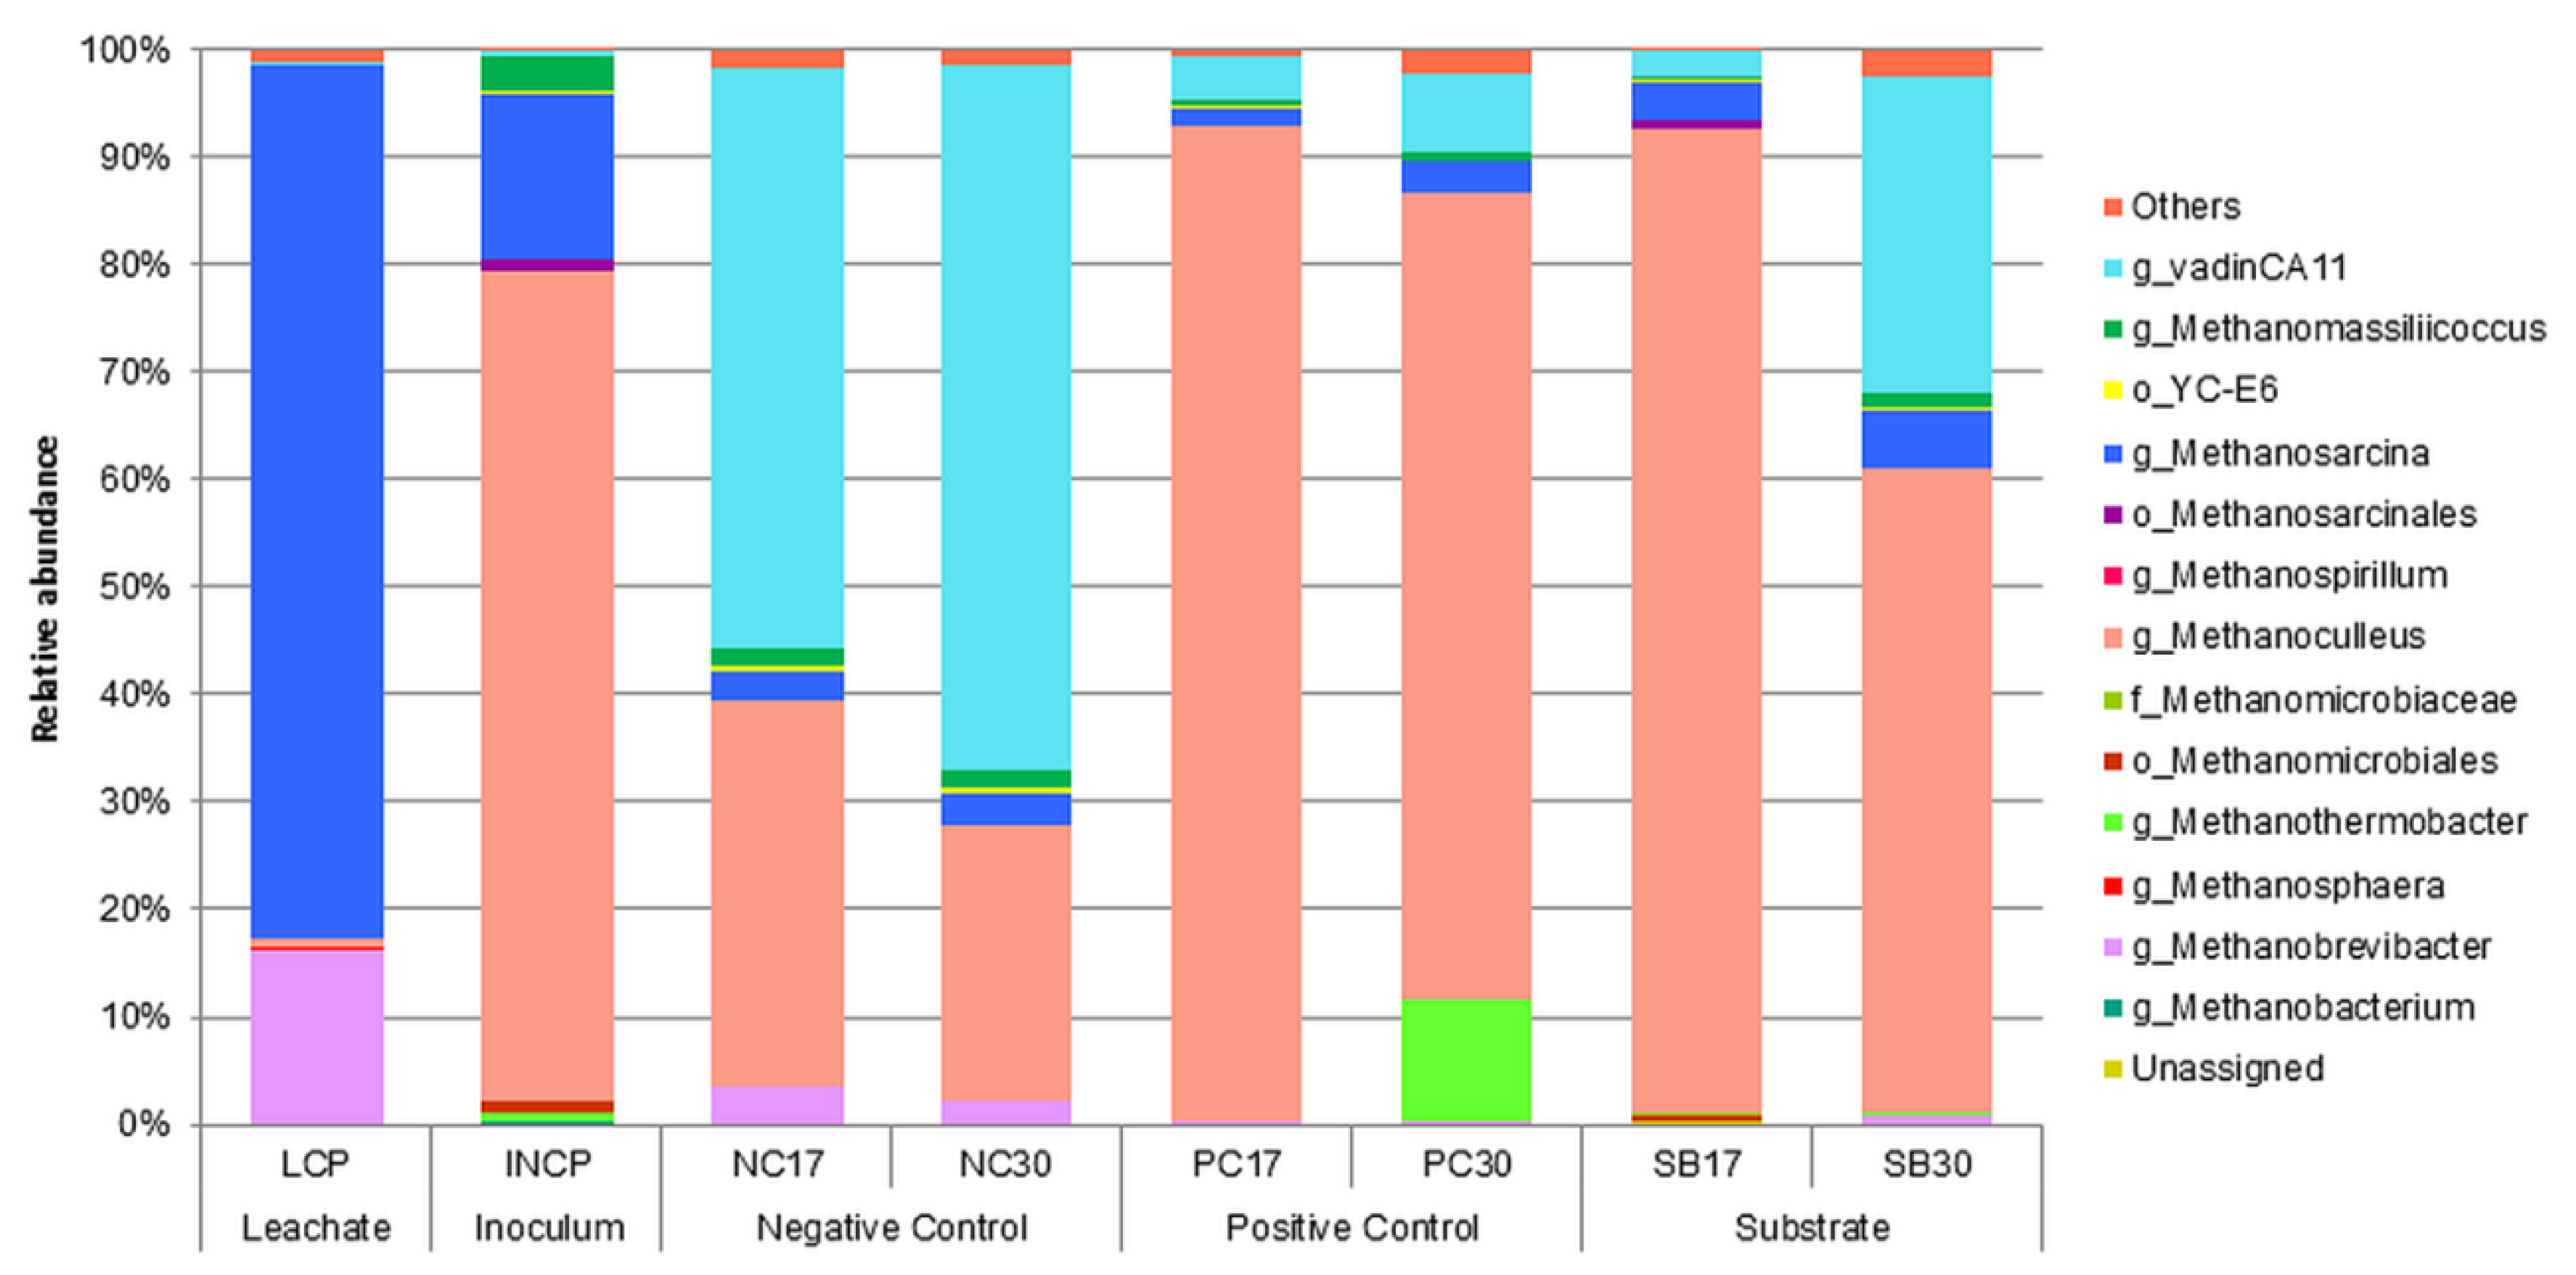
3.5. Microbial Analysis

We processed a total of 199,299 reads for bacteria and 2,479,705 for archaea. Bacterial reads included: LCP = 27,535 and INCP = 27,294. Average reads in the treatment groups included: NC = 31,561; PC = 15,265; and SB = 25,410. Archaeal reads included LCP = 334,141 and INCP = 557,683. Average reads in the groups included: NC = 158,588; PC = 378,530; and SB = 256,823.
In bacteria, Firmicutes was the most abundant phylum with more than 60.00% in five samples, including INCP, NC30, PC17, SB17, and SB30. In LCP, Bacteroidetes predominated with 63.77%, in PC30 with 50.58%, and in the other samples, it was present in less than 12.00%. The third predominant phylum was Proteobacteria, accounting for 43.61% and 24.62% in NC17 and SB17, respectively, and in the rest of the samples it was in 7% or less. The phylum, Thermotogae, was present in NC17 and NC 30 with 4.92% and 5.31%, respectively, while in SB17 and SB30 it was 2.83% and 4.63%, respectively. Tenericutes, Synergistetes, Spirochates, OP9, Deferribacteres, and Actinobacteria were less than 2.00% in all samples, except Tenericutes in INCP, which was 5.73%. Other phyla observed in less than 0.1% were, for example, Chloroflexi and Cyanobacteria, among others (Figure 2).
At the class level, Clostridia belongs to Firmicutes and was one of the most abundant bacterial class. INCP and NC30 accounted for 71.48% and 73.81%, respectively. SB samples showed 50.62% at day 17, and 69.00% at day 30. Next, PC17 had the highest abundance with 85.13%, and LCP the lowest with 22.05%. Within Bacteroidetes, Bacteroidia disclosed a higher abundance in LCP (63.57%) and in PC30 (50.55%), while in the rest of the samples it was less than 12.00%. Gammaproteobacteria from Proteobacteria was dominant in NC17 (42.57%) and in SB17 (24.33%). Classes, like Bacilli, OPB54 (both belong to the phylum, Firmicutes), Spirochaetes (phylum Spirochaetes), and RF3 (phylum Tenericutes), were less than 5.00% in abundance in all samples (Figure S2).
At the genus level, Bacteroides had a higher relative abundance in LCP (40.29%) and in PC30 (26.82%). Acinetobacter was present in a high proportion in NC17 (36.25%), while in the rest of the samples it was in less than 5%. Other genera, like Parabacteroides, Prevotella, Ureibacillus, Clostridium, etc., were present in all samples with less than a 5% abundance. The genera, Bacillus, Lactobacillus, Streptococcus, Enterococcus, Lactococcus, Paenibacillus, and Lysinbacillus, identified through biochemical tests, were also found by massive sequencing (included in others); however, in all cases, the relative abundance of these bacteria was less than 1%, except in LCP, in which Lactobacillus was 1.34% (Table 4; Figure 3).
On the other hand, the Archaea genera are shown in Table 5 and Figure 4, where Methanosarcina was the most abundant in LCP (81.09%). In INCP, the treatments of PC and SB, Methanoculleus prevailed (60%–93%), whereas in the NC treatment, the candidate genus, vadinCA11, that belongs to the family, Methanomassiliicoccaceae, was the most abundant (54%–65%). Other genera, like Methanobrevibacter, Methanothermobacter, and Methanomassiliicoccus, were found in smaller proportions. Genera represented by less than 1% in at least one sample were Methanobacterium, Methanosphaera, and Methanospirillum.

3.6. Diversity of Microbial Communities

The alpha-diversity was calculated, including the observed species, and the Chao1, Shannon, and Simpson indexes (Figure 5). The NC treatment showed the highest richness indexes for the bacteria (observed = 1376, Chao1 = 1929.13) and for the archaea (observed = 1269, Chao1 = 1839.15). Regarding the diversity indexes, SB presented the highest values for bacteria (Shannon = 4.64, Simpson = 0.97); however, in archaea, PC showed the highest diversity indexes (Shannon = 2.24, Simpson = 0.75) (Table S2). The beta-diversity was measured by unweighted UniFrac analysis and plotted by principal coordinate analysis (PCoA) for both the bacteria and archaea (Figure 6). It is interesting that bacterial and archaeal communities of LCP are separated from the other samples.

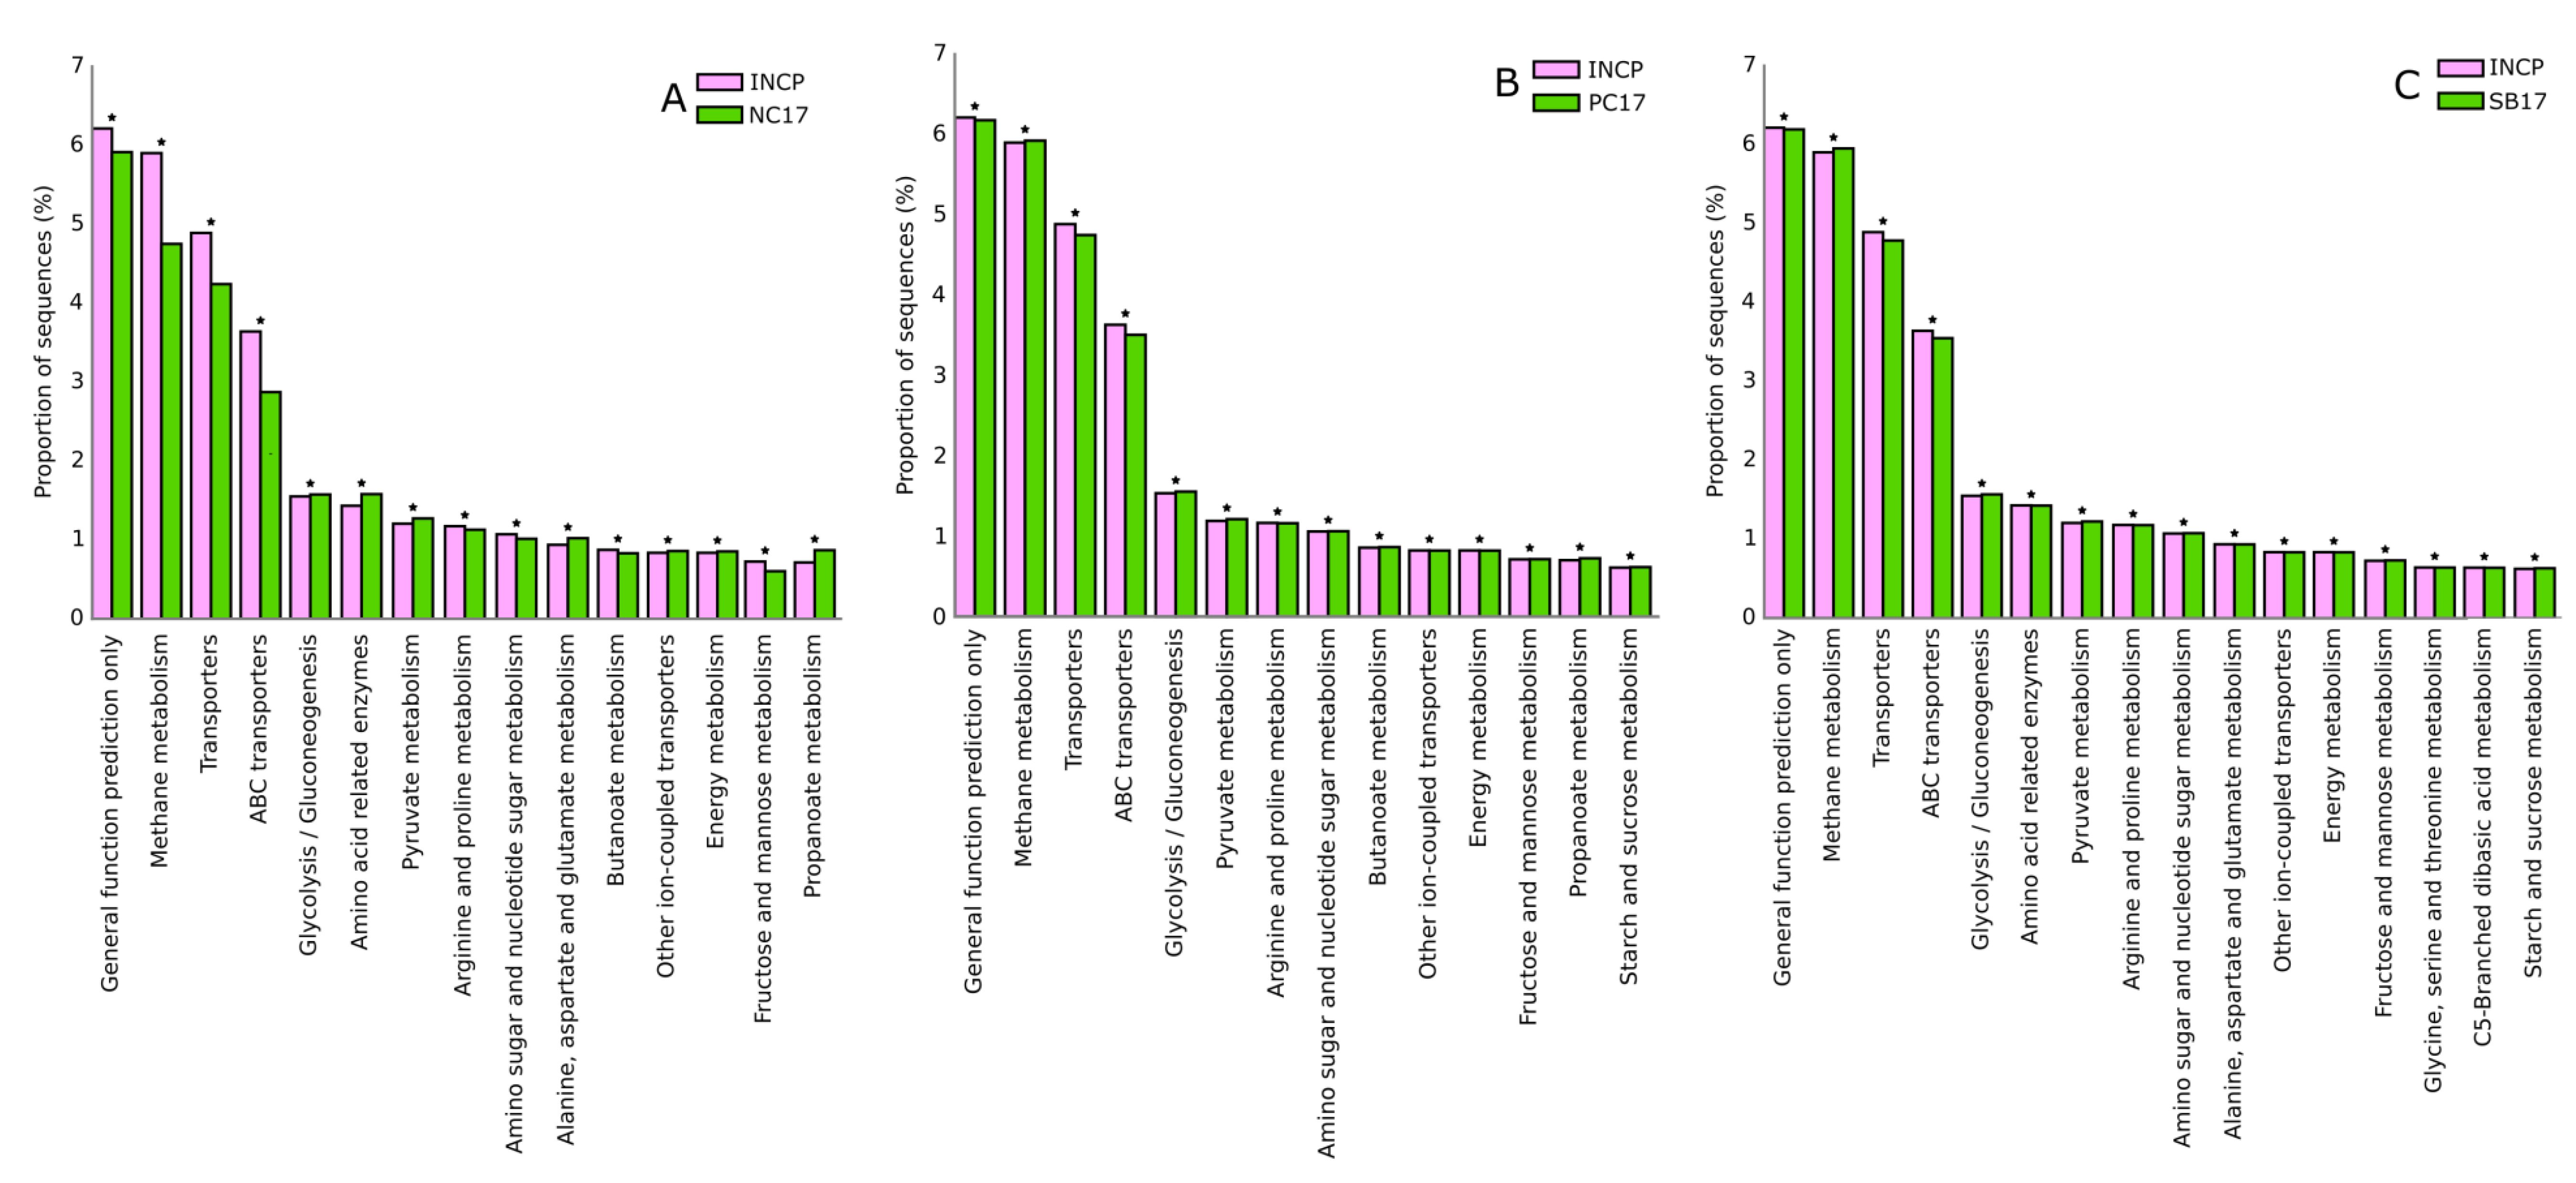
3.7. Predicted Metabolic Pathways of Bacteria and Archaea

We compared the predicted metabolic pathways using PICRUSt (Phylogenetic Investigation of Communities by Reconstruction of Unobserved States) analysis in bacteria and archaea between INCP vs. NC17, INCP vs. PC17, and INCP vs. SB17 (Figure 7 and Figure 8). In the archaea domain, methane, amino and nucleotide sugars, energy, fructose and mannose, and starch and sucrose were the main metabolic pathways (Figure 7). On the other hand, in the bacteria domain, methane, glycolysis/gluconeogenesis, amino and nucleotide sugars, fructose and mannose, and energy metabolic pathways prevailed (Figure 8).

4. Discussion

In this work, compost leachate was used as an inoculum from the largest composting plant, Bordo Poniente, of Mexico City for the anaerobic digestion process of OFMSW. We also identified the microbial diversity of bacterial and archaeal communities.
Initial characteristics of source sorted OFMSW (Table 1) showed similarities with other organic fractions where the pH was 4.5 and the VS/TS ratio was 97% [23], with an average pH of 5.2 ± 0.95 and a VS/TS ratio of 84.6% in the OFMSW from different countries, including Asia, Europe, and Latin America [44,45]. Particularly, in a study done in Mexico City, the values of TS (297 ± 4.2 g/kg) and VS (223 ± 4.2 g/kg) are alike [46].
Although, our substrate (OFMSW) was rich in organic matter, and biogas production (0.32 ± 0.05 m3/kg VSadded), methane generation (0.16 ± 0.2 m3 CH4/kg VSadded) and the VS reduction (49.58%) were lower than expected, but comparable with previous studies where the methane yield range was 0.16 to 0.35 m3 CH4/kg VSadded, suggesting that the substrate contains lignocellulosic compounds or the microbial activity is not optimal or both. It has been demonstrated that food waste, like fruits and vegetables, has high lignocellulosic contents and low lipids, resulting in a low methane yield [47,48]. It is noticeable that organic waste from Mexico City has a high moisture content, and abundant peels, seeds, fruit pulps, and vegetables residues, which are difficult to degrade and may influence the final methane production whereas meat residue (higher methane potential) forms a lower proportion.
In our work, the methane yield is in agreement with previous studies using lignocellulosic residues as feedstock under thermophilic conditions, where an average methane yield of 0.209 m3 CH4/kg VSadded was obtained by working with cattle manure at the pilot scale [49]. Furthermore, an average methane yield of 0.278 to 0.295 m3 CH4/kg VSadded was achieved when working with semi-batch dry anaerobic co-digestion employing rice straw and pig manure [50]. Similarly, a methane yield of 0.19 m3/kg VSadded was reached in the period between 30 and 60 days, while treating separately collected OFMSW using as inoculum corn silage [51]. In another study, a methane yield of 0.16 m3/kg VSadded was obtained when fruit branches were processed with solid anaerobic digested sludge [52]. Additionally, in Mexico, organic waste from the Central de Abasto, Mexico City’s wholesale central market, has been used along with cow manure, buffering salts, and NH4Cl, obtaining a methane yield of 0.22 m3/kg VSadded but it was done in mesophilic conditions [8].
In relation to quality control (PC), the result obtained is within the range previously reported [53], and our inoculum showed a good degradation efficiency when cellulose was employed as a substrate (0.29 ± 0.06 m3 CH4/kg VSadded). A value of 0.34 m3 CH4/kg VSadded was reported as the average methane yield in an international inter-laboratory study using mesophilic and thermophilic conditions [53]. A methane yield of 0.251 m3 CH4/kg VSadded was obtained while working with microcrystalline cellulose and a methane yield of 0.178 to 0.223 m3 CH4/kg VSadded was obtained with representatives of hemicellulose (xylan, glucomannan, and arabinogalactan) [54].
Consequently, we believe that one relevant factor is the fiber content in the OFMSW from Mexico City, which may be responsible for the low methane yield observed in our work. Co-digestion could be considered with meat residues or fat, oil, and grease (FOG) residues, which have higher methane potential. For instance, a methane yield of 0.9 m3/kg VSadded was obtained by co-digestion with meat waste and food waste from Mexico City [8], and the methane yield increased from 0.36 to 0.49 m3/ kg VSadded after adding FOG wastes to OFMSW in Spain [55]. Another technique that can be considered for the improvement of methane yield is bioaugmentation, since an axenic methanogenic culture was added to an up-flow anaerobic sludge blanket (UASB) reactor with OFMSW, achieving a 40% higher methane production [56]. Likewise, two cellulolytic consortia were employed to enhance the methane yield by 22% while working with cellulose and corn stover in a thermophilic AD process [57].
To characterize the microbial abundance and diversity, massive sequencing of 16S rDNA was done for the bacteria and archaea. For the bacteria, Firmicutes, Bacteroidetes, and Proteobacteria were the predominant phyla in all treatment groups (Figure 2).
However, clear differences were observed between LCP and the rest of the treatment groups for the phyla, Firmicutes and Bacteroidetes. Regarding the phylum, Firmicutes, it is known to be present in anaerobic environments, and in addition, Firmicutes are involved in the degradation of many macromolecules, e.g., lipids, carbohydrates, and proteins [55,58]. Previous works have revealed the predominance of this phylum under thermophilic conditions in full, pilot, and lab scale reactors [49,59,60]. It is known that Firmicutes has a syntrophic effect with archaea via the removal of hydrogen and provides favorable conditions for the growth of a methanogenic community [8].
On the other hand, Bacteroidetes has been found in greater proportions under mesophilic conditions [61,62], similar to what was found in our LCP sample, which was collected at room temperature. For the case of Proteobacteria, the relative abundance was less than 7.0% in most of the samples. These bacteria were present between 0.23% and 0.57% in the advanced stage of AD under thermophilic conditions [63], and low abundances in both dry (1.2%) and wet (1.7%) AD of organic waste were found [64].
Among Firmicutes, the Clostridia class has also been found in thermophilic reactors [22,49] (Figure S2). This thermophilic condition favors the growth of spore-forming Clostridia through the heat activation process. In addition, it may accelerate the syntrophic acetate oxidation to methane [49]. Furthermore, the order, MBA08, of Clostridia has been found to be dominant in thermophilic conditions with a greater NH3 content [21] and has also been found in the lignocellulose-based AD process [65]. However, these parameters were not measured in our work. The Bacteroidia class (phylum Bacteroidetes) was found only in mesophilic conditions [61], where the volatile fatty acids (VFA) concentration was higher as well; these acids are inhibitory metabolites for the AD process [66].
Finally, at the genus level (Figure 3), Bacteroides, which predominated in LCP, is known to be an acidogenic bacteria that produces acetate, propionate, formate, and succinate [31]. We believe that the remarkable presence of Bacteroides may be related with the VFA accumulation in the leachate. On the other hand, Acinetobacter has been classified as a SOB (sulfide/sulfur-oxidizing bacteria) [67], and it was dramatically increased from INCP to NC17 (4.86%–36.25%), and decreased at the end of the digestion process of NC30 (0.20%). One possible explanation is that perhaps there H2S generation occurred in the inoculum at the beginning (INC) of the process and was utilized by this bacterium from day 17 (NC17) to day 30 (NC30) of the assay.
For the archaeal community (Figure 4), Methanoculleus was prevalent under thermophilic conditions in our samples. Similarly, it has been reported that this archaeon was abundant during the treatment of organic wastes under thermophilic conditions [55,63]. Methanoculleus, cataloged as a hydrogenotrophic methanogen, can use carbon dioxide as a carbon source and hydrogen as an electron donor to produce methane [31]. Furthermore, it can tolerate high salt concentrations [14]. Additionally, Methanoculleus interacts syntrophically with acetate oxidizing bacteria (SAOB), most of which belongs to the Clostridia class, and as we mentioned above, the Clostridia class were highly abundant in the samples during the AD process [59].
On the other hand, Methanosarcina, known as an acetoclastic methanogen [68,69], was found in a higher abundance in LCP, indicating that the leachate had a high concentration of acetate. In the NC treatment, the candidate genus, vadinCA11, was increased from INCP (0.30%) to NC17 (54.08%), and to NC30 (65.48%). The genus, vadinCA11, has been reported as being potentially halophilic [70]. We believe that due to the low concentration of acetate, and high concentration of CO2 and H2, the candidate genus, vadinCA11, coupled with Methanoculleus, and replaced Methanosarcina (NC30; 2.96%) at the end of day 30 (Figure 4).
The Shannon index (alpha-diversity) of the bacterial community was higher in SB (4.64) than in the rest of the groups, indicating that SB had a higher diversity of bacterial species. However, PC (2.24) had higher diversity values in the archaeal community (Figure 5, Table S2). It has been reported that when wastewater sludge was used as inoculum and food waste as the substrate under thermophilic conditions, bacteria (3.47) showed a higher Shannon index than archaea (1.56) [71]. In addition, it has been suggested that a higher microbial diversity helps to stabilize the ecology and provides protection against toxic substances in the AD process [72].
The beta-diversity was measured by unweighted UniFrac analysis and plotted by PCoA for both the bacteria and archaea kingdoms (Figure 6). Interestingly, we found that LCP was distinctly separated from the rest of the group for both bacterial and archaeal communities. This suggests that the variation in the temperature for NC, PC, and SB changed the diversity of the bacterial and archaeal communities, whereas LCP remained separated due to no changes in the temperature. In addition, the predicted metabolic pathways showed a highly significant level of methane metabolism in the archaea compared to the bacteria (Figure 7 and Figure 8), enabling us to conclude that methanogenic archaea were enriched in our samples and significantly contributed to the production of methane during the AD process.
It was surprising that the compost leachate had many active anaerobic microorganisms, since this leachate comes from an aerobic process. However, it has been reported that compost leachate may contain dissolved or suspended substances that were originally present in the compost piles [73]. In addition, it may be able to sustain large amounts of organic compounds that can be oxidized, which can reduce the dissolved oxygen in the piles, and produce an anaerobic environment [73]. Similarly, it has been found that compost piles during the hot rot phase have a high number of methanogenic organisms (107–108 cells/g fresh weight), and these microorganisms can be washed away and moved to the compost leachate [74]. This could be the reason why we found anaerobes and methanogens in the leachate.

5. Conclusions

This study showed that the leachate from the composting plant, Bordo Poniente, can be used as a potential inoculum for the treatment of OFMSW through a thermophilic AD process, since it contains many active bacteria and methanogenic archaea. Even if the methane yield obtained was lower than expected (0.16 m3/kg VSadded), different techniques can be explored in order to increase this value, e.g., the use of co-digestion or bioaugmentation. However, a parameter that must be measured for future work is the determination of lignocellulosic compounds and their influence in methane production.
A positive side of this work is that we provided scientific evidence for the valorization of compost leachate. Considering that Mexico City does not yet have an anaerobic digester, this work could be relevant for the use of a leachate as a possible inoculum, and is essential for the startup of any reactor. In addition, this leachate contains an active microbial consortium which is adapted to the OFMSW of Mexico City.

Supplementary Materials

The following are available online at https://0-www-mdpi-com.brum.beds.ac.uk/1996-1073/12/12/2343/s1, Table S1: 16S rDNA primers for high throughput sequencing for bacteria and archaea; Table S2: Alpha diversity of bacteria and archaea; Figure S1. Map of the 16S rDNA gene and primer’s positions of the Methanoculleus horonobensis GenBank AB436897.2. The primer Arc787F shows the sequence of forward primer (positions 716-735) and reverse Arc1059R primer (971–986); Figure S2: Relative abundance (%) of bacterial class in the leachate (LCP), inoculum (INCP; day 1), and treatment groups (NC—negative control; PC—positive control; SB—substrate; 17-on 17 days; 30-on 30 days).

Author Contributions

Conceptualization, G.L.J., J.G.-M., M.E.G.C., and L.R.T.G.; data curation, A.K.G.B., D.A.S.S., G.L.J., K.N., and S.M.; formal analysis, A.K.G.B., D.A.S.S., G.L.J., K.N., S.M., J.G.-M., M.E.G.C., and L.R.T.G.; funding acquisition, J.G.-M. and L.R.T.G.; investigation, A.K.G.B., D.A.S.S., G.L.J., J.G.-M., M.E.G.C., and L.R.T.G.; methodology, A.K.G.B., D.A.S.S., G.L.J., J.G.-M., M.E.G.C., and L.R.T.G.; project administration, L.R.T.G.; resources, G.L.J., J.G.-M., M.E.G.C., and L.R.T.G.; software, J.G.M.; supervision, L.R.T.G.; validation, A.K.G.B., D.A.S.S., G.L.J., J.G.-M., M.E.G.C., and L.R.T.G.; visualization, A.K.G.B.; writing—original draft, A.K.G.B. and L.R.T.G.; writing—review and editing, A.K.G.B., D.A.S.S., G.L.J., K.N., S.M., J.G.-M., M.E.G.C., and L.R.T.G.

Funding

This research was funded by CIIEMAD IPN SIP 20160235; CIIEMAD IPN SIP 2017018 and SECITI 065 2016 to L.R.T.G., CONACyT 163235 INFR-2011-01 to J.G.M., and CONACyT 700337 M. Sc. Fellowship granted to A.K.G.B.

Acknowledgments

We thank Alberto Piña-Escobedo for high-throughput DNA sequencing, and Rodrigo García-Gutiérrez for technical support. Ruth Itzel Meraz López, Mariana Maya Orihuela, and Inés Ivonne Castillo Delgadillo for the experimental assistance. Claudia Rodríguez Tapia and Viridiana Rosas Ocegueda for administrative support.

Conflicts of Interest

The authors declare no conflict of interest.

References

  1. Martin-Ryals, A.; Schideman, L.; Li, P.; Wilkinson, H.; Wagner, R. Improving anaerobic digestion of a cellulosic waste via routine bioaugmentation with cellulolytic microorganisms. Bioresour. Technol. 2015, 189, 62–70. [Google Scholar] [CrossRef] [PubMed]
  2. Hoornweg, D.; Bhada, P. What a Waste. A Global Review of Solid Waste Management; World Bank Group: Washington, DC, USA, 2012; p. 44. [Google Scholar]
  3. Hettiarachchi, H.; Ryu, S.; Caucci, S.; Silva, R. Municipal Solid Waste Management in Latin America and the Caribbean: Issues and Potential Solutions from the Governance Perspective. Recycling 2018, 3, 19. [Google Scholar] [CrossRef]
  4. Hettiarachchi, H.; Meegoda, J.N.; Ryu, S. Organic Waste Buyback as a Viable Method to Enhance Sustainable Municipal Solid Waste Management in Developing Countries. Int. J. Environ. Res. Public Health 2018, 15, 2483. [Google Scholar] [CrossRef]
  5. Roubík, H.; Mazancová, J.; Le Dinh, P.; Dinh Van, D.; Banout, J. Biogas quality across small-scale biogas plants: A case of Central Vietnam. Energies 2018, 11, 1794. [Google Scholar] [CrossRef]
  6. Ghesla, P.L.; Gomes, L.P.; Caetano, M.O.; Miranda, L.A.S.; Dai-Prá, L.B. Municipal solid waste management from the experience of São Leopoldo/Brazil and Zurich/Switzerland. Sustain. 2018, 10. [Google Scholar] [CrossRef]
  7. Gaceta Oficial de la Ciudad de México. Programa de Gestión Integral de los Residuos Sólidos para la Ciudad de México 2016–2020. 2016, 3–62. Available online: https://data.consejeria.cdmx.gob.mx/portal_old/uploads/gacetas/e2fbcdaadd9665d726ee6bd2195eb913.pdf (accessed on 17 May 2018).
  8. Garcia-Peña, E.I.; Parameswaran, P.; Kang, D.W.; Canul-Chan, M.; Krajmalnik-Brown, R. Anaerobic digestion and co-digestion processes of vegetable and fruit residues : Process and microbial ecology. Bioresour. Technol. 2011, 102, 9447–9455. [Google Scholar] [CrossRef] [PubMed]
  9. Lv, W.; Schanbacher, F.L.; Yu, Z. Putting microbes to work in sequence: Recent advances in temperature-phased anaerobic digestion processes. Bioresour. Technol. 2010, 101, 9409–9414. [Google Scholar] [CrossRef] [PubMed]
  10. Phun, C.; Bong, C.; Yee, L.; Tin, C. The characterisation and treatment of food waste for improvement of biogas production during anaerobic digestion - A review. J. Clean. Prod. 2018, 172, 1545–1558. [Google Scholar] [CrossRef]
  11. Ariunbaatar, J.; Ozcan, O.; Bair, R.; Esposito, G.; Ball, R.; Lens, P.N.L.; Yeh, D.H. Bioaugmentation of the anaerobic digestion of food waste by dungs of herbivore, carnivore, and omnivore zoo animals. Environ. Technol. 2017, 39, 516–526. [Google Scholar] [CrossRef]
  12. Lim, J.W.; Chen, C.L.; Ho, I.J.R.; Wang, J.Y. Study of microbial community and biodegradation efficiency for single- and two-phase anaerobic co-digestion of brown water and food waste. Bioresour. Technol. 2013, 147, 193–201. [Google Scholar] [CrossRef]
  13. Wei, S. The application of biotechnology on the enhancing of biogas production from lignocellulosic waste. Appl. Microbiol. Biotechnol. 2016, 100, 9821–9836. [Google Scholar] [CrossRef] [PubMed]
  14. Wang, P.; Wang, H.; Qiu, Y.; Ren, L.; Jiang, B. Microbial characteristics in anaerobic digestion process of food waste for methane production–A review. Bioresour. Technol. 2018, 248, 29–36. [Google Scholar] [CrossRef] [PubMed]
  15. Venkiteshwaran, K.; Bocher, B.; Maki, J.; Zitomer, D. Relating Anaerobic Digestion Microbial Community and Process Function. Microbiol. Insights 2015, 8, 37–44. [Google Scholar] [CrossRef] [PubMed]
  16. Boon, N. Inoculum selection is crucial to ensure operational stability in anaerobic digestion. Appl. Microbiol. Biotechnol. 2014, 99, 189–199. [Google Scholar] [CrossRef]
  17. Koch, K.; Lippert, T.; Drewes, J.E. The role of inoculum’s origin on the methane yield of different substrates in biochemical methane potential (BMP) tests. Bioresour. Technol. 2017, 243, 457–463. [Google Scholar] [CrossRef] [PubMed]
  18. Dhamodharan, K.; Kumar, V.; Kalamdhad, A.S. Effect of different livestock dungs as inoculum on food waste anaerobic digestion and its kinetics. Bioresour. Technol. 2015, 180, 237–241. [Google Scholar] [CrossRef]
  19. Mo, Y.; Min, H.; Lee, K.; Chantrasakdakul, P.; Kim, D.; Young, K. Changes in bacterial and archaeal communities in anaerobic digesters treating different organic wastes. Chemosphere 2015, 141, 134–137. [Google Scholar] [CrossRef]
  20. Yu, Z.; Li, Y. Comparison of different liquid anaerobic digestion effluents as inocula and nitrogen sources for solid state anaerobic digestion of corn stover. Waste Manag. 2015, 33, 26–32. [Google Scholar] [CrossRef]
  21. Zamanzadeh, M.; Hagen, L.H.; Svensson, K.; Linjordet, R.; Horn, S.J. Anaerobic digestion of food waste - Effect of recirculation and temperature on performance and microbiology. Water Res. 2016, 96, 246–254. [Google Scholar] [CrossRef]
  22. Zhou, S.; Nikolausz, M.; Zhang, J.; Riya, S.; Terada, A.; Hosomi, M. Variation of the microbial community in thermophilic anaerobic digestion of pig manure mixed with different ratios of rice straw. J. Biosci. Bioeng. 2016, 122, 334–340. [Google Scholar] [CrossRef]
  23. Ghanimeh, S.; El-Fadel, M.; Saikaly, P. Improving the stability of thermophilic anaerobic digesters treating SS-OFMSW through enrichment with compost and leachate seeds. Bioresour. Technol. 2013, 131, 53–59. [Google Scholar] [CrossRef] [PubMed]
  24. Guven, H.; Akca, M.S.; Iren, E.; Keles, F.; Ozturk, I.; Altinbas, M. Co-digestion performance of organic fraction of municipal solid waste with leachate: Preliminary studies. Waste Manag. 2018, 71, 775–784. [Google Scholar] [CrossRef] [PubMed]
  25. Eslami, H.; Hashemi, H.; Fallahzadeh, R.A.; Khosravi, R.; Fard, R.F.; Ebrahimi, A.A. Effect of organic loading rates on biogas production and anaerobic biodegradation of composting leachate in the anaerobic series bioreactors. Ecol. Eng. 2018, 110, 165–171. [Google Scholar] [CrossRef]
  26. Ming, L.; Xuya, P.; Youcai, Z.; Wenchuan, D.; Huashuai, C.; Guotao, L.; Zhengsong, W. Microbial inoculum with leachate recirculated cultivation for the enhancement of OFMSW composting. J. Hazard. Mater. 2008, 153, 885–891. [Google Scholar] [CrossRef] [PubMed]
  27. Ramos, P.L.; Kondo, M.Y.; Santos, S.M.B.; de Vasconcellos, S.P.; Rocha, R.C.S.; da Cruz, J.B.; Eugenio, P.F.M.; Cabral, H.; Juliano, M.A.; Juliano, L.; et al. A Tropical Composting Operation Unit at São Paulo Zoo as a Source of Bacterial Proteolytic Enzymes. Appl. Biochem. Biotechnol. 2019, 187, 282–297. [Google Scholar] [CrossRef] [PubMed]
  28. PAOT. Diagnóstico actual del flujo de residuos sólidos urbanos que se genera en el Distrito Federal 2011, 123. Available online: http://centro.paot.org.mx/documentos/paot/estudios/flujo_residuos_DF.pdf (accessed on 29 May 2019).
  29. Li, Y.; Nelson, M.C.; Chen, P. Comparison of the microbial communities in solid-state anaerobic digestion ( SS-AD ) reactors operated at mesophilic and thermophilic temperatures. Appl. Microbiol. Biotechnol. 2015, 99, 969–980. [Google Scholar] [CrossRef]
  30. Shi, J.; Wang, Z.; Stiverson, J.A.; Yu, Z.; Li, Y. Reactor performance and microbial community dynamics during solid-state anaerobic digestion of corn stover at mesophilic and thermophilic conditions. Bioresour. Technol. 2013, 136, 574–581. [Google Scholar] [CrossRef] [PubMed]
  31. Zhang, J.; Lv, C.; Tong, J.; Liu, J.; Liu, J.; Yu, D.; Wang, Y.; Chen, M.; Wei, Y. Optimization and microbial community analysis of anaerobic co-digestion of food waste and sewage sludge based on microwave pretreatment. Bioresour. Technol. 2016, 200, 253–261. [Google Scholar] [CrossRef]
  32. Angelidaki, I.; Alves, M.; Bolzonella, D.; Borzacconi, L.; Campos, J.L.; Guwy, A.J.; Kalyuzhnyi, S.; Jenicek, P.; Van Lier, J.B. Defining the biomethane potential (BMP) of solid organic wastes and energy crops: A proposed protocol for batch assays. Water Sci. Technol. 2009, 59, 927–934. [Google Scholar] [CrossRef]
  33. Sadzawka, A.; Carrasco, M.A.; Grez, R.; Mora, M.d.l.L. Métodos de análisis de compost; Instituto de Investigaciones Agropecuarias, INIA: Santiago, Chile, 2015. [Google Scholar]
  34. Tale, V.P.; Maki, J.S.; Zitomer, D.H. Bioaugmentation of overloaded anaerobic digesters restores function and archaeal community. Water Res. 2015, 70, 138–147. [Google Scholar] [CrossRef] [Green Version]
  35. Williams, C.M.; Shih, J.C.H. Enumeration of some microbial groups in thermophilic poultry waste digesters and enrichment of a feather-degrading culture. J. Appl. Bacteriol. 1989, 67, 25–35. [Google Scholar] [CrossRef]
  36. Murugesan, S.; Ulloa-Martínez, M.; Martínez-Rojano, H.; Galván-Rodríguez, F.M.; Miranda-Brito, C.; Romano, M.C.; Piña-Escobedo, A.; Pizano-Zárate, M.L.; Hoyo-Vadillo, C.; García-Mena, J. Study of the diversity and short-chain fatty acids production by the bacterial community in overweight and obese Mexican children. Eur. J. Clin. Microbiol. Infect. Dis. 2015, 34, 1337–1346. [Google Scholar] [CrossRef] [PubMed]
  37. Maspolim, Y.; Zhou, Y.; Guo, C.; Xiao, K.; Jern, W. Comparison of single-stage and two-phase anaerobic sludge digestion systems – Performance and microbial community dynamics. Chemosphere 2015, 140, 54–62. [Google Scholar] [CrossRef] [PubMed]
  38. Shin, S.G.; Han, G.; Lim, J.; Lee, C.; Hwang, S. A comprehensive microbial insight into two-stage anaerobic digestion of food waste-recycling wastewater. Water Res. 2010, 44, 4838–4849. [Google Scholar] [CrossRef] [PubMed]
  39. Murugesan, S.; Reyes-Mata, M.P.; Nirmalkar, K.; Chavez-Carbajal, A.; Juárez-Hernández, J.I.; Torres-Gómez, R.E.; Piña-Escobedo, A.; Maya, O.; Hoyo-Vadillo, C.; Ramos-Ramírez, E.G.; et al. Profiling of bacterial and fungal communities of Mexican cheeses by high throughput DNA sequencing. Food Res. Int. 2018, 113, 371–381. [Google Scholar] [CrossRef] [PubMed]
  40. García-Mena, J.; Murugesan, S.; Pérez-Muñoz, A.A.; García-Espitia, M.; Maya, O.; Jacinto-Montiel, M.; Monsalvo-Ponce, G.; Piña-Escobedo, A.; Domínguez-Malfavón, L.; Gómez-Ramírez, M.; et al. Airborne Bacterial Diversity from the Low Atmosphere of Greater Mexico City. Microb. Ecol. 2016, 72, 70–84. [Google Scholar] [CrossRef] [PubMed]
  41. Caporaso, J.G.; Kuczynski, J.; Stombaugh, J.; Bittinger, K.; Bushman, F.D.; Costello, E.K.; Fierer, N.; Peña, A.G.; Goodrich, J.K.; Gordon, J.I.; et al. QIIME allows analysis of high- throughput community sequencing data. Nat. Methods 2010, 7, 335–336. [Google Scholar] [CrossRef] [PubMed]
  42. McMurdie, P.J.; Holmes, S. Phyloseq: An R Package for Reproducible Interactive Analysis and Graphics of Microbiome Census Data. PLoS One 2013, 8, 1–11. [Google Scholar] [CrossRef] [PubMed]
  43. Chávez-Carbajal, A.; Nirmalkar, K.; Pérez-Lizaur, A.; Hernández-Quiroz, F.; Ramírez-del-Alto, S.; García-Mena, J.; Hernández-Guerrero, C. Gut Microbiota and Predicted Metabolic Pathways in a Sample of Mexican Women Affected by Obesity and Obesity Plus Metabolic Syndrome. Int. J. Mol. Sci. 2019, 20, 438. [Google Scholar] [CrossRef]
  44. Tyagi, V.K.; Fdez-Güelfo, L.A.; Zhou, Y.; Álvarez-Gallego, C.J.; Garcia, L.I.R.; Ng, W.J. Anaerobic co-digestion of organic fraction of municipal solid waste (OFMSW): Progress and challenges. Renew. Sustain. Energy Rev. 2018, 93, 380–399. [Google Scholar] [CrossRef]
  45. Campuzano, R.; Gonzalez-Martinez, S. Characteristics of the organic fraction of municipal solid waste and methane production: A review. Waste Manag. 2016, 54, 3–12. [Google Scholar] [CrossRef] [PubMed]
  46. Campuzano, R.; González-Martínez, S. Extraction of soluble substances from organic solid municipal waste to increase methane production. Bioresour. Technol. 2015, 178, 247–253. [Google Scholar] [CrossRef] [PubMed]
  47. Xu, F.; Li, Y.; Ge, X.; Yang, L.; Li, Y. Anaerobic digestion of food waste – Challenges and opportunities. Bioresour. Technol. 2018, 247, 1047–1058. [Google Scholar] [CrossRef] [PubMed]
  48. Labatut, R.A.; Angenent, L.T.; Scott, N.R. Biochemical methane potential and biodegradability of complex organic substrates. Bioresour. Technol. 2011, 102, 2255–2264. [Google Scholar] [CrossRef] [PubMed]
  49. Moset, V.; Poulsen, M.; Højberg, O.; Møller, H.B. Mesophilic versus thermophilic anaerobic digestion of cattle manure : methane productivity and microbial ecology. Microb. Biotechnol. 2015, 8, 787–800. [Google Scholar] [CrossRef] [PubMed]
  50. Riya, S.; Suzuki, K.; Meng, L.; Zhou, S.; Terada, A.; Hosomi, M. The influence of the total solid content on the stability of dry-thermophilic anaerobic digestion of rice straw and pig manure. Waste Manag. 2018, 76, 350–356. [Google Scholar] [CrossRef]
  51. Forster-Carneiro, T.; Pérez, M.; Romero, L.I.; Sales, D. Dry-thermophilic anaerobic digestion of organic fraction of the municipal solid waste: Focusing on the inoculum sources. Bioresour. Technol. 2007, 98, 3195–3203. [Google Scholar] [CrossRef]
  52. Suksong, W.; Mamimin, C.; Prasertsan, P.; Kongjan, P.; O-Thong, S. Effect of inoculum types and microbial community on thermophilic and mesophilic solid-state anaerobic digestion of empty fruit bunches for biogas production. Ind. Crops Prod. 2019, 133, 193–202. [Google Scholar] [CrossRef]
  53. Raposo, F.; Fernández-Cegrí, V.; de la Rubia, M.A.; Borja, R.; Béline, F.; Cavinato, C.; Demirer, G.; Fernández, B.; Fernández-Polanco, M.; Frigon, J.C.; et al. Biochemical methane potential (BMP) of solid organic substrates: Evaluation of anaerobic biodegradability using data from an international interlaboratory study. J. Chem. Technol. Biotechnol. 2011, 86, 1088–1098. [Google Scholar] [CrossRef]
  54. Li, W.; Khalid, H.; Zhu, Z.; Zhang, R.; Liu, G.; Chen, C.; Thorin, E. Methane production through anaerobic digestion: Participation and digestion characteristics of cellulose, hemicellulose and lignin. Appl. Energy 2018, 226, 1219–1228. [Google Scholar] [CrossRef]
  55. Martín-González, L.; Castro, R.; Pereira, M.A.; Alves, M.M.; Font, X.; Vicent, T. Thermophilic co-digestion of organic fraction of municipal solid wastes with FOG wastes from a sewage treatment plant : Reactor performance and microbial community monitoring. Bioresour. Technol. 2011, 102, 4734–4741. [Google Scholar] [CrossRef] [PubMed]
  56. Zhu, X.; Treu, L.; Kougias, P.G.; Campanaro, S.; Angelidaki, I. Converting mesophilic upflow sludge blanket (UASB) reactors to thermophilic by applying axenic methanogenic culture bioaugmentation. Chem. Eng. J. 2018, 332, 508–516. [Google Scholar] [CrossRef] [Green Version]
  57. Strang, O.; Ács, N.; Wirth, R.; Maróti, G.; Bagi, Z.; Rákhely, G.; Kovács, K.L. Bioaugmentation of the thermophilic anaerobic biodegradation of cellulose and corn stover. Anaerobe 2017, 46, 104–113. [Google Scholar] [CrossRef] [PubMed]
  58. Weiss, A.; Jérôme, V.; Freitag, R.; Mayer, H.K. Diversity of the resident microbiota in a thermophilic municipal biogas plant. Appl. Microbiol. Biotechnol. 2008, 81, 163–173. [Google Scholar] [CrossRef] [PubMed]
  59. Goux, X.; Calusinska, M.; Fossépré, M.; Benizri, E.; Delfosse, P. Start-up phase of an anaerobic full-scale farm reactor - Appearance of mesophilic anaerobic conditions and establishment of the methanogenic microbial community. Bioresour. Technol. 2016, 212, 217–226. [Google Scholar] [CrossRef]
  60. Sun, W.; Yu, G.; Louie, T.; Liu, T.; Zhu, C.; Xue, G.; Gao, P. From mesophilic to thermophilic digestion: the transitions of anaerobic bacterial, archaeal, and fungal community structures in sludge and manure samples. Appl. Microbiol. Biotechnol. 2015, 99, 10271–10282. [Google Scholar] [CrossRef]
  61. Ritari, J.; Koskinen, K.; Hultman, J.; Kurola, J.M.; Kymäläinen, M.; Romantschuk, M.; Paulin, L.; Auvinen, P. Molecular analysis of meso- and thermophilic microbiota associated with anaerobic biowaste degradation. BMC Microbiol. 2012, 12, 1–14. [Google Scholar] [CrossRef]
  62. Heeg, K.; Pohl, M.; Sontag, M.; Mumme, J.; Klocke, M.; Nettmann, E. Microbial communities involved in biogas production from wheat straw as the sole substrate within a two-phase solid-state anaerobic digestion. Syst. Appl. Microbiol. 2014, 37, 590–600. [Google Scholar] [CrossRef]
  63. Guo, X.; Wang, C.; Sun, F.; Zhu, W.; Wu, W. A comparison of microbial characteristics between the thermophilic and mesophilic anaerobic digesters exposed to elevated food waste loadings. Bioresour. Technol. 2014, 152, 420–428. [Google Scholar] [CrossRef]
  64. Di Maria, F.; Barratta, M.; Bianconi, F.; Placidi, P.; Passeri, D. Solid anaerobic digestion batch with liquid digestate recirculation and wet anaerobic digestion of organic waste: Comparison of system performances and identification of microbial guilds. Waste Manag. 2017, 59, 172–180. [Google Scholar] [CrossRef]
  65. Tsapekos, P.; Kougias, P.G.; Vasileiou, S.A.; Treu, L.; Campanaro, S.; Lyberatos, G.; Angelidaki, I. Bioaugmentation with hydrolytic microbes to improve the anaerobic biodegradability of lignocellulosic agricultural residues. Bioresour. Technol. 2017, 234, 350–359. [Google Scholar] [CrossRef] [PubMed]
  66. Amha, Y.M.; Anwar, M.Z.; Brower, A.; Jacobsen, C.S.; Stadler, L.B.; Webster, T.M.; Smith, A.L. Inhibition of anaerobic digestion processes: Applications of molecular tools. Bioresour. Technol. 2018, 247, 999–1014. [Google Scholar] [CrossRef] [PubMed]
  67. Nguyen, D.; Khanal, S.K. A little breath of fresh air into an anaerobic system: How microaeration facilitates anaerobic digestion process. Biotechnol. Adv. 2018, 36, 1971–1983. [Google Scholar] [CrossRef] [PubMed]
  68. Demirel, B.; Scherer, P. The roles of acetotrophic and hydrogenotrophic methanogens during anaerobic conversion of biomass to methane: A review. Rev. Environ. Sci. Biotechnol. 2008, 7, 173–190. [Google Scholar] [CrossRef]
  69. Venkiteshwaran, K.; Milferstedt, K.; Hamelin, J.; Zitomer, D.H. Anaerobic digester bioaugmentation influences quasi steady state performance and microbial community. Water Res. 2016, 104, 128–136. [Google Scholar] [CrossRef] [PubMed] [Green Version]
  70. Goux, X.; Calusinska, M.; Lemaigre, S.; Marynowska, M.; Klocke, M.; Udelhoven, T.; Benizri, E.; Delfosse, P. Microbial community dynamics in replicate anaerobic digesters exposed sequentially to increasing organic loading rate, acidosis, and process recovery. Biotechnol. Biofuels 2015, 8, 122. [Google Scholar] [CrossRef] [PubMed]
  71. Wu, B.; Wang, X.; Deng, Y.; He, X.; Li, Z.; Li, Q.; Chen, J.; He, M.; Zhang, M.; Hu, G.; et al. Adaption of microbial community during the start- up stage of a thermophilic anaerobic digester treating food waste. Biosci. Biotechnol. Biochem. 2016, 80, 2025–2032. [Google Scholar] [CrossRef] [PubMed]
  72. Zhang, J.; Li, W.; Lee, J.; Loh, K.-C.; Dai, Y.; Tong, Y.W. Enhancement of biogas production in anaerobic co-digestion of food waste and waste activated sludge by biological co-pretreatment. Energy 2017, 1–8. [Google Scholar] [CrossRef]
  73. Brown, K.; Ghoshdastidar, A.J.; Hanmore, J.; Frazee, J.; Tong, A.Z. Membrane bioreactor technology: A novel approach to the treatment of compost leachate. Waste Manag. 2013, 33, 2188–2194. [Google Scholar] [CrossRef]
  74. Neumann, L.; Scherer, P. Impact of bioaugmentation by compost on the performance and ecology of an anaerobic digester fed with energy crops. Bioresour. Technol. 2011, 102, 2931–2935. [Google Scholar] [CrossRef]
Figure 1. Cumulative biogas generation and methane composition during the thermophilic anaerobic digestion. The experiments were done in triplicate and values are shown as the mean ± standard deviation. The dark purple colored line and the green dots correspond to the positive control, PC, while the yellow line and the pink dots correspond to the substrate, SB.
Energies 12 02343 g001
Figure 2. Relative abundance (%) of bacterial phyla in the leachate (LCP), inoculum (INCP; day 1), and treatment groups (NC—negative control; PC—positive control; SB—substrate; 17-on 17 days; 30-on 30 days).
Energies 12 02343 g002
Figure 3. Relative abundance (%) of different levels of bacterial taxa in the leachate (LCP), inoculum (INCP), and treatment groups (NC—negative control; PC—positive control; SB—substrate; 17-on 17 days; 30-on 30 days).
Energies 12 02343 g003
Figure 4. Relative abundance (%) of archaeal genera in the leachate (LCP), inoculum (INCP), and treatment groups (NC—negative control; PC—positive control; SB—substrate; 17-on 17 days; 30-on 30 days).
Energies 12 02343 g004
Figure 5. Alpha-diversity of the bacteria (A) and archaea (B) in the leachate (LCP), inoculum (INCP), and treatment groups (NC, PC, and SB).
Energies 12 02343 g005
Figure 6. Beta-diversity of the bacteria (A) and archaea (B) in the leachate (LCP), inoculum (INCP), and treatment groups (NC, PC, and SB). Three different axes, PC1, PC2, and PC3, show the total percentage of dissimilarity.
Energies 12 02343 g006
Figure 7. Prediction of metabolic pathways in the archaea. This figure shows the predicted metabolic pathway between: (A) The inoculum (INCP) and negative control at the 17th day (NC17); (B) inoculum (INCP) and positive control at the 17th day (PC17); (C) inoculum (INCP) and substrate at the 17th day (SB17). The x-axis shows the predicted metabolic pathways; the y-axis indicates the proportion of sequences as a percentage (%). The star (*) represents the statistical difference between samples with at least p < 0.05, and q < 0.05 using Benjamini-Hochberg correction.
Energies 12 02343 g007
Figure 8. Prediction of metabolic pathways in the bacteria. This figure shows the predicted metabolic pathway between: (A) The inoculum (INCP) and negative control at the 17th day (NC17); (B) inoculum (INCP) and positive control at the 17th day (PC17); (C) inoculum (INCP) and substrate at the 17th day (SB17). The x-axis shows the predicted metabolic pathways; the y-axis indicates the proportion of sequences as a percentage (%). The star (*) represents the statistical difference between samples with at least p < 0.05, and q < 0.05 using Benjamini-Hochberg correction.
Energies 12 02343 g008
Table 1. Chemical characteristics of the substrate, leachate, and inoculum.
ParametersOFMSWLCPINCP
pH4.55 ± 0.056.89 ± 0.038.33 ± 0.01
ORP (mV)47.00 ± 1.73−284.00 ± 3.61−335.67 ± 3.79
EC (mS/cm)17.42 ± 0.9233.35 ± 0.0534.77 ± 0.26
TS (g/kg)288.57 ± 34.7056.40 ± 2.5647.70 ± 6.17
VS (g/kg)232.44 ± 28.1429.75 ± 1.3323.53 ± 3.30
VS/TS ratio (%)80.54 ± 0.1452.76 ± 0.2249.29 ± 1.26
OFMSW: organic fraction of municipal solid waste; LCP: leachate composting plant; INCP: inoculum composting plant. ORP: oxidation-reduction potential; EC: electric conductivity; TS: total solids; VS: volatile solids. The value of VS reduction (%) is the diminution after 15 days of the incubation of the leachate.
Table 2. Chemical characteristic of the treatments at day 30.
ParametersNC30PC30SB30p Value
pH8.51 ± 0.127.98 ± 0.147.75 ± 0.160.001 a
ORP (mV)−366.00 ± 11.53−379.00 ± 9.00−378.67 ± 3.060.245 b
EC (mS/cm)32.17 ± 4.0434.16 ± 3.7740.80 ± 1.350.041 a
TS (g/kg)45.68 ± 0.7639.57 ± 0.7543.73 ± 7.080.258 a
VS (g/kg)13.90 ± 1.708.22 ± 0.4419.96 ± 1.780.004 b
VS/TS ratio30.41 ± 3.2320.78 ± 0.7346.01 ± 3.890.004 b
NC30: Negative control at the 30th day; PC30: Positive control at the 30th day; SB30: OFMSW and inoculum at the 30th day. ORP: oxidation-reduction potential; EC: electric conductivity; TS: total solids; VS: volatile solids. The p value is reported among the treatments and considered <0.05 as a significant difference, calculated by a one way analysis of variance; b Kruskal-Wallis one way analysis of variance on ranks.
Table 3. Counting groups of bacteria at mesophilic and thermophilic conditions.
Mesophilic (CFU/mL)Thermophilic (MPN/mL)
LCPINCPTreatmentsDay 17Day 30LCPINCPTreatmentsDay 17Day 30
TAB6.4 × 1055.9 × 105NC3.7 × 1045.3 × 1054.3 × 1044.3 × 104NC9.5 × 1042.9 × 103
PC3.5 × 1043.2 × 105PC2.4 × 1051.5 × 104
SB3.7 × 1042.8 × 105SB2.4 × 1051.6 × 103
CA4.6 × 1068.9 × 104NC9.1 × 1046.9 × 106351.1 × 103NC3.5 × 1033.5 × 103
PC4.9 × 1071.5 × 105PC3.5 × 1032.1 × 104
SB6.1 × 1068.2 × 104SB1.5 × 1032.0 × 103
TAB: total aerobic bacteria; CA: cellulolytic bacteria; CFU: colony-forming unit; MPN: most probable number; LCP: leachate composting plant; INCP: inoculum composting plant (day 1).; NC: negative control; PC: positive control; SB: substrate.
Table 4. Most abundant bacteria.
SampleTaxa (%)
LCPg_Bacteroides (40.29)f_Porphyromonadaceae (18.59)g_Acidaminococcus (3.35)f_Lachnospiraceae (2.48)Others (35.30)
INCPo_MBA08 (47.07)c_OPB54 (6.95)o_ML615J-2 (5.59)g_Acinetobacter (4.86)Others (35.52)
NC17g_Acinetobacter (36.25)o_MBA08 (10.65)g_S1 (4.91)f_Porphyromonadaceae (3.90)Others (44.28)
NC30o_MBA08 (46.02)g_S1 (5.31)c_OPB54 (4.58)f_Porphyromonadaceae (4.21)Others (39.88)
PC17f_Lachnospiraceae (42.57)f_Halanaerobiaceae (11.03)o_MBA08 (8.71)f_Ruminococcaceae (6.07)Others (31.63)
PC30g_Bacteroides (26.82)f_S24-7 (13.61)f_Ruminococcaceae (10.21)f_Lachnospiraceae (5.38)Others (39.03)
SB17f_Pseudomonadaceae (18.73)o_MBA08 (13.60)o_OPB54 (8.13)c_OPB54 (6.19)Others (53.35)
SB30o_MBA08 (30.29)o_OPB54 (8.66)o_Bacteroidales (8.00)f_Halanaerobiaceae (5.17)Others (47.88)
%, percentage of relative abundance. LCP: leachate composting plant; INCP: Inoculum composting plant; NC17: Negative control at the 17th day; NC30: Negative control at the 30th day; PC17: Positive control at the 17th day; PC30: Positive control at the 30th day; SB17: Substrate at the 17th day; SB30: Substrate at the 30th day. “Others” represents a group of taxa with less than the lowest percentage (%) shown for the corresponding sample.
Table 5. Most abundant archaea.
SampleTaxa (%)
LCPg_Methanosarcina (81.09)g_Methanobrevibacter (16.10)g_Methanoculleus (0.63)Others (2.17)
INCPg_Methanoculleus (77.28)g_Methanosarcina (15.42)g_Methanomassiliicoccus (3.33)Others (7.30)
NC17g_vadinCA11 (54.08)g_Methanoculleus (35.87)g_Methanobrevibacter (3.47)Others (6.58)
NC30g_vadinCA11 (65.45)g_Methanoculleus (25.60)g_Methanosarcina (2.9681.09)Others (6.00)
PC17g_Methanoculleus (92.57)g_vadinCA11 (4.19)g_Methanosarcina (1.62)Others (1.61)
PC30g_Methanoculleus (75.07)g_Methanothermobacter (11.35)g_vadinCA11 (7.22)Others (6.35)
SB17g_Methanoculleus (91.67)g_Methanosarcina (3.71)g_vadinCA11 (2.44)Others (2.17)
SB30g_Methanoculleus (59.79)g_vadinCA11 (29.24)g_Methanosarcina (5.55)Others (5.42)
%, percentage of relative abundance. LCP: leachate composting plant; INCP: Inoculum composting plant; NC17: Negative control at the 17th day; NC30: Negative control at the 30th day; PC17: Positive control at the 17th day; PC30: Positive control at the 30th day; SB17: Substrate at the 17th day; SB30: Substrate at the 30th day. “Others” represents a group of taxa with less than the lowest percentage (%) shown for the corresponding sample.

