DAG-Based Distributed Ledger for Low-Latency Smart Grid Network


School of Electrical Engineering, Korea University, Seoul 02841, Korea
*
Author to whom correspondence should be addressed.
Energies 2019, 12(18), 3570; https://0-doi-org.brum.beds.ac.uk/10.3390/en12183570
Submission received: 28 August 2019
/
Revised: 13 September 2019
/
Accepted: 16 September 2019
/
Published: 18 September 2019
(This article belongs to the Special Issue Real-time Communications for Smart Grids and Industry)
Abstract
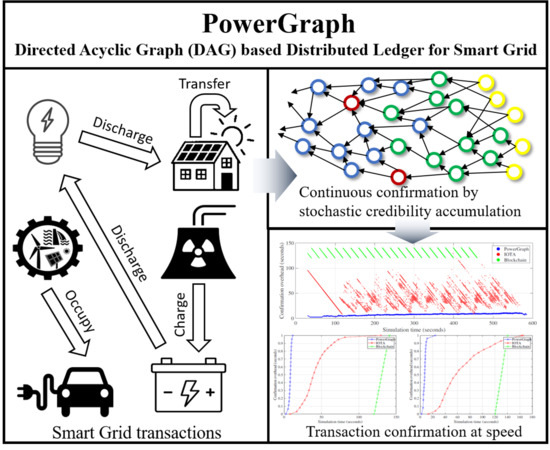
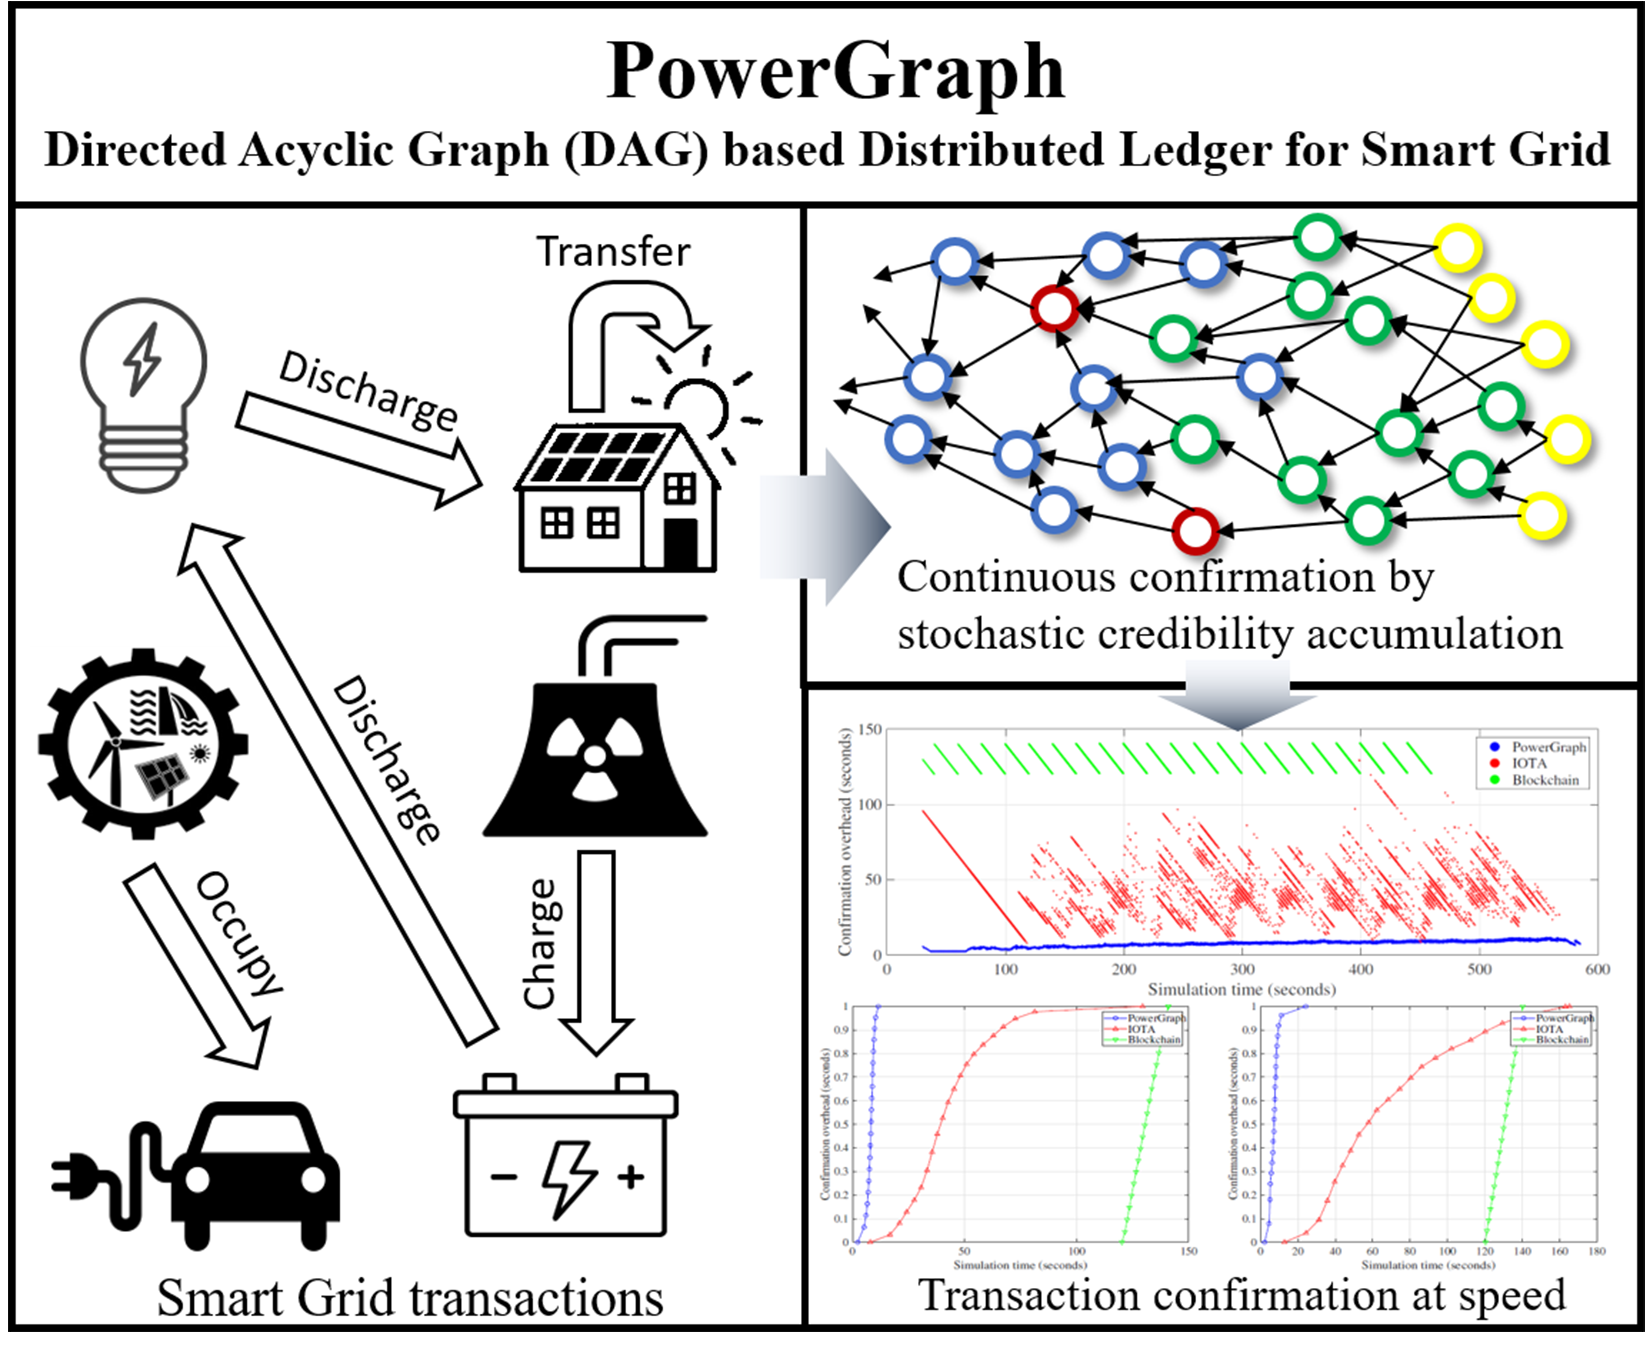
:In this paper, we propose a scheme that implements a Distributed Ledger Technology (DLT) based on Directed Acyclic Graph (DAG) to generate, validate, and confirm the electricity transaction in Smart Grid. The convergence of the Smart Grid and distributed ledger concept has recently been introduced. Since Smart Grids require a distributed network architecture for power distribution and trading, the Distributed Ledger-based Smart Grid design is a spotlighted research domain. However, only the Blockchain-based methods, which are a type of the distributed ledger scheme, are currently either being considered or adopted in the Smart Grid. Due to computation-intensive consensus schemes such as Proof-of-Work and discrete block generation, Blockchain-based distributed ledger systems suffer from efficiency and latency issues. We propose a DAG-based distributed ledger for Smart Grids, called PowerGraph, to resolve this problem. Since a DAG-based distributed ledger does not need to generate blocks for confirmation, each transaction of the PowerGraph undergoes the validation and confirmation process individually. In addition, transactions in PowerGraph are used to keep track of the energy trade and include various types of transactions so that they can fully encompass the events in the Smart Grid network. Finally, to ensure that PowerGraph maintains a high performance, we modeled the PowerGraph performance and proposed a novel consensus algorithm that would result in the rapid confirmation of transactions. We use numerical evaluations to show that PowerGraph can accelerate the transaction processing speed by over 5 times compared to existing DAG-based DLT system.
1. Introduction
Distributed Ledger Technology (DLT) has been introduced to drive the consensus of geographically distributed, replicated, shared, and synchronized data across multiple locations. In addition, Smart Grid systems aiming at intelligent power trade have continuously evolved through the maturation of various communications and power distribution technologies [1]. As a convergence of these two technologies, DLT-based Smart Grid design is being actively studied in the power management technology domain. Smart Grid aims to achieve efficiency in power distribution and demand response through distributed energy resources, based on smarter metering and demand monitoring. Meanwhile, DLT has emerged to validate and store the digital data dispersed in the distributed network without authentication from a third-party or authority. Each concept grants opportunities not afforded to the former system. Smart Grid can lead to the efficient power distribution by the smarter components of a management system, which includes both providers and the customers; active communication between them enables a reasonable and satisfactory power trading. DLT alleviates the financial agent’s validation and storage costs, in addition to infrastructure maintenance expenditure. The DLT-based Smart Grid can resolve some of the challenges of a vertical power distribution structure based on a centralized payment system.
Smart Grid and DLT have been applied empirically to real environments, but not at a nationwide or worldwide scale. The reason for their lack of the expansion is their respective limitations. Although there has been research to enhance network performance [2,3,4] and security [5,6,7] in Smart Grids, centralized transaction validation limits the system’s performance. However, a DLT-based Smart Grid could complement each technology’s issues. Smart Grid suffers from the reliability and the security of the power distribution network and payment system. Even if a Smart Grid could improve the flexibility of power source choice and degrade the power loss rate, the instability of the network and the security threats in the payment system lead to a negative attitude among the national institutions such as governments. Distributed ledger technology that has been proved to be sufficiently stable can be smoothly applied to Smart Grid networks and resolve power trading communication issues. DLT has been repeatedly questioned about the system’s applicability; without a payment process, the lack of the motivation among the miners’ validation cannot be beneficial to a database’s reliability. DLT-based Smart Grid is an exemplary attempt to use the novel characteristics of the DLT, since the requirements of a Smart Grid such as payment process and distributed topology fit to the DLT environments.
A large amount of work about DLT-based Smart Grid has been published [8,9,10]; however, the specifics of such designs and the analyses were limited to Blockchain-based ones. Blockchain is a DLT concept where the network participants periodically validate a bundle of transactions, and one of the validation results is appended to the chain-shaped distributed database through consensus. Although the performance analysis and practical architecture of a Blockchain-based Smart Grid network could expect the aforementioned benefits such as security and reliability, the inherent features of a Blockchain would limit the performance of Smart Grid network. Since Blockchain network discretely performs the consensus operations on a set of the transactions, the confirmation of some power transactions could be delayed, which would lead to the performance degradation in some components requiring a real-time property, such as demand response or small-scale power monitoring. In addition, one of the commonly used and stable consensus schemes for Blockchain is Proof-of-Work (PoW), which consume massive computation power. Every miner in Blockchain network consumes its power to perform PoW and win the incentive, so this consensus scheme might be inappropriate for Smart Grid, which aims for the power efficiency. The other consensus schemes substituting the PoW have been addressed [11], but the security and centralization issues persistently threats the stability of the Blockchain systems.
As a solution for the challenges in DLT-based Smart Grid network, we propose a novel design called PowerGraph, which constructs a distributed ledger in a form of Direct Acyclic Graph (DAG). A DAG-based distributed ledger was suggested in [12] and several cryptocurrencies such as IOTA have been issued. DAG continuously uploads and validates each transaction separately, and subsequent transactions validate a subset of the previous transactions. Most notable feature of the DAG is that the transactions are individually confirmed in real time, without waiting for the block generation and elections. Furthermore, DAG normally deploys a minimum-PoW to decrease the overhead, so the computation power for the validation also greatly decreases. PowerGraph leverages the benefits of the DAG-based distributed ledger to achieve low-latency communication in Smart Grid network, as shown in Figure 1. We designed our novel consensus algorithm for less latency, and show the performance improvement by simulations.
2. PowerGraph Design
To guarantee the benefit by using DAG-based distributed ledger in Smart Grid network, some properties and details of the architecture should be properly migrated. Please note that existing DLT-based cryptocurrencies only confirm the balance of the currency transactions, since the actions costing the transactions such as offline trading or deliveries are usually managed by the existing ways. However, it is hardly feasible to deliver the power by hand, and separately running the validation systems for power distribution and cryptocurrency trading would be redundant. Thus, PowerGraph should embrace both the power and the cryptocurrency exchange network, which will result in an integrated database. The following subsections address the practical differences from the existing DLT, derive the PowerGraph design, and show the performance analysis.
2.1. Difference from the Cryptocurrency Exchange
The observations and discussions while designing PowerGraph are as follows.
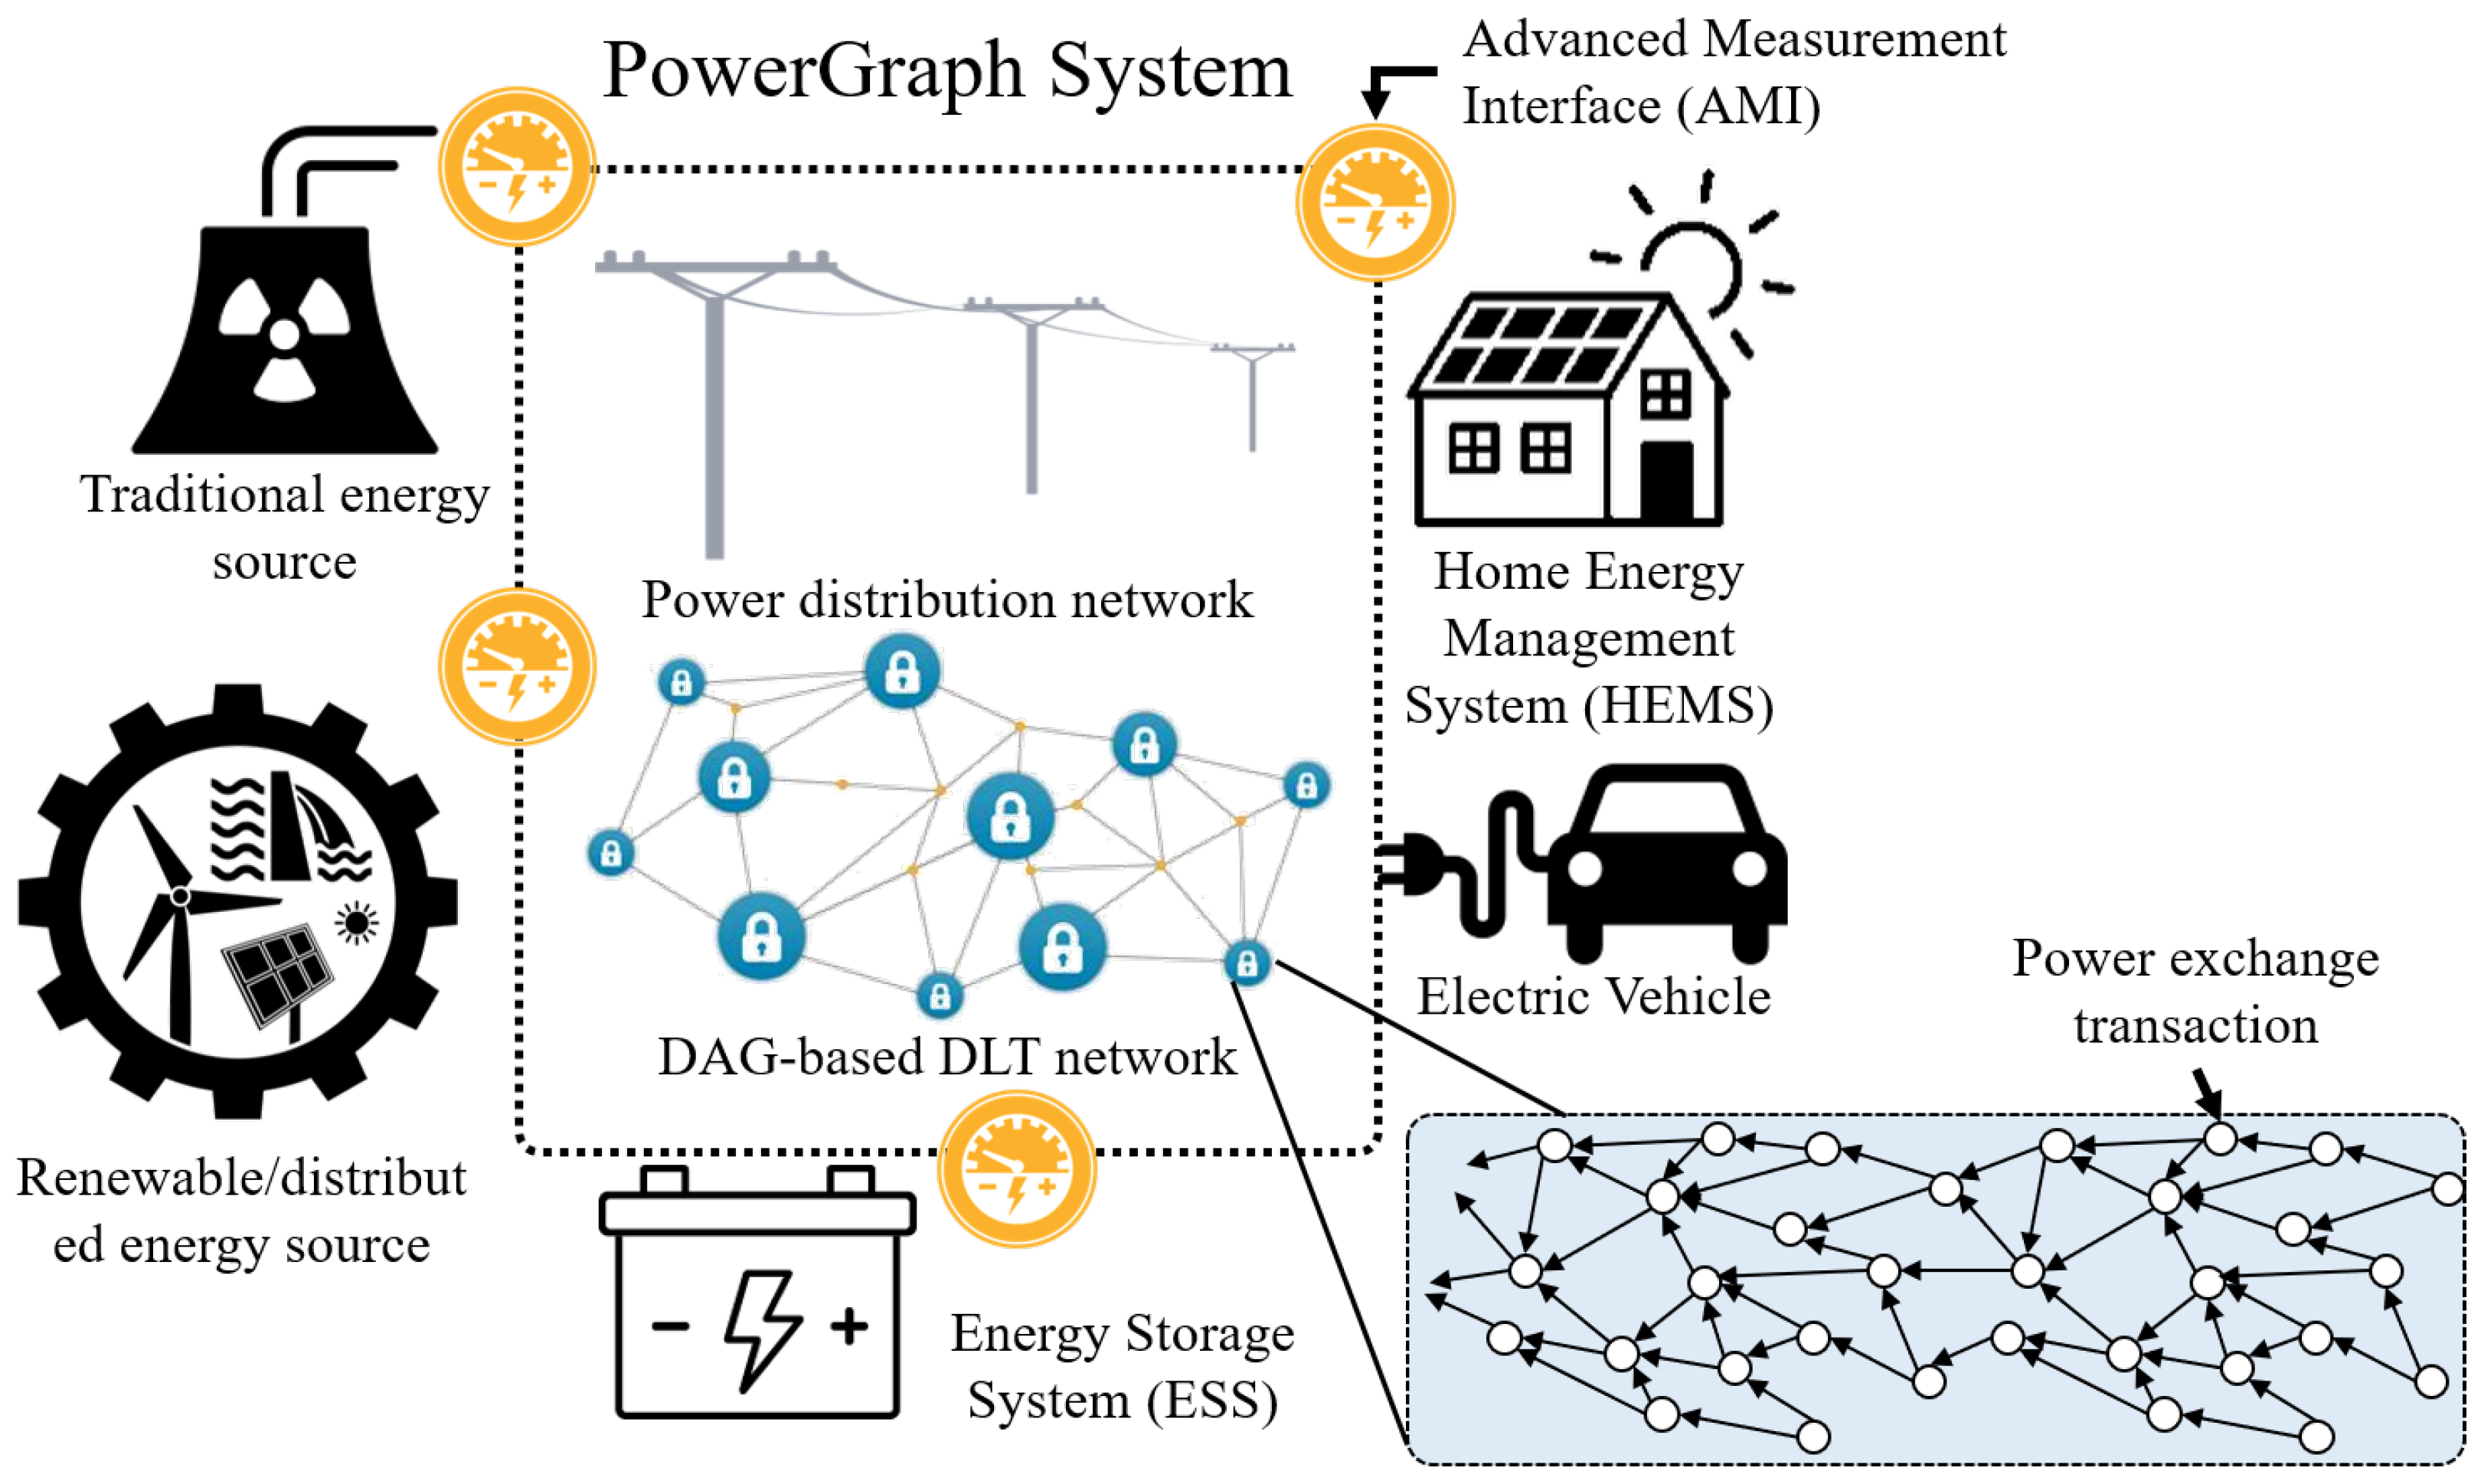
- Measured resource: The resources generated and exchanged in a Smart Grid are based on measurements obtained by AMIs, which are attached at the Smart Grid system. In other words, only the measurement results define the actual transactions of power exchanges. Conversely, AMI measurements prove the true power delivery, so the transaction validation process can exploit these measurements to decrease the overhead. PowerGraph cross-validates the measurements to detect the malicious transactions, such as double-spending or reduced payment in transaction.
- Continuous exchange: Power distribution is a continuous procedure, while transactions are defined as discrete. An ideal Smart Grid aims to dynamically manage a power source to enhance the power quality and prevent the blackouts caused by power overloads. To track the customers’ power usage, the Smart Grid network should periodically issue the transactions for the power measurements varied by the power distribution. This observation leads to the conclusion that issuing transactions more frequently will improve the Smart Grid’s accuracy. We analyzed the performance model of PowerGraph, considering the power transaction issuance cycle.
- Complex validation: Smart Grid network should validate both the transaction of the cryptocurrency and the power distribution. To confirm the power exchange, the transaction should include the power amount the customer received, as well as the cryptocurrency amount that the customer transferred. PowerGraph proposes a novel method of validating the Smart Grid transaction that covers several types of transaction used in the network.
2.2. Transaction Types
PowerGraph should validate the transactions that transfer the power and the currency. Moreover, Smart Grid supports two power distribution methods; power delivery by the Energy Storage System (ESS), and by the power generator. ESS is a component that charges the power to meet the future demand and discharges the capacitor to sell electricity. To prevent the false property of the malicious provider, PowerGraph should check the remaining power amount in the ESS. Meanwhile, the power generator can convert the other energy source to the electrical power and transmit this to the customer. In the case of power generator, PowerGraph tracks of the occupancy status of each generator to detect the false exchanges. The following types of the transactions form a DAG-based database.
2.2.1. Charge
A transaction type called Charge depicts additionally stored amounts of electrical power in an ESS. A Charge transaction includes the information of the ESS’s ID and the newly charged amount of power in . Please note that the transaction does not include the selling price of the charged amount of power, since the owner of the ESS wants to set the price while monitoring the power exchange market. The power’s price is periodically advertised at the power exchange center, and the customers can survey the current prices of the ESSs.
2.2.2. Discharge
When a customer decides to use the power stored in a specific ESS and the actual power has been delivered, a Discharge transaction is issued to confirm the power exchange. Unlike Charge transaction, Discharge contains the amount of transferred currency, which is properly determined by the amount of discharged power and the selling price set by the ESS. The AMI of the customer measures the power consumption and periodically issues the Discharge transactions to report the power usage. PowerGraph participants validate the discharged amount and the transferred amount of the transaction to detect malicious transactions.
2.2.3. Occupy
If a customer decides to use the power produced by a specific generator and the actual power has been delivered, an Occupy transaction is issued to report the power occupancy. Please note that a power generator’s occupancy should be validated differently than the discharge amount of an ESS, because the ESS delivers a certain amount of power, whereas the generator allocates a part of the produced power to the customer. PowerGraph participants validate the occupancy of the generators’ power production to detect the fraudulent transactions.
2.2.4. Transfer
To establish the proper power transaction, buyer should have enough cryptocurrency. Transfer describes the pure deposit and withdrawal of money, which is the same as the former DLT transactions. This type of transaction is used to validate the power exchange that occurs when a customer has sufficient cryptocurrency.
2.2.5. Reference
A Reference transaction, also called a genesis transaction acts as a headstone of the transaction validation process. Reference transaction is only declared at the start of the PowerGraph database to issue the initial transactions. The transactions are confirmed preliminary, so the miners can use the transactions in validation and confirmation processes. Section 2.3 describes the validation and confirmation processes of PowerGraph in detail.
2.3. PowerGraph Procedure
This section addresses the principal procedures specified in PowerGraph that describe the initial bootstrapping, power generation, distribution, validation and confirmation of transactions. We describe an example scenario of the PowerGraph in Smart Grid power trading. Then, we review about the performance of the existing DAG-based DLT, and show our novel validation/confirmation algorithm used in PowerGraph.
2.3.1. PowerGraph Transactions
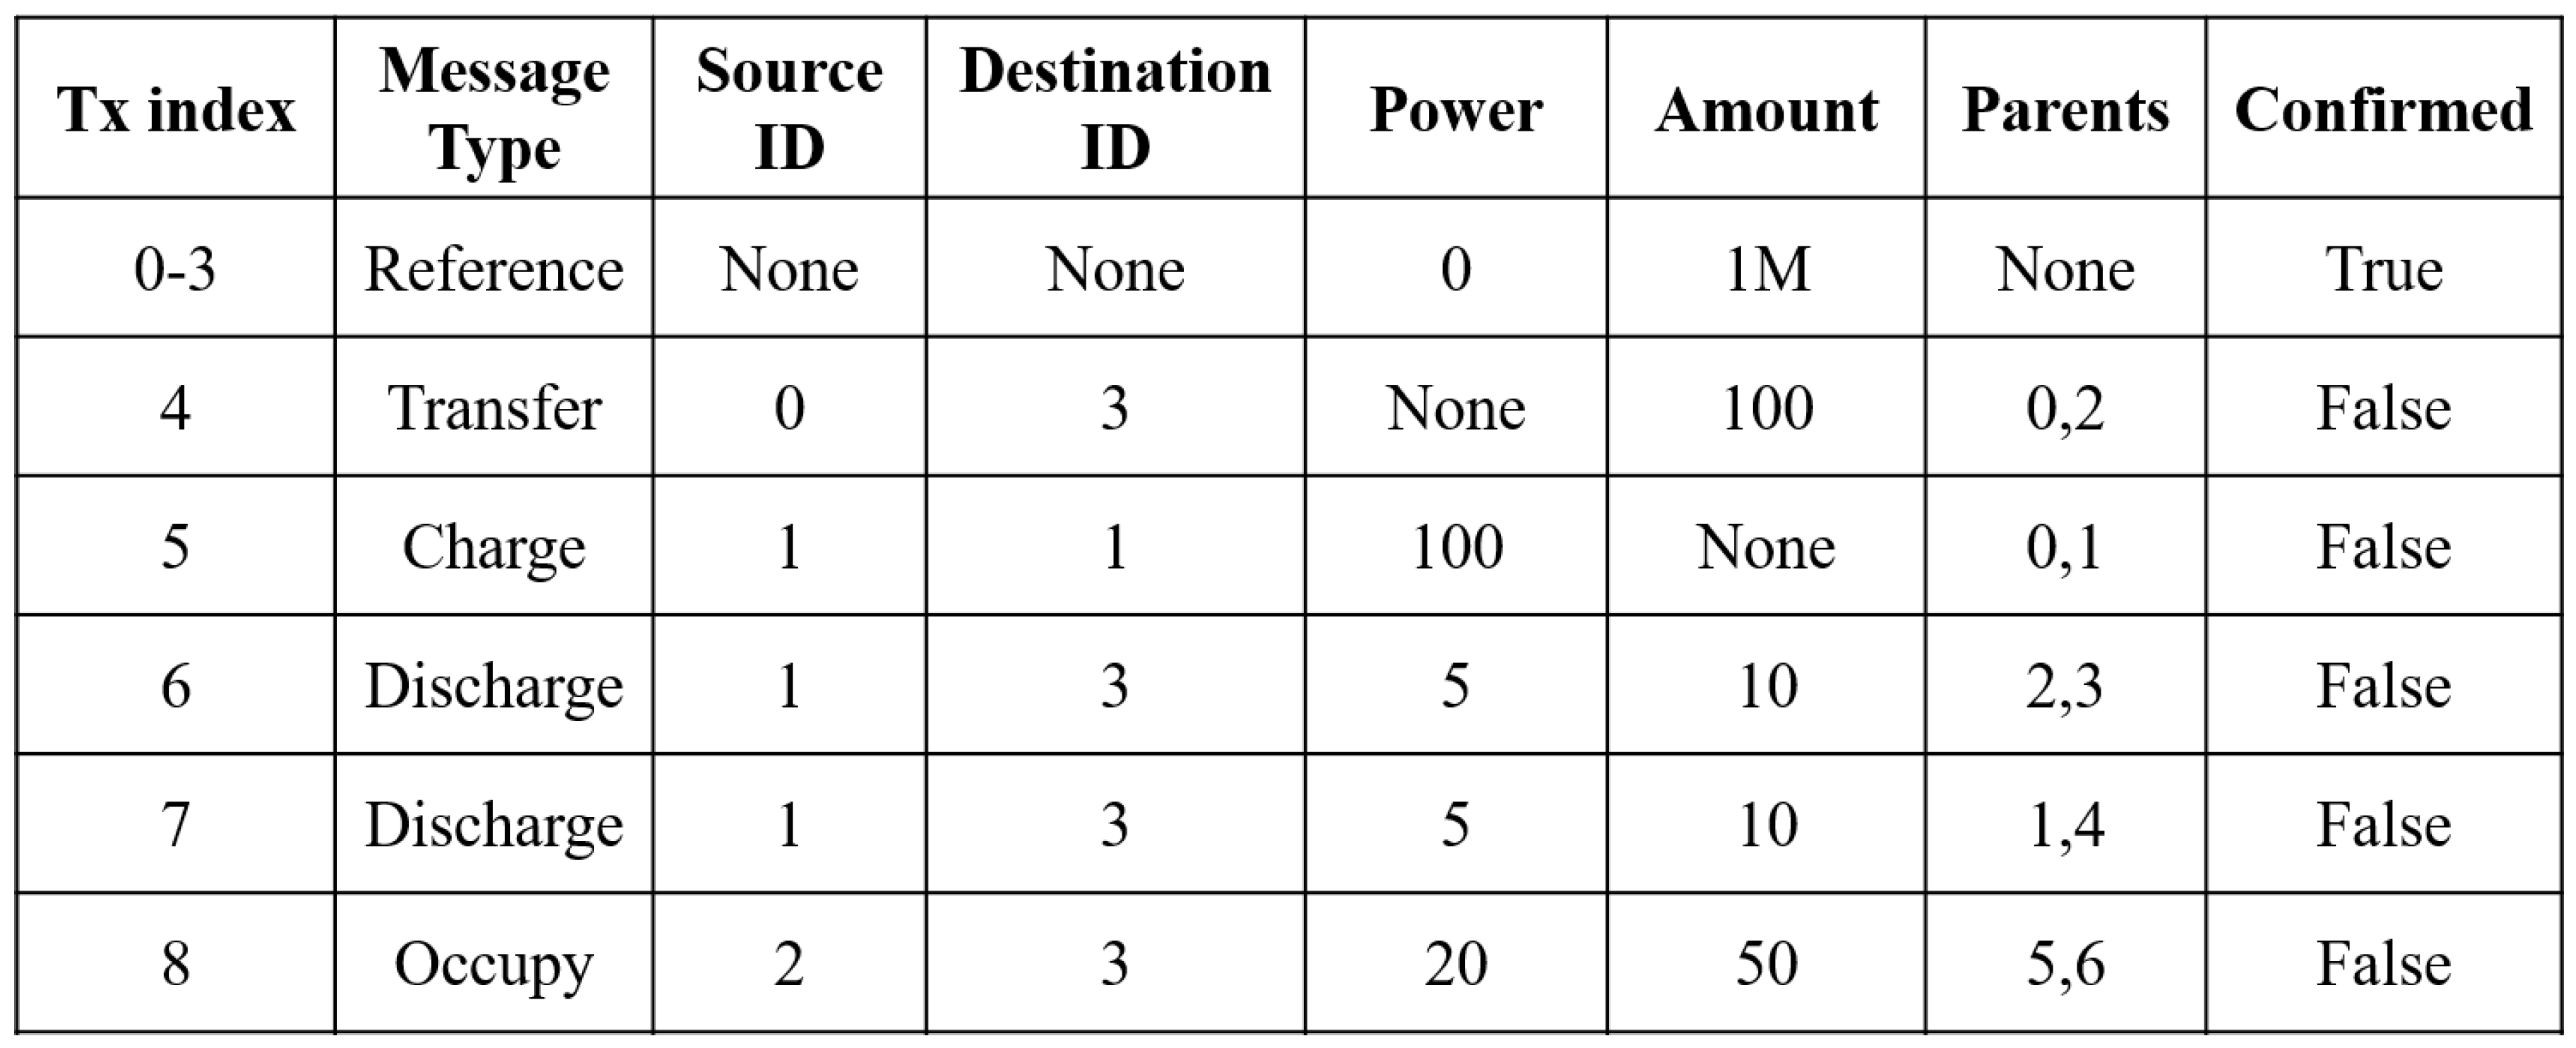
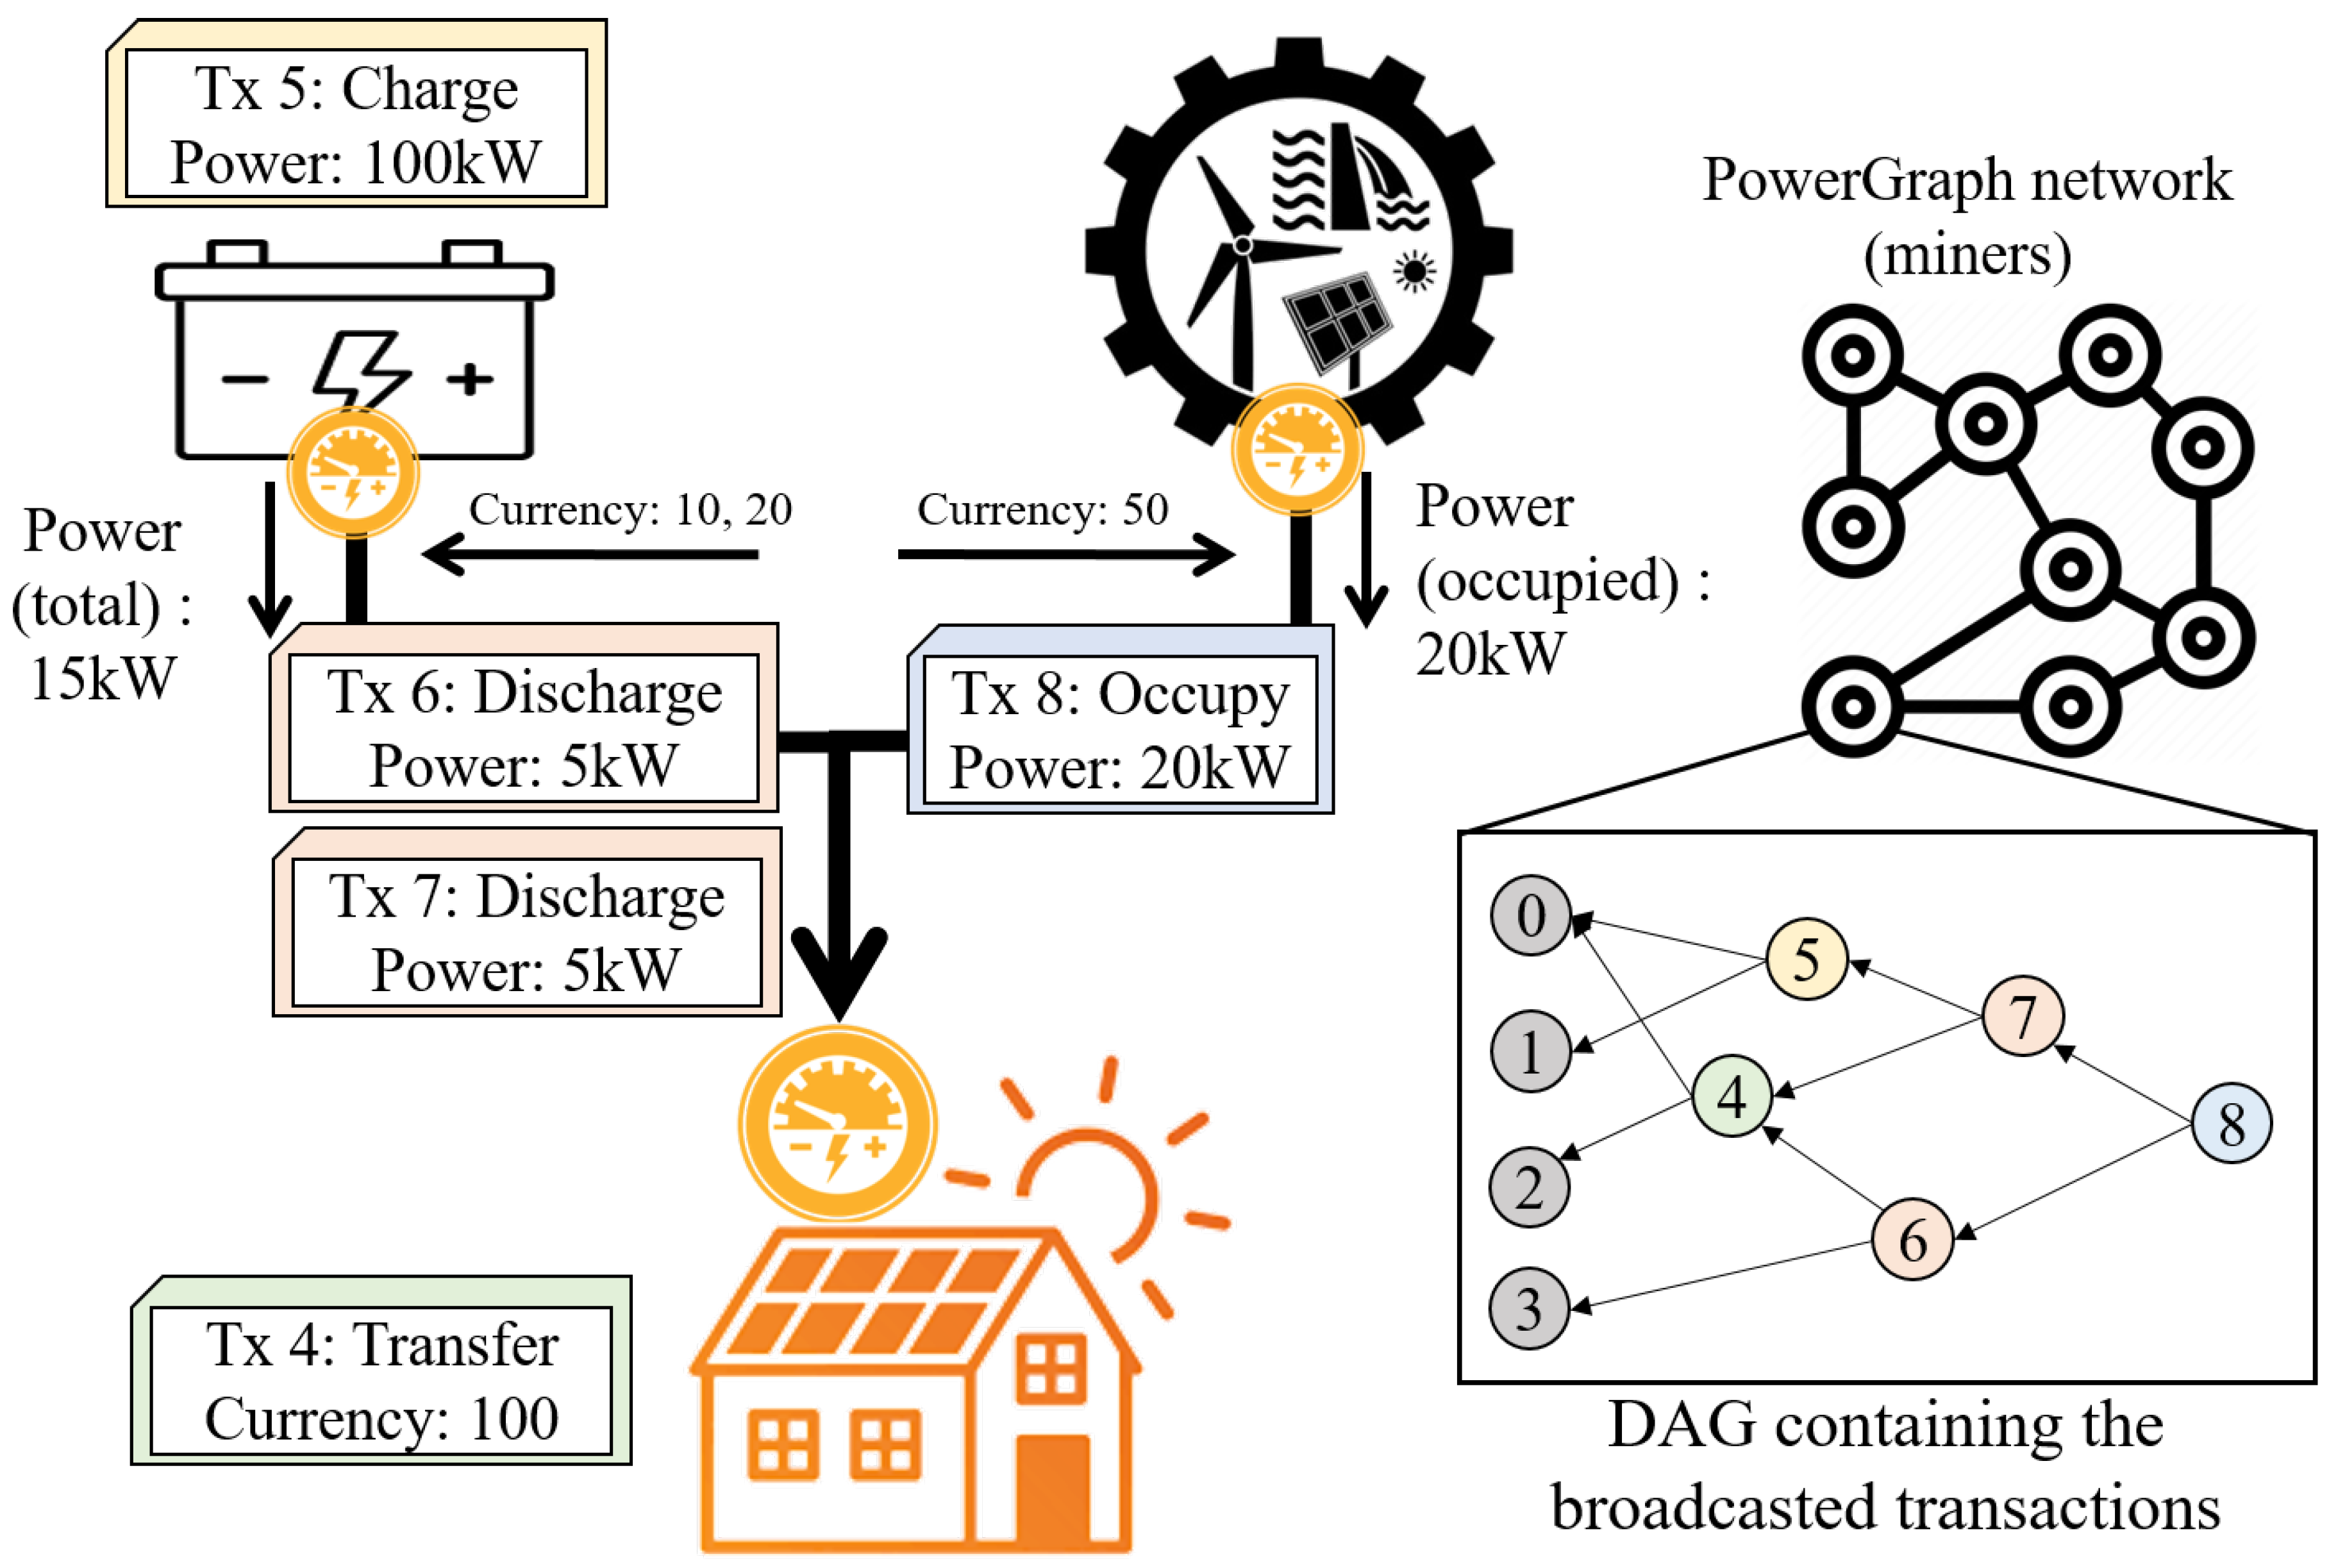
Figure 2 shows a miner’s database example in PowerGraph. Please note that the database of a miner may not be complete at some point, due to the network and PoW delay of the transactions. We labeled the ID of each component for indexing. ID 0 refers to the initial cryptocurrency source, IDs 1 and 2 refer to an ESS and DER, respectively. ID 3 refers to a customer in the PowerGraph network. Initially, several Reference transactions (index 0 to 3) are deployed without parents. Each Reference transaction defines the initial amounts of the cryptocurrency. PowerGraph traders can exchange the cash for the cryptocurrency at the PowerGraph interface, which can be implemented as a certain webpage or an application. The exchange result is reported as a form of the Transfer transaction type, as an example of the transaction index 4 in Figure 2. Furthermore, the ESS charges its capacity by saving the energy (storing the remaining energy after using) or the other trade, which is reported as a form of the Charge transaction type, as an example of the transaction index 5. In the case of Charge, the source and destination ID are the same since the ESS charges its own power in conclusion. Then, customer 3 selects the power source considering their power requirement, from a list derived by the PowerGraph interface. After deciding to provide the power from the ESS, AMI of the customer periodically issues the Discharge transactions, as examples of the transaction indices 6 and 7. If the customer needs more power to operate their systems, it augments the delivered power by adding another power source. Then the AMI periodically issues the Occupy transactions which describe the amount of power and the paid currency, as an example of the transaction index 8. When n power sources are used at the same time, the AMI should issue n transactions per cycle to precisely monitor of the power distribution.
The transaction procedure of the PowerGraph is graphically represented in Figure 3. As the other DAG-based DLTs, each miner secures a graph composed of the nodes each of which includes the information of a transaction, listed in the Figure 2. The AMI attached at each node in power distribution network periodically senses the power consumption or the charged amount and generates the transaction containing the information of the electricity exchange. The transactions are submitted to one of the miners through the PowerGraph network, and the miner processes validation of the transaction and propagates to the other miners. Through the distributed manner of the PowerGraph network, each miner consequently results in the same shape of the DAG, and the traders can track their account by searching one or more miner’s ledgers.
To fulfill the objectives of the DLT, the transactions confirmed by the miners must not be double-spent. Also, except for the broadcasting overhead, the miners should have the same determination of the same transactions about whether it is valid or not. In particular, the time required for a transaction to be validated and finally confirmed (e.g., validation overhead and confirmation overhead, respectively) should be low at the Smart Grid network, for the optimal DR of power distribution. We introduce our novel design of the validation and the confirmation process used in PowerGraph in Section 2.3.3, and show the improved performance in Section 3.
2.3.2. DAG-Based DLT Structure
Before designing our consensus algorithm, we investigated the previous methodologies used in DAG-based DLTs. To explain the DAG mechanisms with better readability, we first clarify some graph-related terms used in this paper. If there is an edge started from a vertex A to the other vertex B, we let B is a parent of A, and A is a child of B. The ascendants refer to a set of the vertices which are reachable from a specific vertex by edges, and the refers to a set of the vertices which includes a specific vertex as its ascendant. The width refers to the number of the vertices which are the same depth, and the depth refers to the maximum length of the path from a vertex to its ascendants. Finally, the terminal refers to a vertex which has no children, and a vertex which is not terminal is called non-terminal.
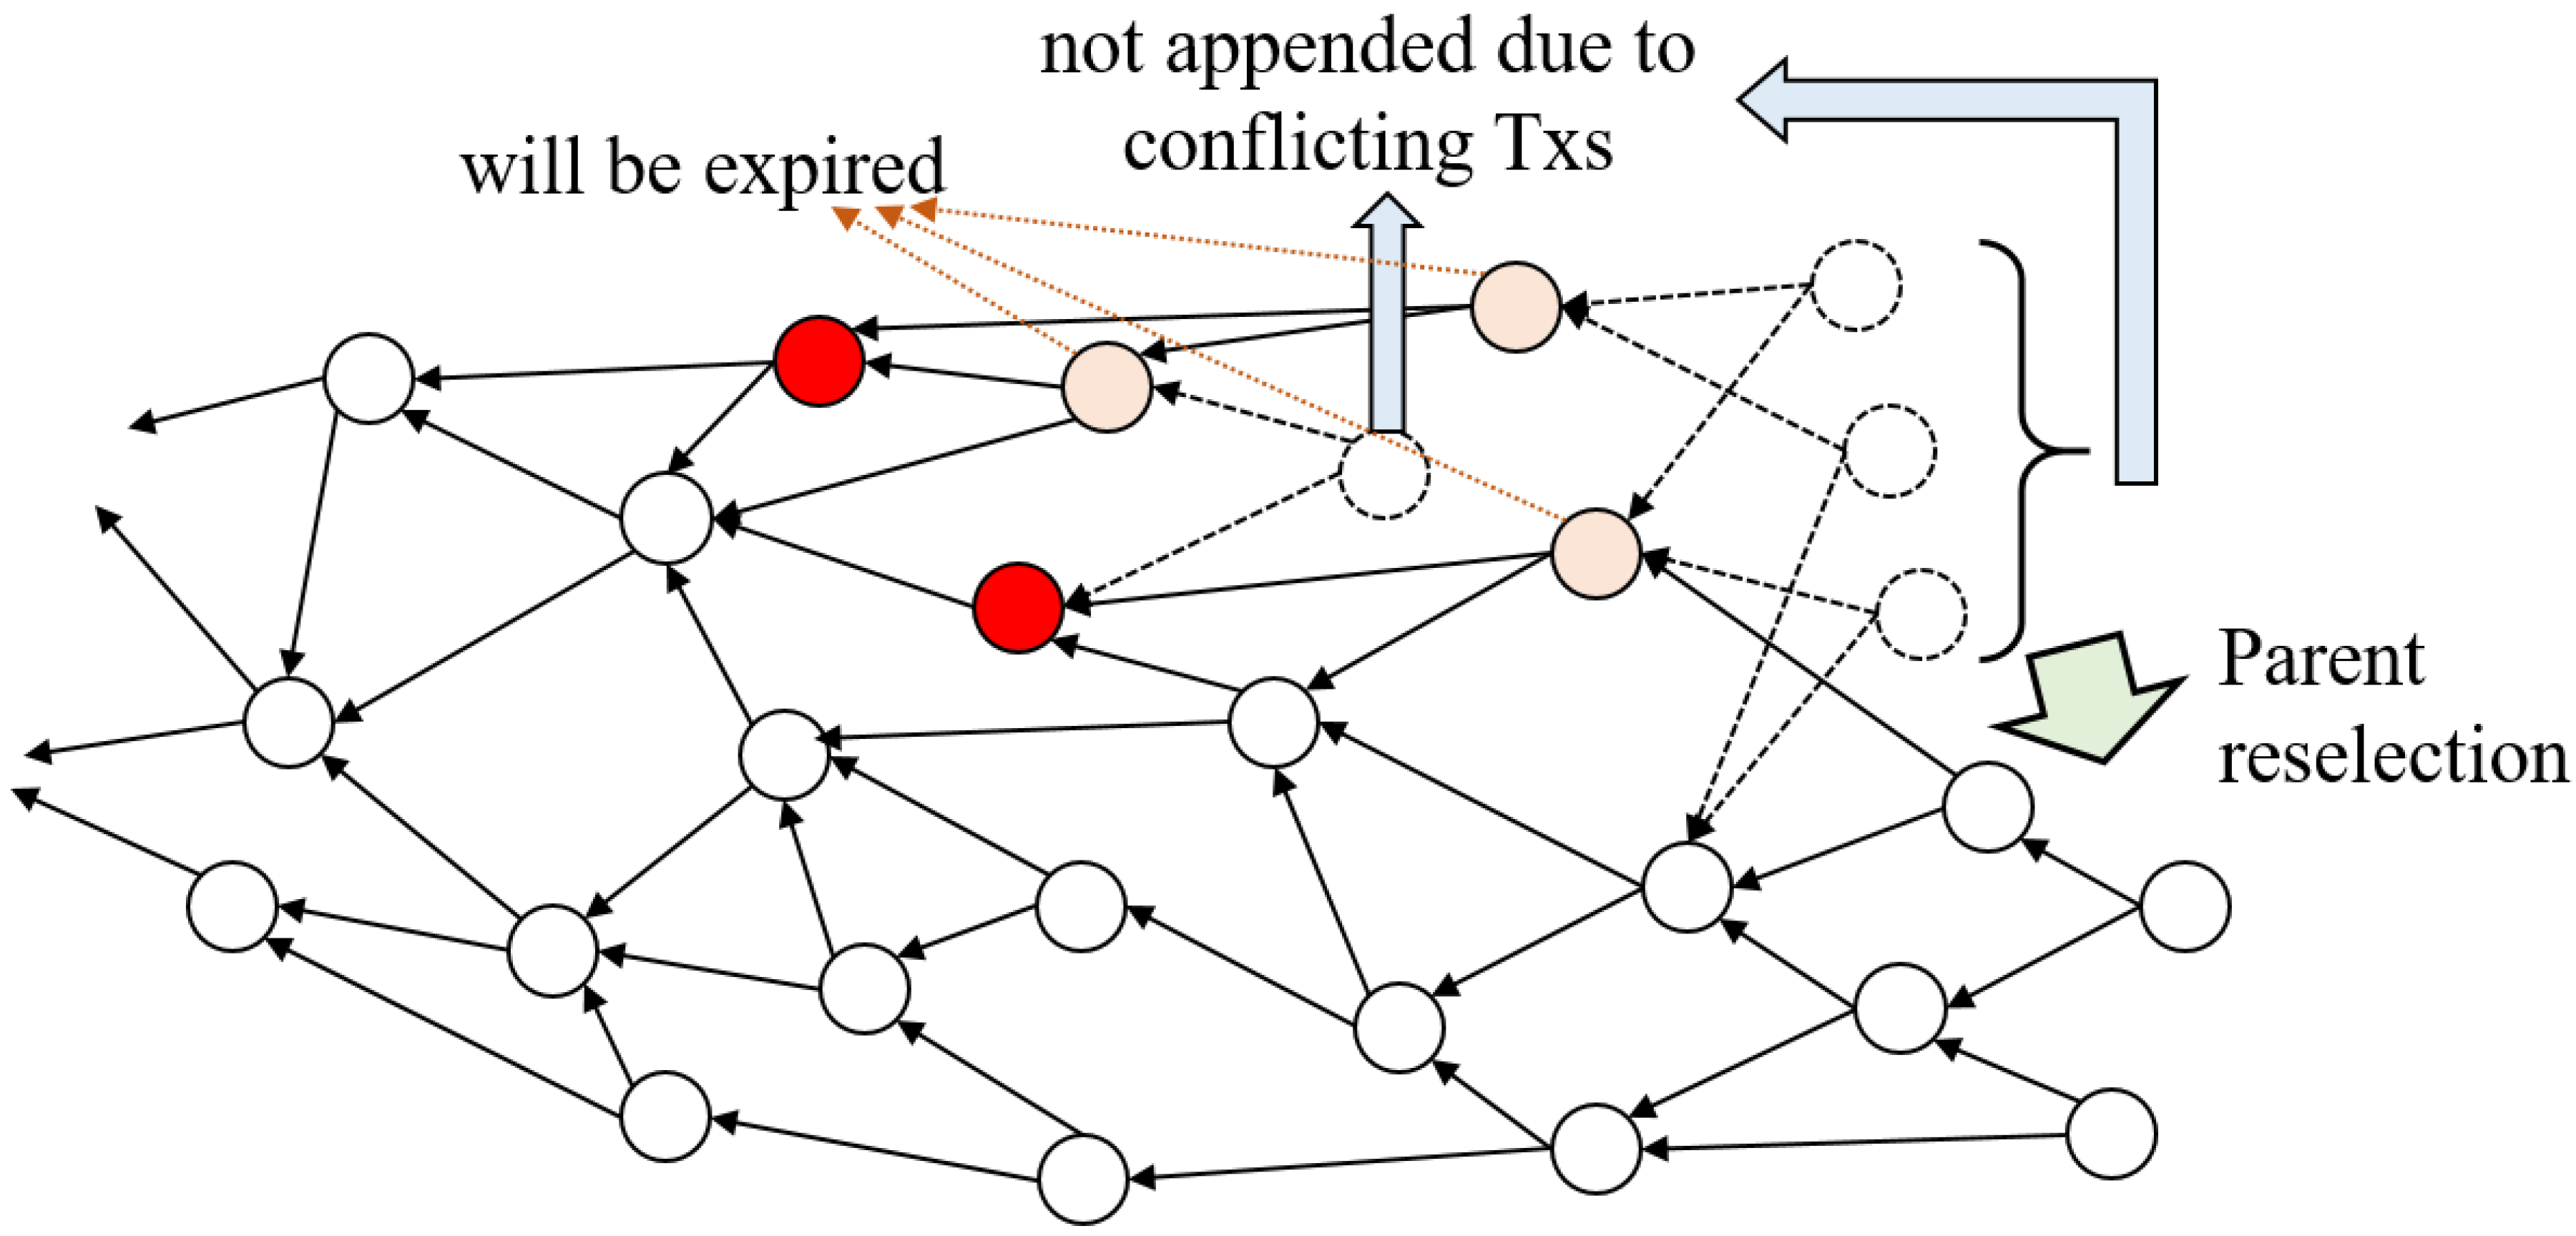
We review the conventional mechanism of the well-known DAG-based DLT’s consensus, IOTA. Figure 4 shows the graphical representation of the IOTA consensus algorithm. IOTA is designed to isolate the invalid transactions, by not increasing its descendants in a graph. If a new transaction arrives, the miner selects two parents from the terminals, and validate a set of transactions including the parents, and the ancestor of them, and the new transaction itself. If one or more invalid transactions are found, the miner reselects the parents, until it passes the validation. Thus, if two conflicting transactions arrive at a short time interval (as known as Race attack), only one of them might be able to have descendants, since the following transactions cannot have both conflicting transactions as their ancestors. At confirmation step, the miner checks how many terminals include each transaction as their ancestors, so the isolated transactions are not be confirmed [13].
This isolation mechanism accurately determines the validity of the transactions, but there are some limitations in performance. At first, if the width of the graph is small, the graph might have no chance to add new transactions if all the parents’ combinations are invalid. To escape this deadlock, DLT should prepare the breakthrough such as transaction timeout or non-terminal parent selection. However, timeout of the invalid transactions will deactivate their unconfirmed ancestors, and choosing non-terminal parents rapidly increase the graph’s width, which can decrease the performance of the DLT. Secondly, the isolation of the invalid transaction also isolates its descendants, which might be innocent. Please note that each invalid transaction can be selected as a parent if both are not included as the ancestors. If the attempts to the race attack increase, the number of the unintentionally deactivated transactions will greatly increase. Finally, repetitive parent reselection and validation results in the increasing overhead of the transaction confirmation. Increment of the race attacks also degrades the performance of the DAG, which is lethal in the power trading scenario of Smart Grid.
2.3.3. PowerGraph Consensus
To design the DAG-based DLT for Smart Grid network, we designed a novel consensus algorithm for PowerGraph. The main consideration on designing the algorithm is a parallelization of the confirmation and the validation processes. As Blockchain waits multiple subsequent blocks (known as 6-confirmations) to guarantee the global consensus of a transaction, DAG-based DLT waits the other following transactions to prove its validity in multiples case of the partial validation. This delayed confirmation is inevitable in DLT concept, due to the network and decision overhead taken to achieve the ledger synchronization. Various consensus strategies used in commercial cryptocurrencies can filter out the double-spending transactions, but what especially matter is the time that the transaction can be announced to the traders without misjudgments, which is commonly declared as confirmation delay. Apart from the political blockage, this delay is the most critical obstacle to the widening of the cryptocurrencies, since they can detect double-spending after physical trades have been already concluded. We attempted to minimize the confirmation delay, by continuously checking the transactions and accurately determining their validity. We define a metric for tracking the honesty of a transaction as Stochastic Collective Credibility (SCC), denoted as c where . When a transaction i appears at a miner’s DAG, it has first SCC value as 0. While the miner performs each validation process, the miner determines the change of SCC and accumulates the of each transaction. First, a miner receives the transaction request, and then it randomly selects the parents from its terminals and checks the balance of the parents’ ancestors. If the invalidity of a transaction i is detected at a validation process, the miner decreases of the invalid transaction, instead of reselecting the parents. Otherwise, if there are no invalidity in a validation process, the miner increases if the transaction was in the validation set. If reaches to 1, the transaction i is referred to the confirmed transaction. If reaches to , the transaction i is referred to the double-spending transaction and not be validated anymore.
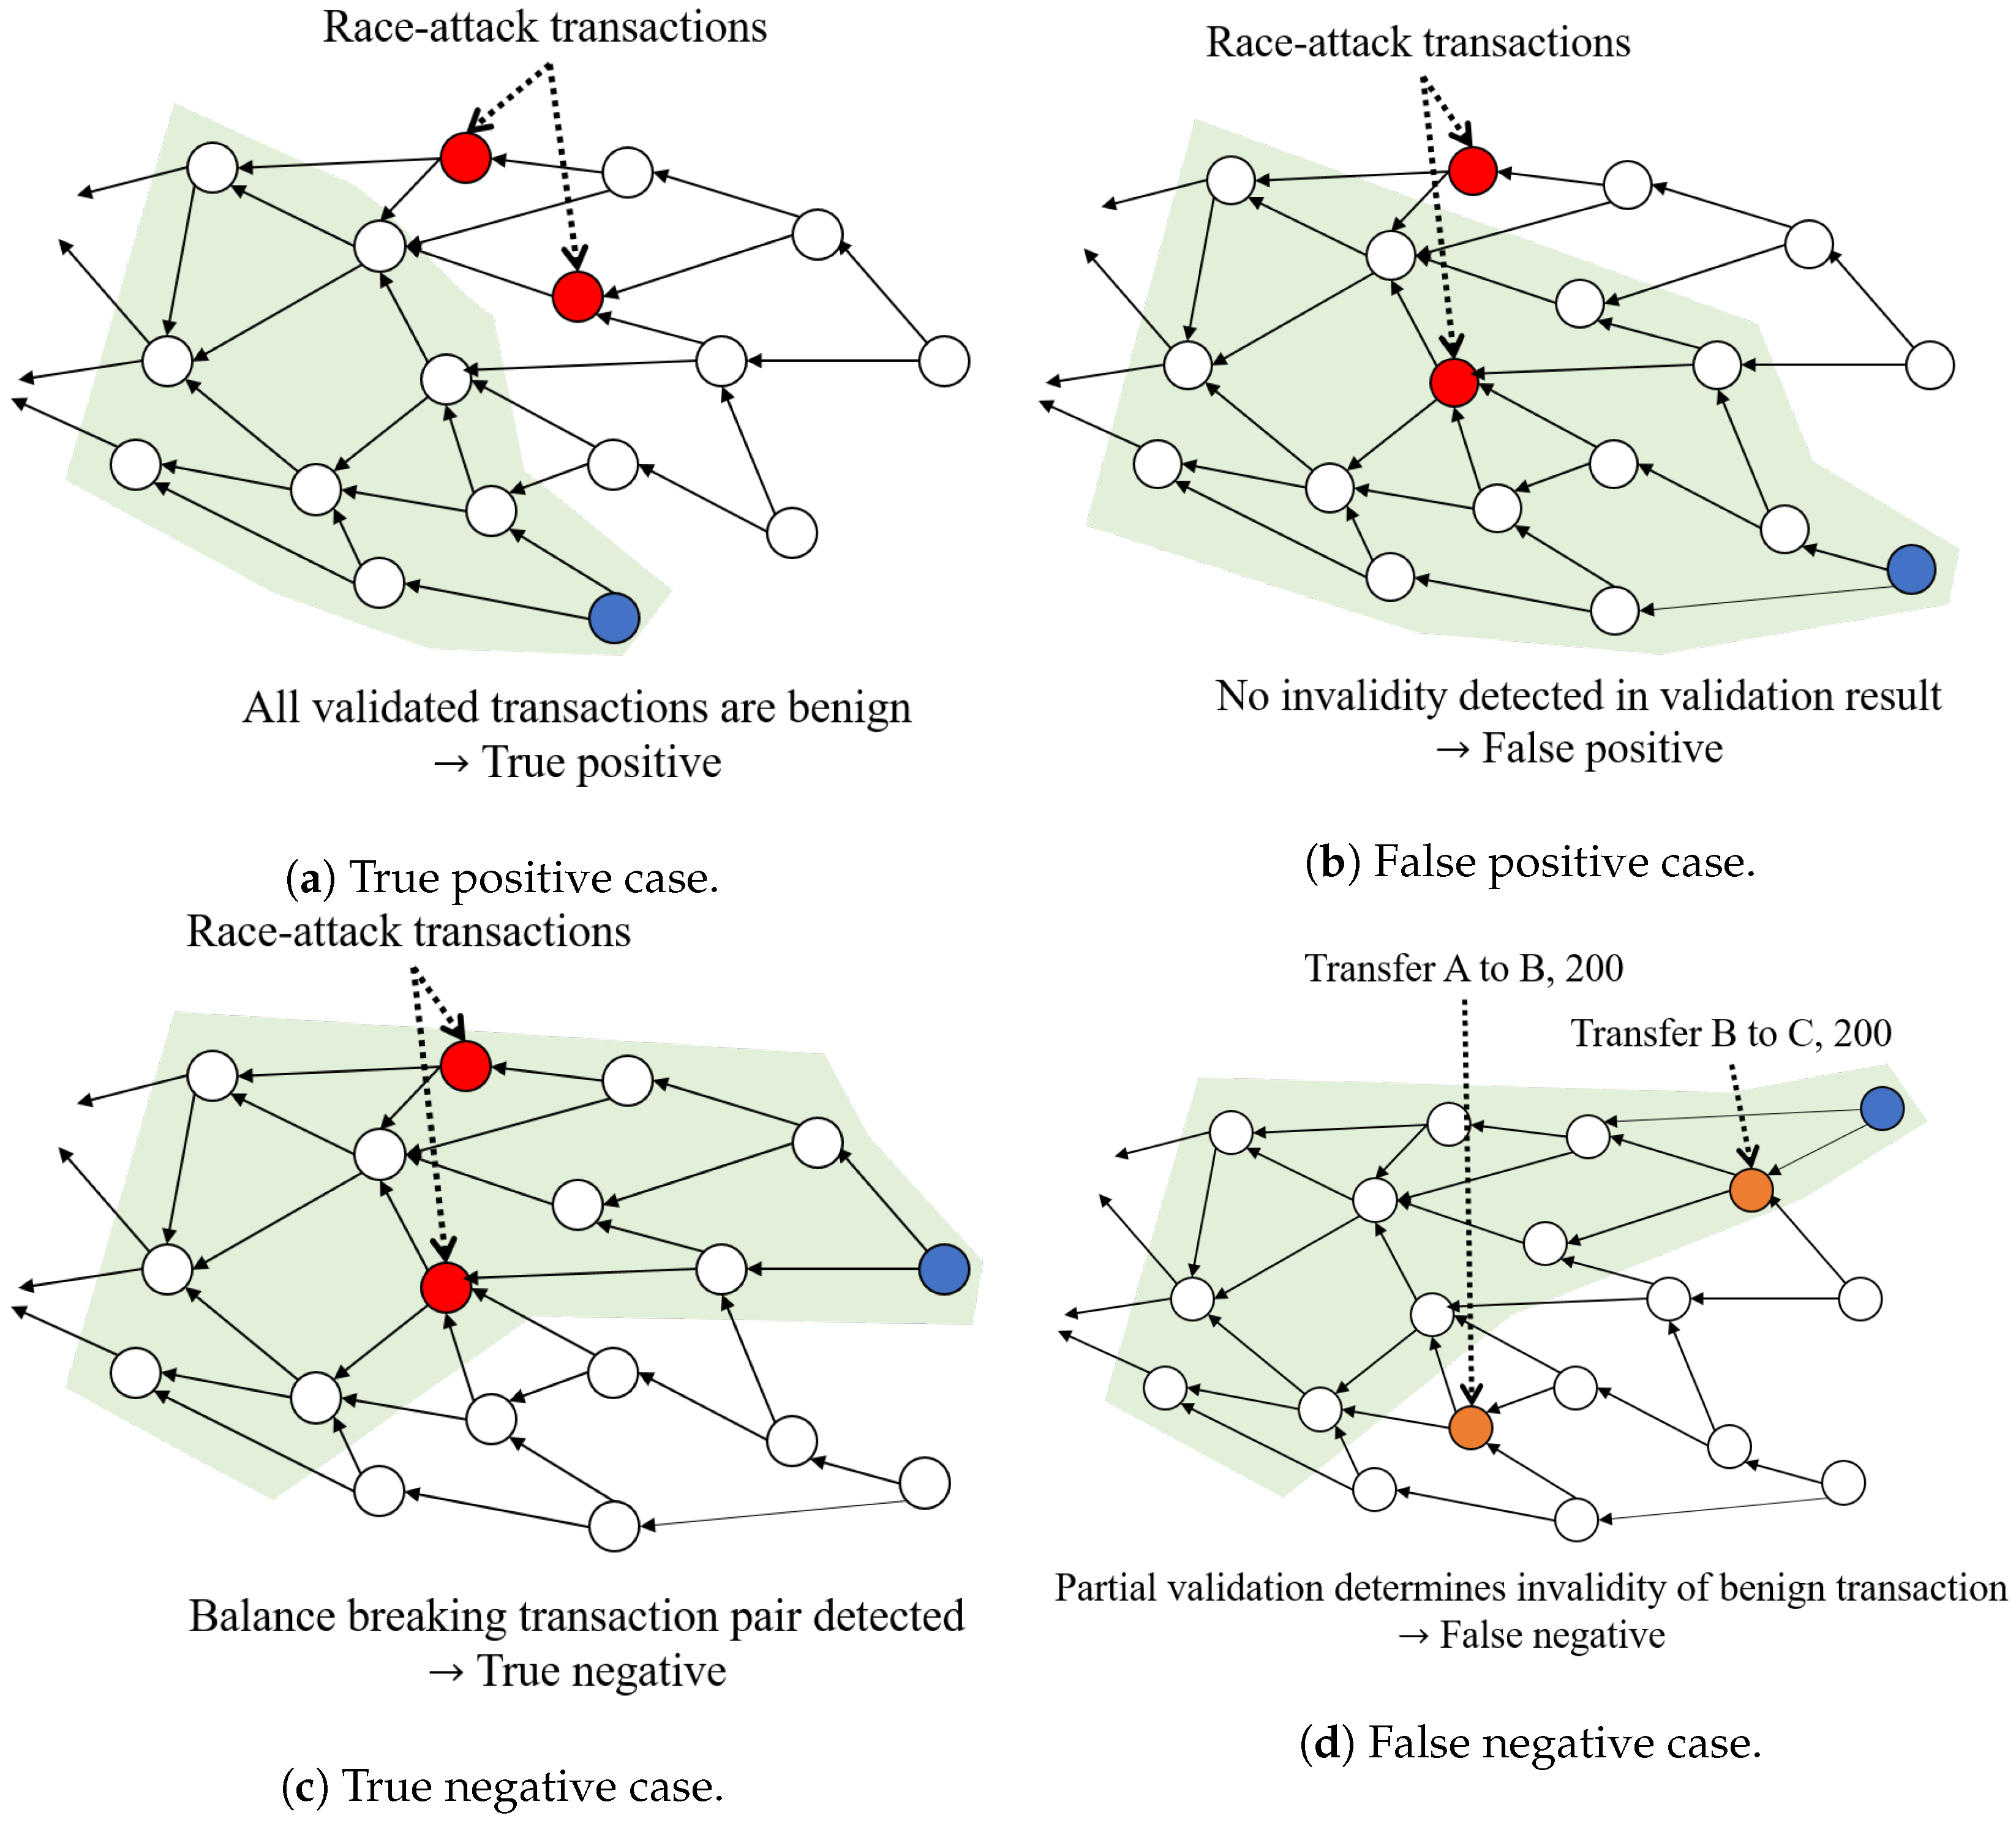
Please note that the reason for the delayed confirmation is that it can lead to incorrect decisions about the validity of the transaction. To prevent the false determinations of the transactions, the amount of change in should reflect the potential of the wrong validation results. We categorized the validation results in four cases, True Positive (TP), False Positive (FP), True Negative (TN) and False Negative (FN). Figure 5 shows the cases of the validation cases with and without malicious transactions. At first, if a validation set does not include any of the race-attack transaction, we regard this case as True Positive, as shown in Figure 5a. When the race attack occurs and two conflicting (balance-breaking) transactions are in the DAG, two other cases can be regarded according to the coverage of the validation set. If only one of the conflicting transaction is included at the validation set (Figure 5b), the invalidity of the transaction may not be detected, and it results in the False Positive of the validation result. However, if both conflicting transactions are included as shown in Figure 5c, the miner can notice the invalidity of these transactions, which results in the True Negative of the validation process. Finally, as shown in Figure 5d, even though a trader A first transfers the currency (or power) to the another trader B, if a validation set only contains the following transaction where B transfers to C, the miner can determine that the latter transaction is invalid. We regard this case to False Negative (Figure 5d), and we deal with this case separately since it occurs independently to the existence of the malicious transactions. PowerGraph considers these probabilities of the misjudgments and adjusts the amount of the SCC changes in each validation process.
We modeled the probability of the aforementioned cases. Let N refers to the number of the unconfirmed non-terminals, and A refers to the number of the validated transactions in a validation process. Please note that the ratio of the validated transaction to the total unconfirmed non-terminals is varied by the width of the graph [14]. In the case of the true positive, the validation set should contain only the benign transactions, so the probability of this case can be expressed to
where refers to the number of the k-combinations of an arbitrary set with n elements. Meanwhile, in the case of the false positive, one of the conflicting transactions should be contained, so the probability can be expressed to
and the case of the true negative where the validation set contains both conflicting transactions can be expressed to
Please note that and can be induced by the Equations (1)–(3).
The case of the false negative should be separately considered, since it is independent to the existence of the malicious transactions. In addition, it is almost infeasible to derive the mathematical expression of the false negative probability, since there could be numerous combinations of the transactions that can lead to the incorrect validation results, if all of those are not included in the validation set. For example, if an ESS sequentially charged the electricity with amount of 40 and 60 kW, and distributed by two consumers with amount of 60 and 40 kW, respectively. These actions result in the issuance of two Charge and two Discharge transactions, which are denoted to , , and . After all four transactions are broadcast and appended to each miner’s DAG, several the validation processes increase or decrease the SCC of the transactions. If the validation set contains , except , then will be determined as the invalid transaction and the SCC will decrease. Also, if and are only contained at the validation set, ’s SCC will decrease. In addition to the example, balances of every account according to the validation set are highly unpredictable. However, there is a clear trend that the coverage of the validation set increases, false negative probability decreases.
With these observations, we set the SCC variable of transaction i per a validation as
where T refers to the number of the terminals and refers to the difference of the depth between the arrived transaction and the invalid transaction i. As shown in Equation (4), when closes to , decreases since the reliability of the validation result drops. Also, if the increases, the probability to the detection of the invalidity exponentially increases due to the shape of the validation set (Figure 5). By the gain , confirmation overhead can be efficiently reduced while preventing the hasty increment of the SCC.
Finally, we adjust the number of the parents to shape the width of the graph constantly. As discussed in our previous work [14], the width of the graph depends on the validation overhead and transaction incoming rate, and the large width increases the confirmation overhead. Increasing the number of the parents not only reduces the width, also reduces the due to Equation (2). To exploit the advantage of the partial validation, we adaptively determine the number of the parent p as
To sum up, we designed the PowerGraph consensus algorithm as shown in Algorithm 1. GetBroadcastTxs checks if there are newly arrived transactions through the PowerGraph network, and append them into the miner’s DAG. UpdateArrivedTxs receives the incoming transactions, which invokes the validation processes. While performing a validation process (from line 4 to 24), the aforementioned variables are derived from the current DAG of the miner. GetParents randomly picks the parents from the terminals, and GetAncestors returns a set of the ancestors. Validation checks the resulting balance of the accounts after adapting the set of the transactions, and returns a set of the balance-breaking transactions denoted as . If there is any element in , the miner decreases the SCC of these invalid transactions. Only the transactions can increase their SCC when . The lines 17 and 9 show the change of the SCC according to Equation (4).
| Algorithm 1. PowerGraph consensus algorithm. |
|
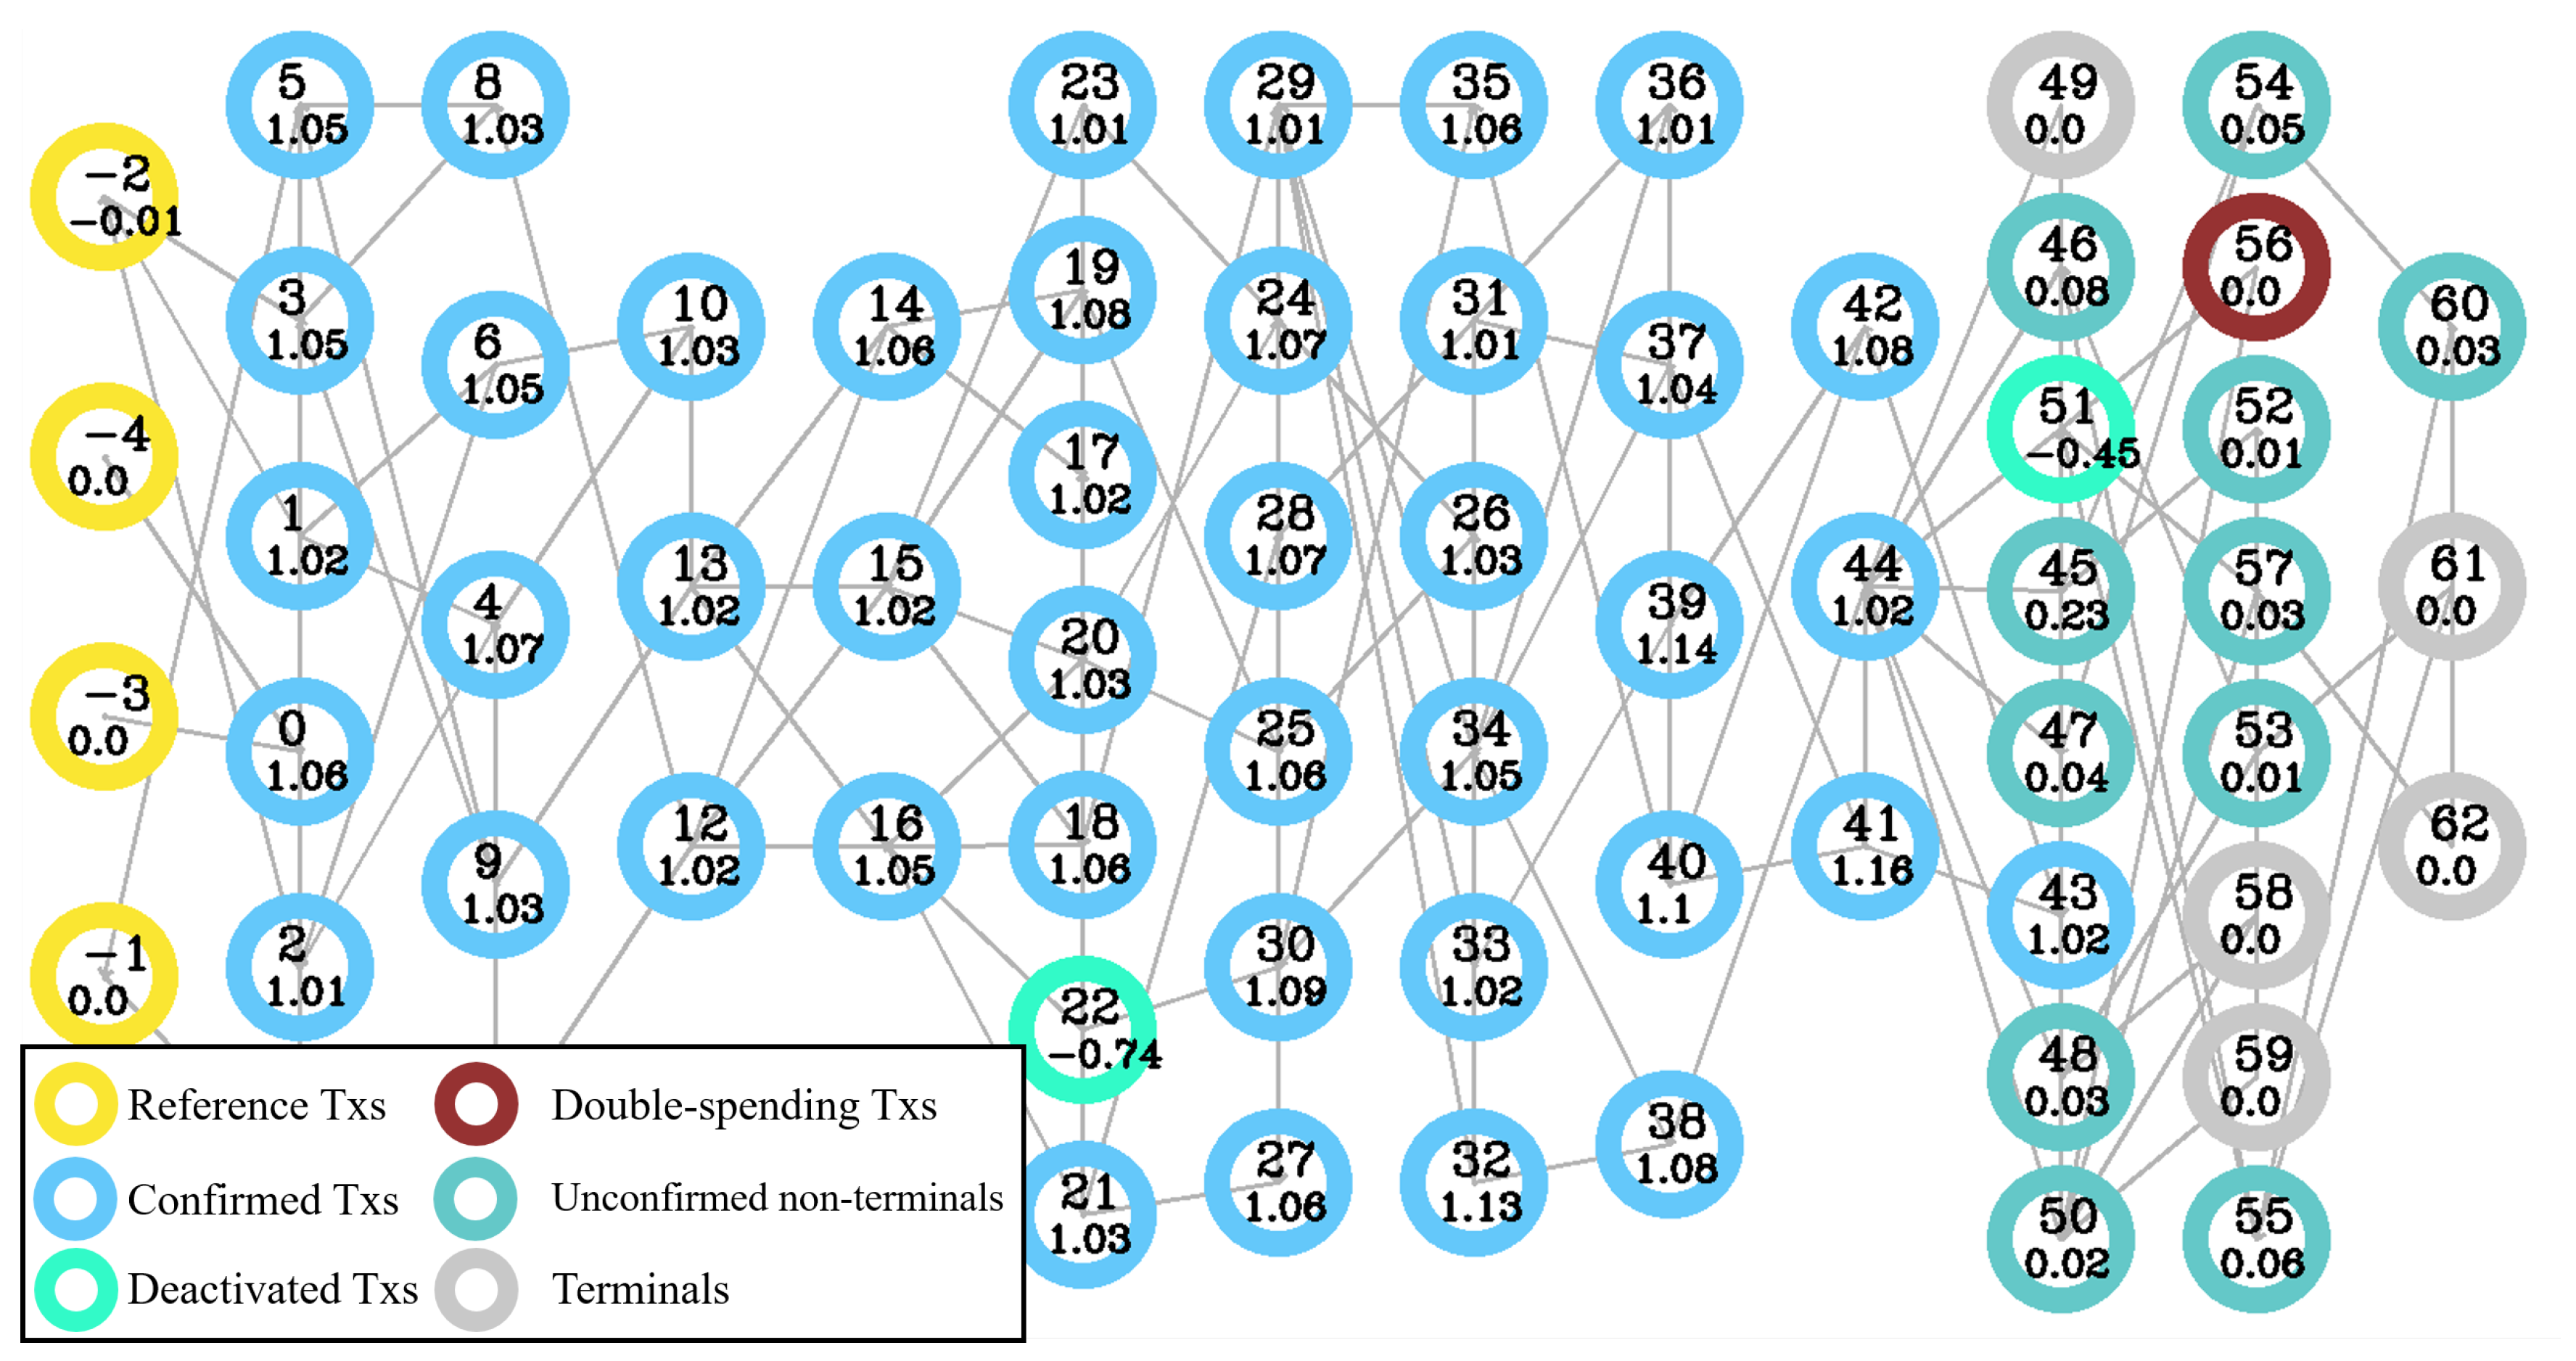
To preview the overall mechanism of the PowerGraph, we brought a graphical representation of the PowerGraph implementation as shown in Figure 6. The video of our demonstration is available at [15]. In the legend of the figure, the word Tx means the transaction. Each circle represents the vertex containing transaction information, with colored edge according to the transaction’s processing status. Grey lines represent the relationship between the vertices, where the left vertex is a parent of the right vertex. In each circle, the number shown in the first line represents the index of the transaction, and the float in the second line represents the SCC of the transaction, . At the simulation, we sequentially issued the transactions, some of which are double-spending. As shown in the figure, double-spending transactions have negative SCC values, and deactivated by the miner. Meanwhile, the other benign transactions have positive SCC values, and confirmed by the miner. Please note that the change of the SCC is not broadcast by the PowerGraph network; each miner performs validation and changes the SCC values. However, the honest miners’ validation processes result in almost the same determination of the transactions, due to the SCC changes. If some malicious miners perform wrong validation, the invalid results would not be propagated due to the individual validation process. By periodically sharing the confirmation results among the miners, the wrong results can be detected, and the action of the malicious miners can be blocked. Also, if a miner continuously broadcasts the invalid transactions through the network (as known as Long-range attack), the other miners determine the invalidity of these transactions through the validation processes. In summary, our consensus algorithm equipped in PowerGraph grants accelerated confirmation of the transactions by combining the validation and the confirmation process in the DAG-based DLT, while discerning the issuance of the malicious transaction.
3. Evaluation
The motivation of the PowerGraph is to build up a low-latency distributed ledger system for Smart Grid. Such a distributed ledger system requires the rapid validation and the validity update of the nodes, for the optimization of real-time power distribution network. With the advent of the DR system, customers want to quickly update their supply status to purchase power from more efficient sources at a more affordable price. On the other hand, the power generator, or the provider, wants to know the precise status of power generation or supply and also the current demand of the customers in order to determine the rate of the electricity and adjust the amount of power generation. Based on this observation, this section evaluates the transaction processing overhead imposed by PowerGraph in various Smart Grid environments.
To evaluate the PowerGraph in a variety of the scales, we implemented a simulator for DAG-based cryptocurrency and the Smart Grid scenario, written in Python. Our simulator operates in three stages.
- Smart Grid scenario setup: We input the transaction incoming rate , and the probability of the double-spending transaction issuance as the parameters. The arrival of the transaction follows the Poisson distribution with , and each transaction is validated by a randomly selected miner. Please note that the power distribution continuously occurs, but the transaction generation discretely occurs. If the transaction issuance cycle per a power distribution is t sec, then represents the expected number of the power distribution lines in a Smart Grid system. We varied the , and to examine the PowerGraph in different environments of the Smart Grid system in Section 3.2 and Section 3.1, respectively.
- PowerGraph operation: We implemented the DAG-shaped database for each miner, and the transactions are randomly assigned to a miner for validation. After the validation of a transaction, validation result is broadcast to the validation network, and the other miners update the transaction after a certain network delay. Each miner changes the SCC of each transaction in its own validation processes, and determines the validity of the transaction when the SCC reaches to a certain threshold, or 1.
- Data measurement and collection: We ran the simulation and collected each transaction’s validation overhead, , and confirmation overhead, . We defined the validation overhead as the time interval from the arrival of the transaction to the start of broadcast to the network. Meanwhile, we defined the confirmation overhead as the time interval from the arrival of the transaction to the first decision of the transaction as confirmed or deactivated, which can be regarded as transaction finalization time. While varying the environmental parameters, we plotted the and on the domain of the transaction arrival time, or the average of them on the domain of the parameters.
- Comparison groups: To compare the performance of PowerGraph with the other DLTs, we implemented Blockchain and the IOTA method based on our simulation software. In the case of Blockchain, the validation completion time of the transaction is matching with the block generation time, where the block contains the transaction. Also, following the 6-block confirmation, we set the confirmation completion time of the transaction to the time that the subsequent six blocks are generated after the transaction is validated. Since the Blockchain features a variety of block generation cycles [16], we set the cycle to 20 s. In the case of IOTA, the confirmation by the participants was proposed; however, the foundation-powered nodes called coordinators periodically perform the confirmation process. Since the confirmation cycle of the coordinators are not known, so we set the cycle to 3 s. Also, for preventing the deadlock of the validation discussed in Section 2.3.2, we let the double-spending transactions occur after 60 s. We first generated a set of transactions arrived in a simulation runtime, then ran each implementation along with the PowerGraph to compare the performance in a same input.
The other numerical constants running the PowerGraph simulation are listed in Table 1.
3.1. Double-Spending Attack Ratio
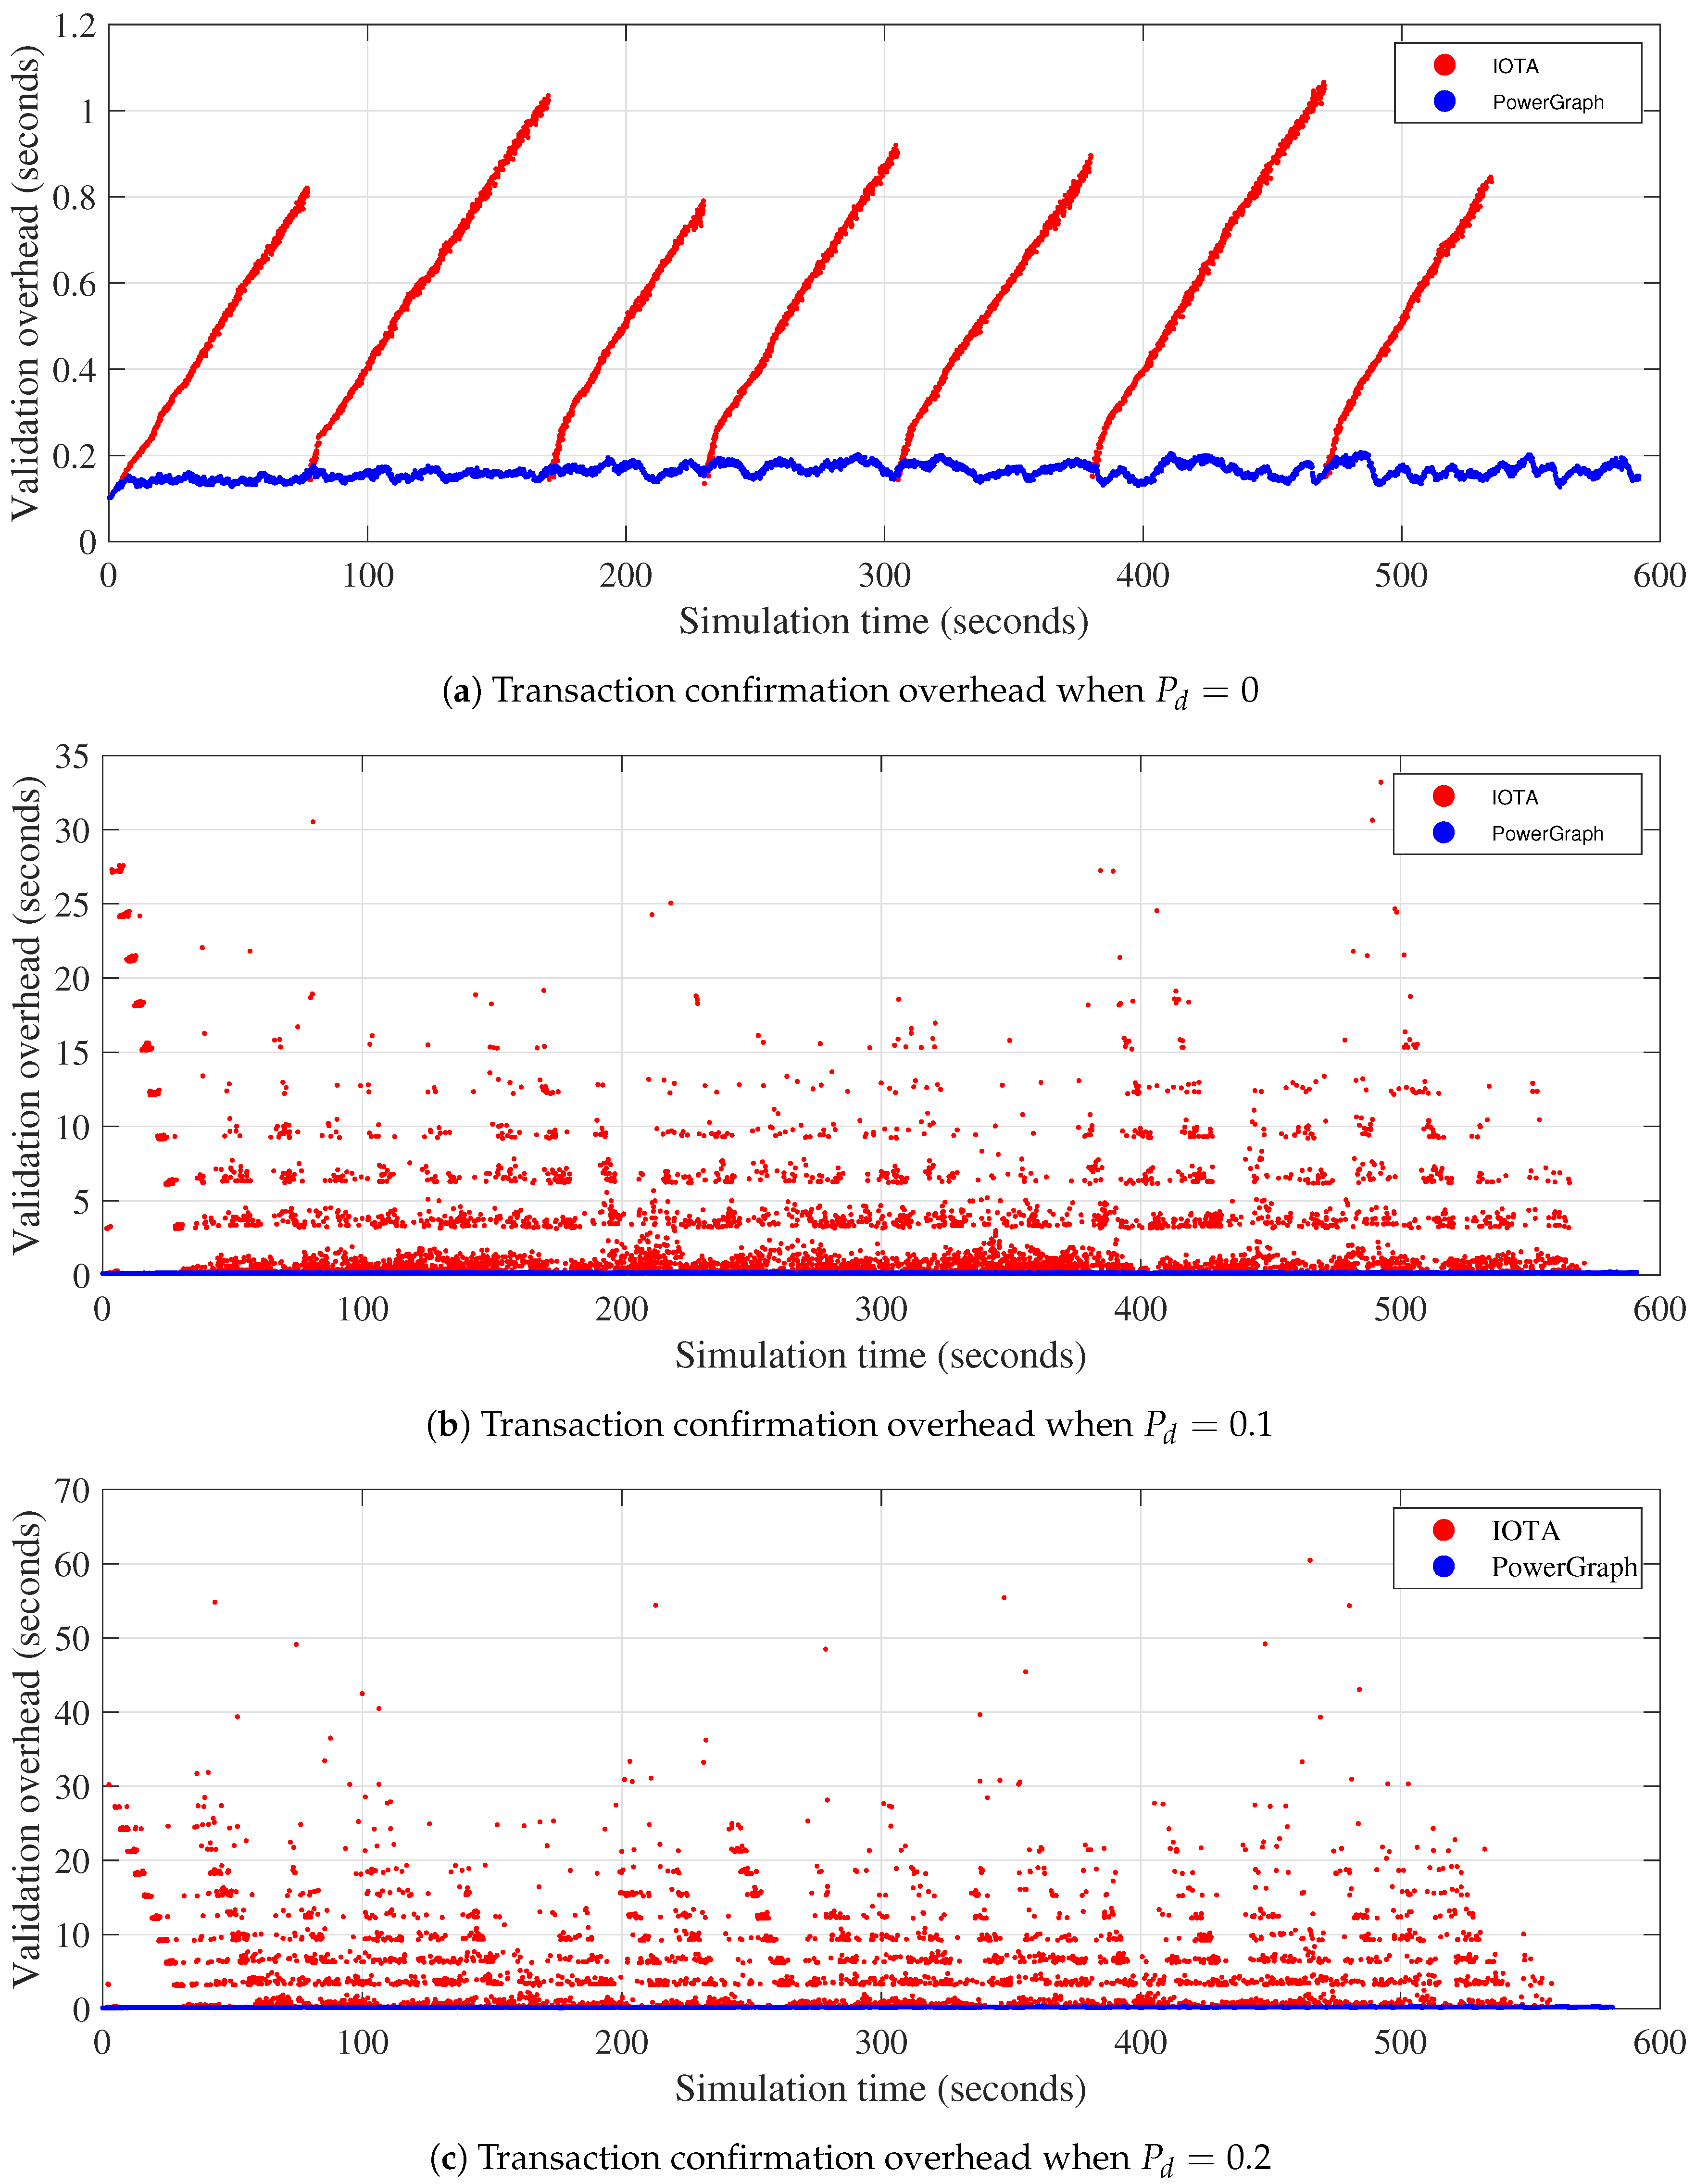
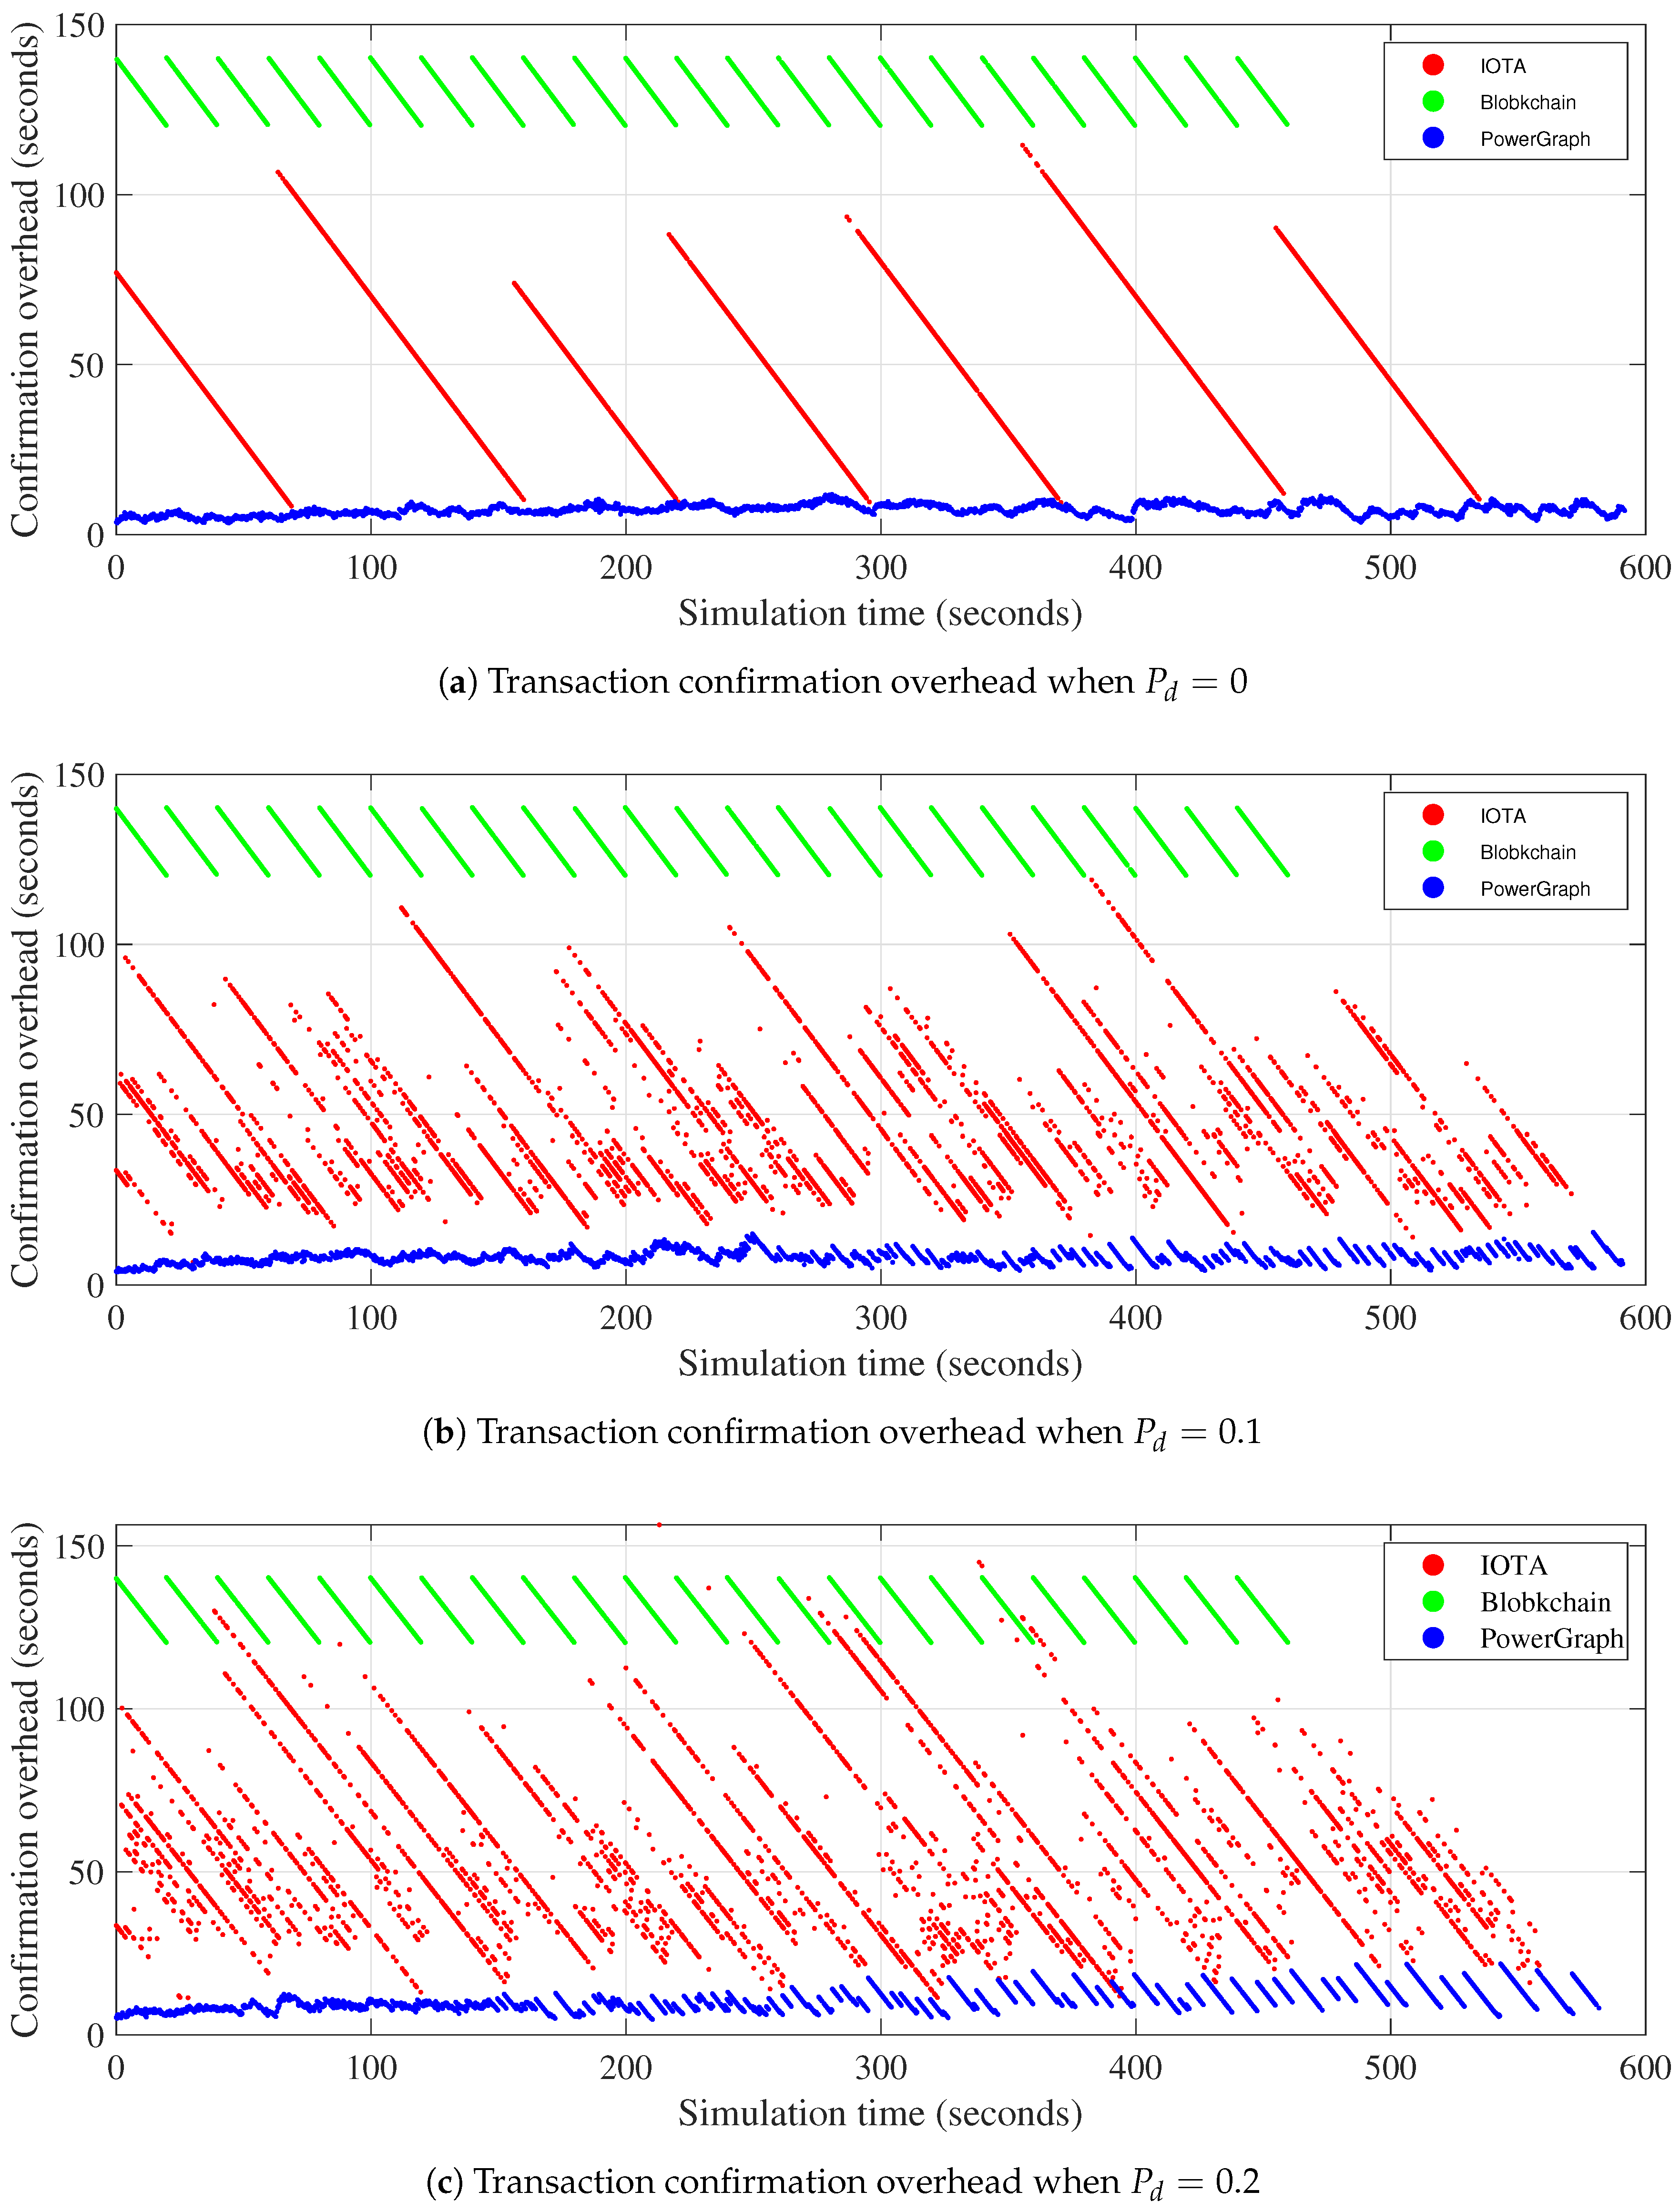
At first, we ran the simulation while varying the double-spending attack ratio to . Figure 7 and Figure 8 show the validation and confirmation overhead of each case, respectively. The x-axis of each plot is the transaction arrival time, so each plot expresses the time-sequential performance flow of each DLT. Figure 7 shows only IOTA and the PowerGraph result, because the difference of validation overhead between these DLTs and the Blockchain is too large to grant the visibility of IOTA and PowerGraph’s cases. As a reference, Blockchain has validation overhead from 20 to 40 s, which means that the transaction has been included at the next block or its next block. In Figure 7a, the validation overhead of the IOTA shows discrete increments with certain period. This result is because the sufficient number of the terminals should be in the graph to process the accurate confirmation. As discussed in Section 2.3.2, over a certain ratio of the terminals should validate the transaction for determining the transaction as confirmed. Delay of the confirmation increases the validation overhead due to the accumulated size of the validation set, and the larger validation overhead leads to the case that the transactions have a greater number of the children, which leads to the width increase. Larger width means the larger number of the terminals, so the graph can perform the confirmation at certain point of the time. After performing the confirmation, the validation set gets smaller again and the width decreases. This cycle is effectively shown in Figure 7a and Figure 8a. However, the validation and confirmation overhead of PowerGraph does not appear such pattern where , since the confirmation and validation process are concurrently performed by SCC handling. Furthermore, when increases, validation overhead of the IOTA reaches up to 30 s (Figure 7b) due to the parent reselection and revalidation. As aforementioned in Section 2.3.2, increasing attack ratio occurs more parent reselections and the revalidations, and the validation overhead reaches to over 60 s at maximum at Figure 7c. In the case of the PowerGraph, there is no revalidation in the system, so validation overhead is relatively stable. The change of the validation overhead in PowerGraph is due to the change of the validation set size, but the size does not diverse since the width of the graph is not widening. At , maximum confirmation overhead of IOTA exceeds the maximum confirmation overhead of the Blockchain (Figure 8c), due to the increasing validation overhead and the width. However, PowerGraph outperforms the case of IOTA with stable and low validation/confirmation overhead regardless of the , due to the continuous confirmation and the adaptive parent selection addressed in Section 2.3.3.
Also, the patterns shown in each figure sometimes overlap among themselves, especially when (Figure 8b,c). The reason of the overlap originates from the randomness of the parent selection. As the width grows, some of the transactions are appended to the existing transactions which can be confirmed after short time passed, and the other are appended to the others which cannot be confirmed soon. Even though the weighted random walk [13] is deployed, the graph in large width can occur the overlap of the patterns. Meanwhile, overlap occurs in almost cases of IOTA and PowerGraph, but the difference of the performance is remarkable due to the fast validation and parallelized confirmation process in PowerGraph.
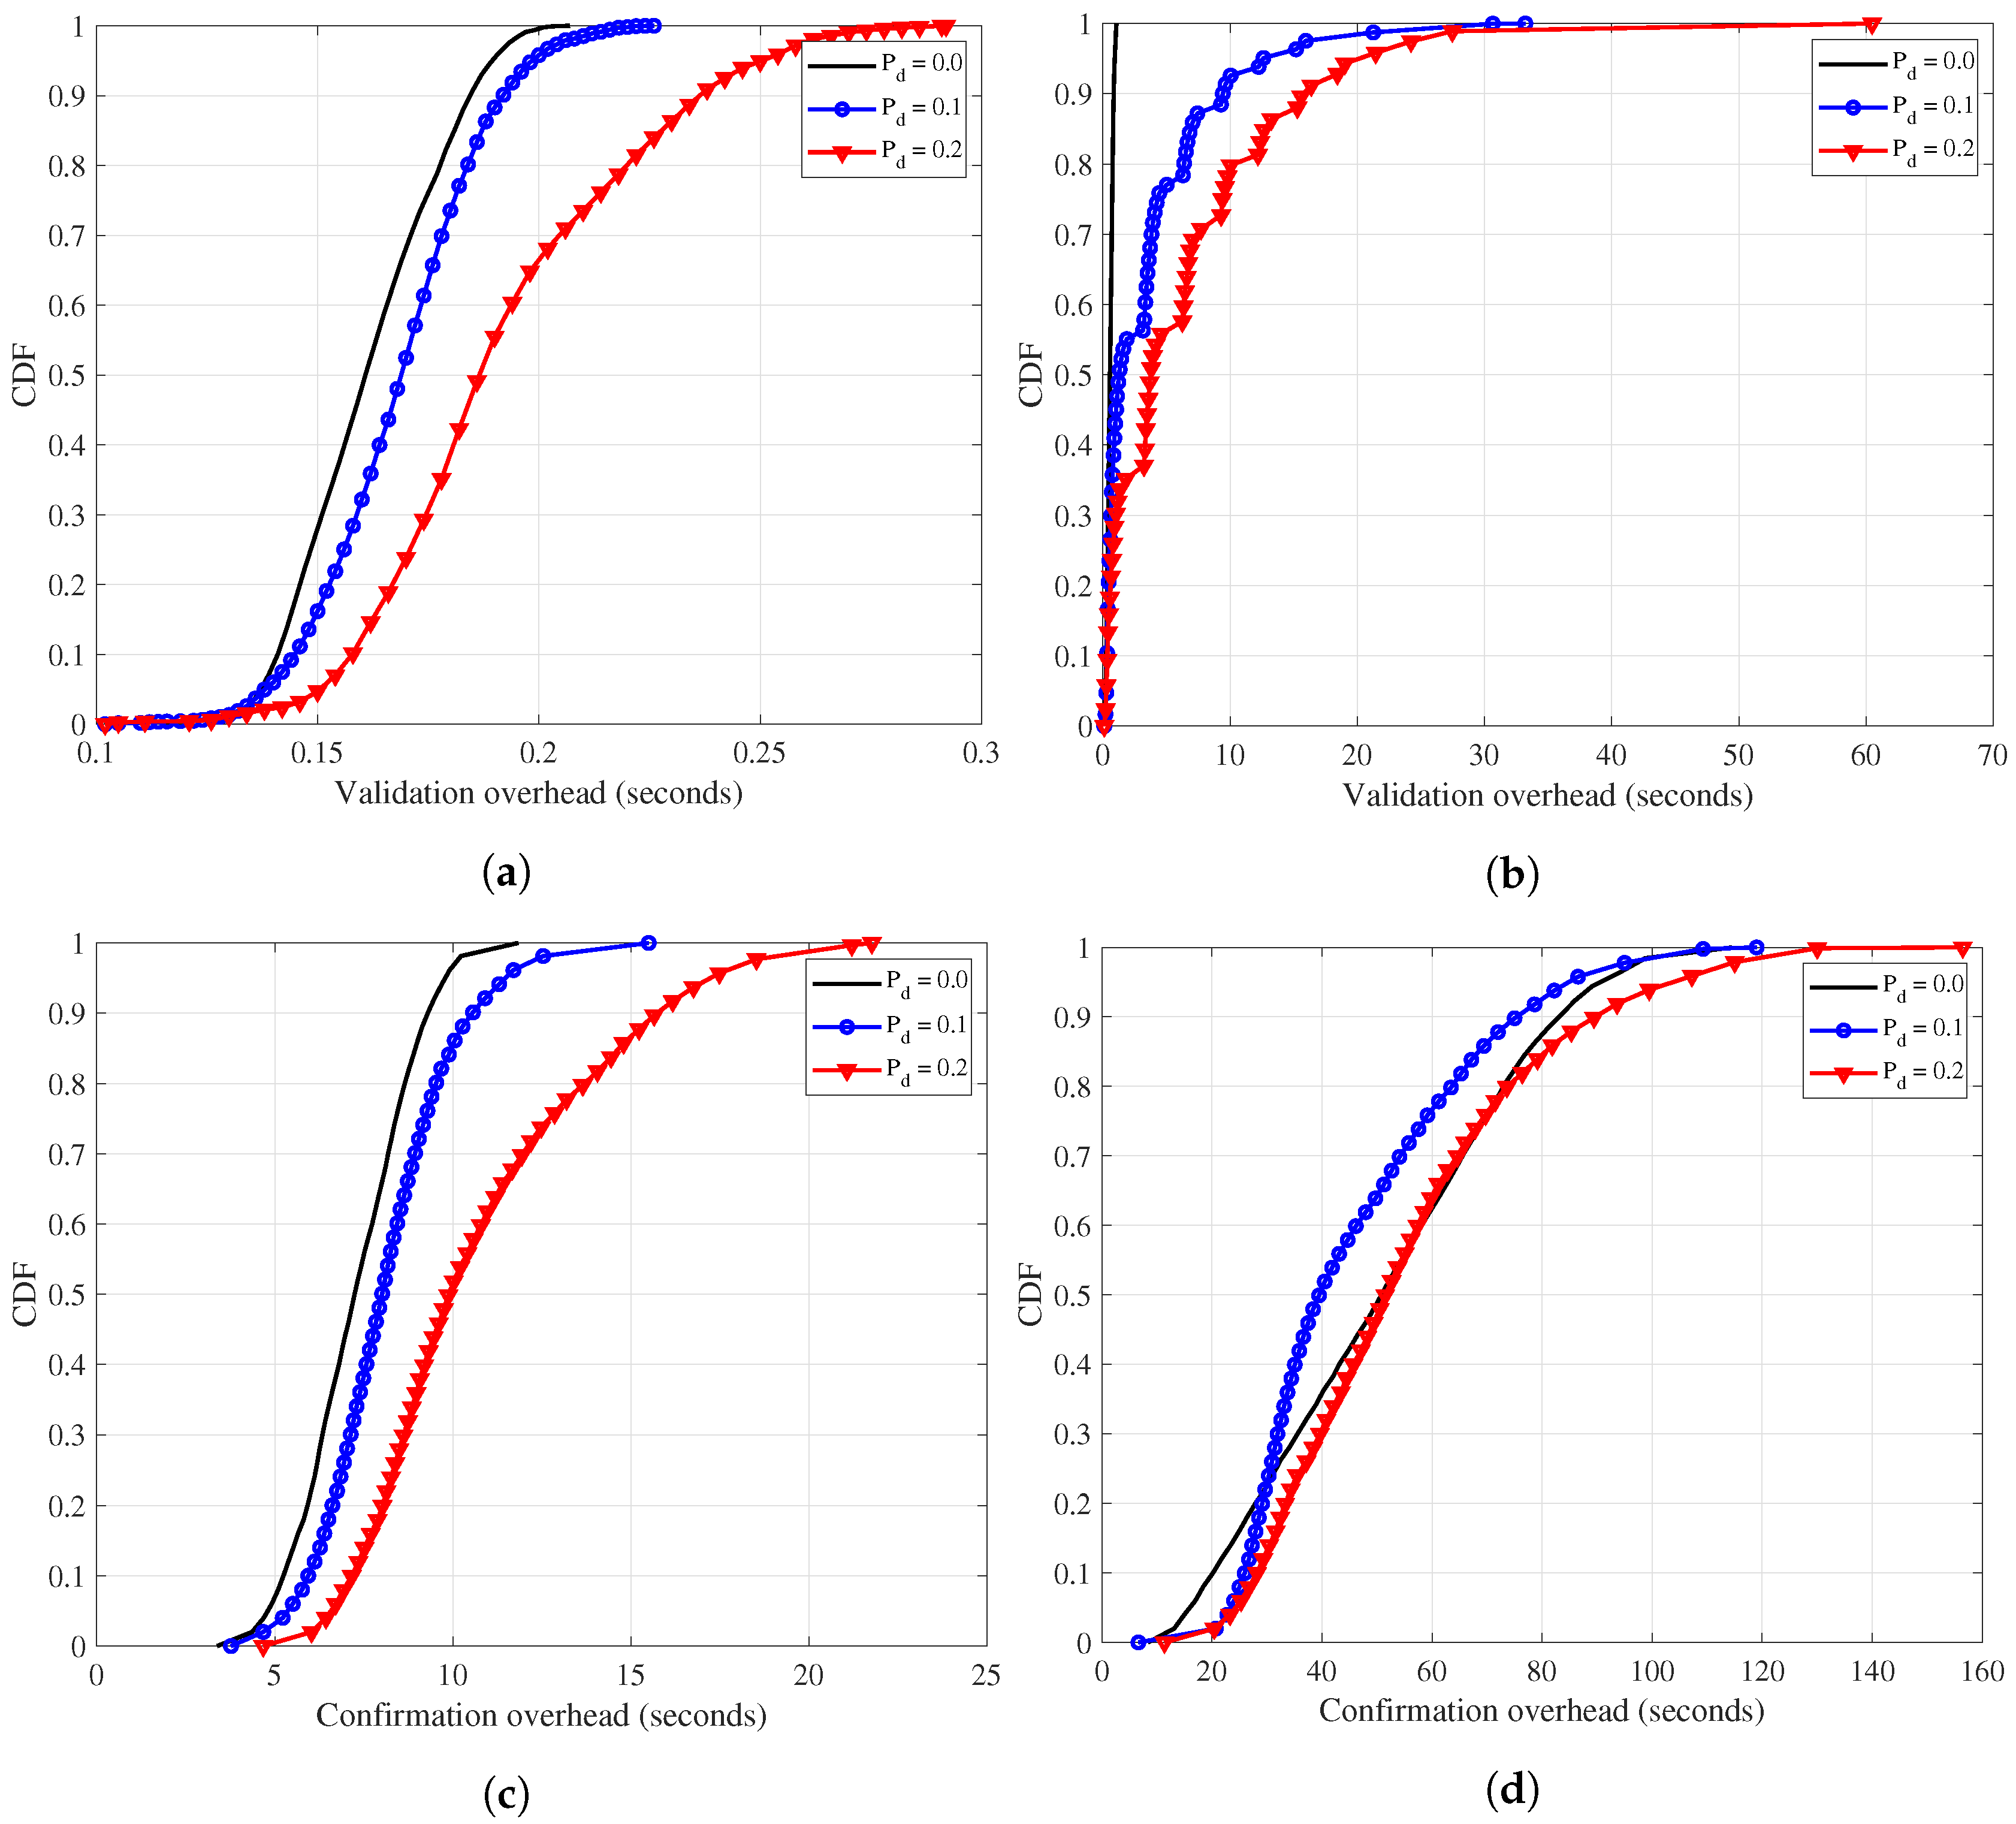
Figure 9 shows the CDF of the validation and confirmation overhead of IOTA and PowerGraph, with respect to . By comparing the median of the results, the transaction confirmation speed of the PowerGraph is about times faster than IOTA when , respectively. The reason that the overhead increases when gets lager is the reduced chance for the benign transactions to increase their SCC. In Algorithm 1, if any of the confliction is detected, all of the transactions at the validation set cannot increase their SCC. However, if the miner increase the SCC of all transactions except the double-spending transactions in each validation process, the transactions that passed the validation by false positive (Figure 5b) have too many chances to increase their SCC, so the detection failure can happen. Furthermore, PowerGraph actively deactivates the double-spending transactions, so the increment of the benign transactions’ SCC occurs after nearby malicious transactions deactivated. Despite this sequence, due to the fast validation and confirmation, overall overhead is much less than the case of IOTA at various . From the simulation results in Figure 7 and Figure 8, we showed that PowerGraph consensus algorithm can achieve low-latency Smart Grid communication with DAG-based DLT and its novel consensus algorithm.
3.2. Transaction Incoming Rate
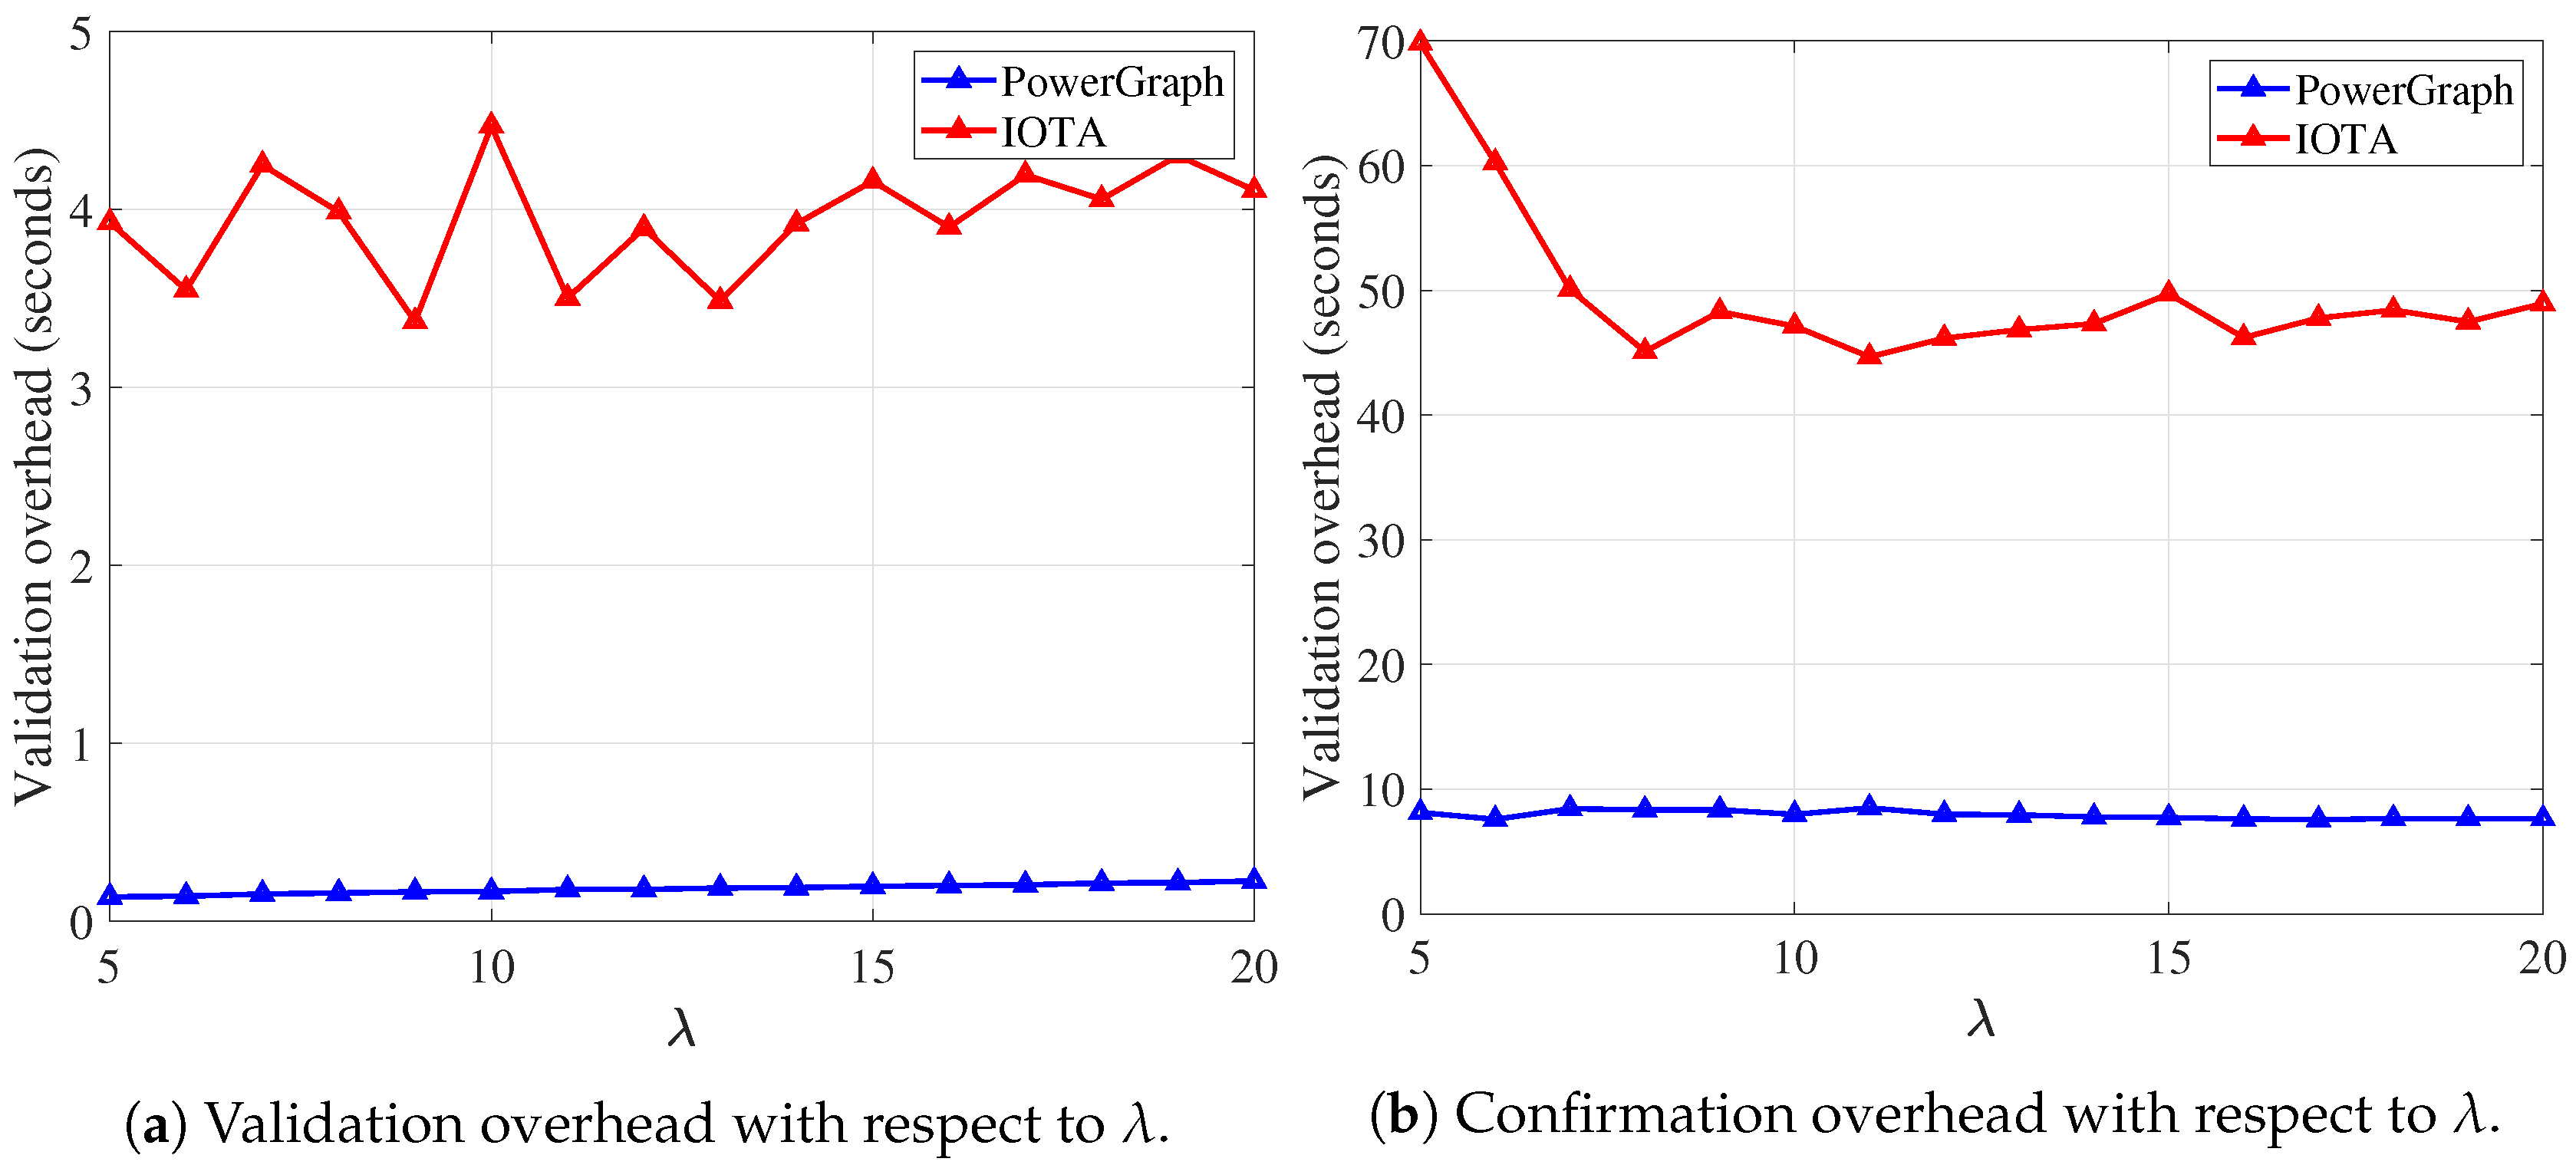
Figure 10 shows the validation and the confirmation overhead of the PowerGraph network while varying . As shown in Figure 10a, both IOTA and PowerGraph increase the validation overhead when increases. When the transaction incoming rate increases, the width of the graph and the size of the validation set also increases, which can lead to the high increment of the validation overhead. PowerGraph and IOTA cope with this situation in different ways. In the case of IOTA, increasing results in the more chances to perform the confirmation, so the average validation overhead can only increase slightly. On the other hand, PowerGraph adaptively determines the number of the parents according to the number of the current terminals, so the confirmation overhead does not greatly increase, thus the validation overhead also does not. The notable performance change only appears when is relatively low. At , lower shows larger confirmation overhead in IOTA. The reason for this result is due to the confirmation condition, as aforementioned in Section 3.1. To ensure a high detection ratio of the double-spending transaction, the confirmation should be performed when a certain number of the terminals are in the graph. However, with lower , the remaining number of the terminals is relatively small because the terminals appended in the graph quickly obtains their child by the following transactions. To break this dependency, generating dummy transactions to increase the number of the terminals in the graph can be one of the solutions, but this resource redundancy is not efficient and hard to be controlled according to the varying . PowerGraph does not require such confirmation condition, since the confirmation procedure of the transaction is continuously being processed along the validation of the other transactions, by accumulating its SCC value. From this examination, we can conclude that PowerGraph outperforms IOTA regardless of the changes.
3.3. Practical Scenario
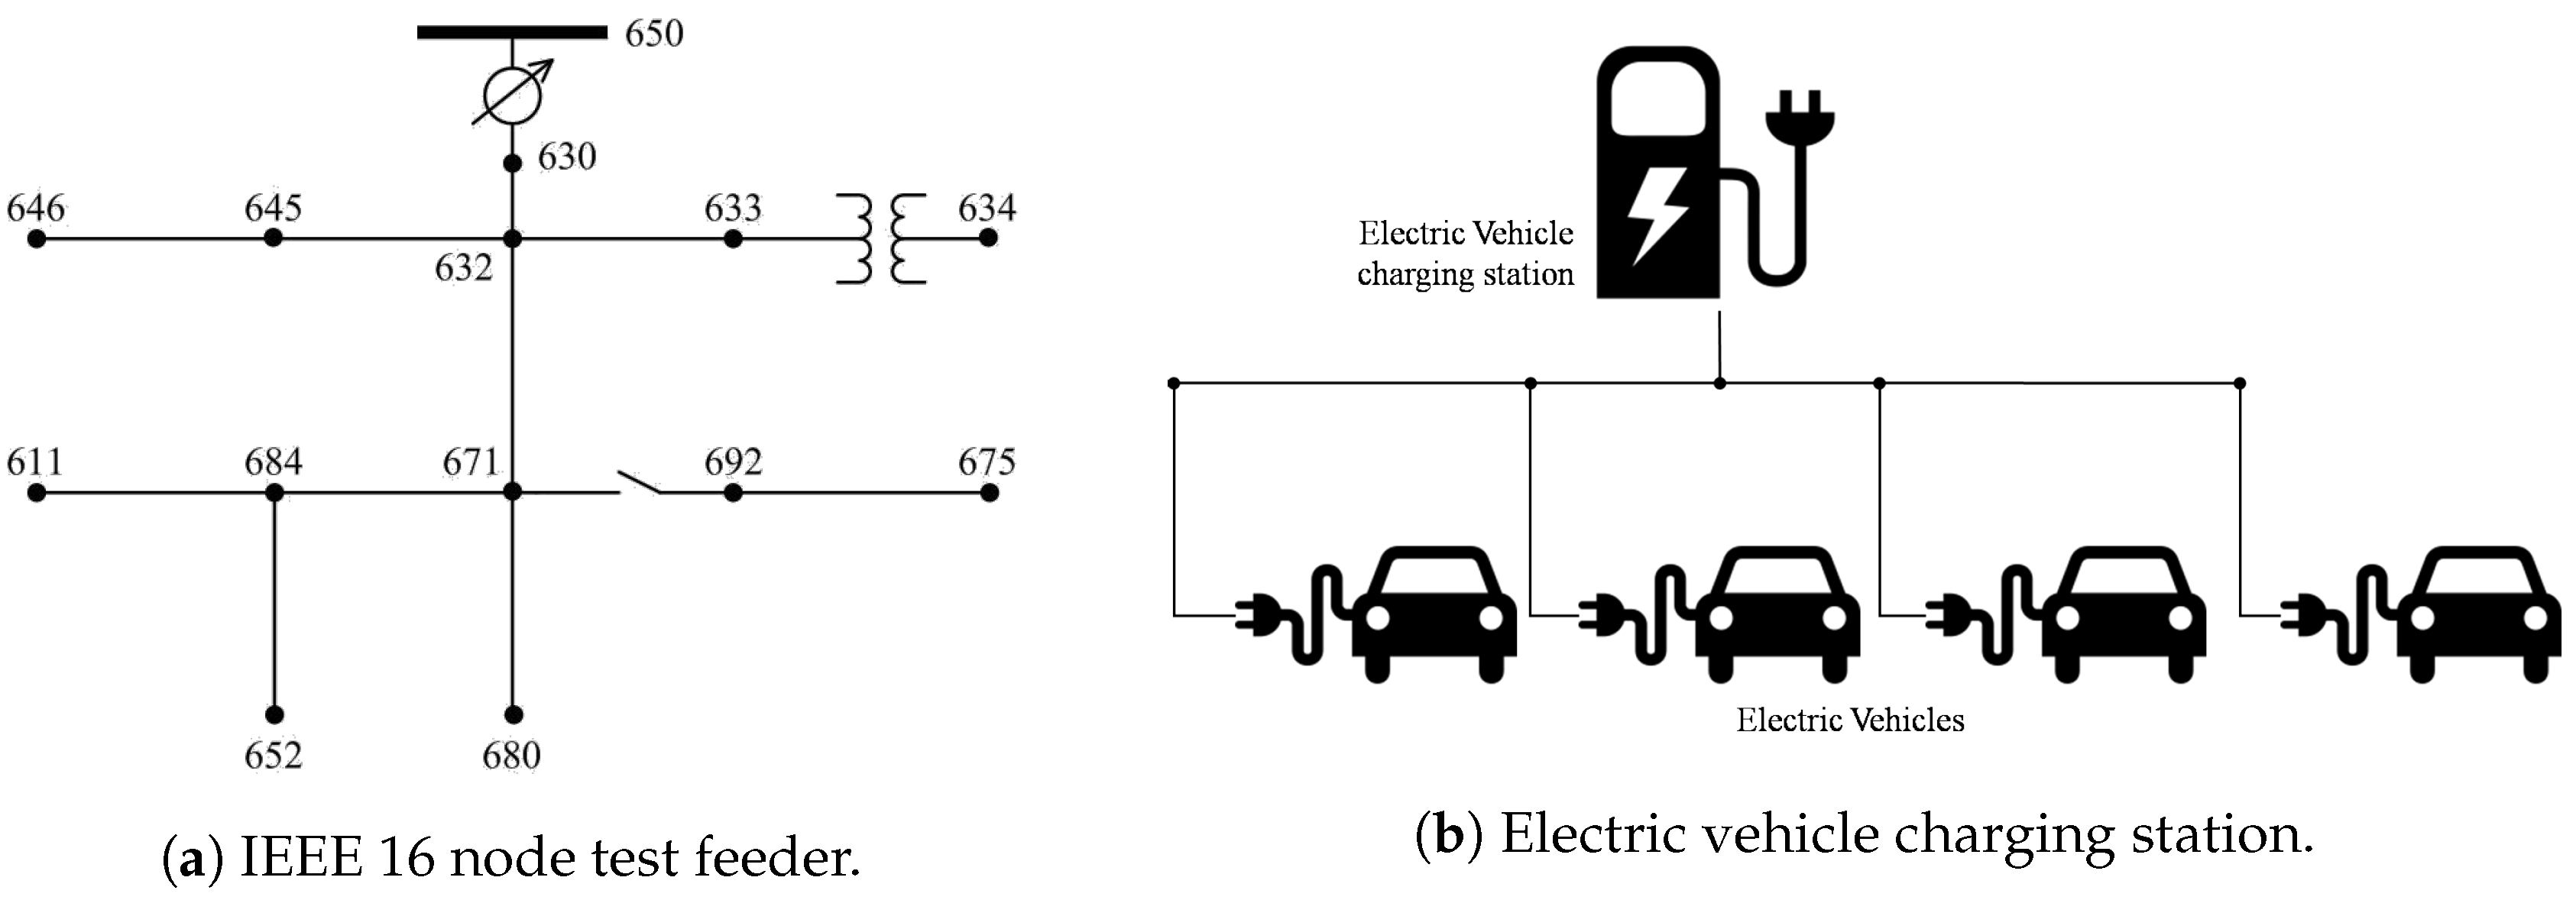
To show the applicability of the PowerGraph, we ran our simulation with the practical Smart Grid environments. We used two scenarios for testing the PowerGraph in practical cases. One is a Smart Grid power distribution feeder designed by IEEE [17] that describes an exemplary power distribution environment, called IEEE 16-node test feeder (Figure 11a). The reason for using the feeder is to simulate our proposed system in the practical benchmark system, which is widely used for Smart Grid research [2]. We assumed a completely distributed environment of the system where each node equips both the AMI and the ESS so that the nodes can sell or buy the electricity from each other. This means that we set the number of AMIs to 16 and let the nodes generate several the power connection lines. The other is a simple scenario shaping the electric vehicle charging station as shown in Figure 11b. In this case, we set the number of power sources to 3, and AMIs to 10 following the topology of the charging station. Finally, from each power connection lines of the scenarios, we set the transaction generation time t to . The difference between the above evaluations is the fluctuation of the , which can be result in the performance fluctuation. Also, we set to in each scenario.
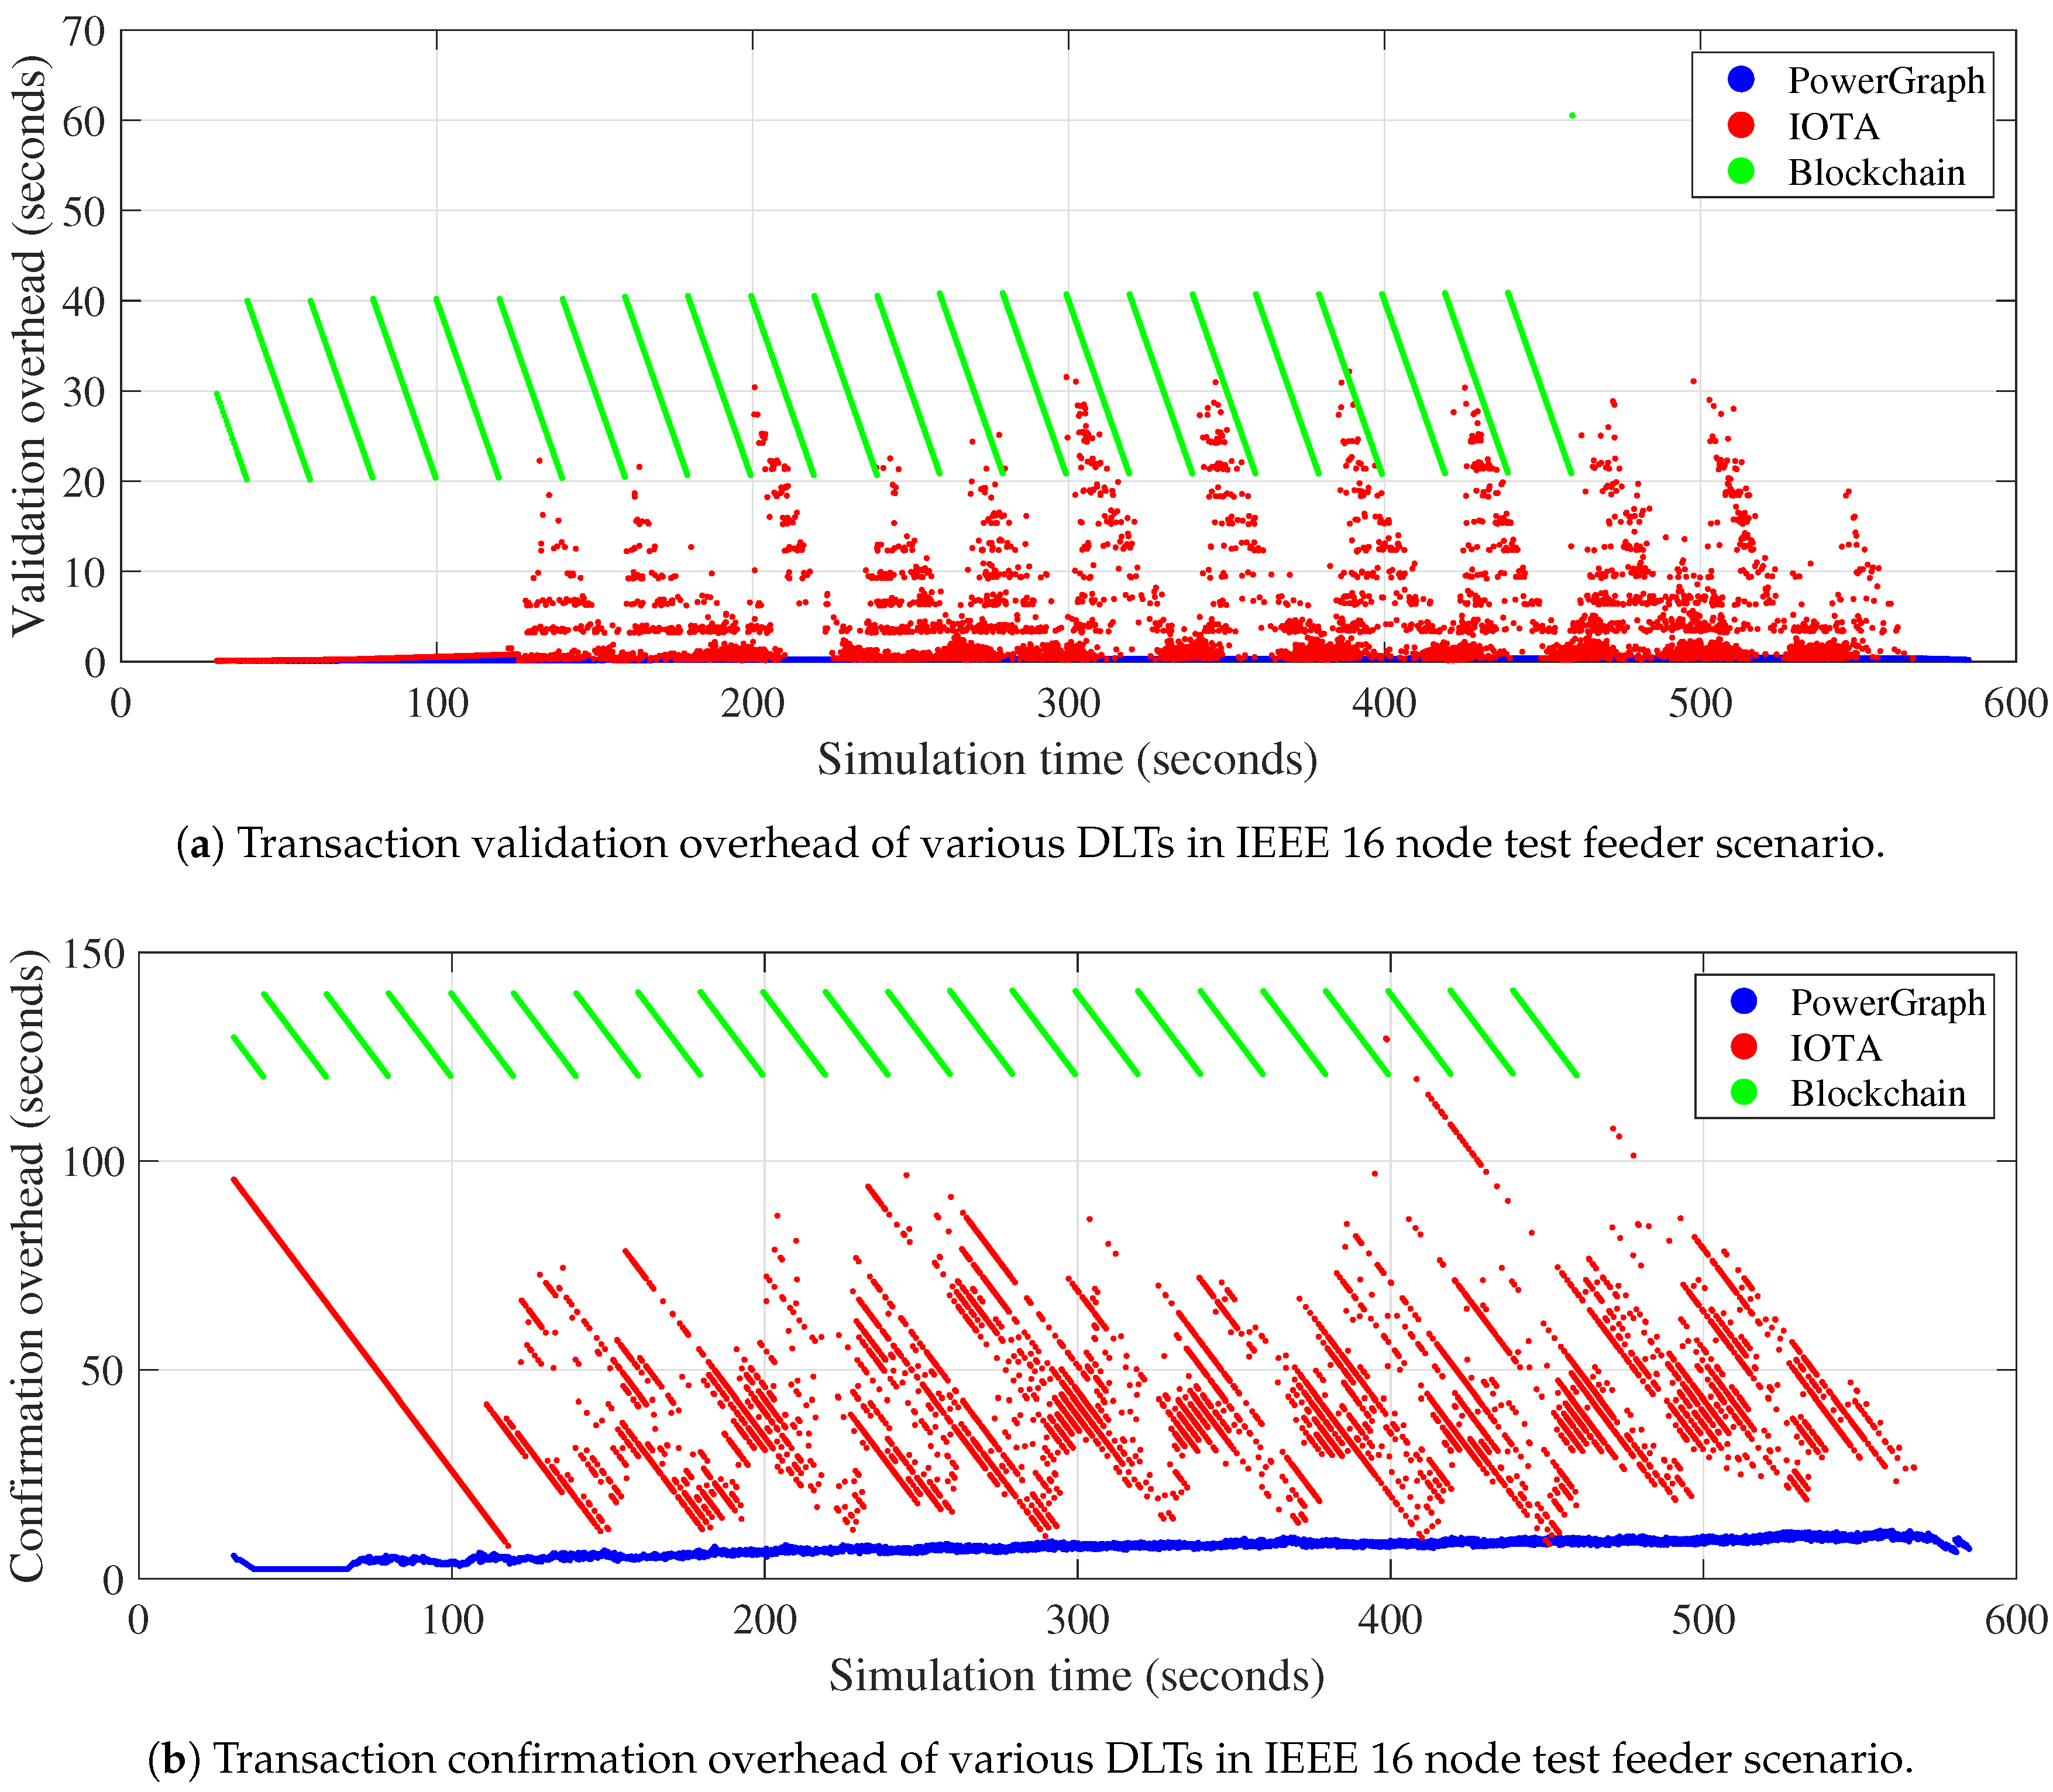
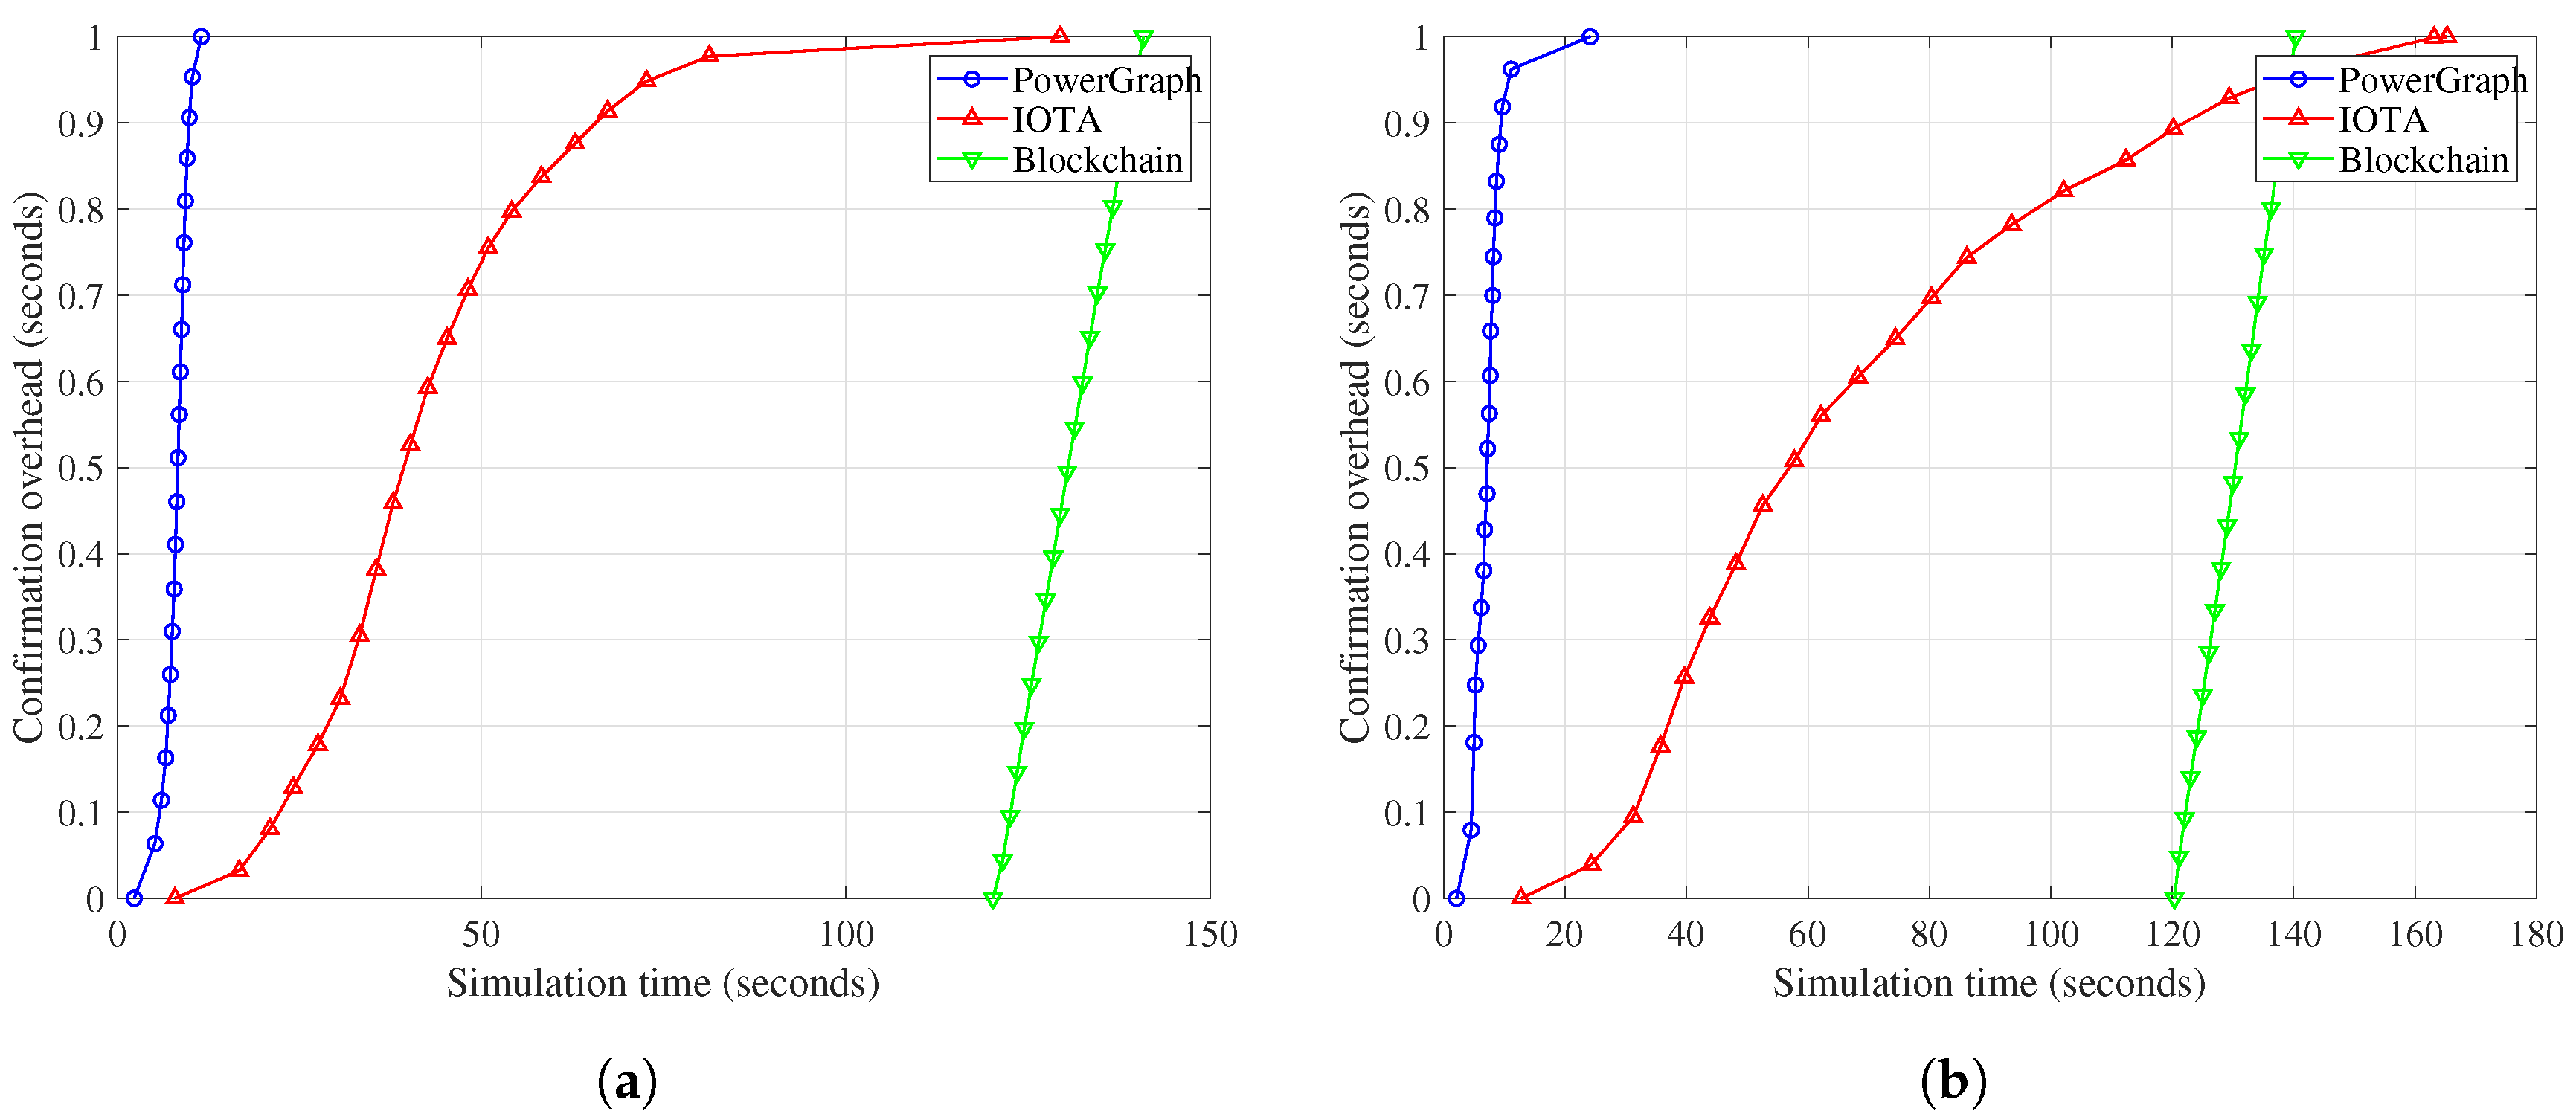
Figure 12a,b show the overhead flow of each DLT in the case of IEEE 16-node test feeder. In the figures, the cases of Blockchain and IOTA show the fluctuated overhead of the validation and confirmation, as discussed Section 3.1. The overhead in PowerGraph also shows some patterns after 300 s, but the amount of the fluctuation is much smaller than the other cases. It is notable that the overhead of IOTA is almost larger than the Blockchain’s case, which can be explained by the delayed confirmation of the transactions. The case of the electric vehicle charging station is shown in Figure 13a,b, and the overhead of the PowerGraph also outperforms the other methods. Figure 14a,b show the distribution of the transaction finalization time of each scenario. As shown in PDF, PowerGraph consumes maximum 20% of IOTA and about 6% of Blockchain transaction processing time. It is notable that the performance difference indicated in the two cases originates from the difference of the network delay and the transaction incoming rate. PowerGraph shows the higher performance than the IOTA and the Blockchain in both of the cases, due to the continuous confirmation, the constantly low validation overhead, and the adaptive parent selection.
3.4. Remark on Evaluation Results
We summarized the observations and the findings from the evaluations from Section 3.1, Section 3.2 and Section 3.3.
- Depending on the environmental factor and , the flow of the confirmation and the validation overhead can be varied. IOTA shows the patterned shape of the performance with respect to the simulation time, which is mainly due to the discretized and probabilistic process of the confirmation. The patterned shape results in the increment of the confirmation overhead of the system, which results in about 60 s, and this is about 5 to 7 times larger than the PowerGraph’s overhead. The overhead flow of the PowerGraph shows the little scale of the patterned shape in , or no pattern in , due to the continuous confirmation and deactivation of the transactions, based on Algorithm 1.
- As increases, the confirmation and validation overhead also increase. The equipped mechanism in each DLT restrains the overhead increase, so we show the slight increment of the overhead in Figure 10. However, due to the conditional confirmation, IOTA shows low performance when is low. This might be the misunderstanding of the IOTA system since its source code is not entirely in public [18], but potential solutions for this situation might be centralized or inefficient in terms of the validation network. On the other hand, PowerGraph shows stable performance in the entire domain, which implies the large applicability of our system.
- In the evaluations with practical scenario, PowerGraph shows outperforming results in transaction finalization time, shown in Figure 12 and Figure 13. We showed that PowerGraph can sustain its confirmation and validation overhead where varies in a simulation. Also, while changing various factors such as and , PowerGraph always shows highly accelerated performance in entire evaluations. From the evaluations, we argue that our consensus algorithm used in PowerGraph can be widely applied at the various scale of the Smart Grid systems.
Although PowerGraph shows outperforming results with its continuous consensus algorithm, some disadvantages of the system should be considered for exhaustive use. At first, as shown in Figure 9, increasing delays the transaction finalization time, as other DAG-based DLTs experience. From Algorithm 1, we can derive that PowerGraph first filters out the malicious transactions, then increases SCCs of the benign transactions. Increasing the SCC of benign transactions regardless of the malice can be an option, but in this case, we suffered from the high ratio of the wrong determination of double-spending transactions. With more delicate auxiliaries for the algorithm, concurrent increments and decrements of SCCs can guarantee the trusty of the PowerGraph consensus without performance degradation. Also, when abruptly increases, the number of the parents p of incoming transactions highly increases for a short time, which can result in the fluctuation of the transaction finalization time. Although this fluctuation of PowerGraph is still much lower than that of IOTA, this can be harmful to the Smart Grid environment. By controlling p smoothly, PowerGraph can maintain the proper W while equalizing the transaction validation overhead.
4. Conclusions
In this paper, we proposed to design PowerGraph, which constructs a distributed ledger system with DAG-based cryptocurrency. PowerGraph not only validates the electricity trading, but also monitors the power distribution of Smart Grid network. To achieve the complex validation, PowerGraph subdivides the types of transaction and tracks the power generation, charge, and distribution status. Furthermore, we proposed a novel consensus algorithm for PowerGraph to reduce the transaction processing overhead. By numerical evaluation, we showed that the PowerGraph outperforms the existing DLT systems.
Since the PowerGraph achieves the low-latency validation system for the Smart Grid, we can augment our design to spread to the other layer of the Smart Grid architecture. We can exploit the power distribution network to rapidly reach the optimal power distribution, since PowerGraph network secures the clear ledger composed of the confirmed power transactions. To that end, we can design a complex DR solution or power pricing system exploiting the PowerGraph’s validation process. Also, finding the best parameter of the performance of the variable environments can result in the performance improvements of the PowerGraph. Finally, we can import the state-of-the-art DLT improvements such as sharding and the AI-based performance enhancing, and localize to the PowerGraph to properly work with our proposed system. The advanced design of the PowerGraph can lead to the higher stabilization of the overall Smart Network architecture. We expect that our approach can inspire the Smart Grid and the DAG-based cryptocurrency research domain.
Author Contributions
Conceptualization, S.P. and H.K.; methodology, S.P. and H.K.; software, S.P.; validation, H.K.; formal analysis, S.P.; investigation, S.P.; writing—original draft preparation, S.P.; writing—review and editing, S.P. and H.K.; visualization, S.P.; supervision, H.K.; project administration, H.K.; funding acquisition, H.K.
Funding
This work was funded by “Human Resources program in Energy Technology” of the Korea Institute of Energy Technology Evaluation and Planning (KETEP) granted financial resource from the Ministry of Trade, Industry & Energy, Republic of Korea (No. 20174030201820). This work was funded by the Brain Korea 21 Plus Project in 2019.
Conflicts of Interest
The authors declare no conflict of interest. The founding sponsors had no role in the design of the study; in the collection, analyses, or interpretation of data; in the writing of the manuscript, or in the decision to publish the result.
Abbreviations
The following abbreviations are used in this manuscript:
| DLT | Distributed Ledger Technology |
| AMI | Advanced Measurement Interface |
| ESS | Energy Storage System |
| DER | Distributed Energy Resources |
| DAG | Directed Acyclic Graph |
References
- Bae, M.; Kim, H.; Kim, E.; Chung, A.Y.; Kim, H.; Roh, J.H. Toward electricity retail competition: Survey and case study on technical infrastructure for advanced electricity market system. Appl. Energy 2014, 133, 252–273. [Google Scholar] [CrossRef]
- Kim, H.; Kim, K.; Park, S.; Kim, H.; Kim, H. Cosimulating communication networks and electrical system for performance evaluation in smart grid. Appl. Sci. 2018, 8, 85. [Google Scholar] [CrossRef]
- Kim, K.; Kim, H.; Jung, J.; Kim, H. AFAR: A robust and delay-constrained communication framework for smart grid applications. Comput. Netw. 2015, 91, 1–25. [Google Scholar] [CrossRef]
- Bae, M.; Lee, D.K.; Kim, H.; Kim, H. Self-configuring topology switch in smart home network. In Proceedings of the IEEE 2013 International Conference on ICT Convergence (ICTC), Jeju Island, South Korea, 14–16 October 2013; pp. 496–501. [Google Scholar]
- Son, H.; Kang, T.Y.; Kim, H.; Roh, J.H. A secure framework for protecting customer collaboration in intelligent power grids. IEEE Trans. Smart Grid 2011, 2, 759–769. [Google Scholar] [CrossRef]
- Son, H.; Kang, T.; Kim, H.; Park, J.B.; Roh, J.H. A fair and secure bandwidth allocation for AMI mesh network in smart grid. Comput. J. 2012, 55, 1232–1243. [Google Scholar] [CrossRef]
- Kang, T.; Kim, H. Preserving privacy with anonymity for customer collaboration in smart grid. In Proceedings of the IEEE 2012 18th Asia-Pacific Conference on Communications (APCC), Jeju Island, South Korea, 15–17 October 2012; pp. 724–729. [Google Scholar]
- Abdella, J.; Shuaib, K. Peer to peer distributed energy trading in smart grids: A survey. Energies 2018, 11, 1560. [Google Scholar] [CrossRef]
- Pieroni, A.; Scarpato, N.; Di Nunzio, L.; Fallucchi, F.; Raso, M. Smarter city: Smart energy grid based on blockchain technology. Int. J. Adv. Sci. Eng. Inf. Technol. 2018, 8, 298–306. [Google Scholar] [CrossRef]
- Kim, S.K.; Huh, J.H. A study on the improvement of smart grid security performance and blockchain smart grid perspective. Energies 2018, 11, 1973. [Google Scholar] [CrossRef]
- Cachin, C.; Vukolić, M. Blockchain consensus protocols in the wild. arXiv 2017, arXiv:1707.01873. [Google Scholar]
- Sompolinsky, Y.; Zohar, A. Accelerating Bitcoin’s Transaction Processing. Fast Money Grows on Trees, Not Chains. Iacr Cryptol. Eprint Arch. 2013. Available online: https://pdfs.semanticscholar.org/4016/80ef12c04c247c50737b9114c169c660aab9.pdf (accessed on 18 September 2019).
- Popov, S. The tangle. 2016. Available online: http://tanglereport.com/wp-content/uploads/2018/01/IOTA_Whitepaper.pdf (accessed on 18 September 2019).
- Seongjoon, P.; Seounghwan, O.; Hwangnam, K. Performance Analysis of DAG-Based cryptocurrency. In Proceedings of the 2019 IEEE International Conference on Communications Workshops (ICC Workshops), Shanghai, China, 20–24 May 2019. [Google Scholar]
- A Video of MDIP-Energies Manuscript (Demonstration of the PowerGraph Implementation). 2019. Available online: https://youtu.be/K5Uo1TIx_KM (accessed on 17 September 2019).
- Nguyen, G.T.; Kim, K. A Survey about Consensus Algorithms Used in Blockchain. J. Inf. Process. Syst. 2018, 14, 101–128. [Google Scholar]
- Kersting, W.H. Radial distribution test feeders. IEEE Trans. Power Syst. 2001, 2, 908–912. [Google Scholar]
- Siim, J. DAG-Based Distributed Ledgers. 2018. Available online: https://pdfs.semanticscholar.org/ca34/671d3a031f821345e705e00a2cd2a927d0c3.pdf?_ga=2.17730161.996692292.1568690468-1898638640.1500009594 (accessed on 18 September 2019).
Figure 1.
PowerGraph concept.

Figure 2.
PowerGraph sample database.

Figure 3.
PowerGraph sample procedure.

Figure 4.
Previous DAG-based DLT structure.

Figure 5.
DAG validation cases.

Figure 6.
PowerGraph consensus algorithm implementation.

Figure 7.
Validation overhead while varying attack ratio.

Figure 8.
Confirmation overhead with respect to attack ratio.

Figure 9.
CDF of the validation and confirmation overhead with respect to . (a) Validation overhead CDF of PowerGraph with respect to ; (b) Validation overhead CDF of IOTA with respect to ; (c) Confirmation overhead CDF of PowerGraph with respect to ; (d) Confirmation overhead CDF of IOTA with respect to .

Figure 10.
Simulation results with respect to .

Figure 11.
Use cases of the simulation scenario.

Figure 12.
Simulation results in IEEE 16-node test feeder scenario.

Figure 13.
Simulation results in electric vehicle charging scenario.

Figure 14.
CDF of transaction processing overhead compared to various DLTs. (a) Transaction processing overhead CDF of various DLTs in IEEE 16 node test feeder scenario; (b) Transaction processing overhead CDF of various DLTs in electric vehicle charging scenario.
Figure 14.
CDF of transaction processing overhead compared to various DLTs. (a) Transaction processing overhead CDF of various DLTs in IEEE 16 node test feeder scenario; (b) Transaction processing overhead CDF of various DLTs in electric vehicle charging scenario.


Table 1.
Simulation parameters.
| Item | Value |
|---|---|
| Proof-of-Work overhead (IOTA and PowerGraph) | s |
| Unit validation overhead | s |
| The number of Reference transactions | 4 |
| IOTA conformation threshold | 90% |
| IOTA confirmation condition | 20 terminals |
| IOTA revalidation interval | 3 s |
| Simulation time | 600 s |
© 2019 by the authors. Licensee MDPI, Basel, Switzerland. This article is an open access article distributed under the terms and conditions of the Creative Commons Attribution (CC BY) license (http://creativecommons.org/licenses/by/4.0/).
Share and Cite
MDPI and ACS Style
Park, S.; Kim, H. DAG-Based Distributed Ledger for Low-Latency Smart Grid Network. Energies 2019, 12, 3570. https://0-doi-org.brum.beds.ac.uk/10.3390/en12183570
AMA Style
Park S, Kim H. DAG-Based Distributed Ledger for Low-Latency Smart Grid Network. Energies. 2019; 12(18):3570. https://0-doi-org.brum.beds.ac.uk/10.3390/en12183570
Chicago/Turabian StylePark, Seongjoon, and Hwangnam Kim. 2019. "DAG-Based Distributed Ledger for Low-Latency Smart Grid Network" Energies 12, no. 18: 3570. https://0-doi-org.brum.beds.ac.uk/10.3390/en12183570
Note that from the first issue of 2016, this journal uses article numbers instead of page numbers. See further details here.