Experimental Study of Particle Deposition on Surface at Different Mainstream Velocity and Temperature


School of Power and Energy, Northwestern Polytechnical University, Xi’an 710129, China
*
Author to whom correspondence should be addressed.
Energies 2019, 12(4), 747; https://0-doi-org.brum.beds.ac.uk/10.3390/en12040747
Submission received: 23 January 2019
/
Revised: 19 February 2019
/
Accepted: 20 February 2019
/
Published: 24 February 2019
(This article belongs to the Special Issue Fluid Flow and Heat Transfer)
Abstract
:The effect of mainstream velocity and mainstream temperature on the behavior of deposition on a flat plate surface has been investigated experimentally. Molten wax particles were injected to generate particle deposition in a two-phase flow wind tunnel. Tests indicated that deposition occurs mainly at the leading edge and the middle and backward portions of the windward side. The mass of deposition at the leading edge was far more than that on the windward and lee sides. For the windward and lee sides, deposition mass increased as the mainstream velocity was increased for a given particle concentration. Capture efficiency was found to increase initially until the mainstream velocity reaches a certain value, where it begins to drop with mainstream velocity increasing. For the leading edge, capture efficiency followed a similar trend due to deposition spallation and detachment induced by aerodynamic shear at high velocity. Deposition formation was also strongly affected by the mainstream temperature due to its control of particle phase (solid or liquid). Capture efficiency initially increased with increasing mainstream temperature until a certain threshold temperature (near the wax melting point). Subsequently, it began to decrease, for wax detaches from the model surface when subjected to the aerodynamic force at the surface temperature above the wax melting point.
1. Introduction
Aero-engines would encounter particle laden air flows when operating in environments with a high concentration of airborne particles during extended service. Sand, fly ash, debris and other external particles may flow into the engine combustion, once introduced into the inlet airflow. A majority of particles flow through the combustion along the main channel flow, and subsequently attack the hot component surface through deposition. The temperature is in excess of 2400 K in the primary combustion zone, far above the particle melting temperature (Tmelt). Particles may flow through the engine without any effect, or impact on the surface by means of rebounding, spreading, spattering or adhering [1,2,3], possibly experiencing phase transition and deposition afterwards. Deposition is a complex physical and chemical process. Deposition on the turbine blade would dramatically increase the surface roughness and block film cooling holes in certain conditions, which could lead to a loss in aerodynamic and cooling efficiency [4,5]. For land-based gas turbines, trace amounts of foreign matter in fuels and carbon microparticles generated from the burning of raw energy sources can be injected into the turbine along with the main flow and subsequently deposited on the blade surface, which will affect its heat transfer characteristics and aerodynamic performance. In addition, a growing number of impurities are found in the urban environment, indicating more particles flow into the combustion along the turbine cascade passage once ingested into the engine. This could shorten part life and increase the risk of operation failure [6,7].
To date, the deposition of sand and coal ash on gas turbine engines has been studied by multiple researchers. Kim et al. [8] conducted an experimental study of volcanic ash particle deposition. They found that blockage of film cooling holes could cause damage to vanes at the normal inlet temperature. Koenig et al. [9] explored the negative effect of gas-particle two phase flow on gas turbine blade surfaces by experimental investigation. They found that if particle-laden gas flowed over the blade surface at high temperatures, molten particles would be deposited in the proximity of the blade cooling holes, causing a degradation in turbine blade cooling performance.
However, deposition study on a turbine is neither cost nor time efficient. To improve efficiency and enable cost savings, Jensen et al. [10] designed the Turbine Accelerated Deposition Facility (TADF) to generate deposition in a 4 h test that could simulate 10,000 h of turbine operation. They conducted validation tests to simulate the ingestion of foreign particles typically found in an urban environment by seeding a combustion with large concentrations of airborne particles. Crosby et al. [11] studied the effects of particle size, inlet temperature, and impingement cooling on deposition. They noted that deposition growth increased as particle mass mean diameter, inlet temperature, and target coupon temperature increased, based on a series of 4-h deposition tests. Furthermore, deposition thickness became more uniform at a lower test model surface temperature for a given inlet temperature. Wammack et al. [12] studied the behaviors of deposition on a flat plate with three kinds of surface treatments. They observed extensive spallation of the thermal barrier coated coupons caused by successive deposition. Ai et al. [13] utilized the TADF to generate particle deposition on a test model with film cooling holes. Hot gas flow impinged on the film-cooled target surface at 45 deg. The coupon surface temperature was measured by a red, green, bule (RGB) camera, allowing measurement of spatial temperature distribution to evaluate the influence of deposition thickness on surface heat transfer and film cooling performance. Bonilla et al. [14] studied how particle size affected ash deposition on nozzle guide vanes (NGVs) from a CFM56-5B aero engine. Lundgreen et al. [15] constructed a new turbine cascade to study the deposition on an actual blade surface at turbine mainstream temperatures of 1350 °C, 1265 °C, and 1090 °C. They found that deposition mass on the pressure surface increased as the mainstream temperature increased. The largest amount of deposition occurred on the leading edge. Whitaker et al. [16] noted that the mass of deposition on the blade surface was dependent on particle size distribution, indicating that microparticles with larger sizes were easier to deposit on the surface. They concluded that a reduction of inflow turbulence intensity could slow down the deposition buildup and extend the service life of the turbine. Laycock et al. [17] investigated the independent effects of mainstream temperature and surface temperature on fly ash deposition at elevated operating temperatures. They found capture efficiency increased as the mainstream temperature increased. It showed an increase until a certain threshold temperature and then a decrease, with increasing initial deposition surface temperature.
Recently, a considerable effort has been devoted to developing computational models for the prediction of particle deposition behavior. Numerical models of deposition mainly include two types of models, the critical velocity model and the critical viscosity model. As proposed by Brach and Dunn [18] in the former model, a particle will adhere to a surface when the incoming velocity of the particle (critical velocity) is larger than the particle normal impact velocity. Based on the former model, Zhou and Zhang [19] studied the characteristics of particle deposition on the film-cooled wall numerically and the effect of particle size and blowing ratio on deposition efficiency of shaped holes. Bons et al. [20] subsequently improved the critical velocity model and simulated the particle deposition on a turbine vane surface [21]. They found that capture efficiency increased initially with Stokes number (St), and then decreased rapidly when St > 1.5. In the latter model, the particle viscosity at the softening temperature is considered as the reference viscosity and the sticking probability value is dependent on the relationship between particle viscosity and the reference value. When the particle viscosity is less than or equal to the critical value, the sticking probability value is assumed to be 100%, whereas for higher particle viscosity, capture efficiency decreased with increasing particle viscosity. Based on the latter model, Sreedharan and Tafti [22] investigated the deposition of ash particles impinging on a flat of 45° wedge-shape geometry numerically. They found that the majority of the ash deposition occurred near the stagnation region and capture efficiency increased with increase in jet temperature. Yang and Zhu [23] investigated the particle deposition in the vane passage numerically according to the model. They found that the mainstream temperature and capture efficiency were positively related, but deposition distribution was less sensitive to temperature. Considering the coupled effect that deposition has on the flow geometry, Forsyth et al. [24,25] took advantage of the dynamic mesh morphing technique to make an accurate prediction of particle deposition and found that varied surface topology caused by deposition could be the reason for marked change in fluid and particle velocity. With a similar method, Liu et al. [26] modelled the deposition of particles of different sizes numerically. They investigated the independent effect of particle size on the deposition mass and found that the deposition mass increased with the increasing particle size.
Model-size scaling and test condition scaling are required, due to the stringent test conditions and limitations of necessary measurements at the engine-representative temperature. Lawson et al. [27] constructed a low-speed open loop wind tunnel facility to simulate wax deposition on an endwall with film cooling holes. They modeled the sand and coal ash with atomized molten wax droplets. Particle Stokes number and thermal scaling parameter (TSP) were matched based on the similarity laws. Albert et al. [28,29] adopted a similar method to investigate the wax microparticle deposition on a blade leading edge and pressure side in a closed loop wind tunnel at low operating temperatures. The effect of particle deposition on surface heat transfer characteristics has been thoroughly investigated. However, few studies have been performed to shed light on deposition distribution under different inlet operating conditions.
A deeper understanding of the particle deposition mechanism and characteristics would provide a more accurate quantification of deposition effect on the efficiency and performance of engines. The objectives of the study were to investigate wax particle deposition behavior experimentally in an open loop wind tunnel facility and explore the individual effects of mainstream velocity and temperature on spatial distribution of particle deposition on a flat plate.
2. Experimental Facilities and Procedures
2.1. Experimental Facilities and Model
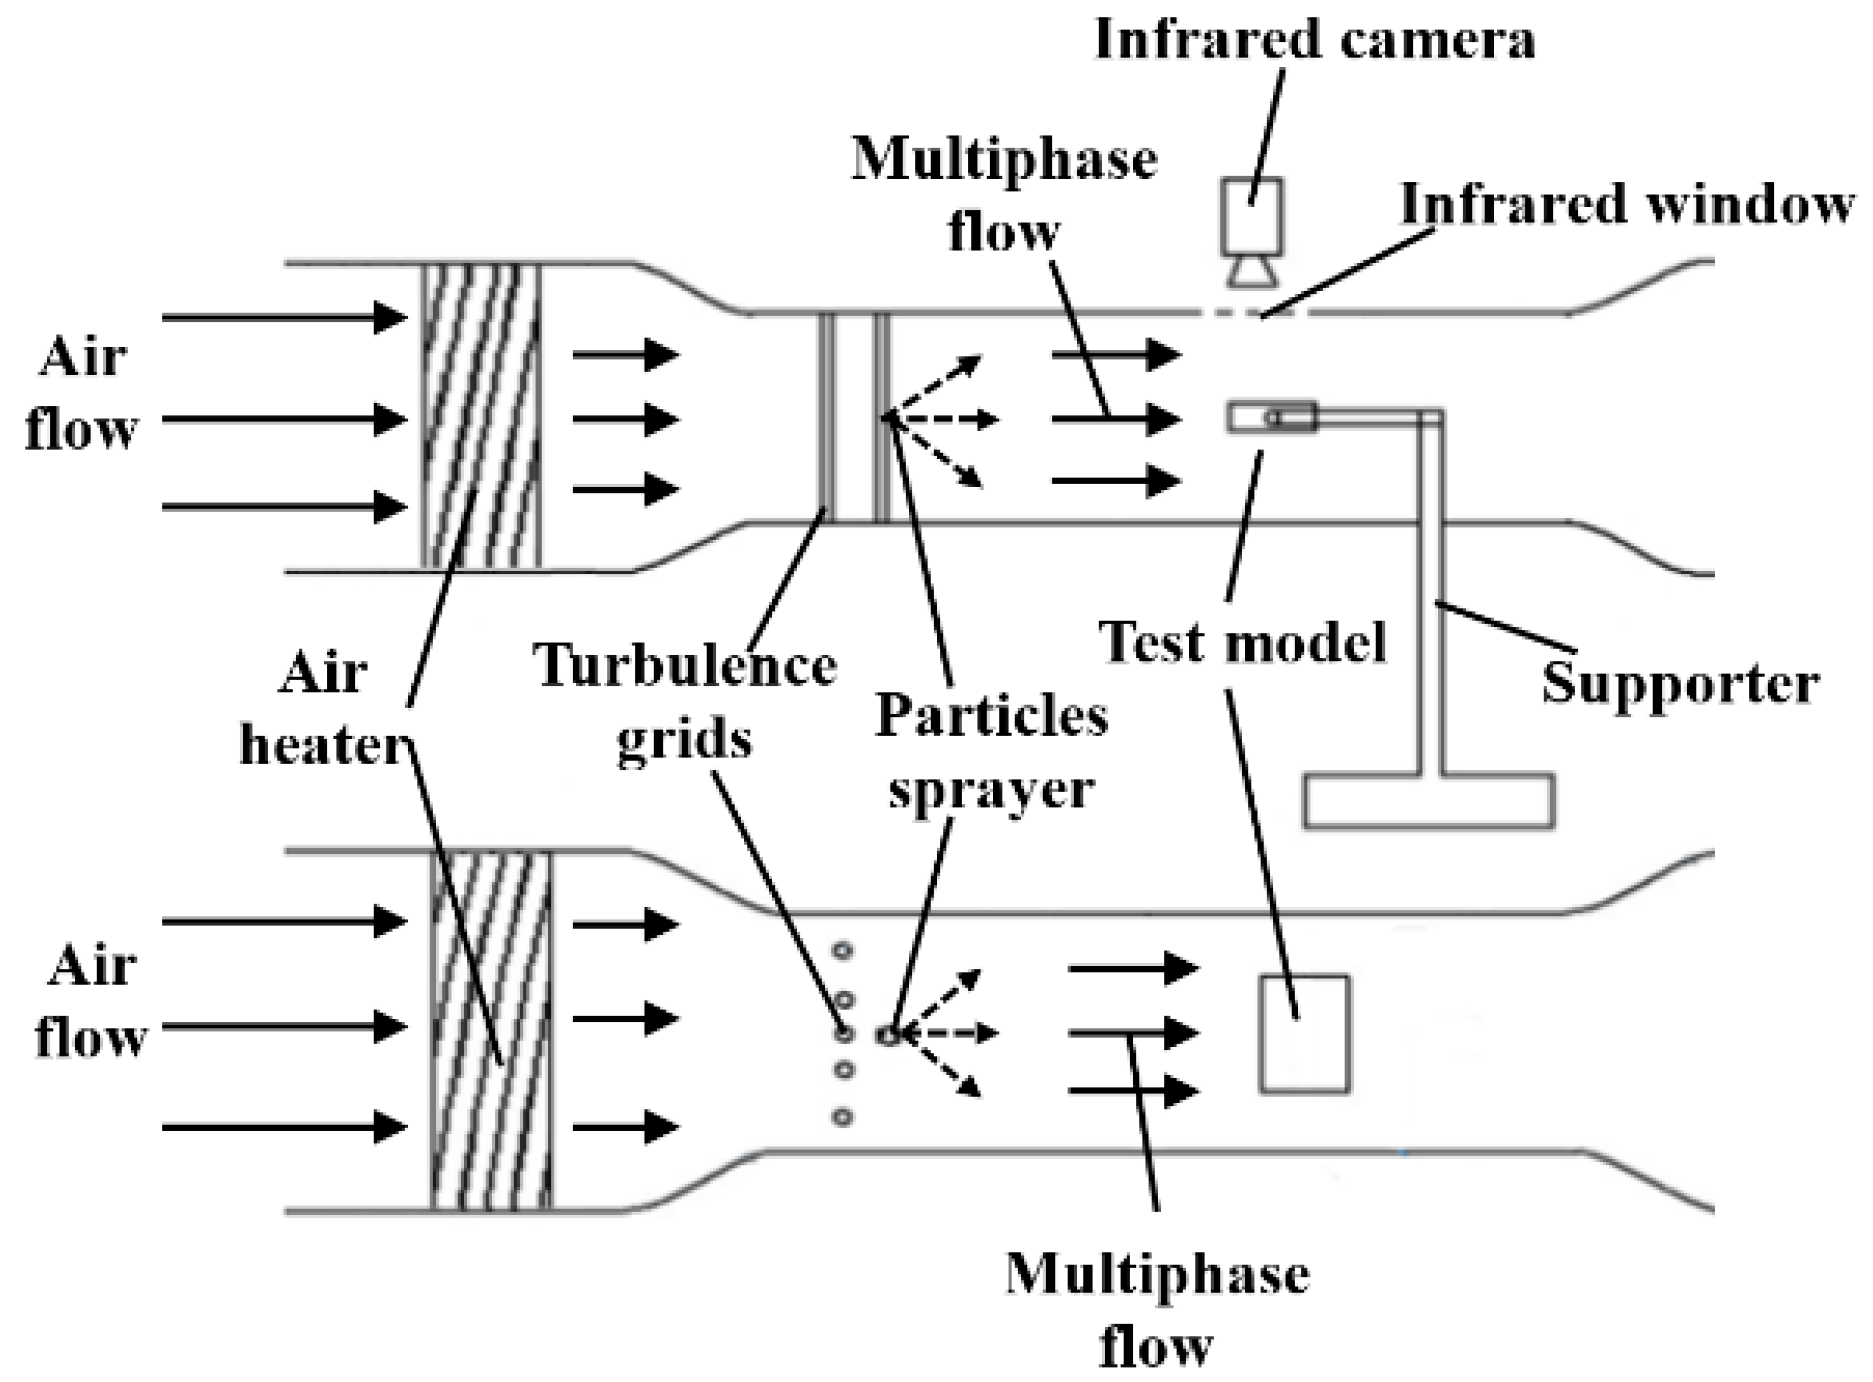
Tests for this study were carried out in an open loop wind tunnel. The wind tunnel inlet mainstream is driven by two axial fans, after which the flow passes through an air heater, turbulence grids, and a wax sprayer before entering the test section (Figure 1). Mainstream flow is warmed in the air heater to simulate gas from engine combustors. Turbulence grids are situated behind the air heater and comprised of a series of vertically-oriented bars. They help to generate turbulence, thus simulating the actual operating conditions for engines. A wax sprayer is positioned at the center of the wind tunnel behind the turbulence grids. Wax particles could be seeded across the span of test section from the sprayer head. Atomized molten wax particles are delivered to the test section by the wind tunnel mainstream flow. They then impact the model surface to simulate the deposition phenomenon that occurs for sand particles in an actual gas turbine flow-path. The surface temperature is measured by an IR camera and calibrated in situ by a thermocouple (error ≤ 1 °C). The mass of deposition on the test model is measured by an analytical balance with a high precision degree of 0.005 mg (METTLER TOLEDO XPE206DR).
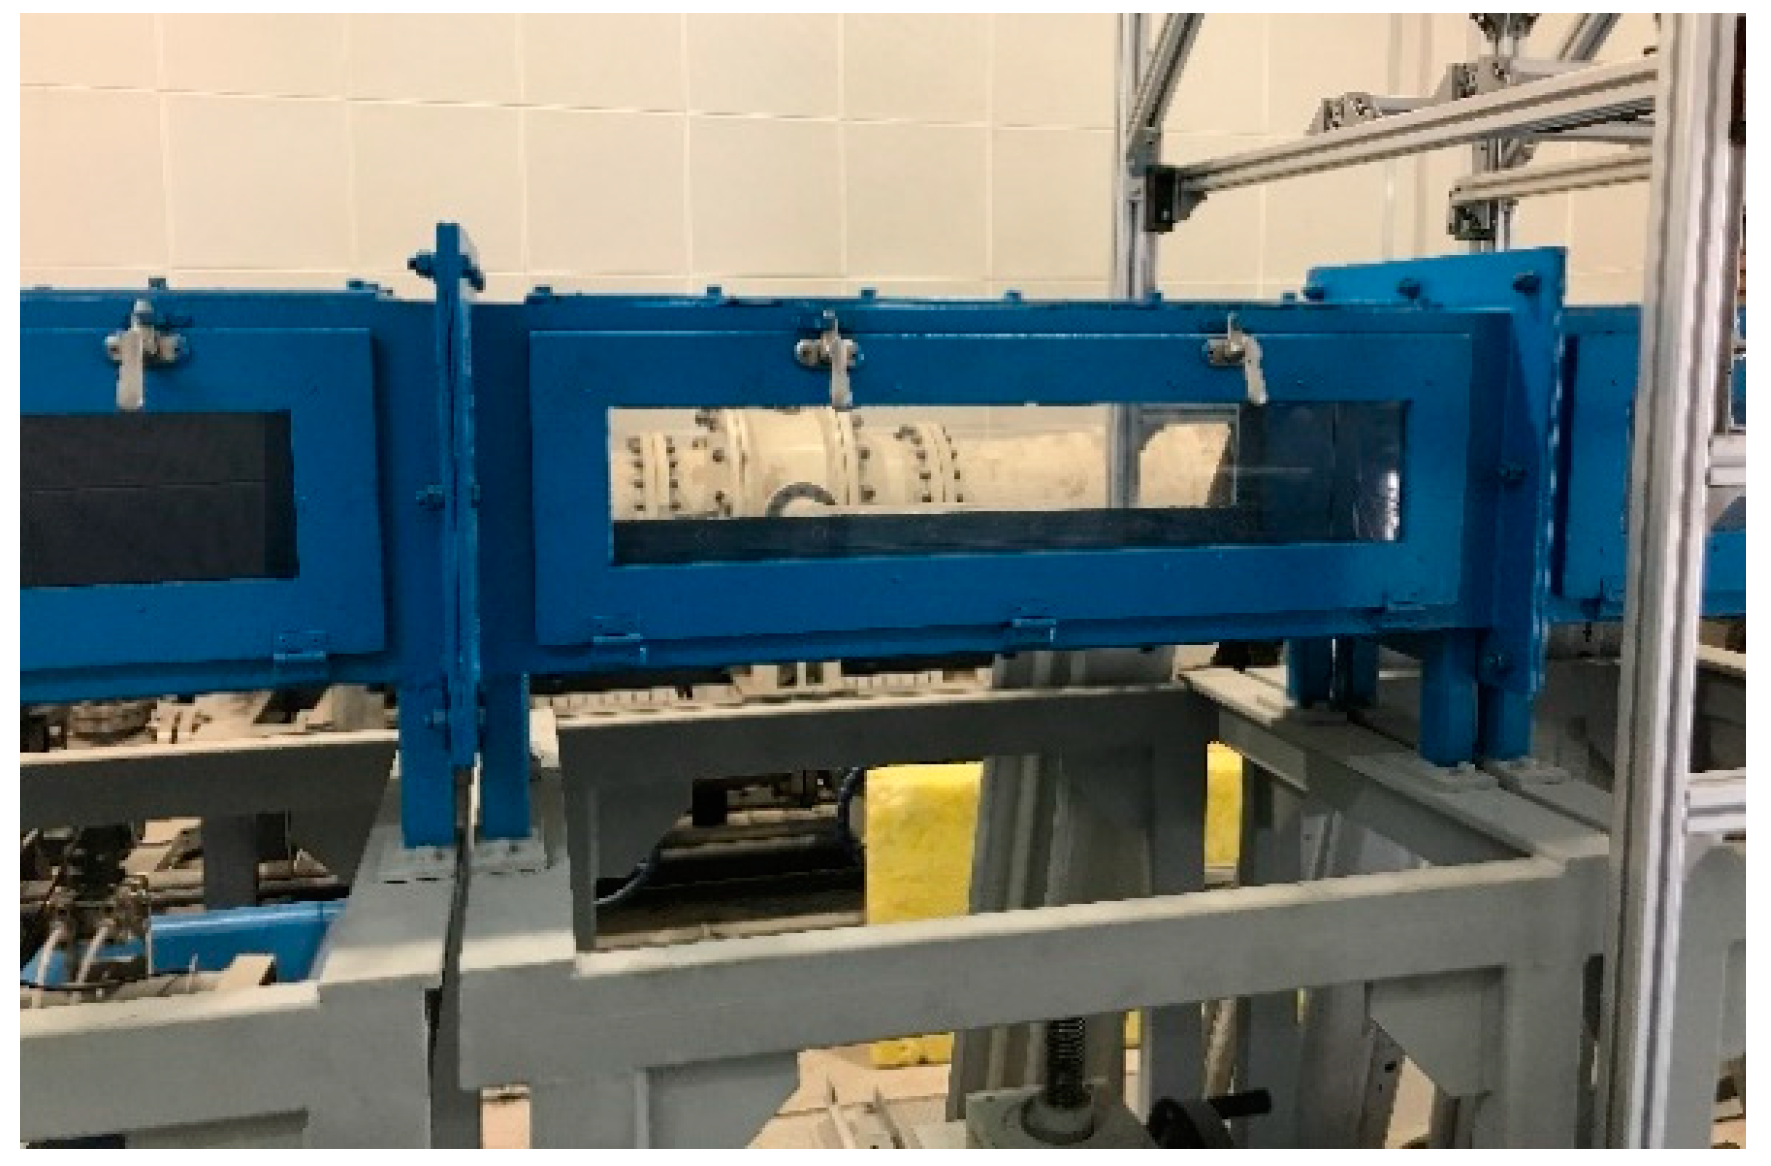
The test section is 0.3 m in width, 0.3 m in height, and 2.5 m in length (Figure 2). The model could be viewed through glass windows in the test section walls. The mainstream approach velocity could be maintained in a range of 5–40 m/s. The mainstream flow temperature is measured by a thermal resistor (uncertainty: ±0.15 °C). The thermal resistor sends temperature feedback signals to a temperature controller, which adjusts power output of the air heater based on the input current. With this method, mainstream flow could attain a stabilized temperature during testing. The mainstream temperature could be increased by 70 °C at most. Both operating parameter range and sensor accuracy are summarized and listed in Table 1.
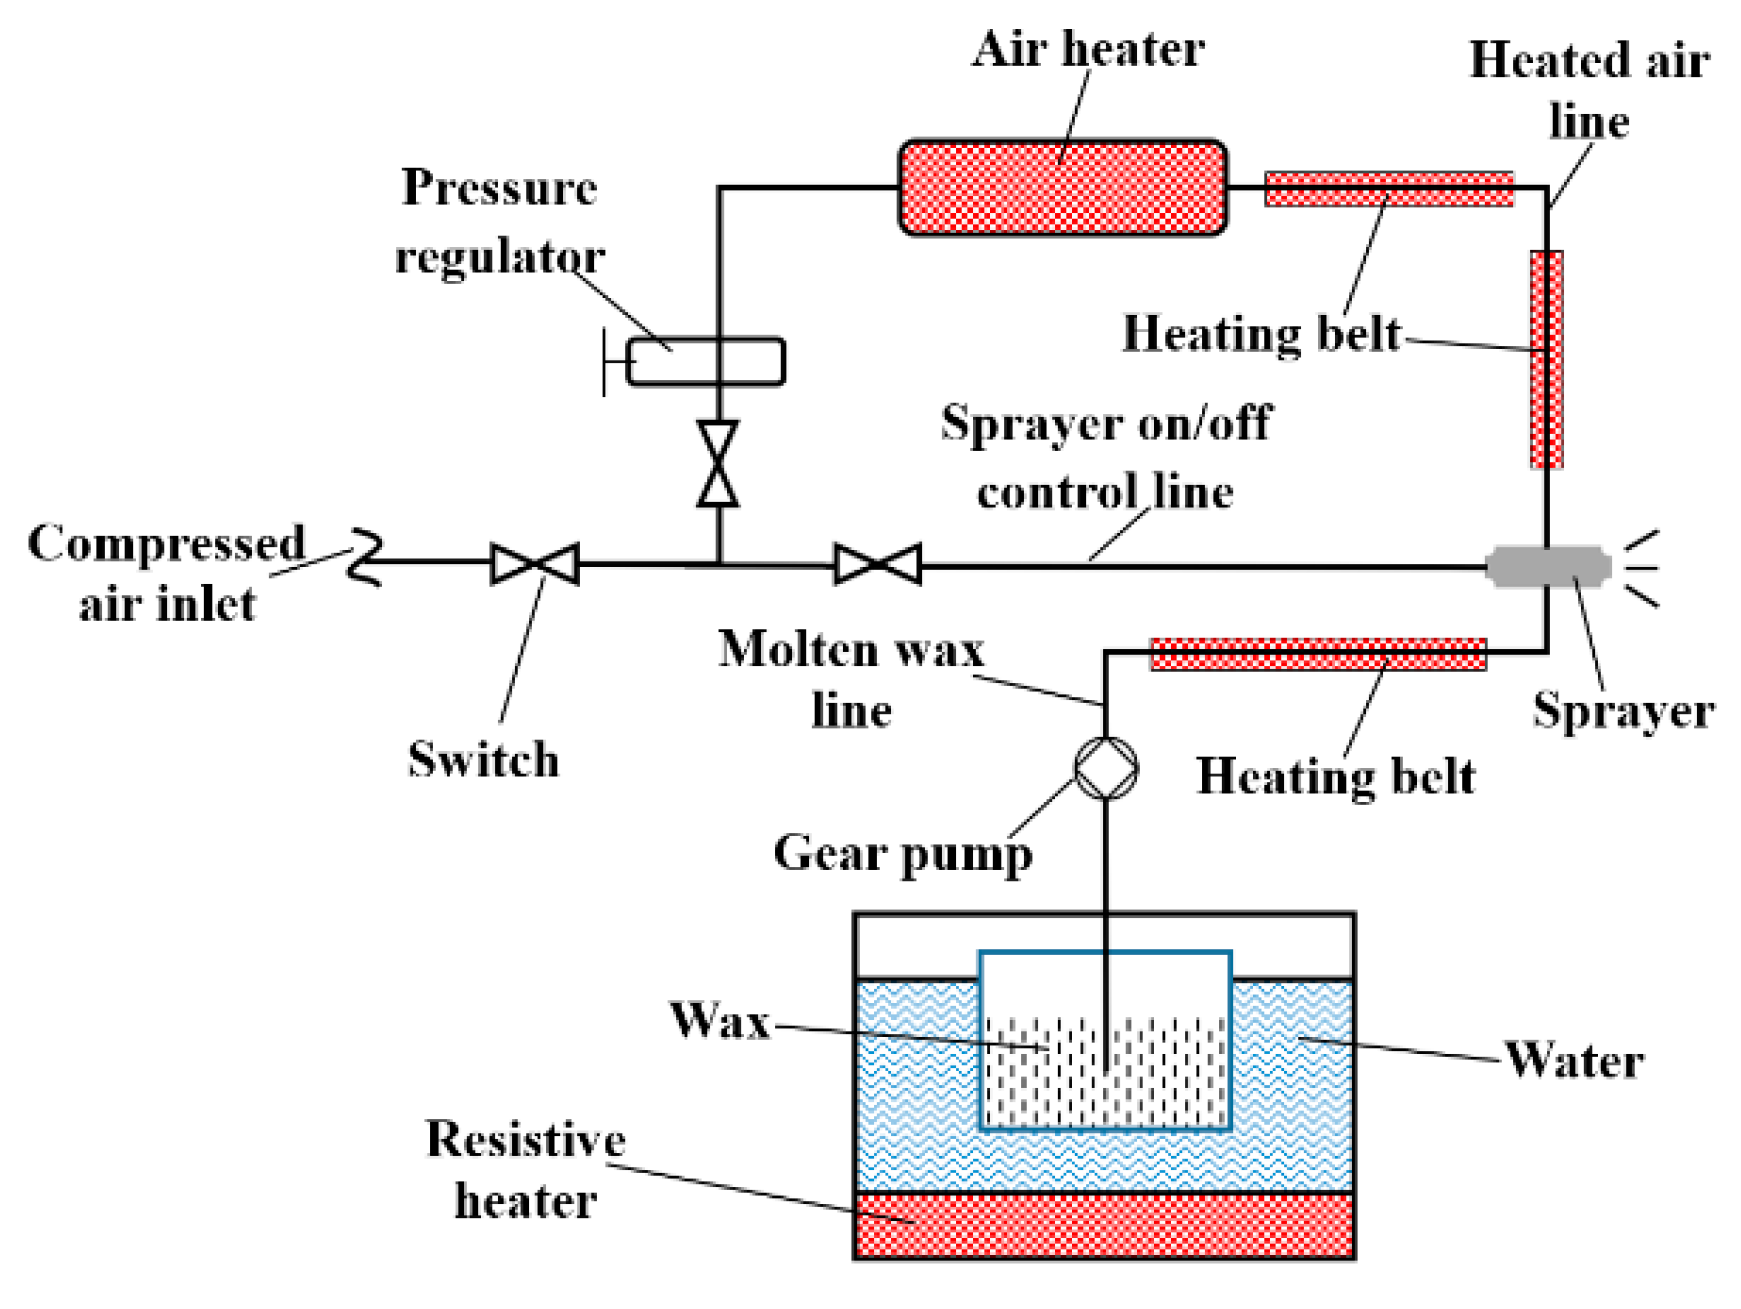
The wax spray system schematic is shown in Figure 3. The system serves to heat the wax particles above their melting point temperature and spray liquid wax particles into the test section mainstream flow. Wax mass flow rate was in the range of 5–80 g/min with a relative uncertainty of 1.6%. Calibration experiments were carried out based on the relationship between the wax mass flow rate and gear pump speed to acquire calibrated data. A laser particle analyzer is used to measure particle size with a precision degree of 3% (OMEC Instrument CO. DP-02). Wax particle size and flow rate can be controlled by adjusting the air supply pressure and gear pump speed, respectively. The adjustable range for mean particle size is 8–100 μm.
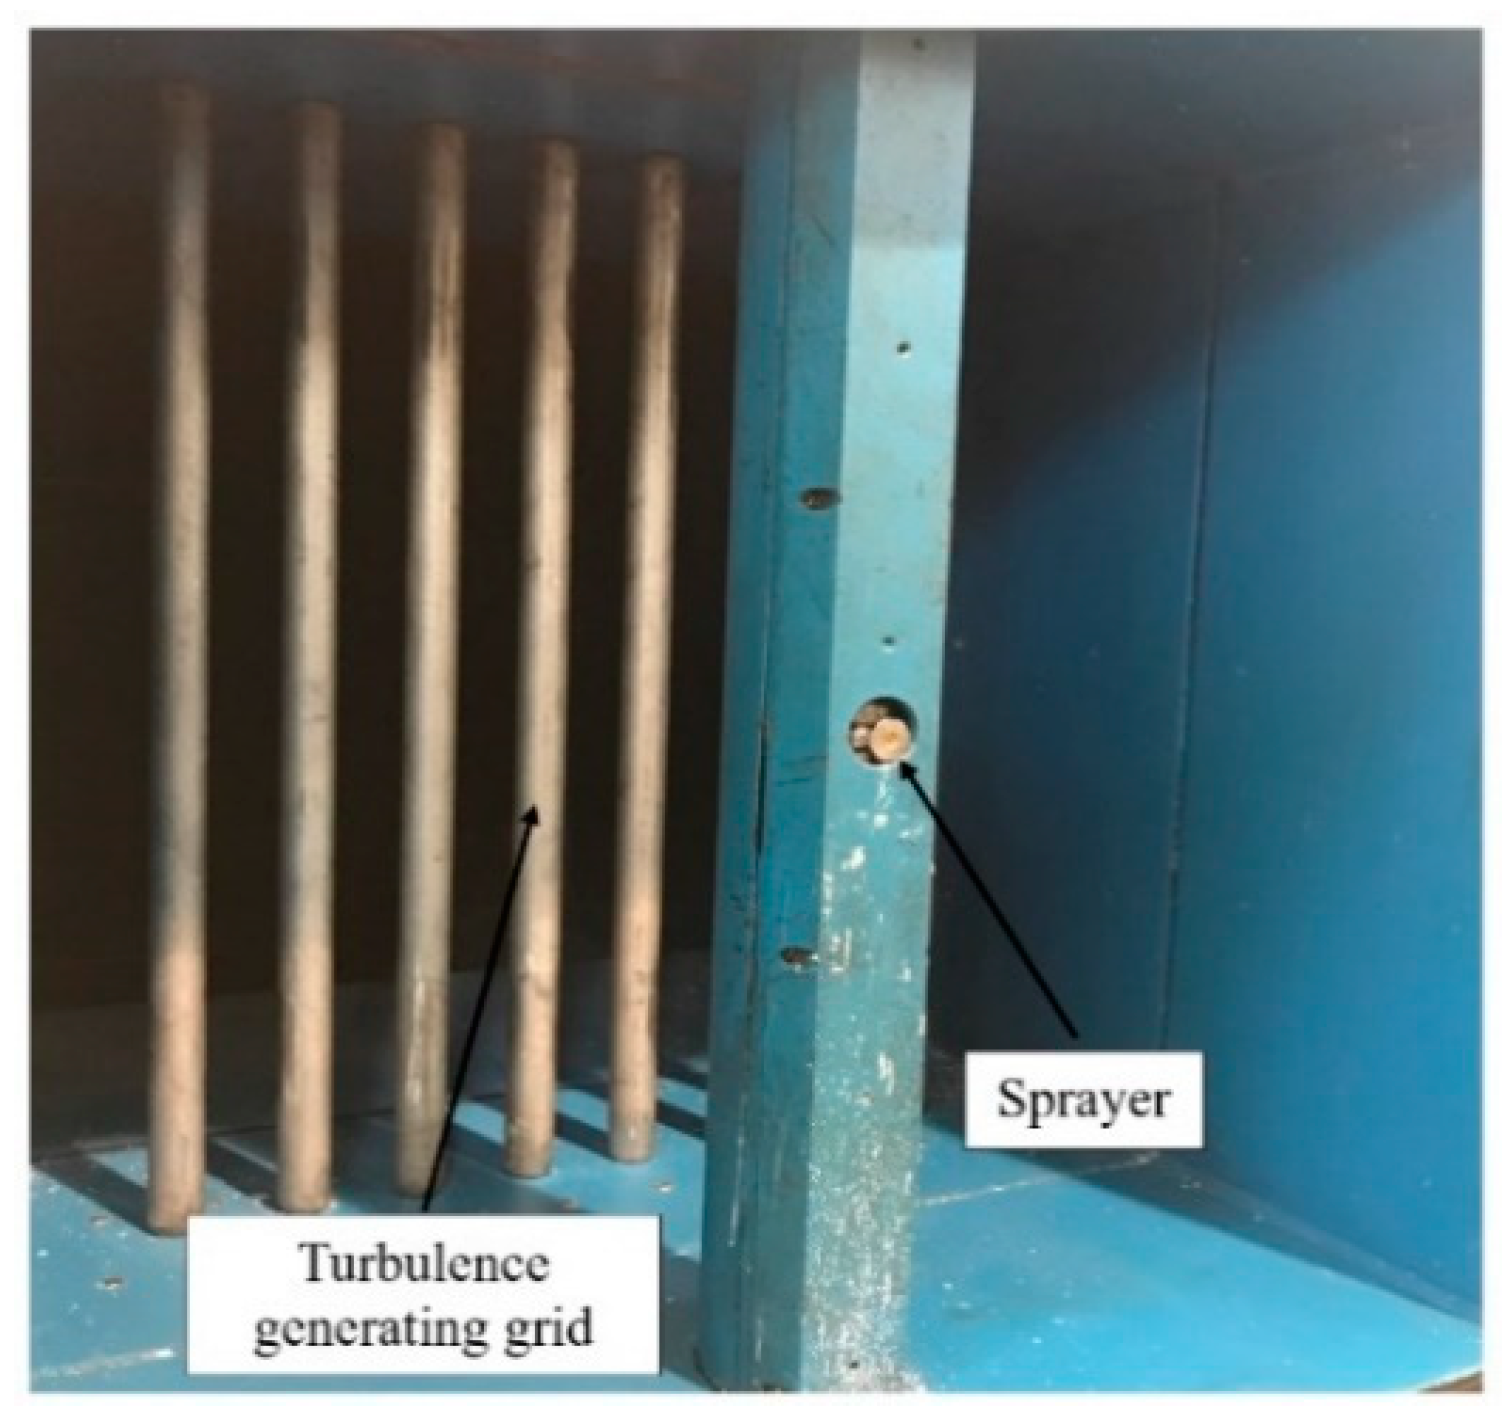
A photograph of the spray system in the wind tunnel is shown in Figure 4. The spray nozzle is located in a hole at the middle of a hollow column (Spray Co. 1/8JJAUCO). The wax heating system is composed of a molten wax reservoir, water-bath vessel, resistive heater and control system. The molten wax reservoir is made up of stainless steel. It was heated uniformly and stably in the water-bath vessel. The control system is used to send temperature feedback signals and minimize fluctuations in the water temperature. The precision uncertainty for the wax temperature is 1 °C. The wax can be heated to 80 °C by the heating system. The purposes of compressed air are to atomize the molten wax and provide the start-stop control of the wax spray system. The wax has a nominal solidification temperature around 41 °C, above the ambient temperature. Consequently, air heating is required to avoid the solidification of wax after its mixing with the atomized air in the spray nozzle. The air temperature can reach 100 °C by using the air heater. All lines are wrapped with electrical heating belts and foaming polyurethane materials as an outer layer to keep the liquid wax above the molten point and achieve thermal insulation and energy saving. A thermocouple is applied to measure the pipeline surface temperature for temperature control purposes. The working conditions of the wax spray system are listed in Table 2.
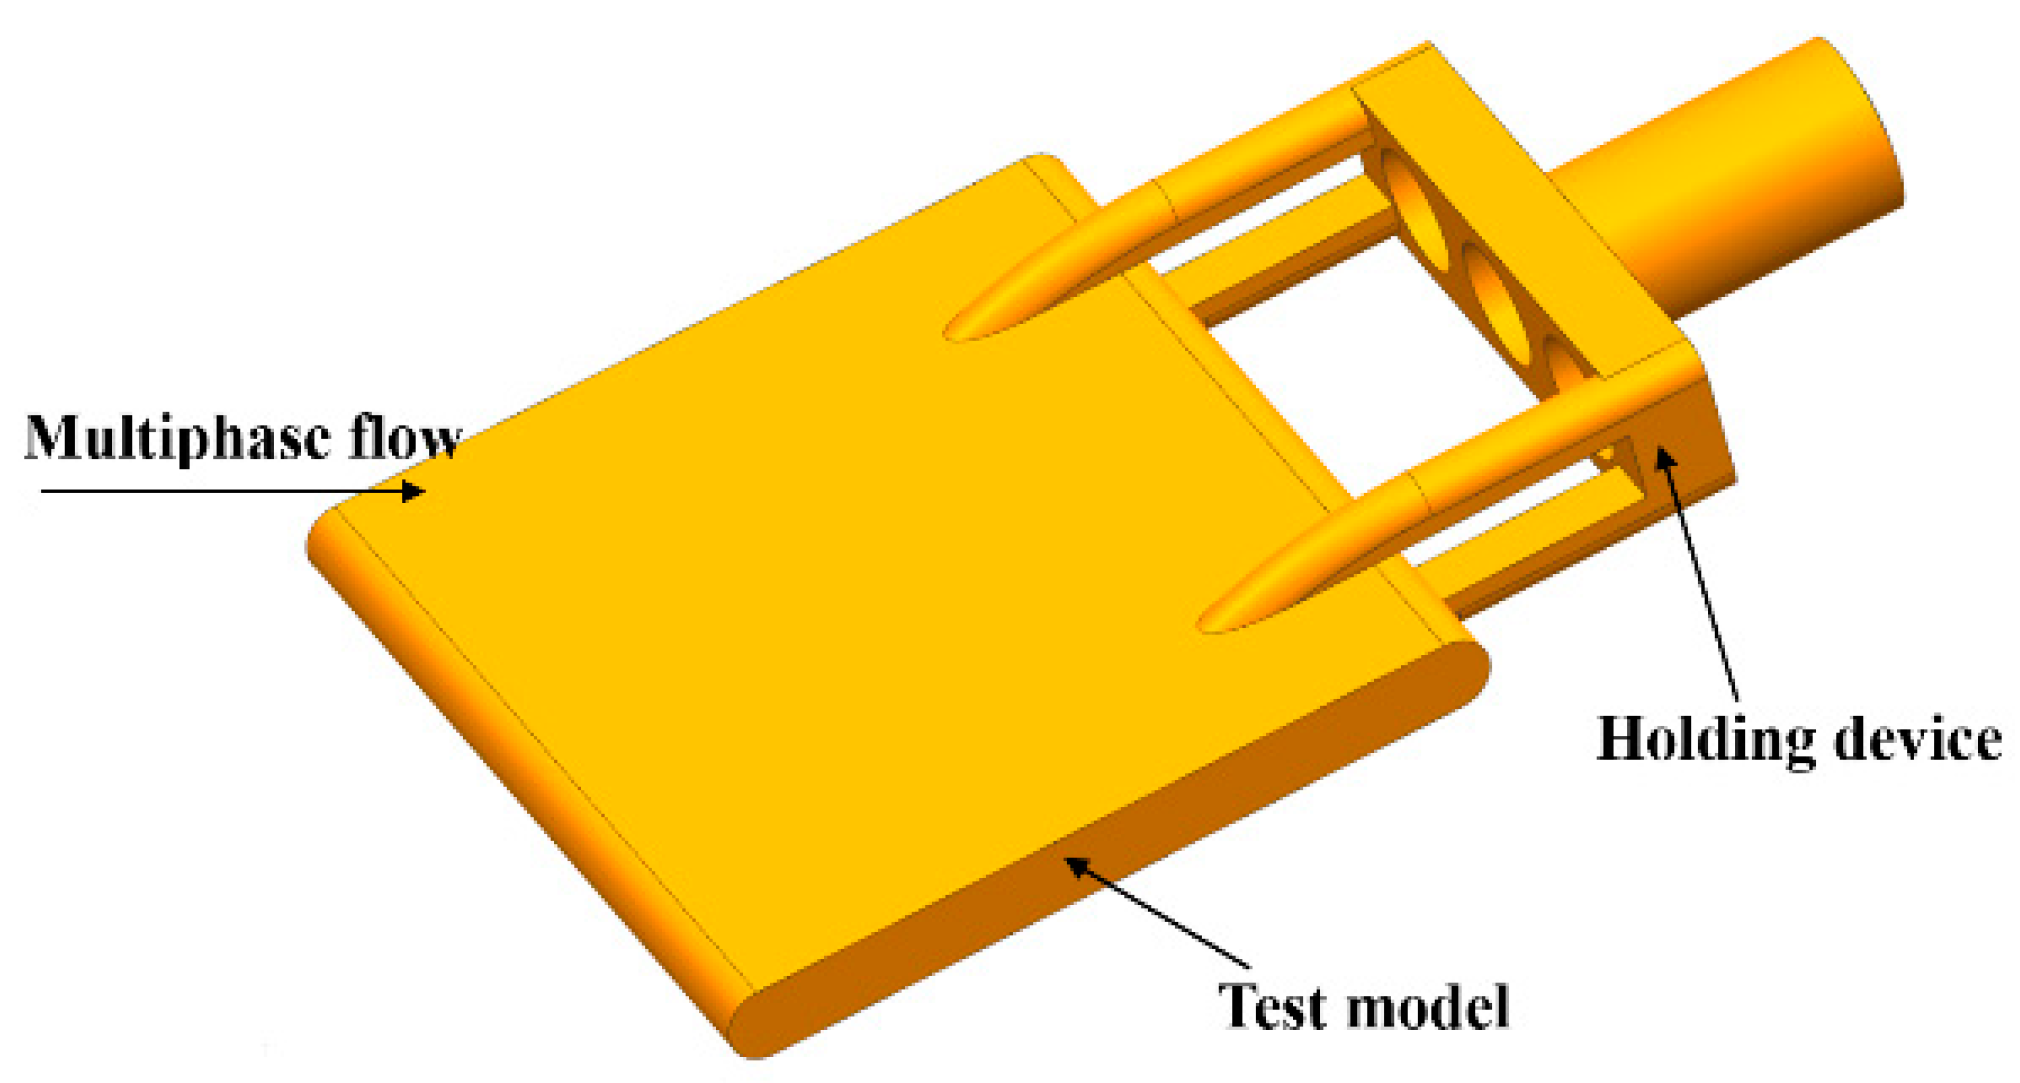
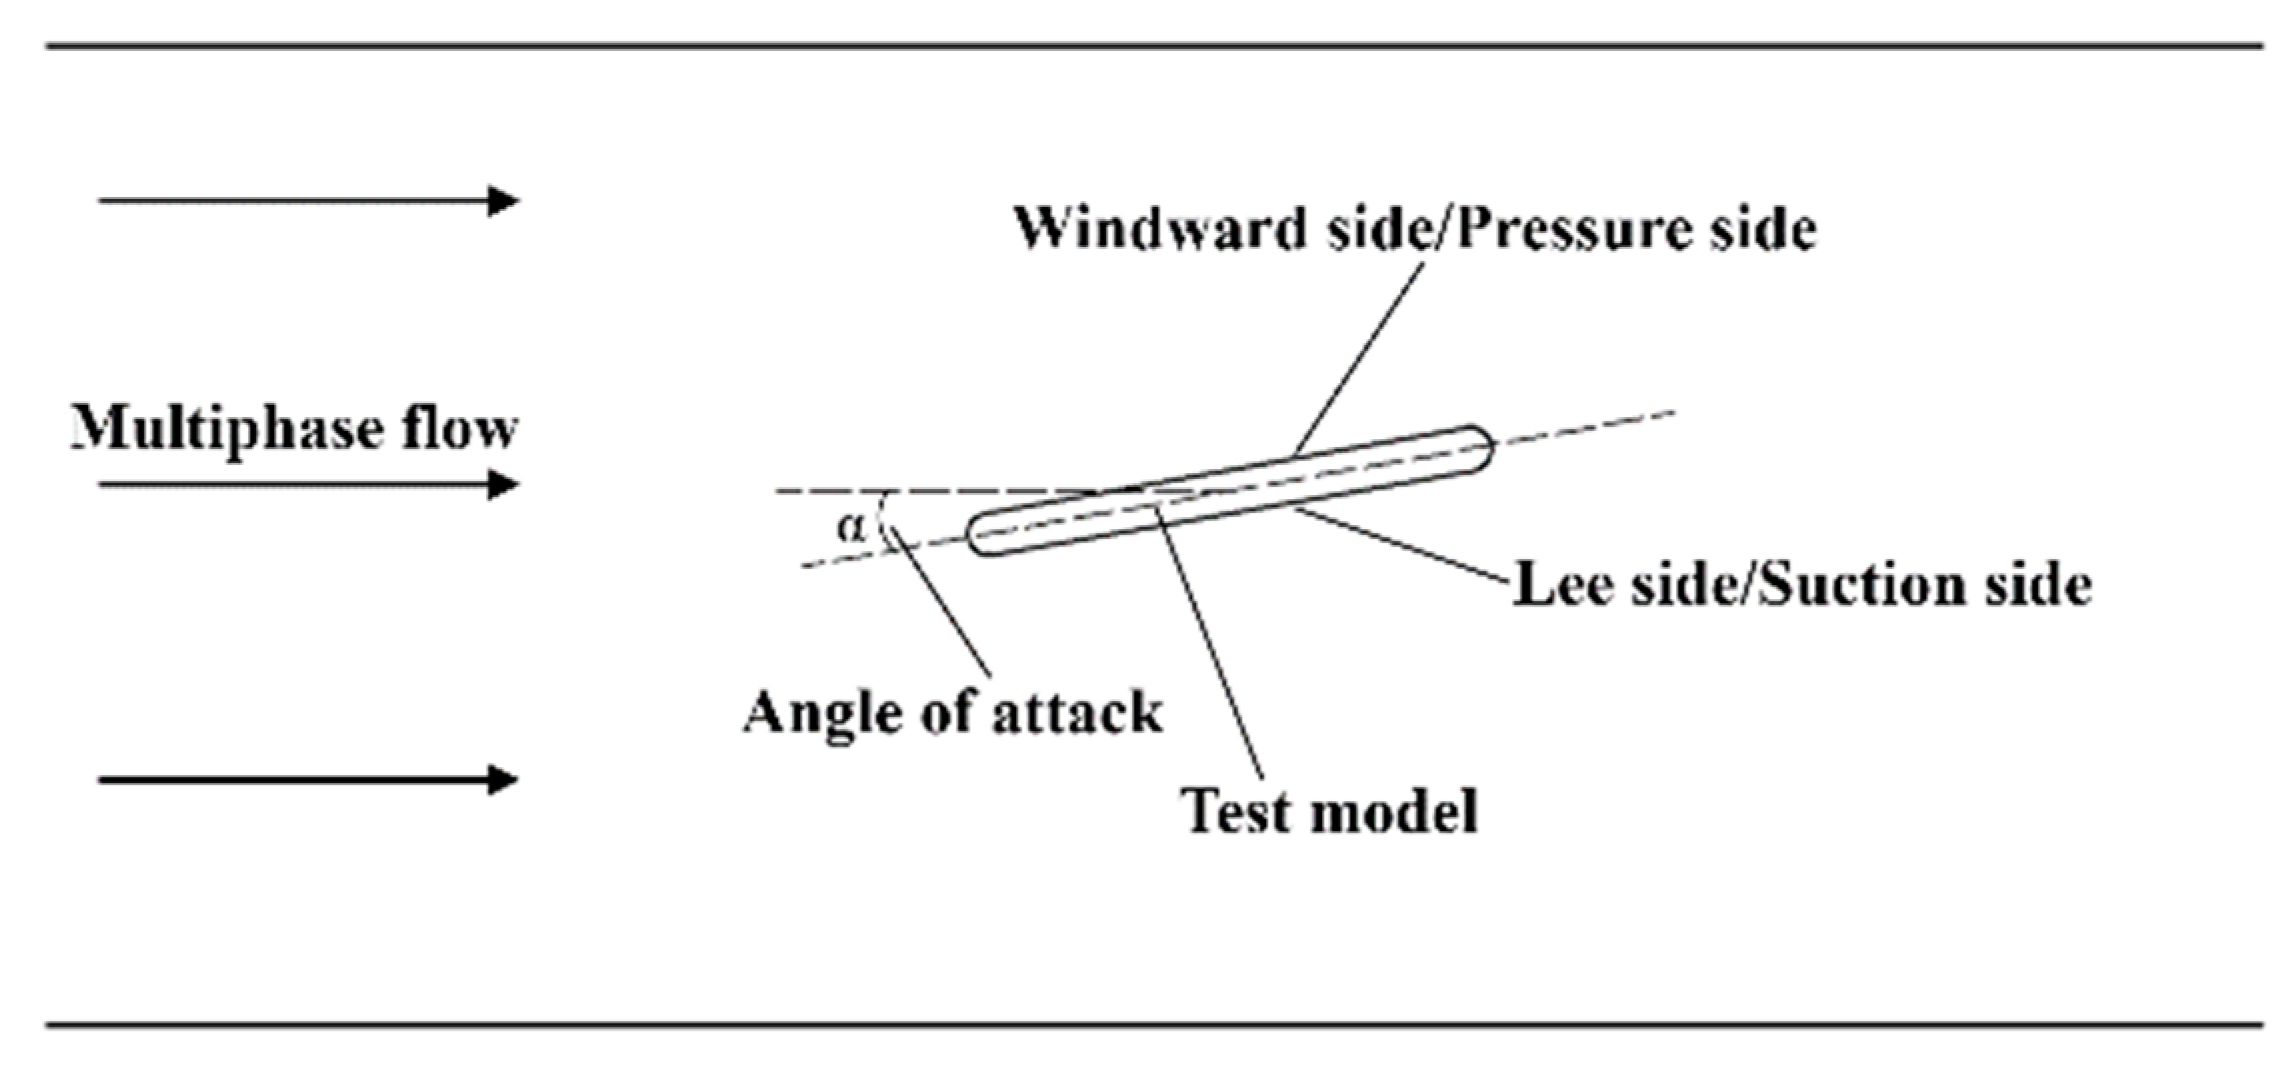
The test model and its fixing holder are shown in Figure 5. The test model is a flat plate, which is 150 mm in length, 150 mm in width, and 13 mm in thickness. The test model is fixed by a holding device. Flow fields around the test model might be affected, in that the holding device is thicker than the test model. To mitigate the possible effect, the holding device adopt streamlined outer surface and three air guide holes. Both the pitch angle and rotating angle of the test model can be adjusted. Schematic of the particle-laden flow and angle of attack (AOA) is shown in Figure 6. The adjustable ranges for AOA, pitch angle and rotating angle are −15° ~ +15°, −20° ~ +20°, −90° ~ +90°, respectively. The height of the test model can be adjusted by a mechanical screw lift.
2.2. Experimental Parameters
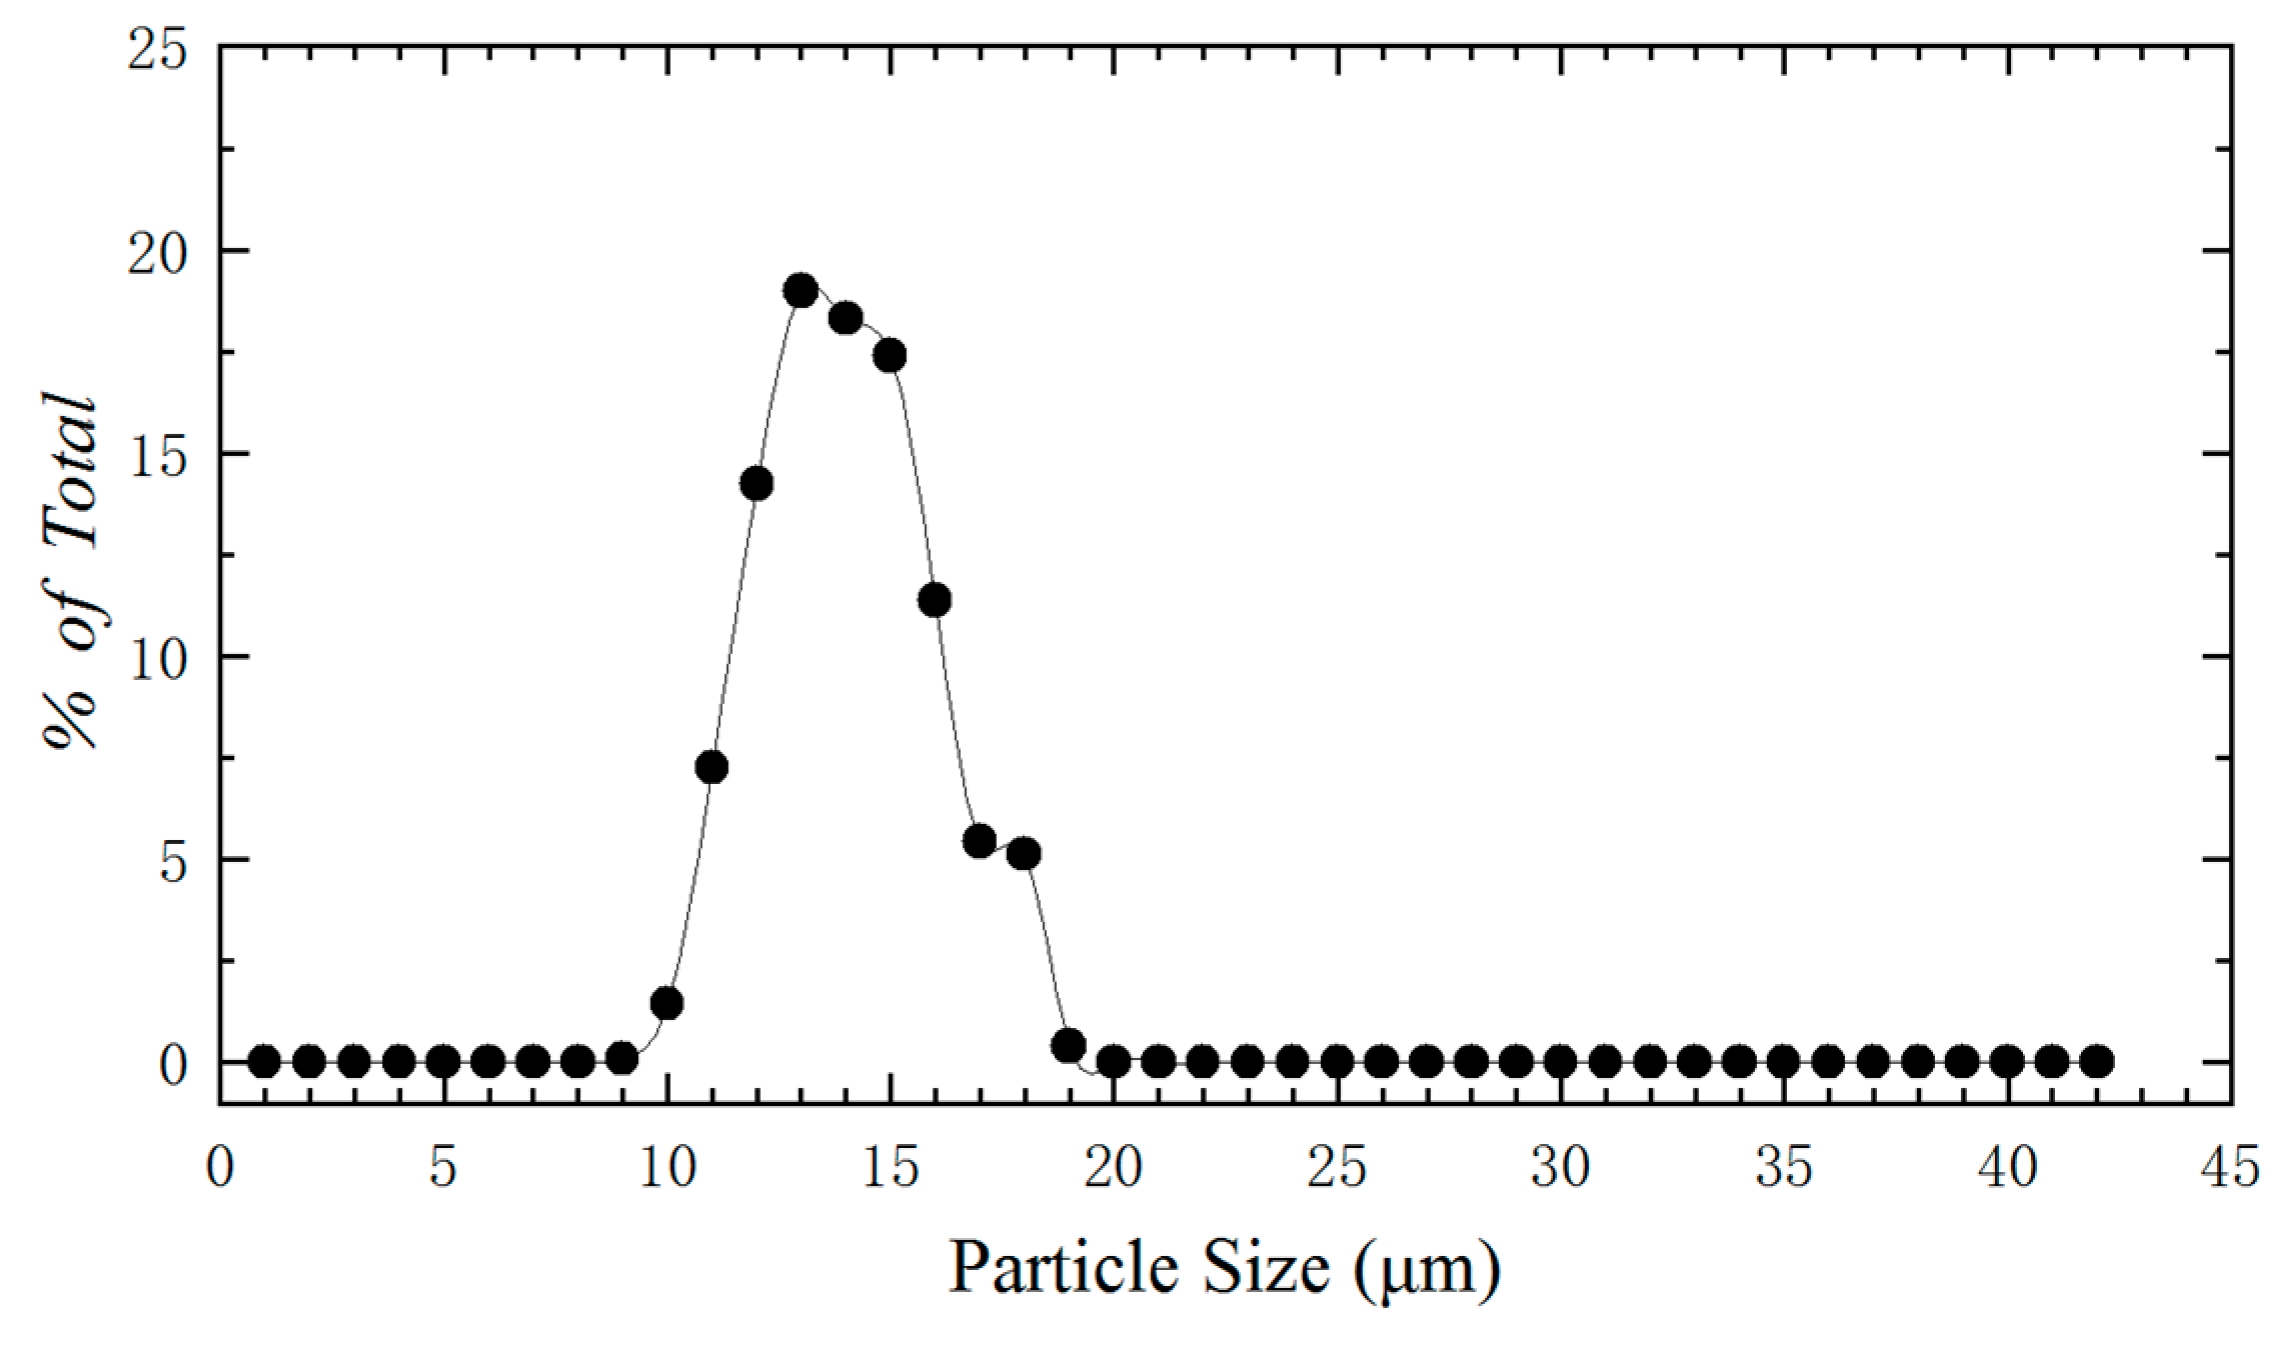
The experimental parameters in this paper are shown in Table 3. The mainstream velocity range was 10–30 m/s and the temperature range was 32–48 °C. Wax with a molten point of 41 °C was selected as the particle for injection to observe its deposition behavior. This enables an experimental simulation of particle deposition in a wind tunnel facility. The wax particle size distribution was measured by a laser particle analyzer, as shown in Figure 7. Its main range was 10–20 μm. According to the study conducted by Dring et al. [30], the trajectory of the particles is dominated by the Stokes number. The Stokes number of particles in air flow can be defined as:
where ρp is the wax particle density, dp is the wax particle diameter, Up is the wax particle velocity, L is the characteristic length and μ∞ is the gas dynamic viscosity. The Stokes number characterizes the behavior of particles suspended in a fluid flow, which provides an indicator of how well the particles follow the mean fluid streamlines. A particle with a Stk < 1 follows fluid streamlines closely, indicating a perfect convection-diffusion. On the contrary, a particle with a Stk > 1 is determined by the inertia force and it is likely to continue along its initial trajectory.
The density of molten wax used in this paper was approximately 800 kg/m3. The corresponding Stk, in the range of 0.04–0.12, could be estimated based on the length of the test model. The distance between the sprayer and the test model was chosen as about 10 times length of the test model and the corresponding Stk is 0.004–0.012, ensuring that the atomized wax particles could diffuse in mainstream flow as uniformly as possible.
2.3. Experimental Procedures
The test procedure was as follows: (1) For a typical experiment, the test model should be fixed by the holder at first. The status of all test devices was checked before testing, including the wax spray system, air heater, and AOA of the flat plate. Full test preparations are required. (2) The wax heating system was held at the desired temperature to keep wax in a molten state. The gear pump for starting the wax spray system was closed at the time. (3) The axial fan was opened at the front of the wind tunnel. The air speed was brought to the required value and then held stable. (4) Then the air heater for the wind tunnel was opened and adjusted to a certain temperature so that the test model surface and air can reach a thermal steady state. (5) The gear pump for starting the wax spray system was opened and adjusted according to the required wax mass flow rate in order to achieve different test conditions. The surface temperature of the test model was detected precisely with an infrared radiation thermometer. The data were recorded every second. (6) At the end of an experiment, the wax spray system, air heater for the wind tunnel and axial fan need to be turned off successively. (7) The test model was moved away from the wind tunnel to be photographed. The wax depositions from the entire leading edge, windward side, and lee side were collected to measure the wax deposition mass, respectively. Finally, the remaining wax on the test model was removed in preparation for the next experiment.
2.4. Uncertainty Analysis
An uncertainty analysis serves to validate the measurement technique effectiveness and repeatability of test results. The test Case 1 in Table 3 was performed five times for uncertainty analysis. Deposition mass standard deviation σ and uncertainty dep were calculated by Equations (2) and (3), respectively.
where mi is an observed value for deposition mass, dep is the mean deposition mass, n is the sample size, and tα is the upper quantile of t-distribution. When the confidence interval is 0.95, tα is 2.766.
The standard deviation σ of the deposition mass was calculated as 0.046 with a sample size of five (Table 4). Uncertainty in the deposition mass was calculated as 0.056 g (relative uncertainty 3.3%). The resulting deposition mass showed sufficient repeatability between experiments to support the discussions and conclusions.
3. Results and Discussion
3.1. The Effect of Mainstream Velocity
Mainstream velocity through the wind tunnel was set to investigate its effect on the particle deposition mass and efficiency. Mainstream temperature and particle concentration were held constant in tests.
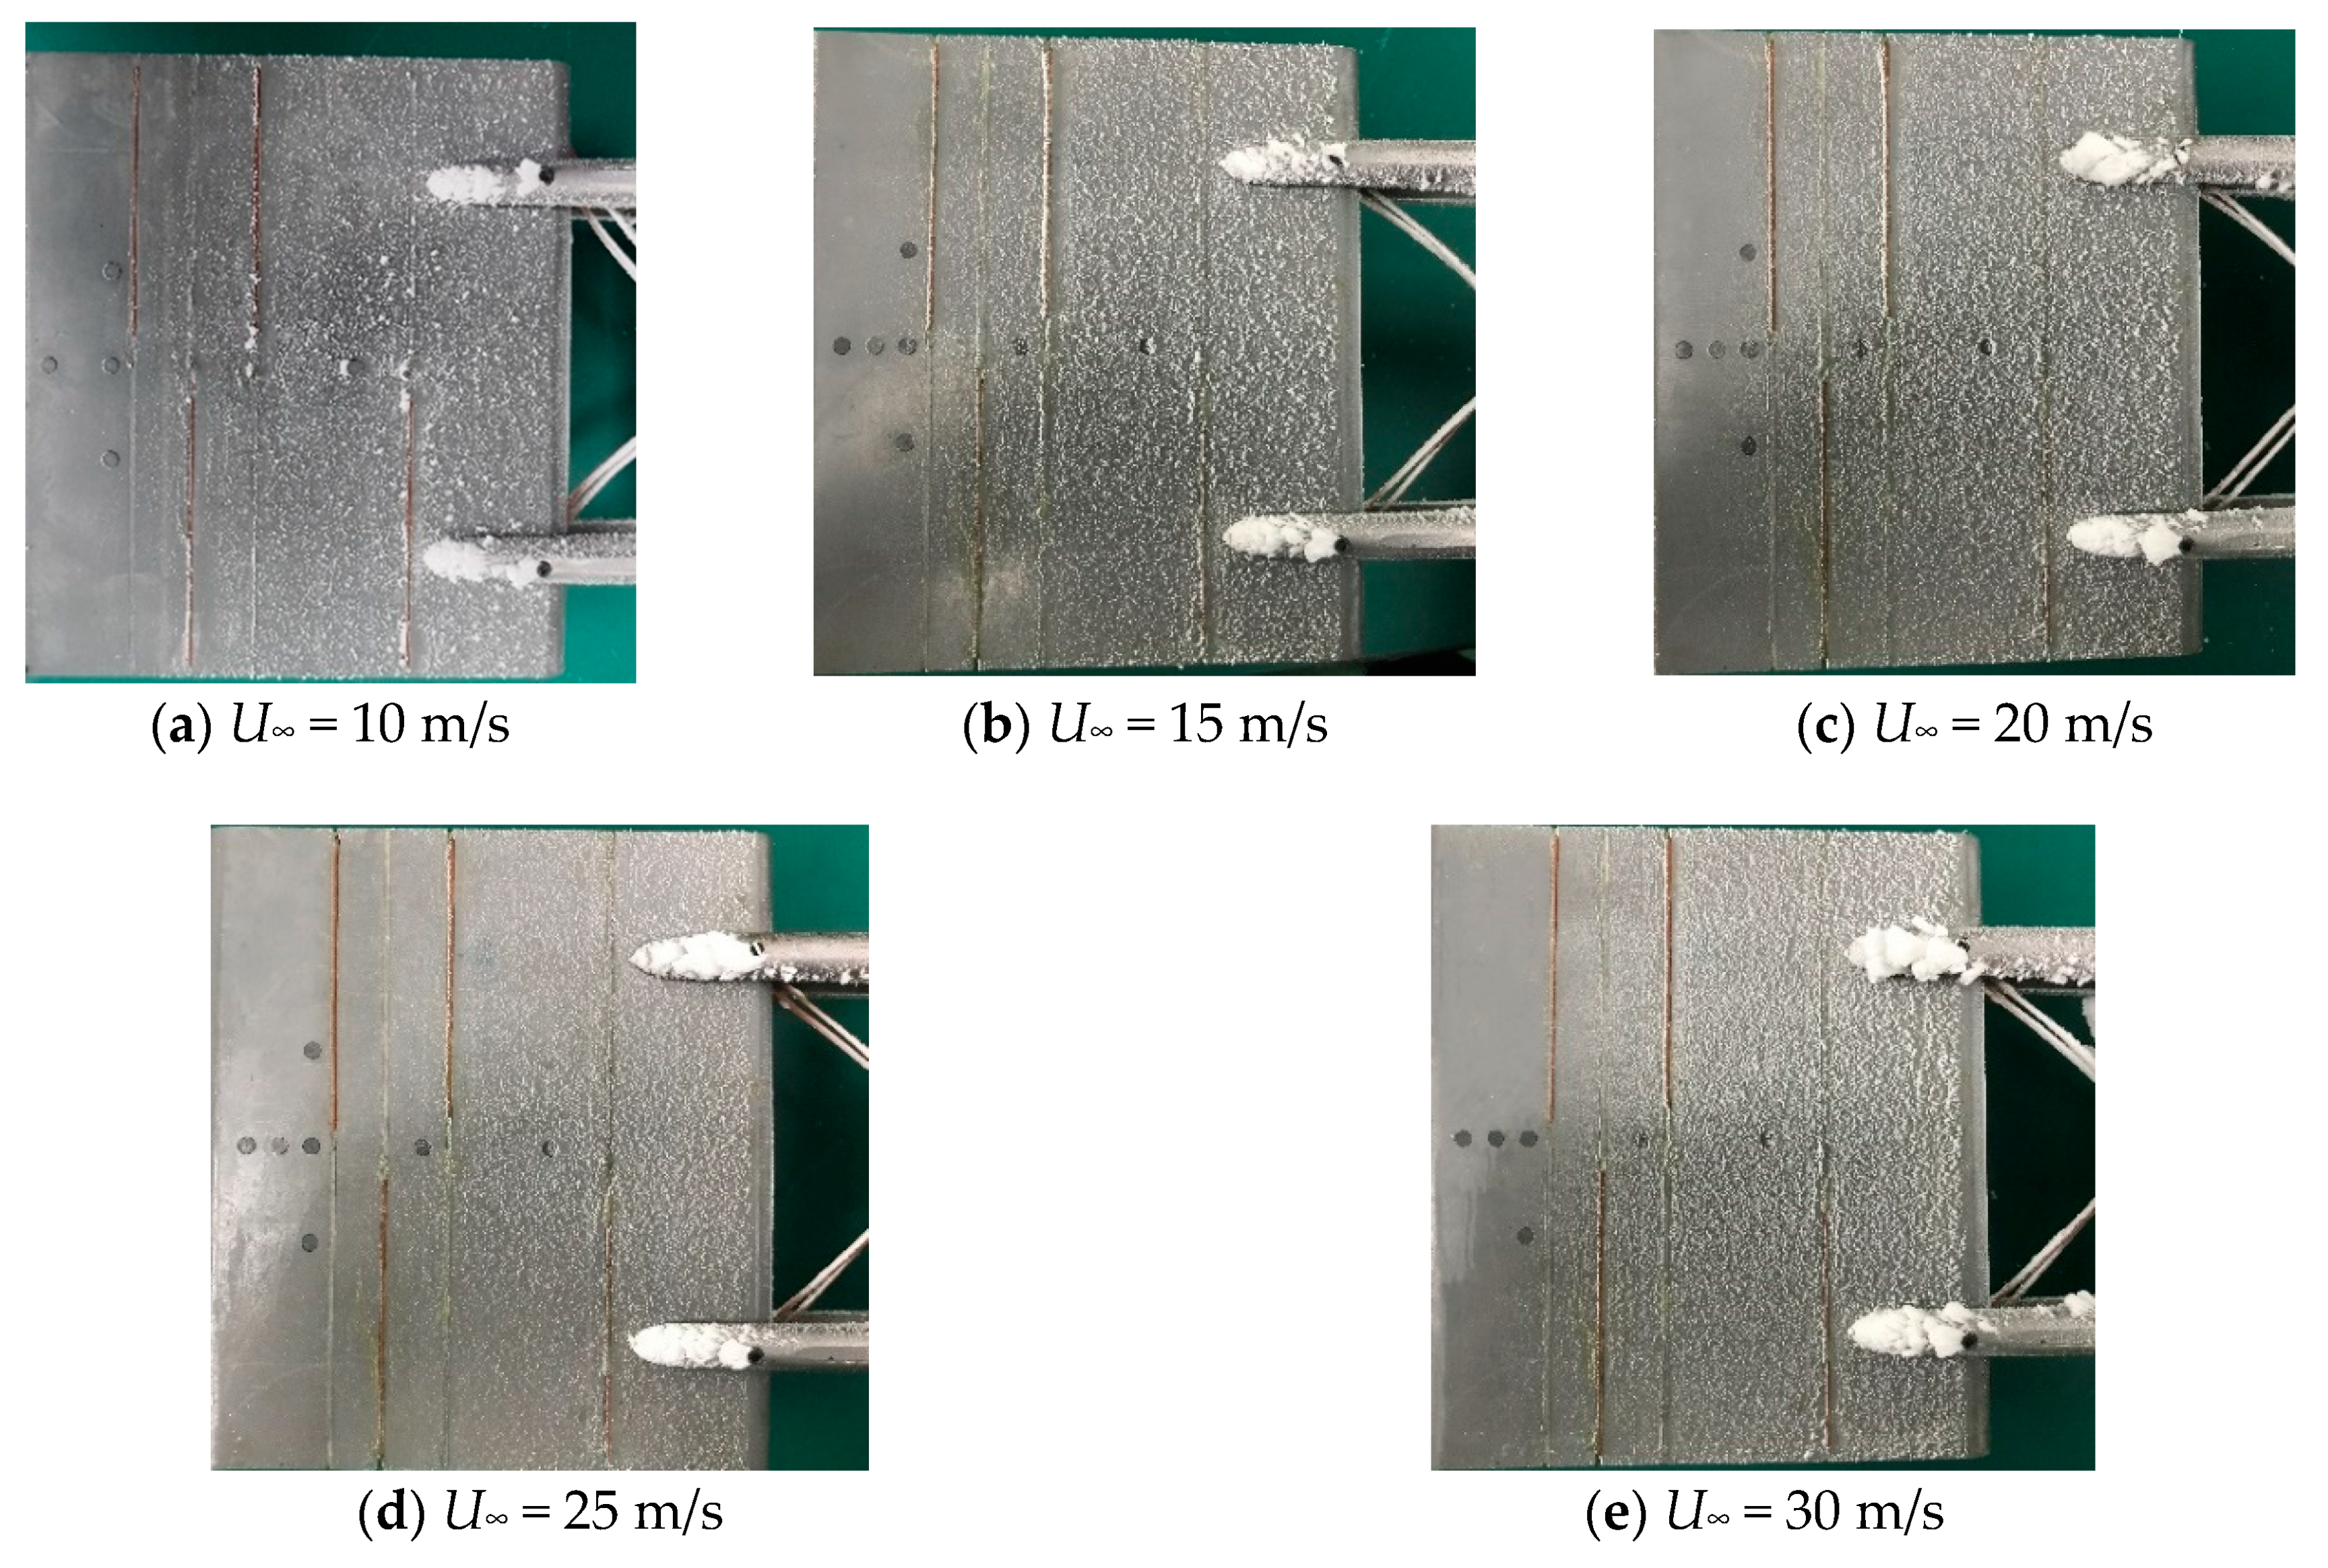
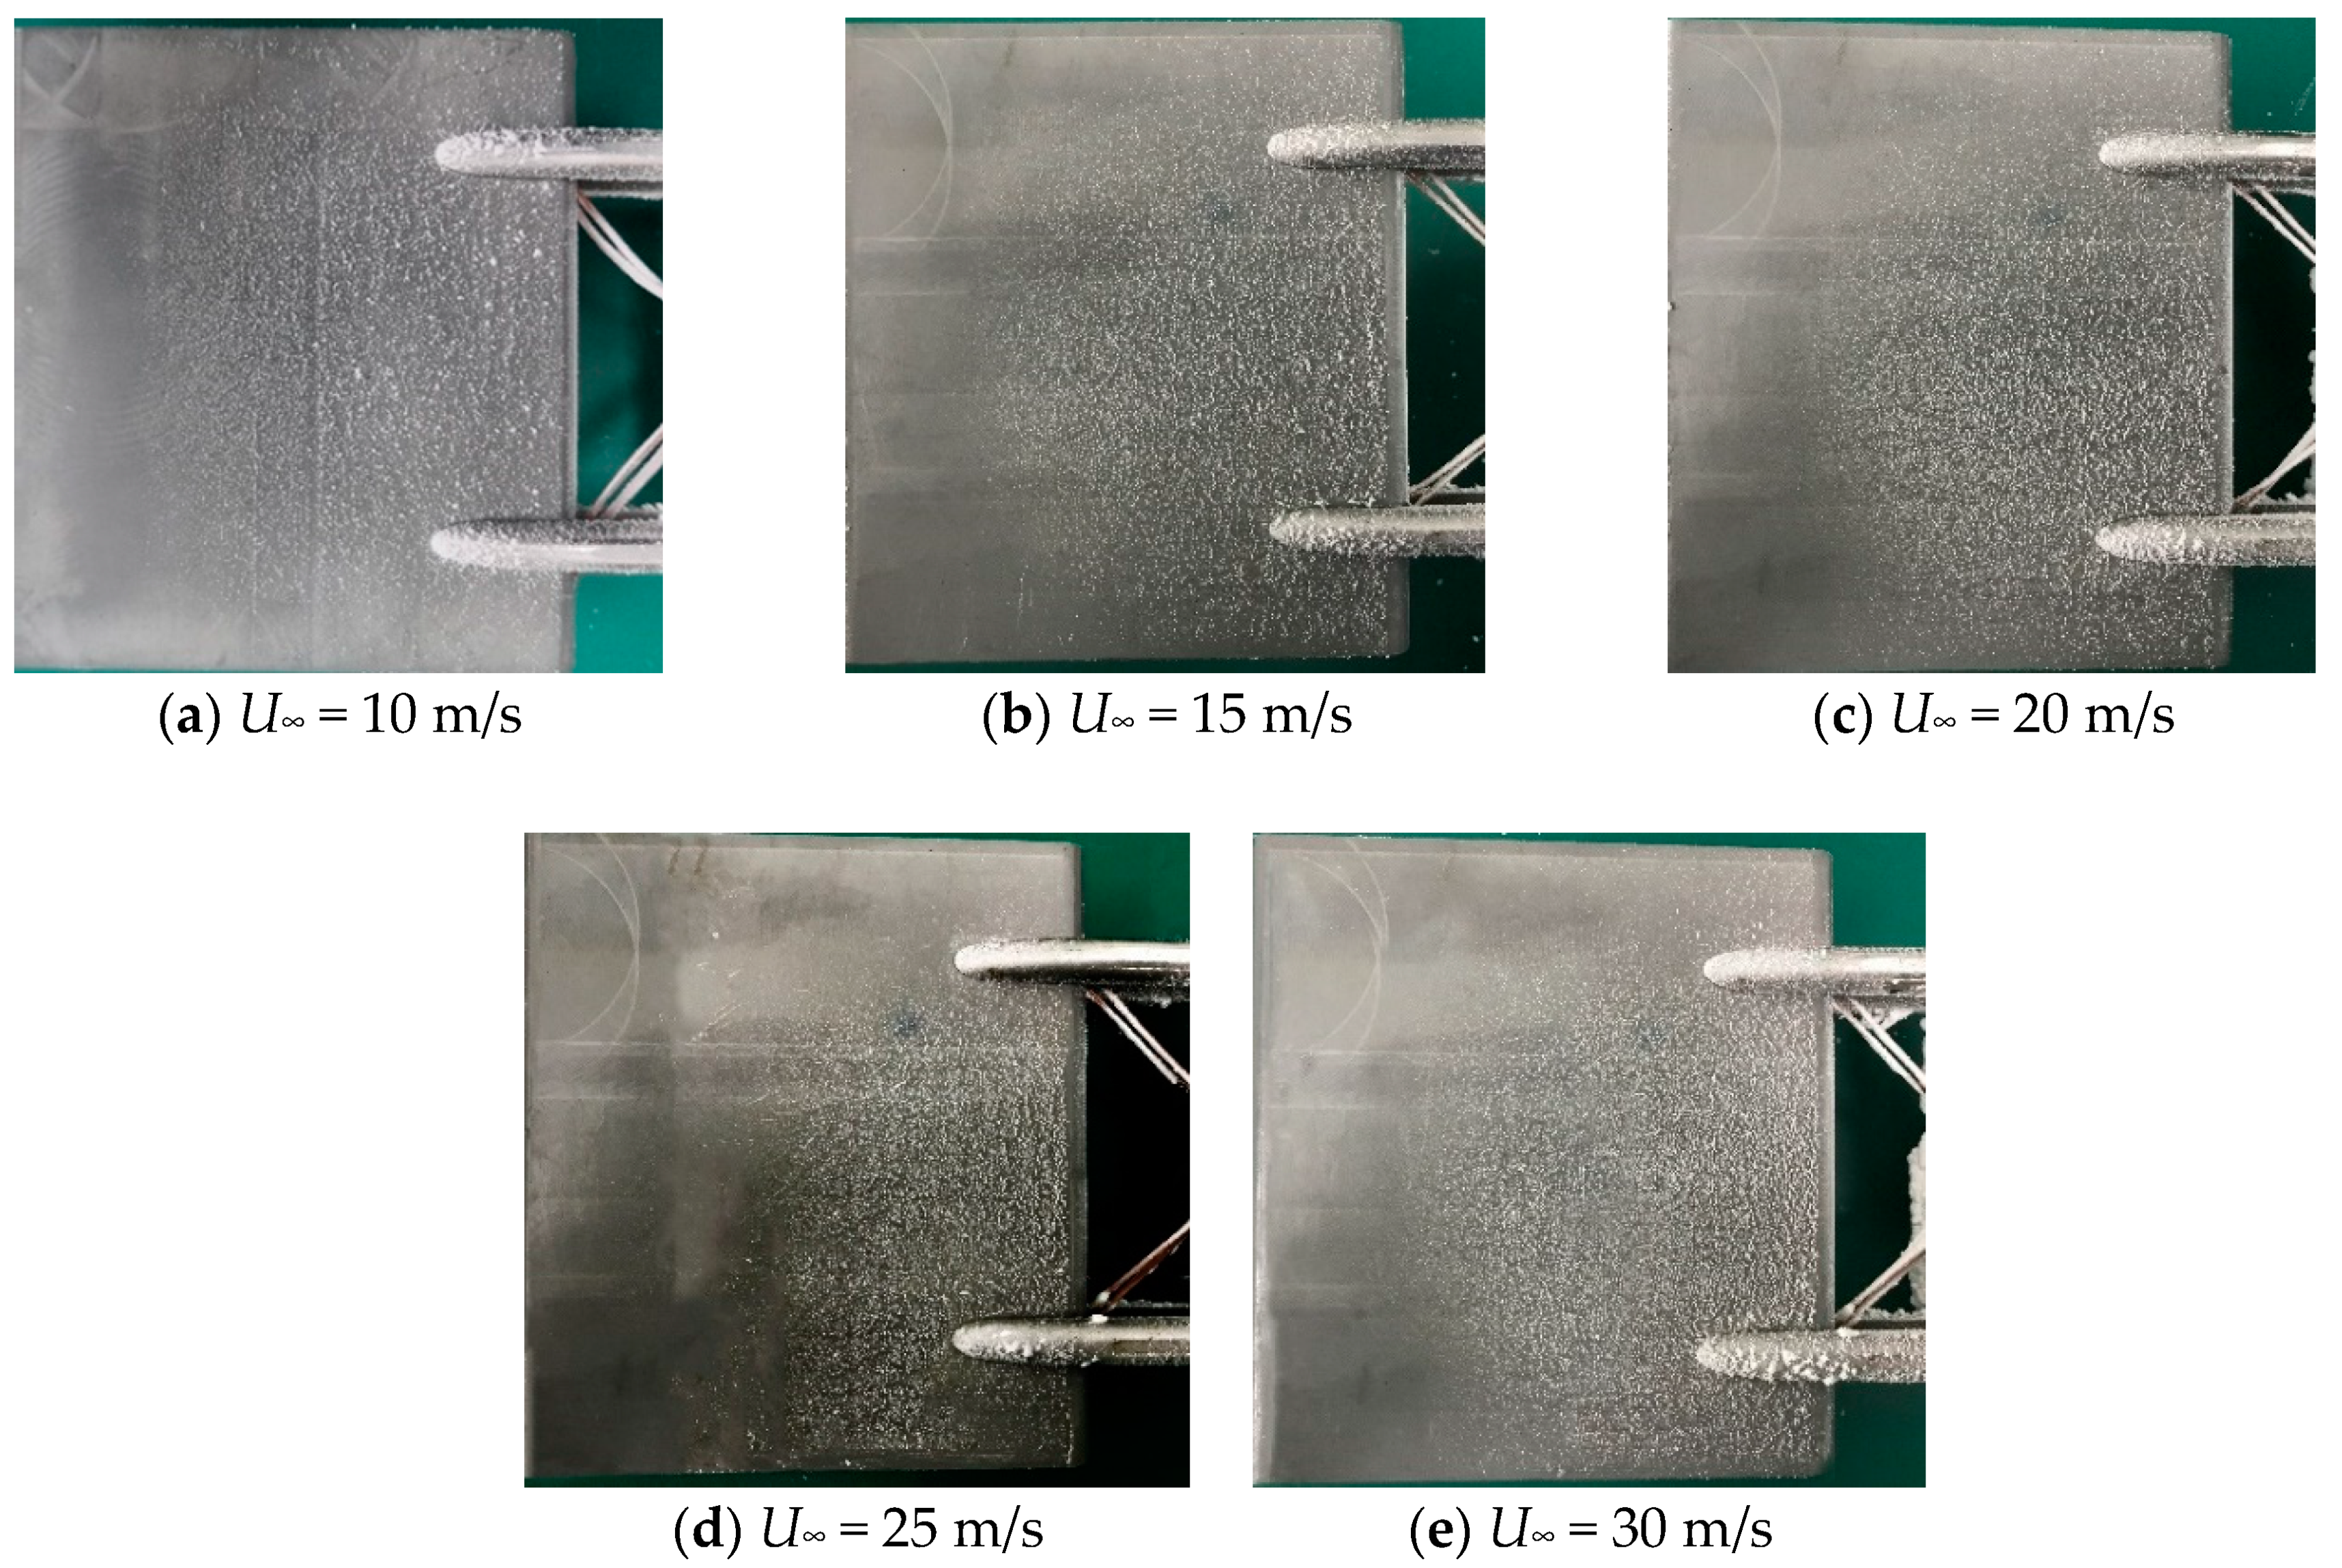
Deposition distributions created on the model leading edge, windward side and lee side are presented in Figure 8, Figure 9 and Figure 10, respectively. The particle deposition reached the maximum at the leading edge and they became sparser on the windward and lee sides. The forward portions of the windward and lee sides were not visible, with very thin and sparse depositions, while the middle and backward portions of both the windward and lee sides were visible with increasing amounts of deposition towards the trailing edge. Significant depositions at the leading edge region were attributed to particle inertia force. When the particle-laden flow approached the stagnation line, change to the motion direction occurred and it was more evident for the air phase. However, particles cannot follow fluid well or flow around the semi-circular surface due to their inertia. They impacted and then deposited on the leading edge surface. Small particles with a low Stokes numbers tended to follow the flow readily along the model surface and they were less prone to deposition under the drag force. This resulted in a much larger amount of deposition at the leading edge than that on the windward and lee sides. Sreedharan and Tafti [22] conducted numerical simulations of ash deposition on a flat plate oriented at 45 deg to an impinging ash laden jet. The obtained results were validated by experiments from Crosby et al. [11]. Sreedharan and Tafti presented that most particle deposition occurred near the stagnant region. Herein, the stagnant region is located at the leading edge of the test model where maximum deposition mass occurred. Liu et al. [26] conducted numerical simulations of particle deposition on a flat plate under operating conditions similar to those of this study. They noted that deposition mass at the leading edge was far larger than that on the windward side. The result is consistent with that obtained in this study. Deposition buildup at the leading edge affected its geometry structure, serving as a shield from the mainstream, which resulted in less deposition on the forward portions of the windward and lee sides. On the other hand, a deposition layer was generated first at the leading edge with a faster deposition rate. The model surface became rough gradually, which increased the deposition at the leading edge. Sparsely distributed spotted particle deposition was observed on the windward and lee sides. Compared with the leading edge, surface roughness changed less for the windward and lee sides, which caused a lower deposition growth rate. Wax deposition was almost symmetric about the stream-wise direction for both sides. It was less at each end than that in the middle portion along the span-wise direction, due to the flow field edge effect.
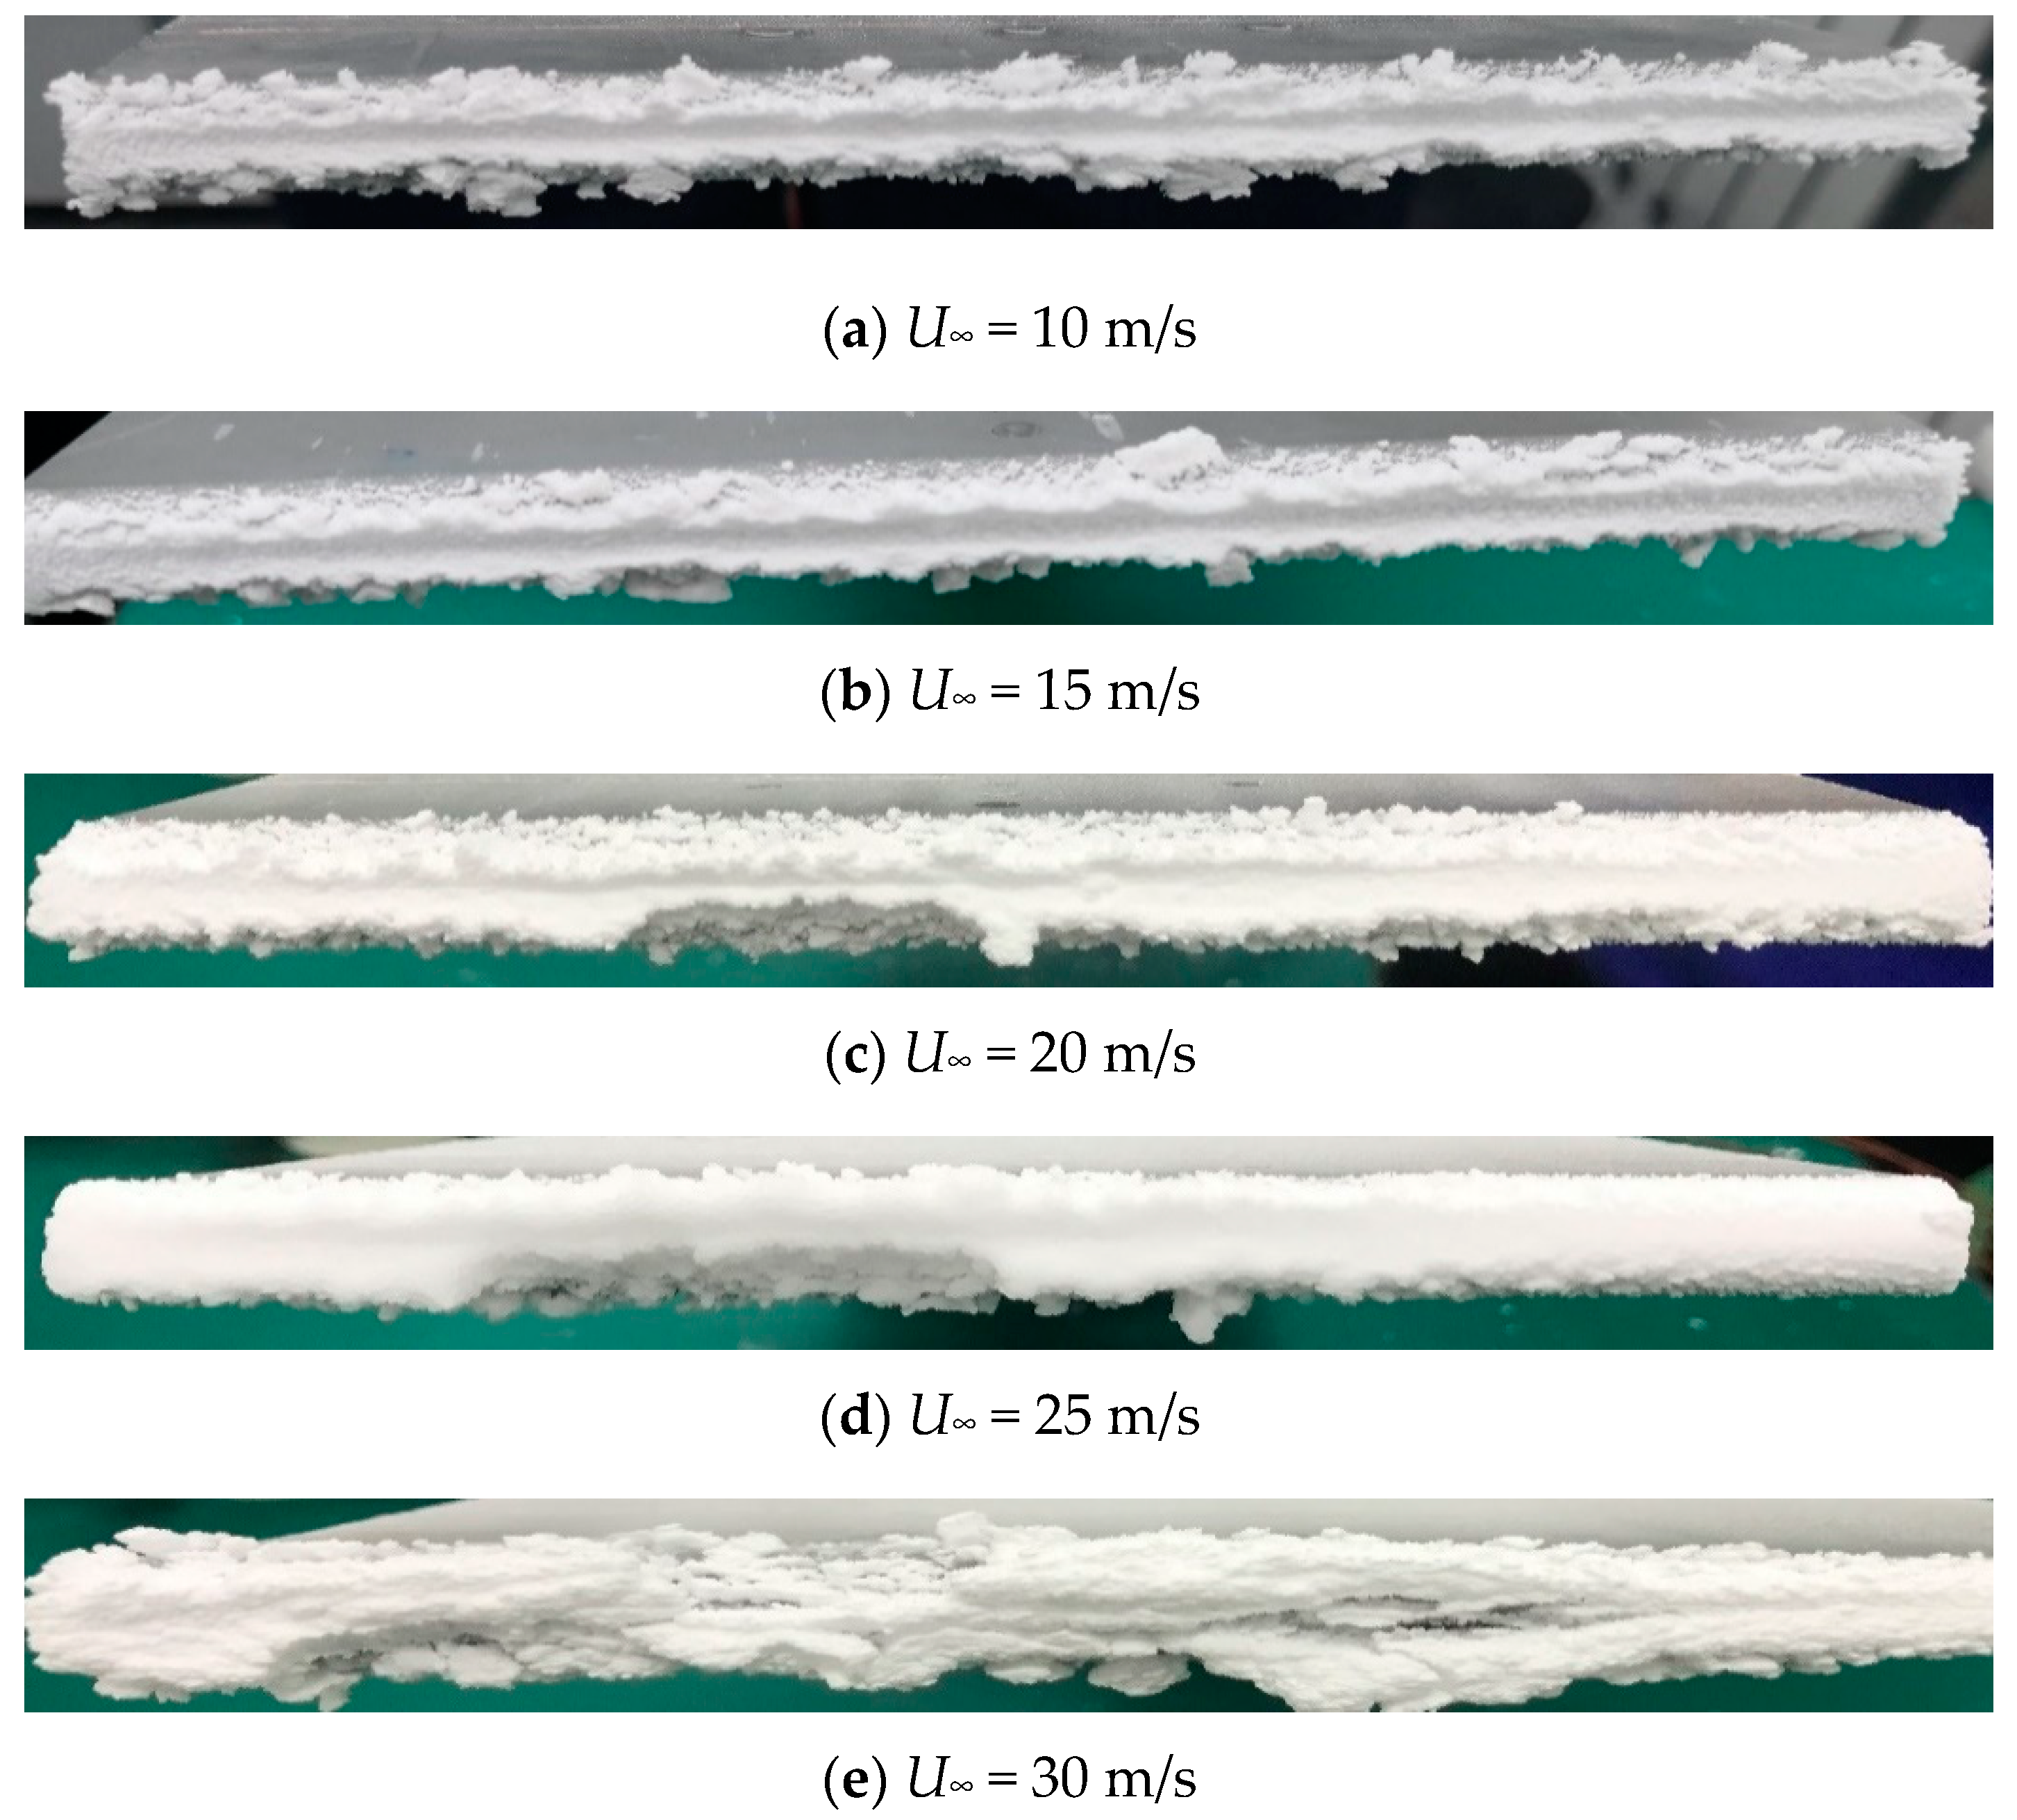
Deposition behavior at the leading edge changed evidently with the increasing mainstream velocity (Figure 8). At low velocity, particle deposition was less at the stagnant line. Deposition thickness increased as an evident central depression belt extended to the ends of the windward and lee surfaces. Deposition flaking occurred at the boundary lines between the leading edge and windward side or lee side. The deposition had an irregular shape with a slightly serrated and rough border. With velocity increasing, the mass of deposition adjacent to the stagnant line increased fast and the depressed belt was filled up gradually. Also, deposition on the boundary lines became smooth. Deposition flaking in long strips was observed at the same position in Figure 8c,d. The shedding region expanded with the increasing velocity. Inspection of Figure 8e revealed the spallation of deposition that occurred at the maximum velocity, which caused an irregular physical appearance of the deposition and changed the streamlined shape of the leading edge. At low velocity, deposition was sparsely distributed in spots at the windward and lee sides. The deposition pattern became uniform and the deposition range was almost constant with increasing velocity.
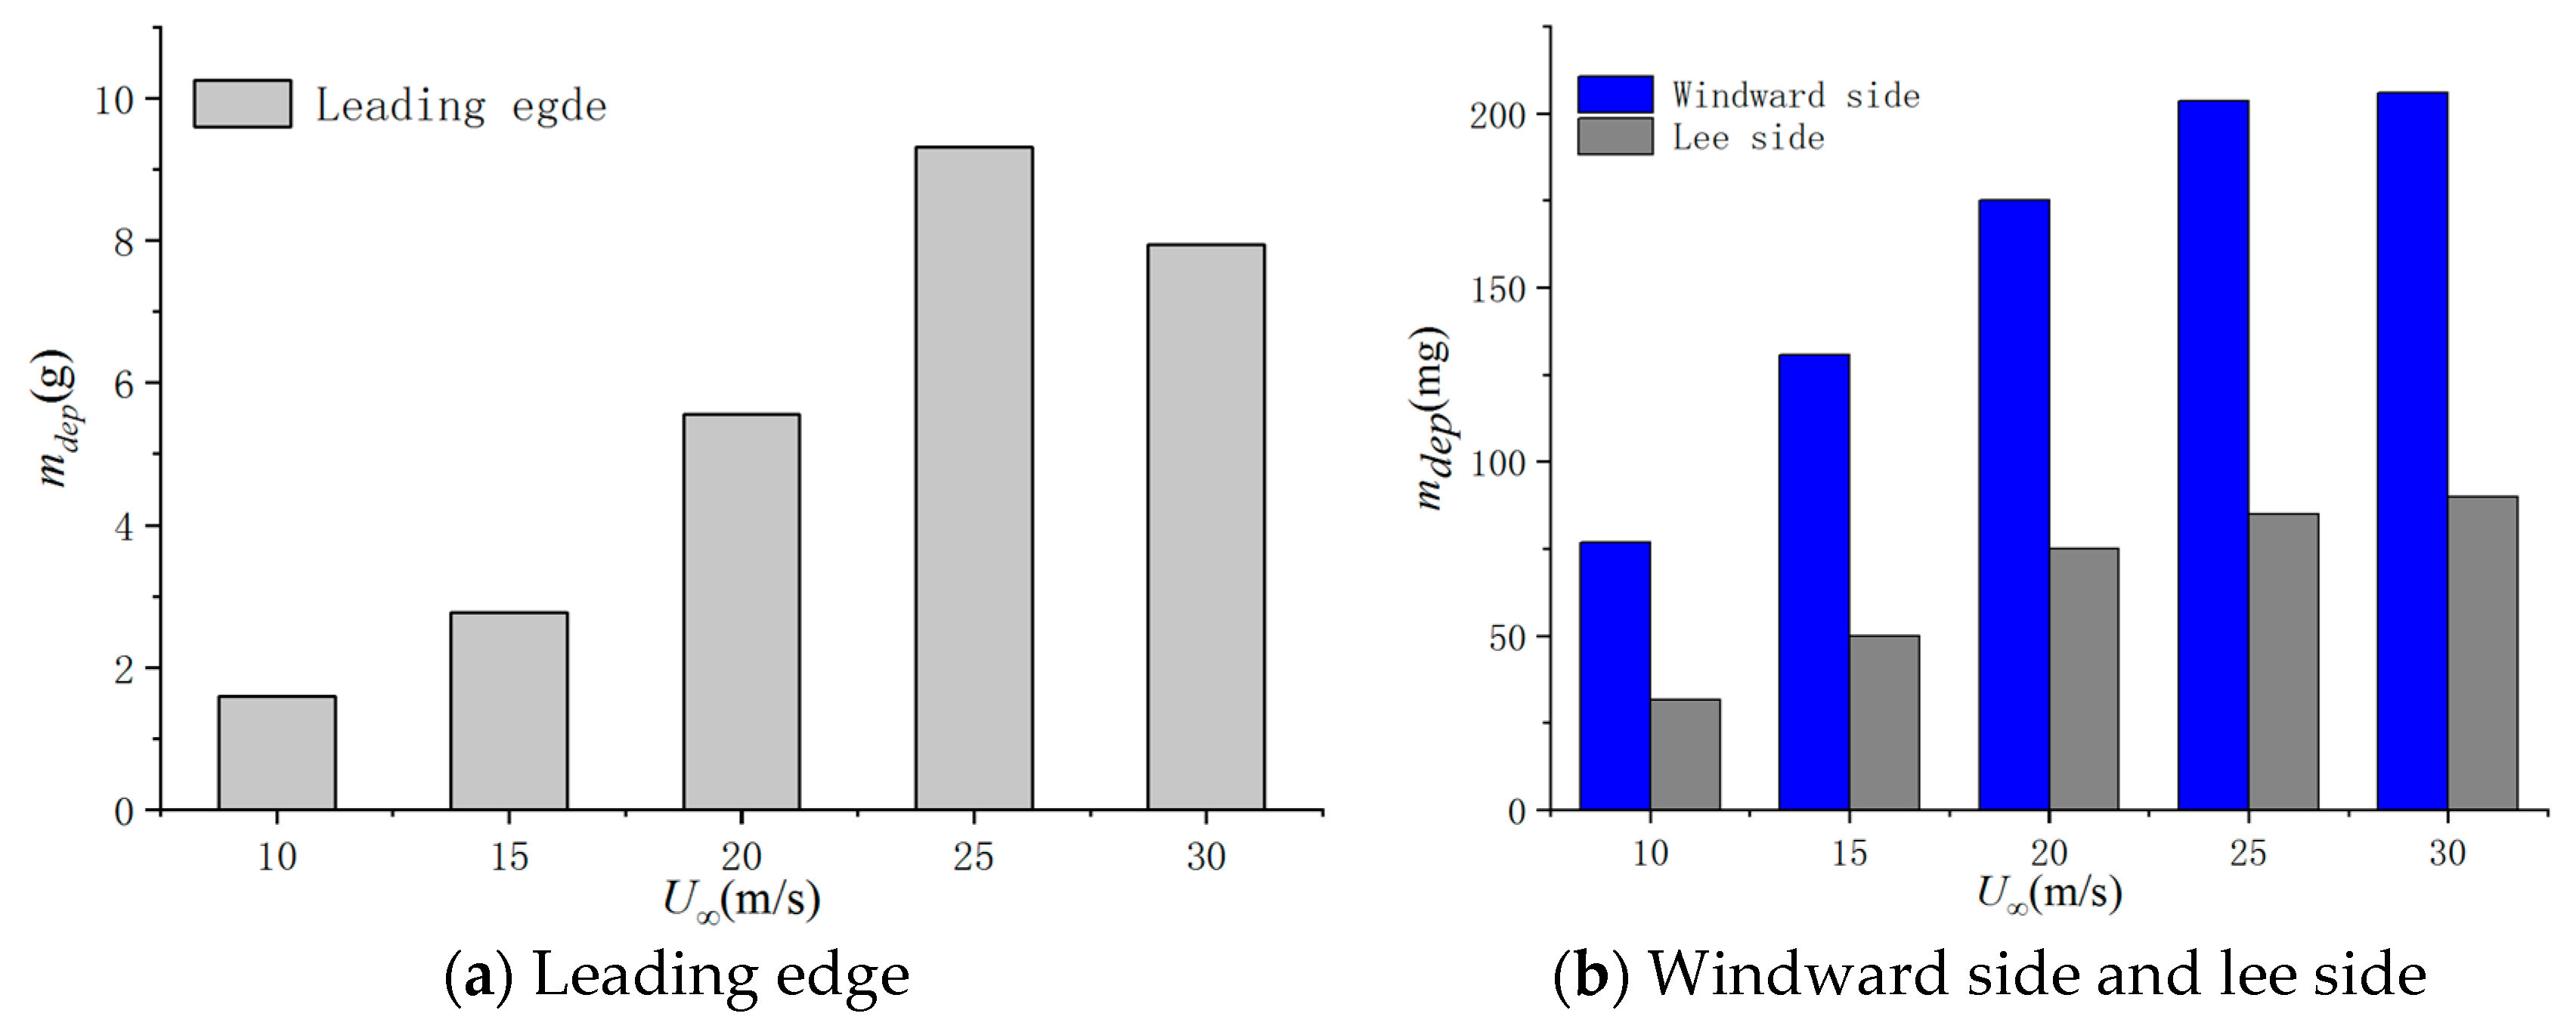
The deposition mass at different mainstream velocities is presented in Figure 11. Deposition mass increased gradually with increasing velocity. This was explained by the increased mainstream velocity, which indicated an increased number of impinging particles in unit time for a constant particle concentration. Deposition began to decrease just above a threshold velocity of 25 m/s. This was caused by the deposition spallation occurring at the maximum velocity (Figure 8e). A large number of particles detached from the deposition at the leading edge under the shear force, which resulted in a loss of deposition mass. The windward and lee sides of the test model experienced a decreasing deposition mass difference as the velocity increased.
Capture efficiencies were measured and calculated in numerous literatures related to effects on deposition to characterize the deposition behavior. The capture efficiencies can be defined as:
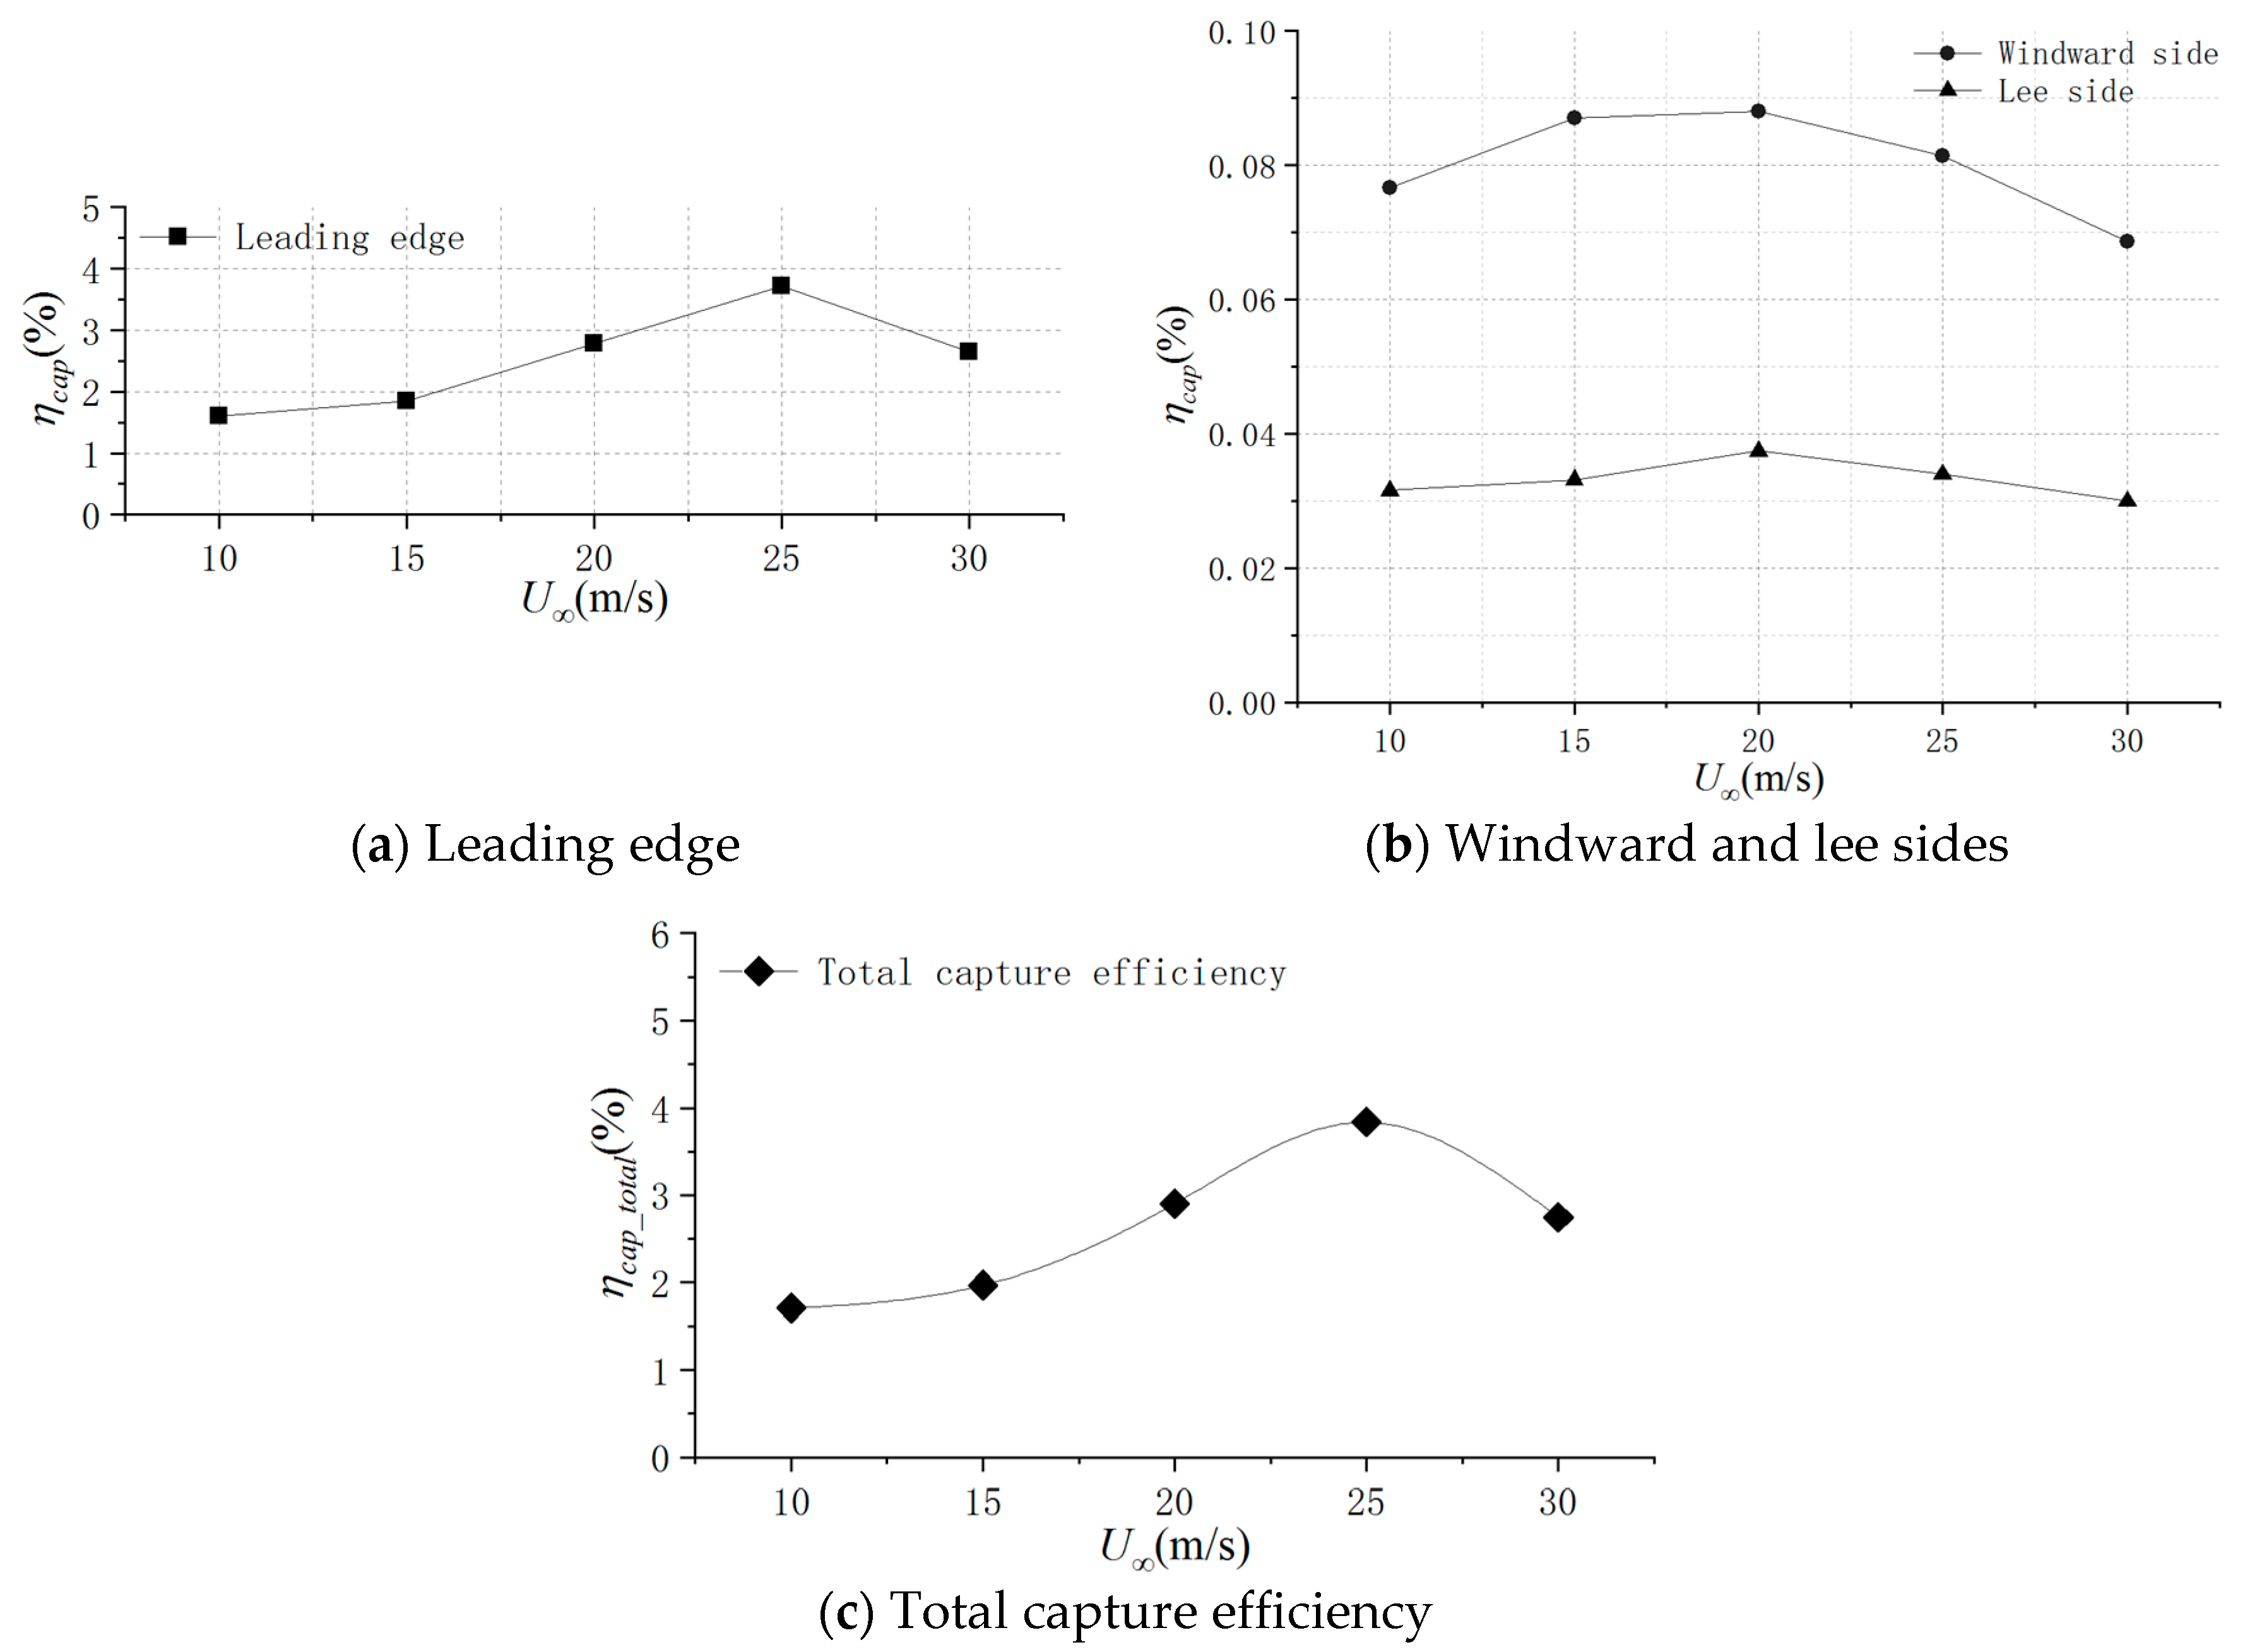
where mdep is the mass of particle deposition, min is the total mass of particle injected, qv is the mainstream volume flow rate, c is the particle volume concentration and t is the test time. Figure 12 shows the effects of the mainstream velocity on deposition capture efficiency. For the leading edge, capture efficiency increased over the first four tests and then decreased as the velocity increased. The dominant force for wax particles to impinge on the test model is inertial force. The increasing capture efficiency could be attributed to increased particle Stokes number, indicating a relative increase in the inertial force. Deposition mass increased with increasing velocity. The increase in deposition mass was related to deposition thickness with a given exposed coupon surface area for 5 min of exposure time. As the deposition thickness increased, the resulting vane contour was no longer in the streamline shape, which enhanced the capture efficiency. Capture efficiency decreased at a velocity of 30 m/s. The main reason for this is that the inlet air mass flow rate increased with increasing mainstream velocity, resulting in increased deposition gravity. The leading edge could have been ‘saturated’ with wax particles. Meanwhile, the increase in velocity causes the aerodynamic shear force to increase. When the sum of the gravity and aerodynamic force is greater than the bonding force of the deposition, splitting and detachment may occur. For the windward and lee sides, the capture efficiency increases first and then decreases with increasing mainstream velocity. The capture efficiency is at maximum at a mainstream velocity of 20 m/s. Deposition was easier to generate with higher mainstream Reynolds number and particle Stokes number, which resulted in the enhanced capture efficiency. The effect of particle impingement on the wall surface could not be neglected [20]. Due to increased mainstream Reynolds number, particles impacted the test model at the AOA of 5 deg. with more normal impact energy and momentum transfer, and subsequently rebounded more easily. This could lead to the loss in capture efficiency. The change trend of the capture efficiency on the windward and lee sides could be the result of both particle tracing fidelity to the mainstream and rebounding against the wall surface.
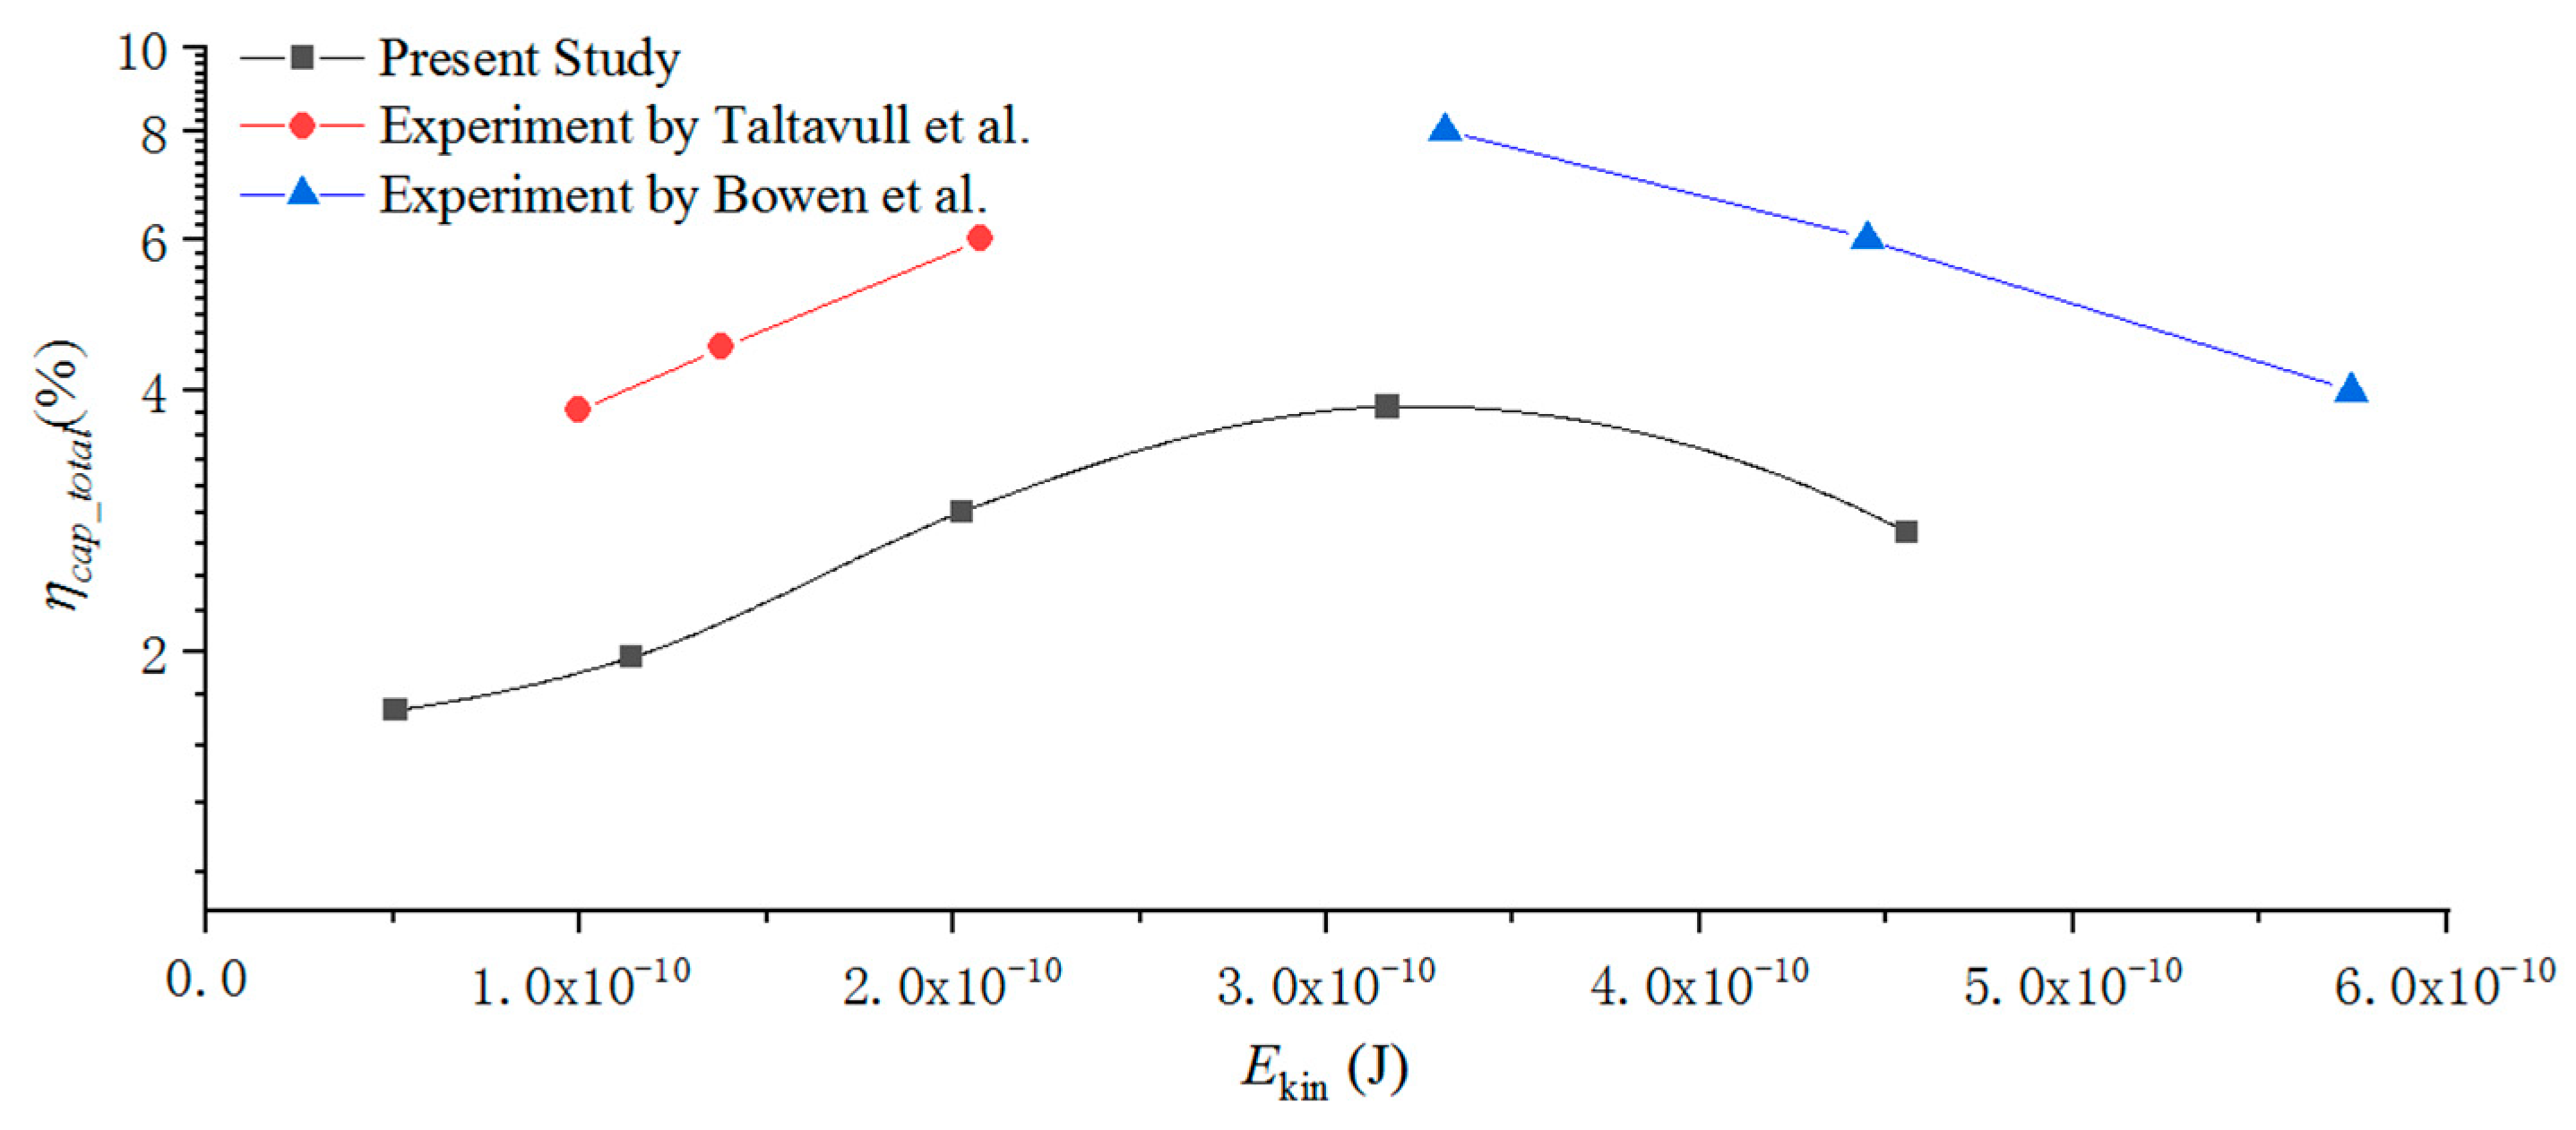
The total capture efficiency for a test model was consistent with the capture efficiency for the leading edge (Figure 12c). This could be attributed to the fact that the mass of the deposition at the leading edge occupied a large proportion of the total deposition mass. Variations in mainstream velocity would account for change in the Stokes number. Apart from the Stokes number, particle collision and rebound characteristics combined with the deposition splitting and detachment due to aerodynamic force could account for the change of the capture efficiency. For a flat plate, total capture efficiency was dominated by the mass of deposition at the leading edge. Figure 13 shows the capture efficiency as a function of mainstream velocity and its comparisons with that reported by Taltavull [31] and Bowen [32]. The horizontal coordinate is the particle kinetic energy (Ekin), a function of velocity. The expression for Ekin is shown in Equation (5):
where mp is the particle mass, Up is the particle velocity, which is equal to U∞. The variation trend of capture efficiencies with Ekin is consistent to that reported by Taltavull and Bowen, but the value of capture efficiency is not consistent, mainly due to the different geometric structure. Taltavull et al. and Bowen et al. studied the behavior of deposition on flat plates oriented at 30 deg, 90 deg to an impinging gas flow, respectively. The area of windward sides is bigger than that herein, accounting for the difference in the capture efficiency.
3.2. The Effect of Mainstream Temperature
Five series of tests were set up to investigate the individual effects of mainstream temperature (T∞) on particle deposition for a given mainstream Reynold number and particle concentration. The tests were run with a mainstream velocity of 10 m/s and particle concentration of 4.21 × 10⁻⁷. The temperature was increased from 32 °C up to a maximum of 48 °C.
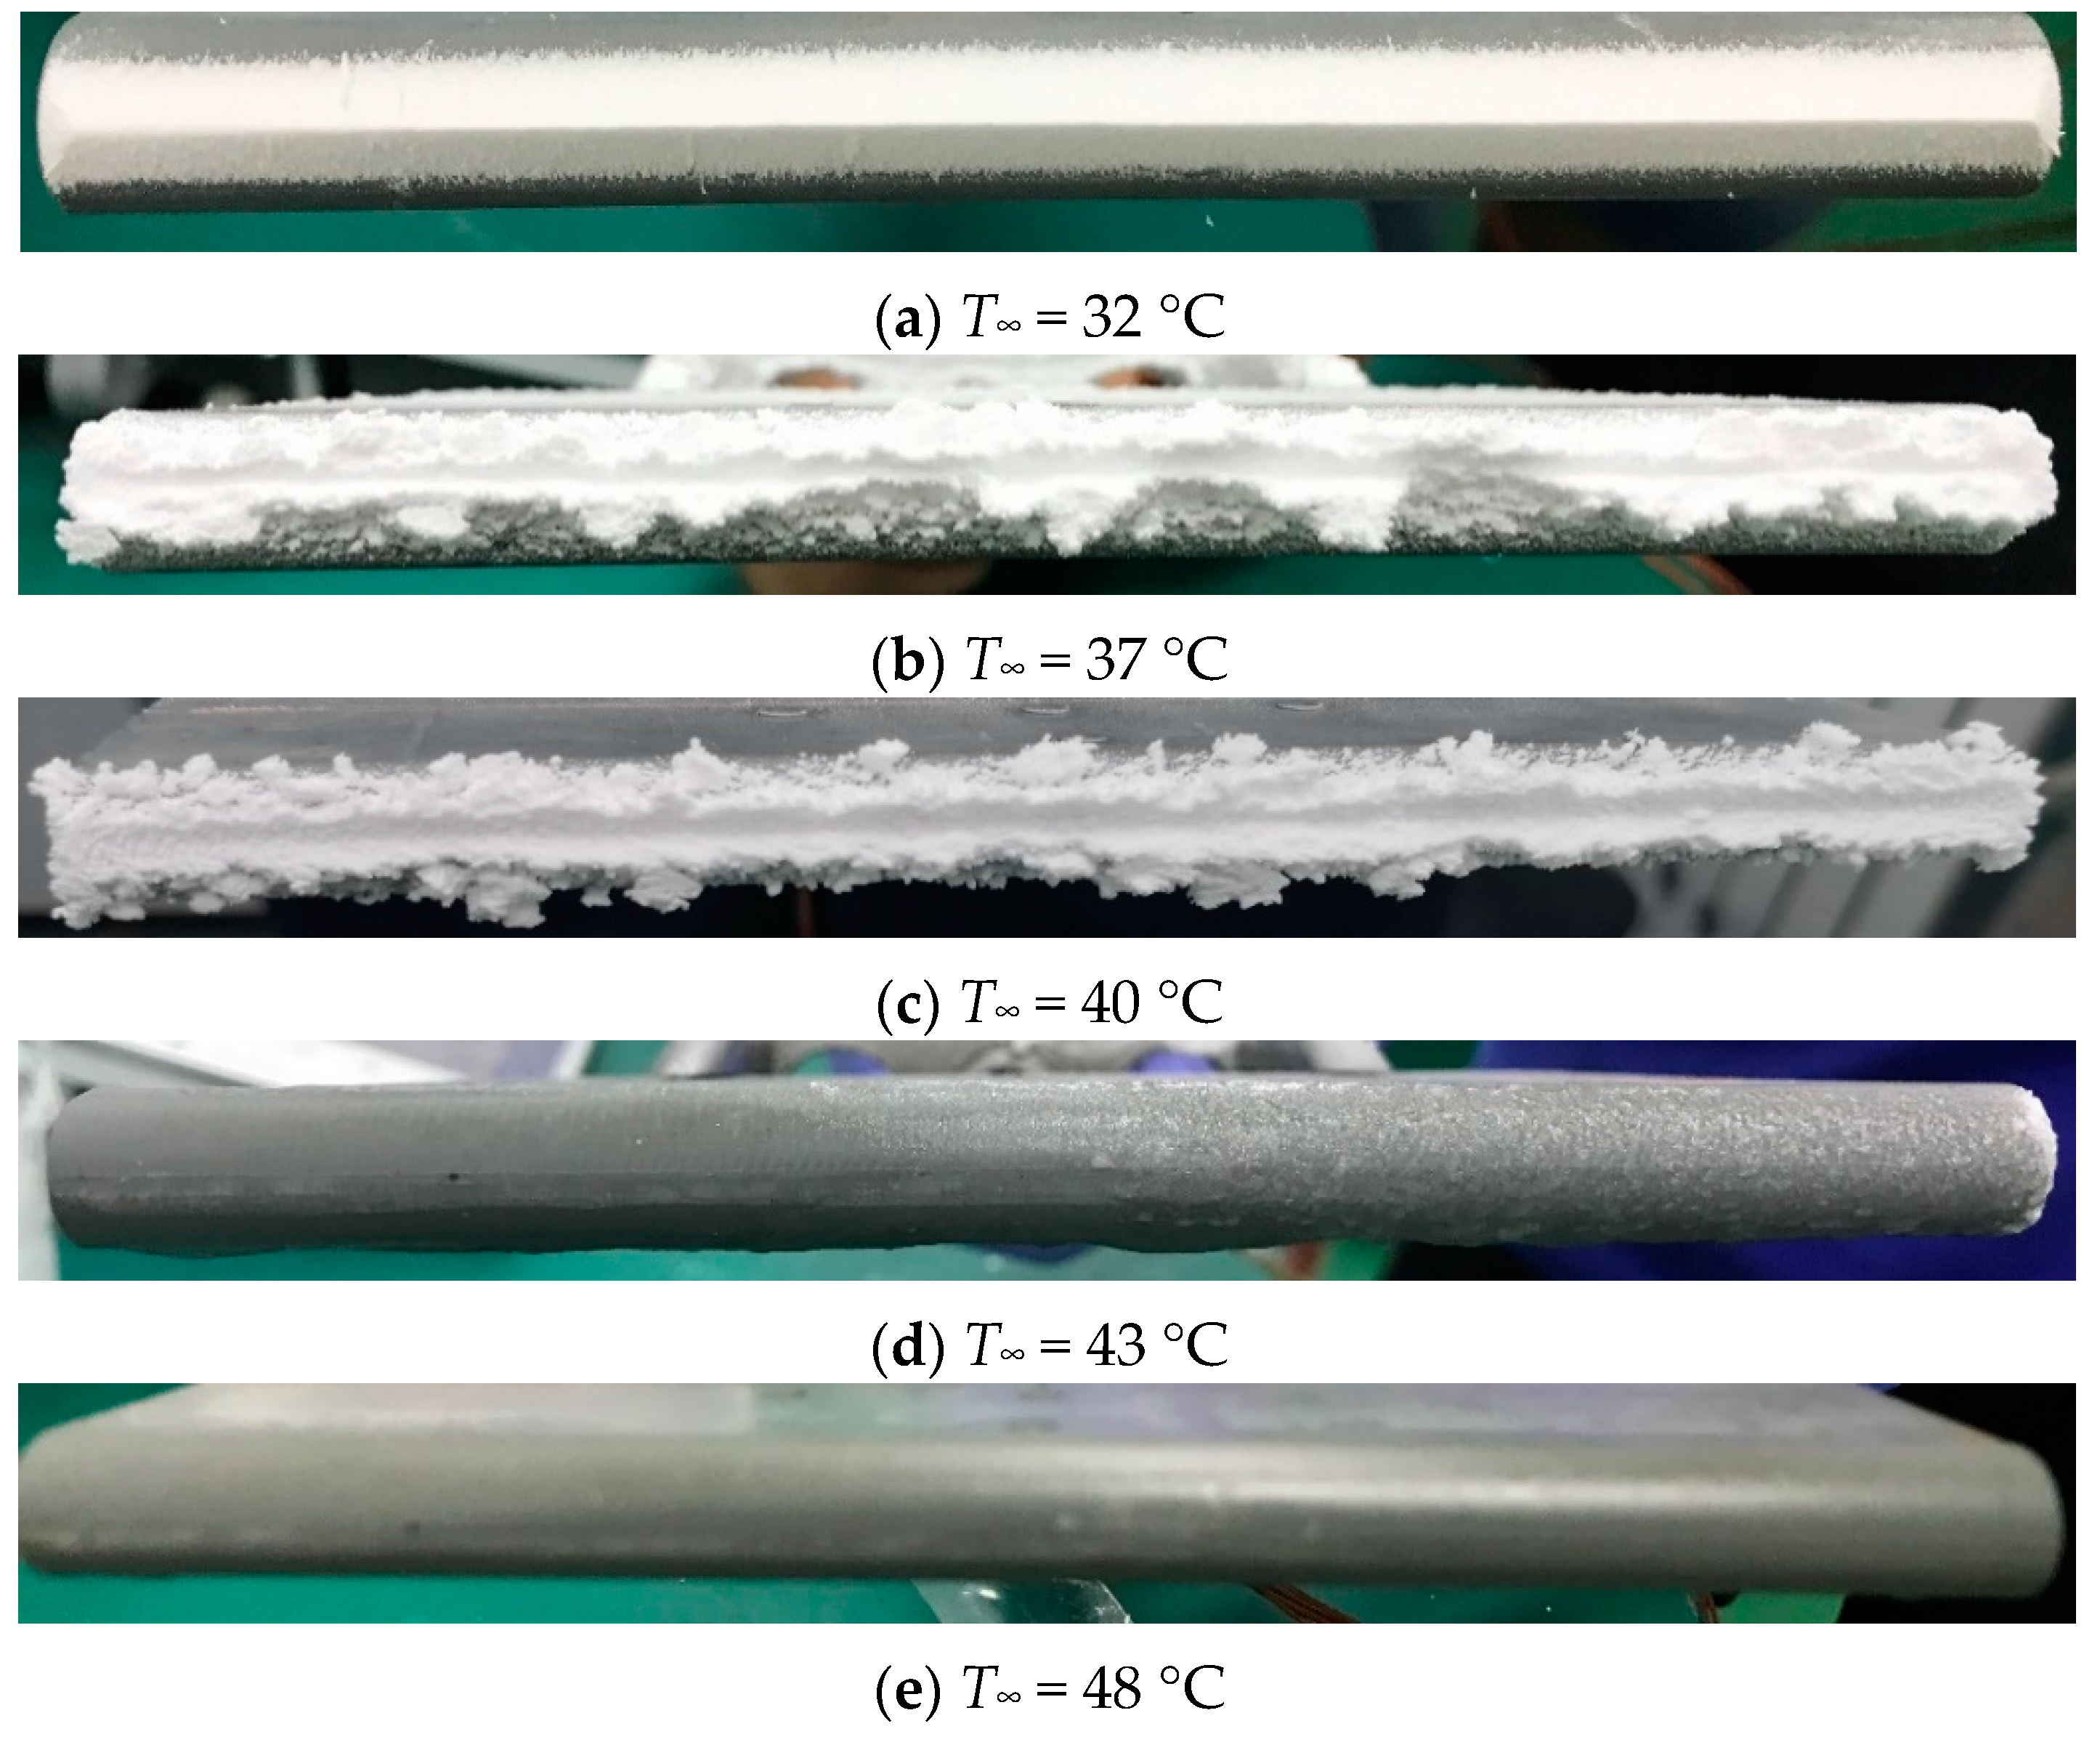
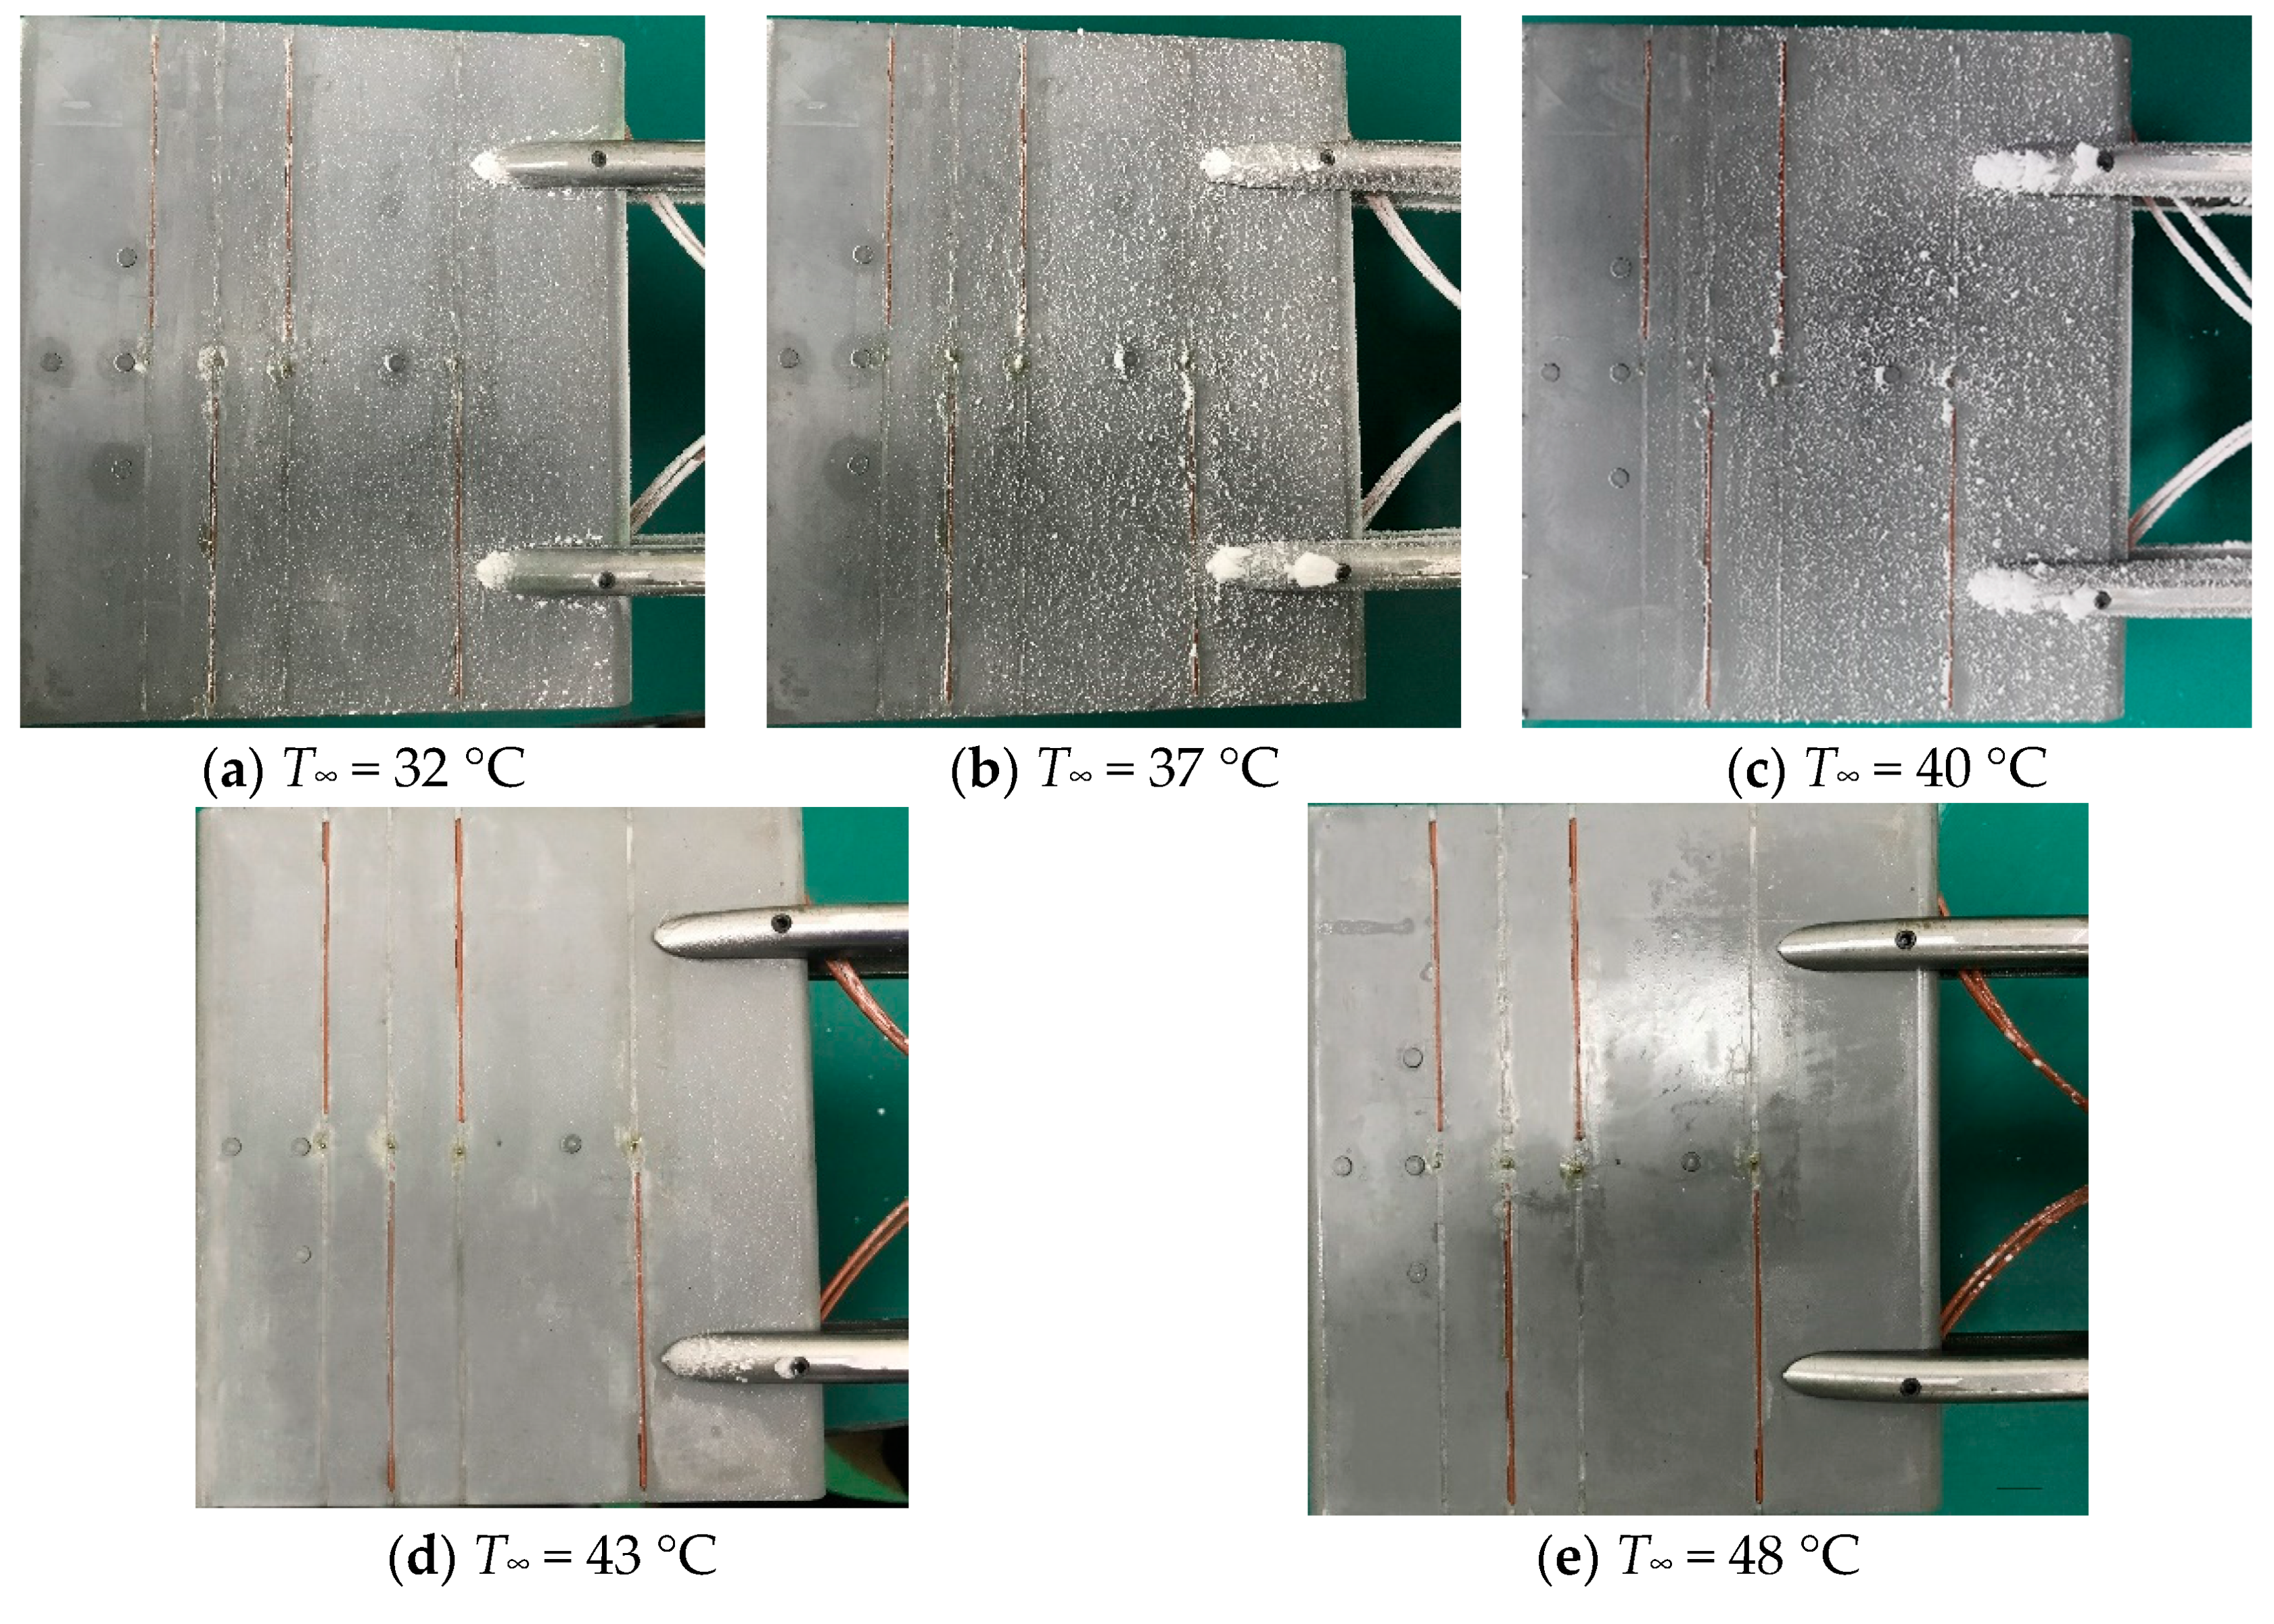
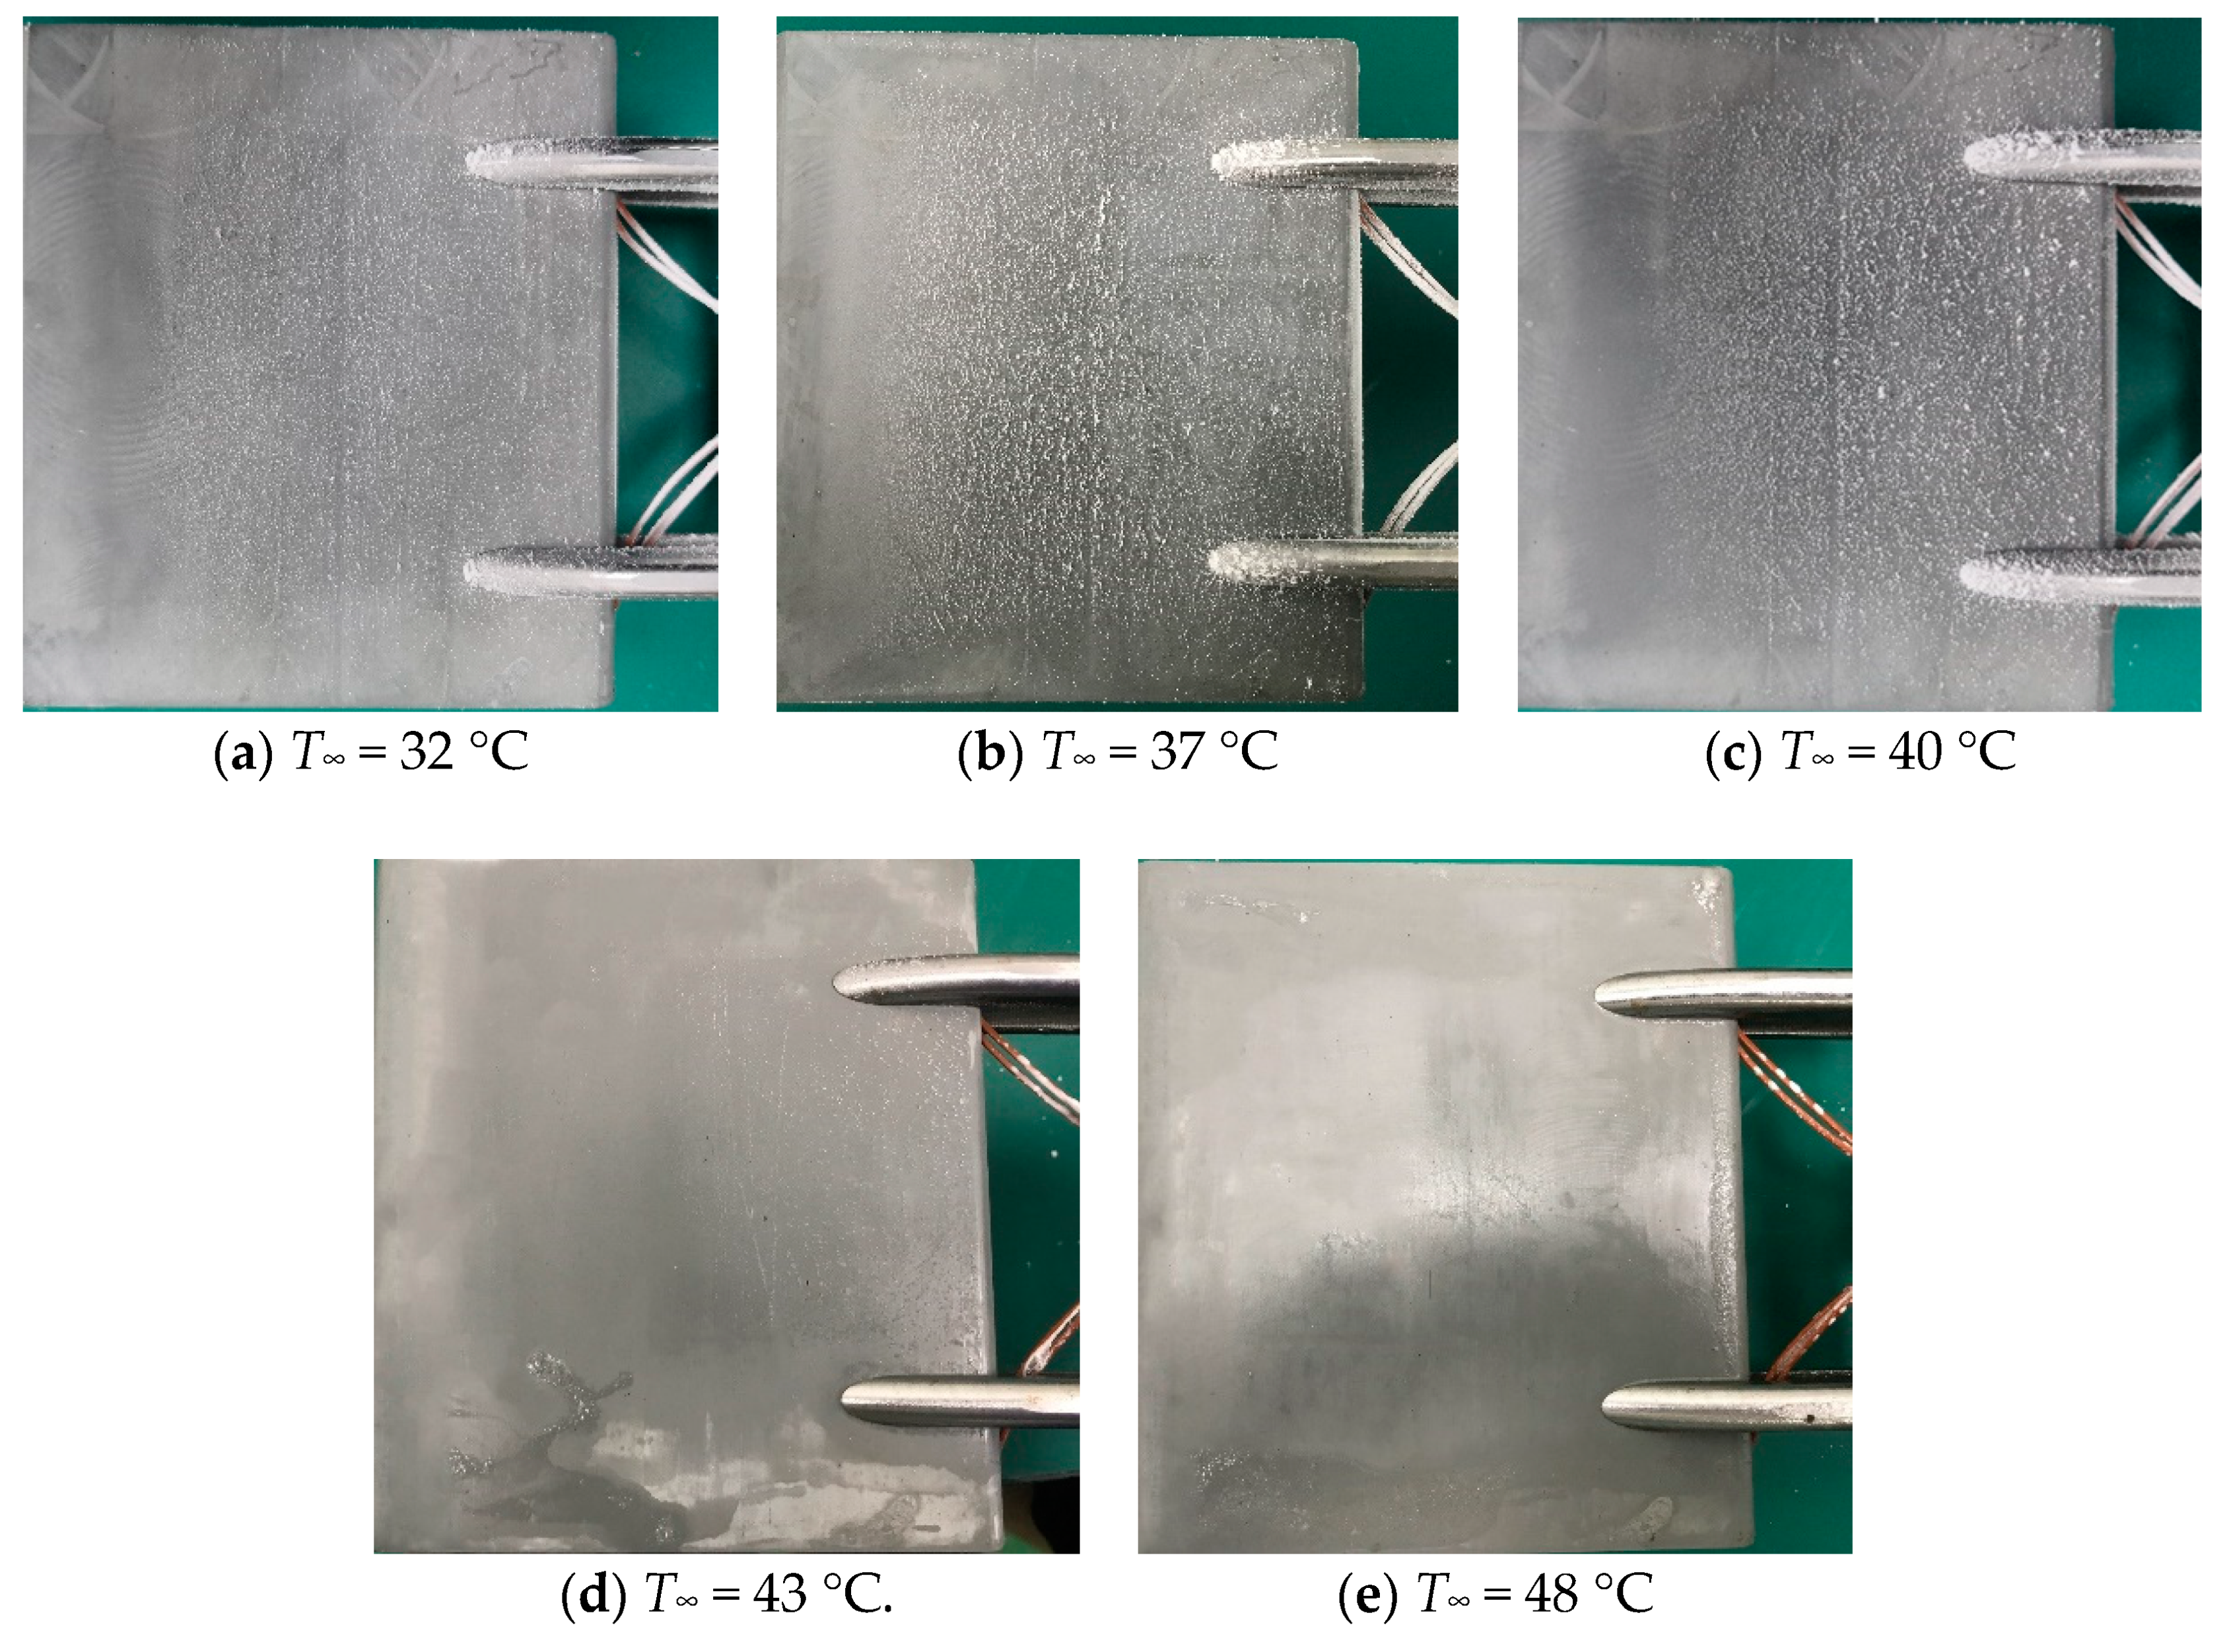
Wax deposition distribution at the leading edge, windward and lee sides are presented in Figure 14, Figure 15 and Figure 16, respectively. The maximum deposition amount was observed at the leading edge, while the amount of deposition was less in the forward portions of the windward and lee sides than that in the middle and backward portions. At the T∞ of 32 °C, far below the wax melting temperature, deposition near the stagnation line reached maximum and it became gradually less towards the two ends, in a V shaped pattern. The deposition patterns at the two ends were uniform and no flaking was observed. As T∞ increased, a nonuniform deposition structure occurred, indicating softened particle behavior and the effect of the mainstream flow along the surface. When the test was conducted at the T∞ of 37 °C, particle deposition was less than that at 32 °C in the vicinity of the stagnation line. An evident depressed belt at the leading edge could be observed from Figure 14b. Particle deposition increased gradually from the middle to the two ends. It was also observed during tests that larger bulks of wax detached from the deposition at the bottom side of the leading edge. At the T∞ of 40 °C, close to the wax melting temperature, the depressed belt appeared to be more evident. The deposition pattern at both ends was nonuniform, for particles there were blown off from the deposition. This could mean that the deposition stickiness increased with more trapping particles at the leading edge. Deposition decreased significantly as T∞ increased from 40 °C to 43 °C, above the wax melting temperature. A transparent deposition layer was observed at the leading edge at 43 °C, while no deposition was observed on the surface of the leading edge at 48 °C. When T∞ was below the wax melting point, sparse individual deposition was observed at 32 °C on the windward and lee sides, whereas more deposition could be discerned at the higher T∞. However, deposition decreased significantly when the temperature increased to 43 °C. Sparse deposition was observed at the backward portions of the windward and lee sides at the T∞ of 43 °C, slightly above the melting point. At the T∞ of 48 °C, a transparent wax deposition layer was observed only at the trailing edge.
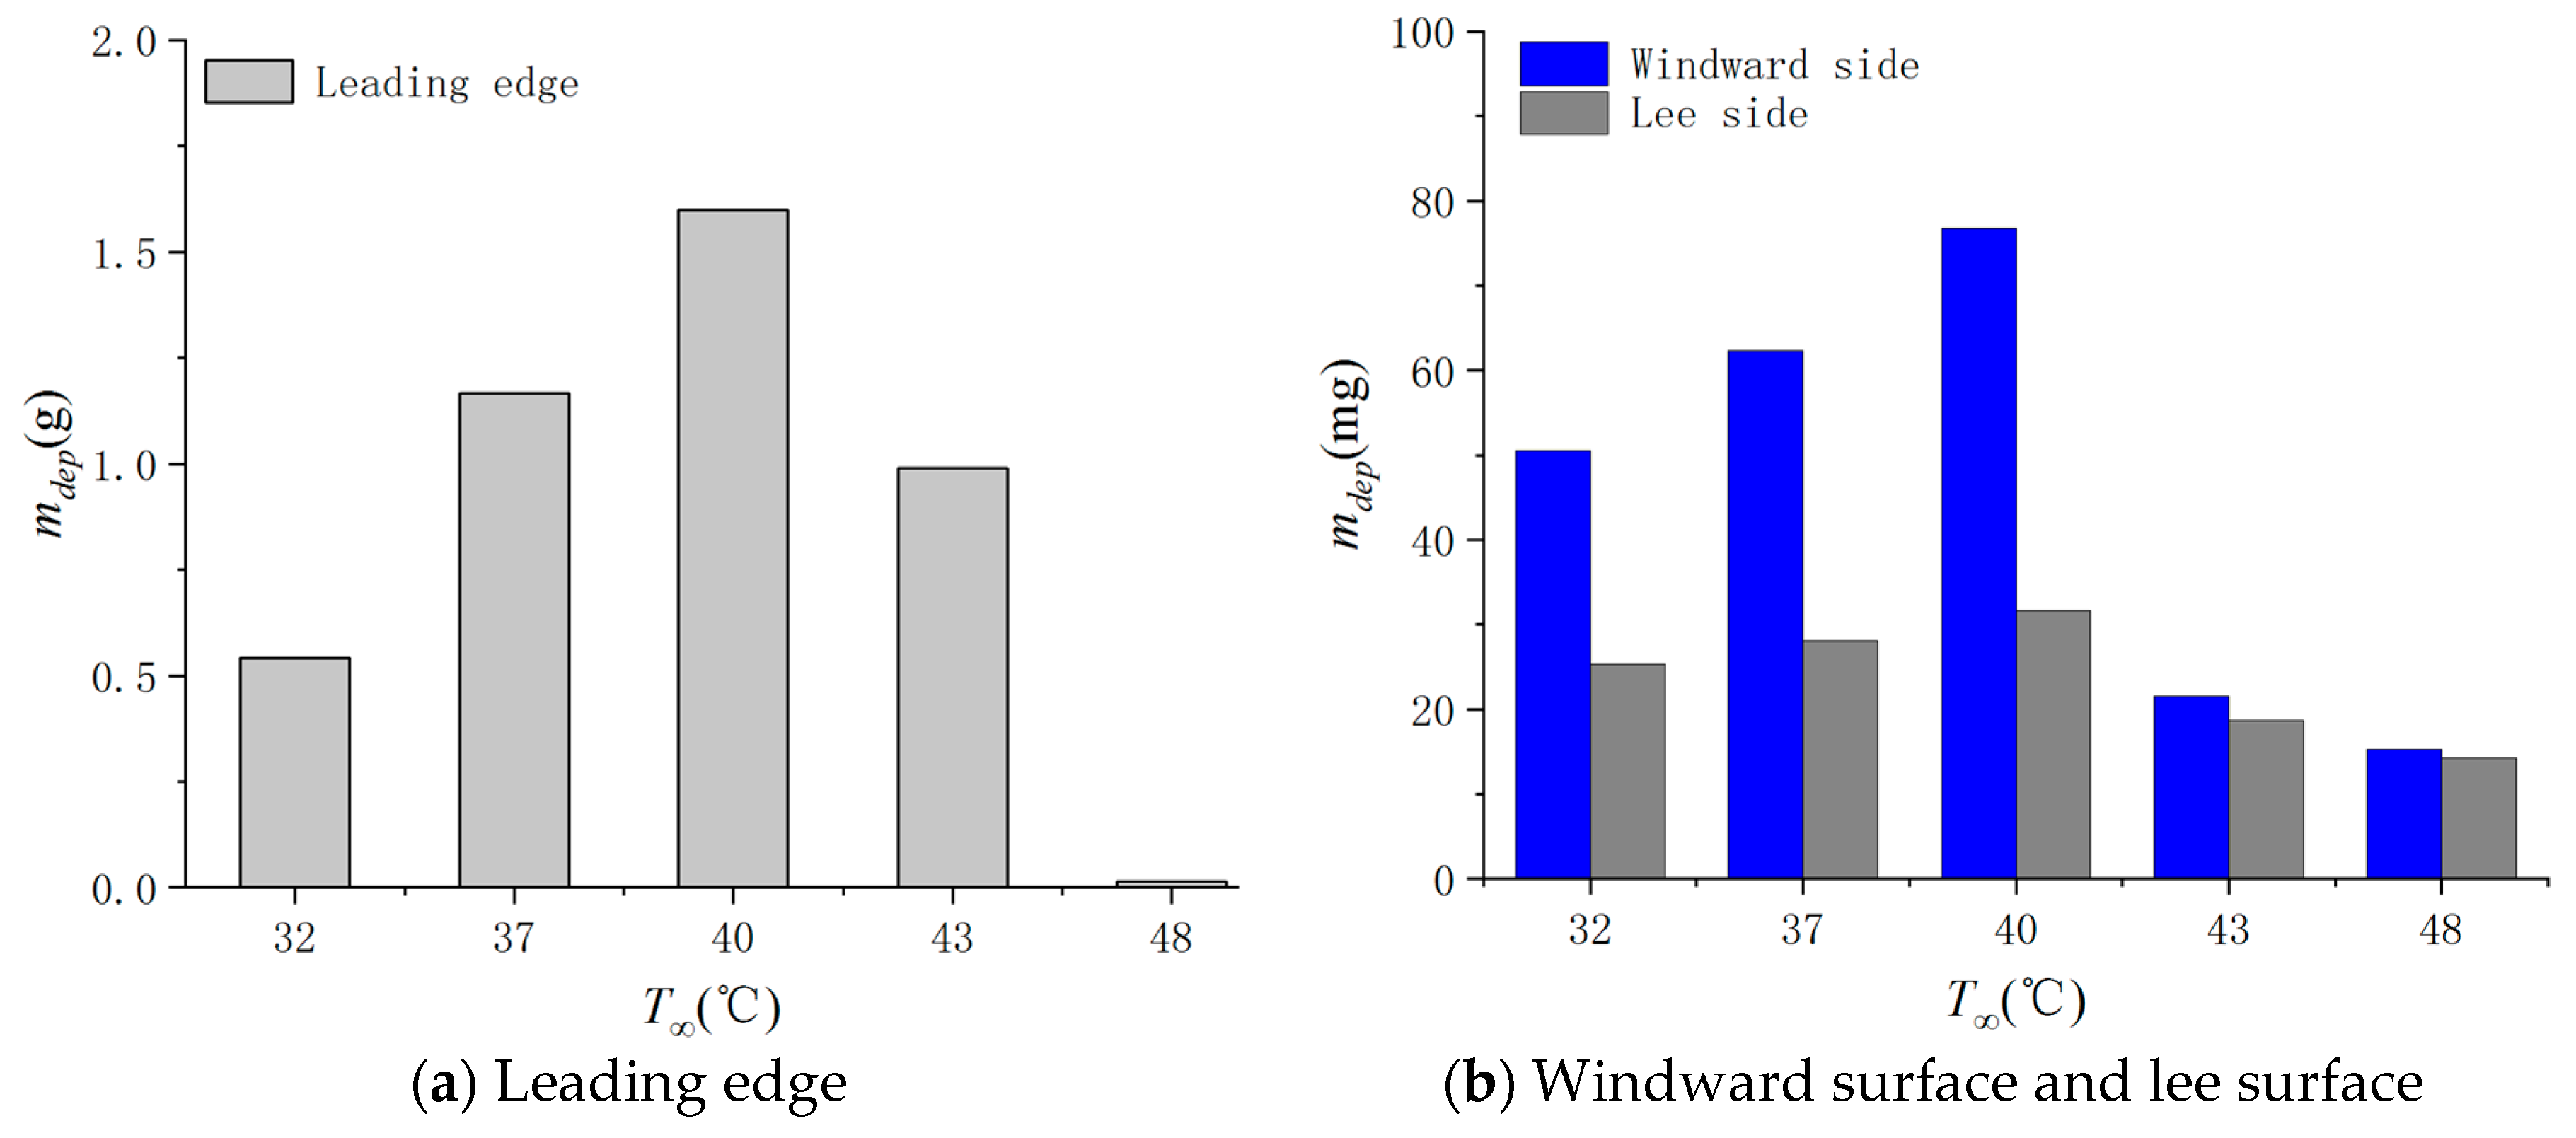
The deposition mass variation with T∞ was shown in Figure 17. Deposition mass initially increased and then began to decrease at a mainstream temperature of 40 °C for the leading edge, windward sides and lee sides. The threshold temperature was found to be approximately equal to the wax melting point. Once a molten wax particle was injected from the nozzle head at the T∞ of 32 °C, it was very likely to quickly cool down and solidify just before it impacted the surface. Lower T∞ increased the probability of a particle rebounding upon impact and not sticking to the surface. As T∞ approached the wax melting point, particles attached to the test model in a molten, or partially molten state, making them less susceptible to rebounding or detachment. Instead, deposition appeared to spread and solidify. This increased deposition mass was attributed to the larger number of molten particles in the larger temperature mainstream. Liquid wax spatter could occur due to the model surface temperature above the wax melting point. The uncoagulated particles flew along the surface in the form of a liquid film. The aerodynamic stress caused the liquid particles to detach from the surface of the test model, resulting in less deposition.
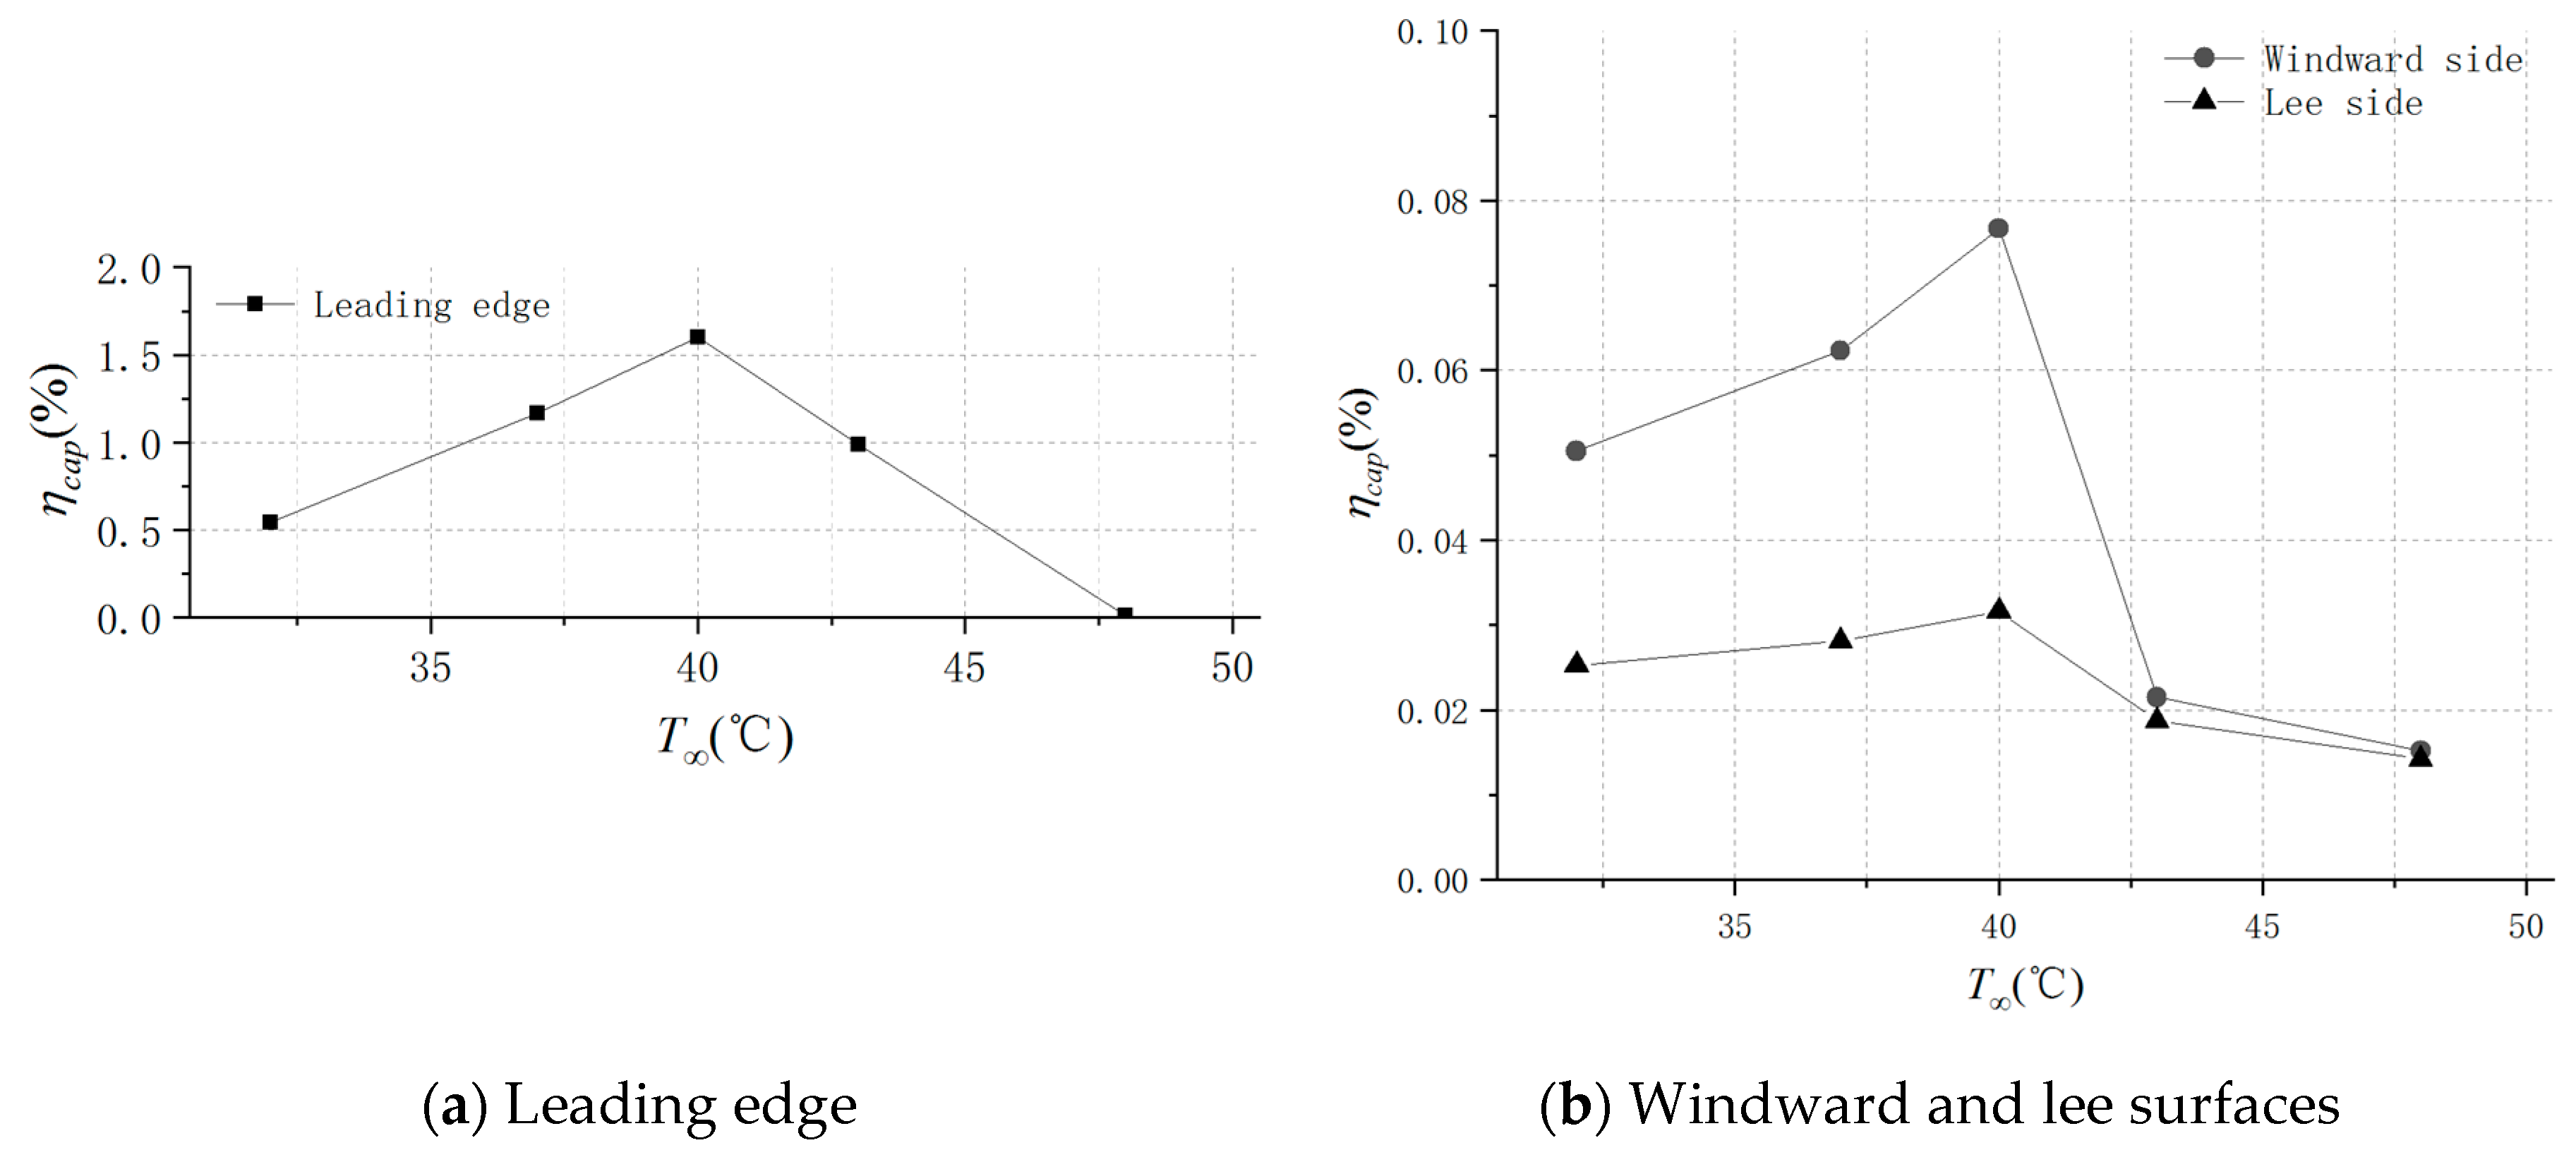
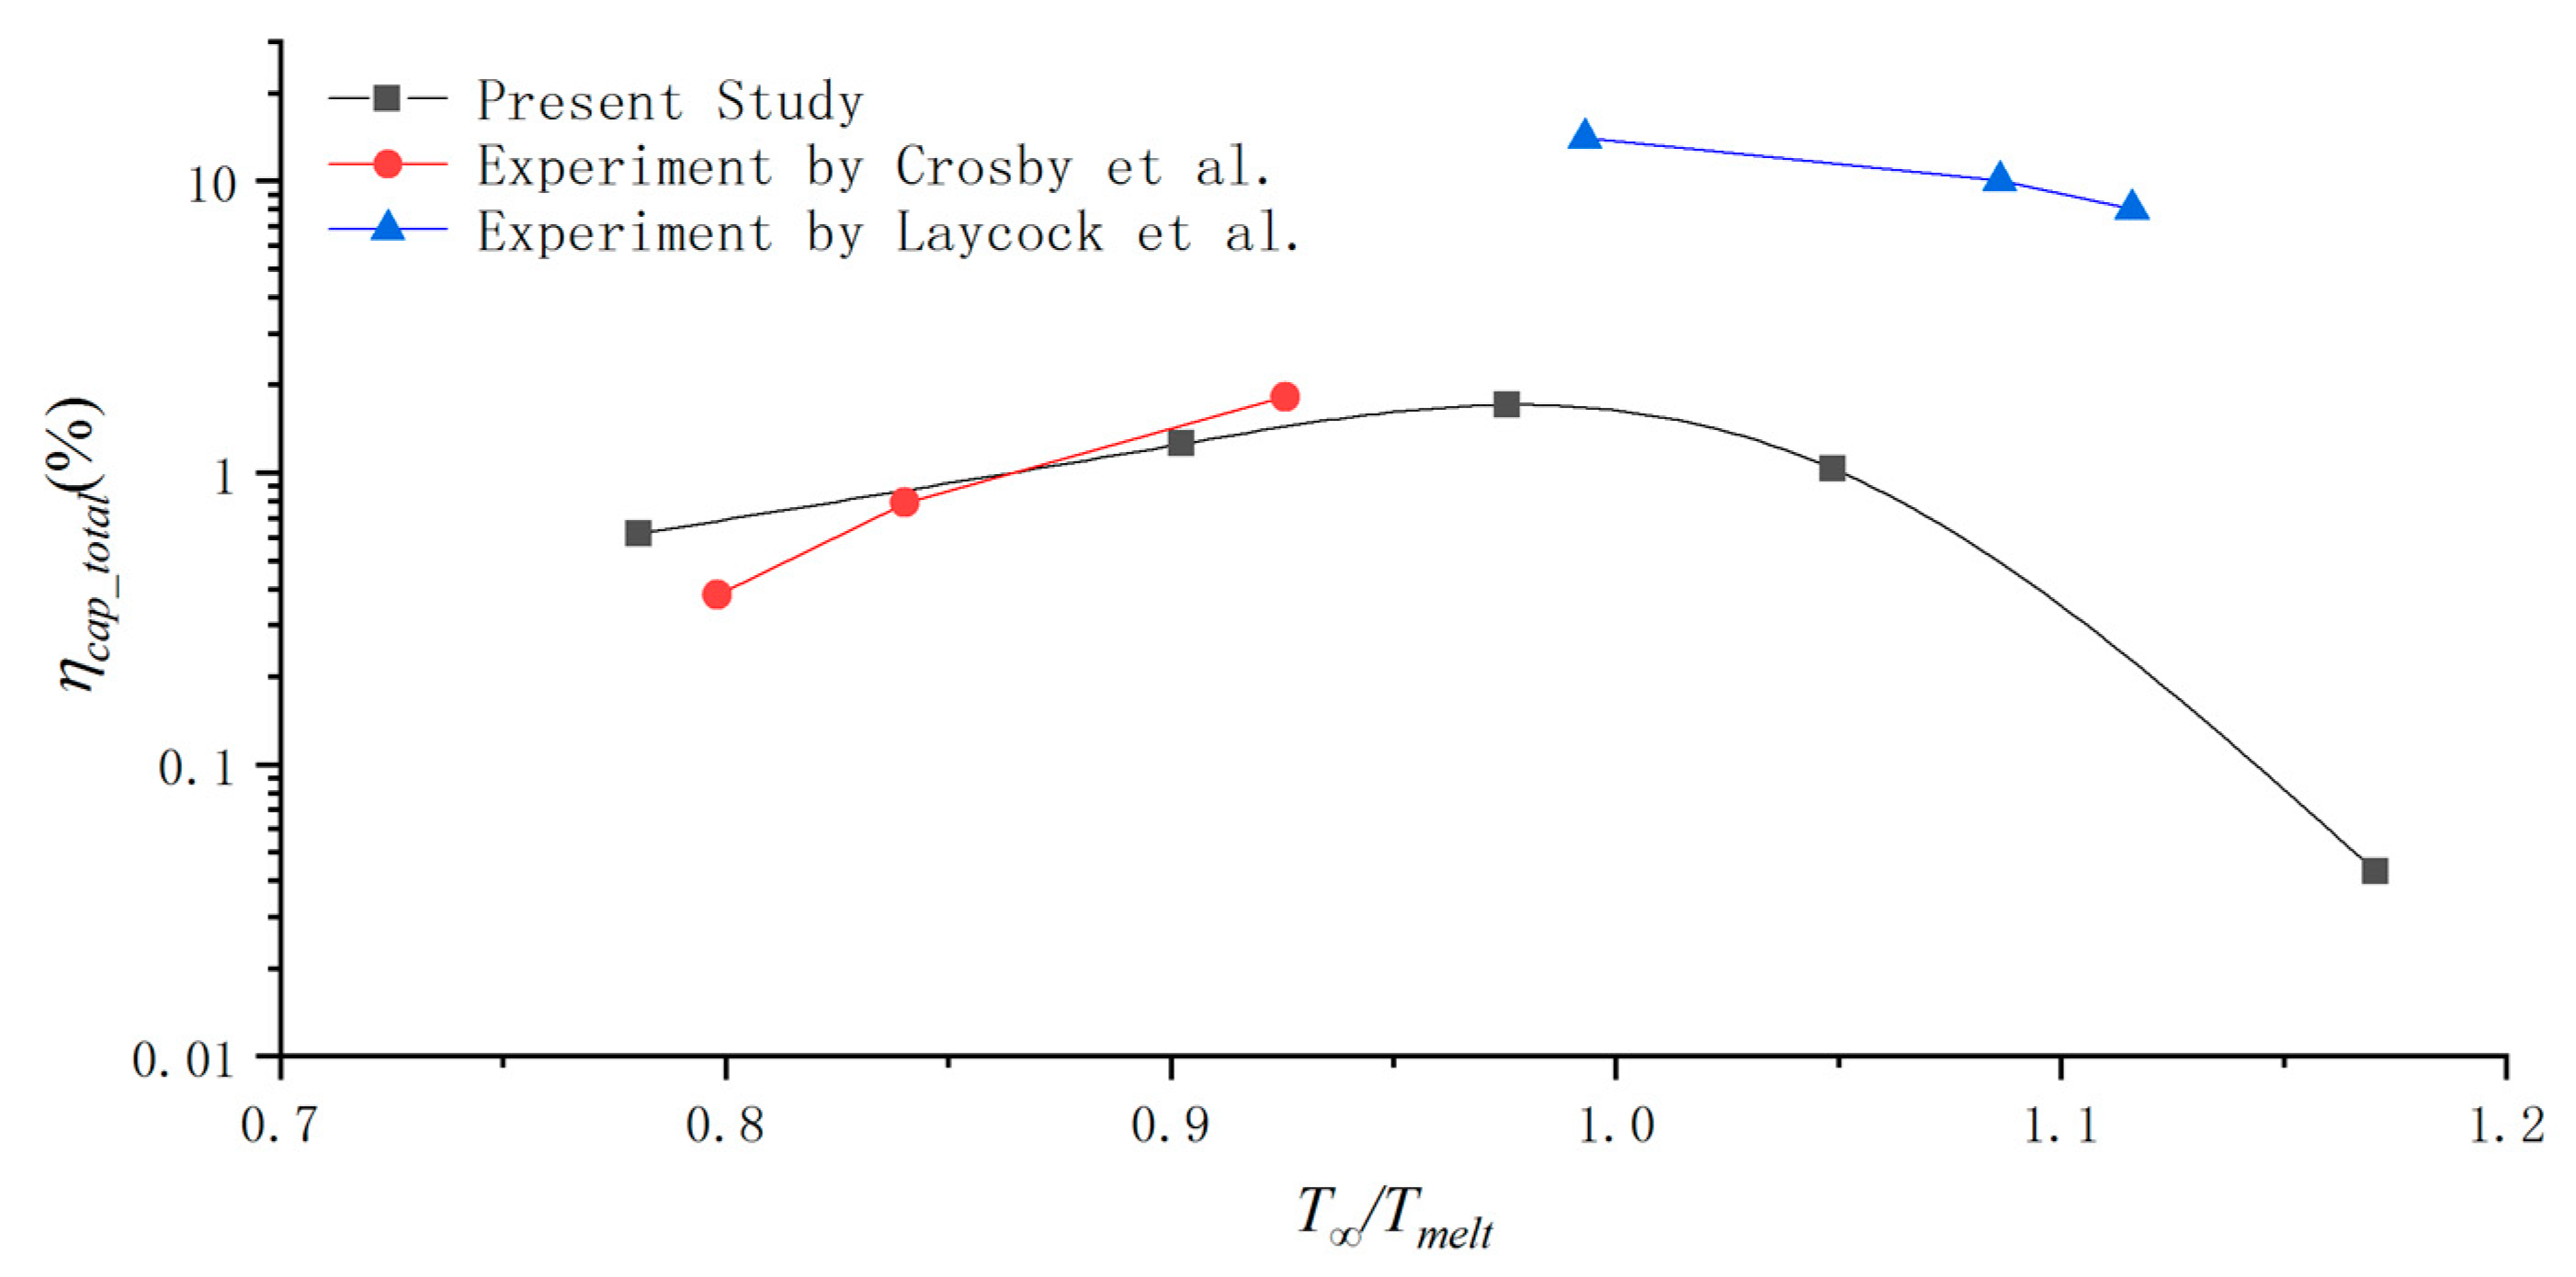
Capture efficiency at different T∞ was shown in Figure 18. Capture efficiency increased to a certain threshold temperature and then decreased with increasing T∞. It reached the maximum when T∞ was close to the melting point. When T∞ was below the melting temperature, the trend of capture efficiency in this paper was consistent with that reported by Lundgreen and Crosby [11,15]. They noted that capture efficiency increased with the mainstream temperature increasing. However, for T∞ above the wax melting temperature, the capture efficiency decreased with T∞ increasing. This behavior was also observed by Laycock et al. [17] They concluded that capture efficiency increased until a certain temperature, where capture efficiency began to decrease as surface temperature increased. This was attributed to the increased number of particles in molten form as they encountered the flat plate and increased probability of liquid wax spatter at increased T∞. Since the test model was non-cooled, its surface temperature was highly dependent on T∞. Increasing T∞ could elevate the model surface temperature. When the surface temperature of the test model exceeded the wax melting point, liquid wax film would detach from the structure surface under the aerodynamic force and thus it would not solidify upon reaching it. Figure 19 shows total capture efficiency reported by this paper, Crosby and Laycock. The variation trend of the capture efficiency reported in the paper is basically consistent with the data from Crosby and Laycock. The result is more closely matched to the data from Crosby, mainly for Stokes number of wax particles adopted herein is close to that of sand particles adopted by Crosby. For the particles of larger sizes used by Laycock, capture efficiency is higher due to a larger Stokes number.
Temperature increases were found to decrease particle capture efficiency at inlet temperatures above the particle melting point. However, excessively high inlet temperatures may cause damage to the component surface [12,33]. Therefore, it is not reasonable to achieve low capture efficiency and normal engine performance only by increasing gas temperature. Further investigation is still required to decrease the negative effects of deposition on plate surface heat transfer characteristics and aerodynamic performance.
4. Conclusions
Nine series of tests were conducted in a two-phase flow wind tunnel to investigate the independent effects of mainstream Reynolds number and mainstream temperature on particle deposition mass and distribution. Based on the results presented in this paper, the following conclusions can be drawn:
(1) Maximum wax deposition occurred at the leading edge, which increased levels of surface roughness and affected the vane contour. For the windward and lee sides, deposition was distributed in sparse spots, mainly in the middle and backward portions. No position was observed in the forward portion.
(2) Increased mainstream velocity denoted more particles reaching the surface in unit time for a given particle concentration. For the windward and lee sides, deposition mass increased with increasing mainstream velocity. Capture efficiency increased initially to a certain value and then decreased as mainstream velocity increased, for particles were easier to rebound with more kinetic energy. For the leading edge, capture efficiency increased and then began to decrease at a mainstream velocity of 25 m/s.
(3) T∞ was adjusted to change the phase of particles impacting the model surface. When T∞ was below the particle melting point, deposition mass and capture efficiency increased with increase in T∞ for both the leading edge and windward and lee sides. The mainstream temperature, higher than the particle melting point, would result in lower deposition mass and capture efficiency.
The study focused on particle deposition on a flat plate. Further work should consider the effect of geometric structure on the particle deposition and the effect of particle deposition on surface heat transfer characteristics.
Author Contributions
Investigation, Writing-Original Draft Preparation, F.Z.; Resources, Z.L. (Zhenxia Liu); Supervision, Z.L. (Zhengang Liu); Data Curation, Y.L.
Funding
This study was funded by the National Natural Science Foundation of China, grant number 51606155.
Conflicts of Interest
The authors declare no conflict of interest.
References
- Dean, J.; Taltavull, C.; Clyne, T. Influence of the composition and viscosity of volcanic ashes on their adhesion within gas turbine aeroengines. Acta Mater. 2016, 109, 8–16. [Google Scholar] [CrossRef] [Green Version]
- Shin, D.; Hamed, A. Advanced High Temperature Erosion Tunnel for Testing TBC and New Turbine Blade Materials; ASME Paper 2016, No. 2016-57922; ASME: New York, NY, USA, 2016. [Google Scholar] [CrossRef]
- Tabakoff, W. Measurements of particles rebound characteristics on materials used in gas turbines. J. Propuls. Power 2015, 7, 805–813. [Google Scholar] [CrossRef]
- Chambers, J.C. The 1982 Encounter of British Airways 747 with the Mt. Galuggung Eruption Cloud. In Proceedings of the 23rd Aerospace Science Meeting, Reno, NV, USA, 14–17 January1985. [Google Scholar]
- Tabakoff, W. Review—Turbomachinery performance deterioration exposed to solid particulates environment. J. Fluids Eng. 1984, 106, 125–134. [Google Scholar] [CrossRef]
- Dunn, M.G.; Moller, J.C.; Moller, J.E.; Adams, R.M. Performance deterioration of a turbofan and a turbojet engine upon exposure to a dust environment. J. Eng. Gas Turbines Power 1987, 109, 336–343. [Google Scholar] [CrossRef]
- Boulanger, A.; Patel, H.; Hutchinson, J.; DeShong, W.; Xu, W.; Ng, W.; Ekkad, S. Preliminary experimental investigation of initial onset of sand deposition in the turbine section of gas turbines. In Proceedings of the ASME Turbo Expo 2016, Seoul, Korea, 13–17 June 2016. [Google Scholar] [CrossRef]
- Kim, J.; Dunn, M.G.; Baran, A.J. Deposition of volcanic materials in the hot sections of two gas turbine engines. J. Eng. Gas Turbines Power 1993, 115, 641–651. [Google Scholar] [CrossRef]
- Koenig, P.; Miller, T.; Rossmann, A. Damage of High Temperature Components by Dust-Laden Air. In Proceedings of the Agard Conference, Rotterdam, The Netherlands, 25–28 April 1994; p. 25. [Google Scholar]
- Jensen, J.W.; Squire, S.W.; Bons, J.P.; Fletcher, T.H. Simulated Land-based Turbine Deposits Generated in an Accelerated Deposition Facility. J. Turbomach. 2005, 127, 462–470. [Google Scholar] [CrossRef]
- Crosby, J.M.; Lewis, S.; Bons, J.P.; Ai, W.; Fletcher, T.H. Effects of temperature and particle size on deposition in land based turbines. J. Eng. Gas Turbines Power 2008, 130, 819–825. [Google Scholar] [CrossRef]
- Wammack James, E.; Crosby, J.; Fletcher, D.; Bons, J.P.; Fletcher, T.H. Evolution of surface deposits on a high-pressure turbine blade-Part I: Physical Characteristics. J. Turbomach. 2008, 130, 021020. [Google Scholar] [CrossRef]
- Ai, W.; Murray, N.; Fletcher, T.H.; Harding, S.; Lewis, S.; Bons, J.P. Deposition near film cooling holes on a high pressure turbine vane. J. Turbomach. 2012, 134, 041013. [Google Scholar] [CrossRef]
- Bonilla, C.; Webb, J.; Clum, C.; Casaday, B.; Brewer, E.; Bons, J.P. The effect of particle size and film cooling on nozzle guide vane deposition. J. Eng. Gas Turbines Power 2012, 134, 101901. [Google Scholar] [CrossRef]
- Lundgreen, R.; Sacco, C.; Prenter, R.; Bons, J.P. Temperature Effects on Nozzle Guide Vane Deposition in a New Turbine Cascade Rig. In Proceedings of the ASME Turbo Expo 2016, Seoul, Korea, 13–17 June 2016. [Google Scholar] [CrossRef]
- Whitaker, S.M.; Prenter, R.; Bons, J.P. The effect of freestream turbulence on deposition for nozzle guide vanes. J. Turbomach. 2015, 137, 121001. [Google Scholar] [CrossRef]
- Laycock, R.; Fletcher, T.H. Independent effects of surface and gas temperature on coal fly ash deposition in gas turbines at temperatures up to 1400 °C. J. Eng. Gas Turbines Power 2016, 138, 021402. [Google Scholar] [CrossRef]
- Brach, R.; Dunn, P. A mathematical model of the impact and adhesion of microsphers. Aerosol Sci. Technol. 1992, 16, 1–14. [Google Scholar] [CrossRef]
- Zhou, J.H.; Zhang, J.Z. Numerical investigation of particle deposition on converging slot-hole film-cooled wall. J. Cent. South Univ. 2017, 24, 2819–2828. [Google Scholar] [CrossRef]
- Bons, J.P.; Prenter, R.; Whitaker, S. A Simple Physics-Based Model for Particle Rebound and Deposition in Turbomachinery. J. Turbomach. 2017, 139, 081009. [Google Scholar] [CrossRef]
- Prenter, R.; Ameri, A.; Bons, J.P. Computational simulation of deposition in a cooled high-pressure turbine stage with hot streaks. J. Turbomach. 2017, 139, 091005. [Google Scholar] [CrossRef]
- Sreedharan, S.S.; Tafti, D.K. Composition dependent model for the prediction of syngas ash deposition in turbine gas hotpath. Int. J. Heat Fluid Flow 2011, 32, 201–211. [Google Scholar] [CrossRef]
- Yang, X.J.; Zhu, J.X. Numerical simulation of particle deposition process inside turbine cascade. Acta Aeronaut. Astronaut. Sin. 2017, 38, 120530. [Google Scholar] [CrossRef]
- Forsyth, P. High Temperature Particle Deposition with Gas Turbine Applications. Ph.D. Dissertation, University of Oxford, Oxford, UK, 2017. [Google Scholar]
- Connolly, J.; Forsyth, P.; McGilvray, M.; Gillespie, D. The Use of Fluid-Solid Cell Transformation to Model Volcanic Ash Deposition within a Gas Turbine Hot Component. In Proceedings of the ASME Turbo Expo 2018, Oslo, Norway, 11–15 June 2018. [Google Scholar] [CrossRef]
- Liu, Z.; Zhang, F.; Liu, Z. A Numerical Model for Simulating Liquid Particles Deposition on Surface. In Proceedings of the ASME Turbo Expo 2018, Oslo, Norway, 11–15 June 2018. [Google Scholar] [CrossRef]
- Lawson, S.A.; Thole, K.A. Simulations of Multiphase Particle Deposition on Endwall Film-Cooling. J. Turbomach. 2012, 134, 011003. [Google Scholar] [CrossRef]
- Albert, J.E.; Keefe, K.J.; Bogard, D.G. Experimental Simulation of Contaminant Deposition on a Film Cooled Turbine Airfoil Leading Edge. In Proceedings of the ASME Turbo Expo 2009, Lake Buena Vista, FL, USA, 13–19 November 2009. [Google Scholar] [CrossRef]
- Albert, J.E.; Bogard, D.G. Measurements of Adiabatic Film and Overall Cooling Effectiveness on a Turbine Vane Pressure Side with a Trench. In Proceedings of the ASME Turbo Expo 2011, Vancouver, BC, Canada, 6–10 June 2011. [Google Scholar] [CrossRef]
- Dring, R.P.; Caspar, J.R.; Suo, M. Particle trajectories in turbine cascades. J. Energy 1979, 3, 161–166. [Google Scholar] [CrossRef]
- Taltavull, C.; Dean, J.; Clyne, T.W. Adhesion of volcanic ash particles under controlled conditions and implications for their deposition in gas turbines. Adv. Eng. Mater. 2016, 18, 803–813. [Google Scholar] [CrossRef]
- Bowen, C.P.; Libertowski, N.D.; Mortazavi, M.; Bons, J.P. Modeling Deposition in Turbine Cooling Passages with Temperature-Dependent Adhesion and Mesh Morphing. J. Eng. Gas Turbines Power 2019, 141, 071010. [Google Scholar] [CrossRef]
- Davidson, F.T.; Kistenmacher, D.A.; Bogard, D.G. A Study of Deposition on a Turbine Vane with a Thermal Barrier Coating and Various Film Cooling Geometries. J. Turbomach. 2014, 136, 1769–1780. [Google Scholar] [CrossRef]
Figure 1.
Experimental system schematic.

Figure 2.
Photograph of the test section.

Figure 3.
Schematic of the wax spray system.

Figure 4.
Picture of the wax sprayer and turbulence generating.

Figure 5.
Three-dimensional maps of the test model and its fixing holder.

Figure 6.
Schematic of multiphase flow and angle of attack.

Figure 7.
Wax particle size distribution.

Figure 8.
Photographs of wax deposition on leading edge with different mainstream velocities.

Figure 9.
Photographs of wax deposition on windward surface with different mainstream velocities.

Figure 10.
Photographs of wax deposition on lee surface with different mainstream velocities.

Figure 11.
Deposition mass with different mainstream velocities.

Figure 12.
Capture efficiency at different mainstream velocities.

Figure 13.
Total capture efficiency in this study compared with data from Taltavull [31] and Bowen [32].

Figure 14.
Photographs of wax deposition on leading edge with different mainstream temperature.

Figure 15.
Photographs of wax deposition on windward surface with different mainstream temperatures.
Figure 15.
Photographs of wax deposition on windward surface with different mainstream temperatures.

Figure 16.
Photographs of wax deposition on lee surface with different mainstream temperatures.

Figure 17.
Deposition mass with different mainstream temperature.

Figure 18.
Capture efficiency with different mainstream temperature.


Table 1.
Operating parameter range and sensor accuracy.
| Mainstream Velocity (m/s) | Mainstream Temperature (°C) | Mainstream Velocity Measurement Error (%) | Mainstream Temperature Measurement Precision (°C) | Deposition Mass Measurement Precision (mg) | Surface Temperature Measurement Error (°C) |
|---|---|---|---|---|---|
| 5–40 | 25–95 | 2 | ±0.15 | 0.005 | ±0.5 |
Table 2.
Wax spray system working conditions.
| Particle Size (μm) | Wax Mass Flow Rate (g/min) | Wax Heating Temperature (°C) | Atomized Air Temperature °C) | Atomized Air Pressure (MPa) |
|---|---|---|---|---|
| 8–100 | 5–80 | 30–80 | 25–100 | 0.1–0.8 |
Table 3.
Test parameters for deposition testing.
| Case No. | Mainstream Velocity U∞ (m/s) | Mainstream Temperature T∞ (°C) | Test Time t (min) | Wax Volume Concentration c | AOA α (deg) |
|---|---|---|---|---|---|
| 1 | 10 | 40 | 5 | 4.21 × 10⁻⁷ | −5 |
| 2 | 15 | 40 | |||
| 3 | 20 | 40 | |||
| 4 | 25 | 40 | |||
| 5 | 30 | 40 | |||
| 6 | 10 | 32 | |||
| 7 | 10 | 37 | |||
| 8 | 10 | 44 | |||
| 9 | 10 | 48 |
Table 4.
Test results of the deposition mass.
| i | mdep (g) | (g) | σ (g) | (g) | (%) |
|---|---|---|---|---|---|
| 1 | 1.71 | 1.70 | 0.046 | 0.056 | 3.3 |
| 2 | 1.67 | ||||
| 3 | 1.66 | ||||
| 4 | 1.77 | ||||
| 5 | 1.67 |
© 2019 by the authors. Licensee MDPI, Basel, Switzerland. This article is an open access article distributed under the terms and conditions of the Creative Commons Attribution (CC BY) license (http://creativecommons.org/licenses/by/4.0/).
Share and Cite
MDPI and ACS Style
Zhang, F.; Liu, Z.; Liu, Z.; Liu, Y. Experimental Study of Particle Deposition on Surface at Different Mainstream Velocity and Temperature. Energies 2019, 12, 747. https://0-doi-org.brum.beds.ac.uk/10.3390/en12040747
AMA Style
Zhang F, Liu Z, Liu Z, Liu Y. Experimental Study of Particle Deposition on Surface at Different Mainstream Velocity and Temperature. Energies. 2019; 12(4):747. https://0-doi-org.brum.beds.ac.uk/10.3390/en12040747
Chicago/Turabian StyleZhang, Fei, Zhenxia Liu, Zhengang Liu, and Yanan Liu. 2019. "Experimental Study of Particle Deposition on Surface at Different Mainstream Velocity and Temperature" Energies 12, no. 4: 747. https://0-doi-org.brum.beds.ac.uk/10.3390/en12040747
Note that from the first issue of 2016, this journal uses article numbers instead of page numbers. See further details here.