Electricity Generation in India: Present State, Future Outlook and Policy Implications


1
Department of Geological Engineering, Faculty of Mining and Geology, VŠB-Technical University of Ostrava, 17. listopadu 15/2172, 708 00 Ostrava-Poruba, Czech Republic
2
ENET Centre, VŠB-Technical University of Ostrava, 17. listopadu 15/2172, 708 00 Ostrava-Poruba, Czech Republic
*
Author to whom correspondence should be addressed.
Energies 2019, 12(7), 1361; https://0-doi-org.brum.beds.ac.uk/10.3390/en12071361
Submission received: 18 February 2019
/
Revised: 28 March 2019
/
Accepted: 30 March 2019
/
Published: 9 April 2019
(This article belongs to the Special Issue Energy Policy and Policy Implications)
Abstract
:India is one of the fastest developing countries in the world. To sustain this growth, energy and electricity demands will increase. In 2015, of the 1337 TWh produced, 916 TWh were from fossil fuels. We prepared several models of electricity demand from 2015 to 2030, based on publicly available datasets and trends. Models were tested on data from previous years and adjusted accordingly. From several scenarios, we decided to introduce two possibilities, i.e., a scenario using high energy savings in all sectors, and a scenario counting on a high industrial growth not supported by an equal increase of electricity savings. For both cases we prepared models for extreme situations: (1) where coal- and lignite-based power plants are preferred after slow-down of a renewable energy boom, and (2) with high utilization of renewable energy supported by natural gas and nuclear energy. With GDP and population increasing at the same rate as in previous years, the unambiguous result in all scenarios is a 2 to 3-fold increase of the electricity demand by 2030. On the electricity production side, all scenarios stress the role of coal, renewables and nuclear sources. Both energy and climate policies should be prepared for such a development in advance.
1. Introduction
Electricity infrastructure and production are important for a developing economy like that of India, which with a population of 1.2 billion and an area of 3.29 million km2, is the 7th largest country in the world. With a GDP of US$ 2.3 trillion in 2015 and an average GDP growth of 7% per year [1], the growth of the electricity sector will be important to sustain the economic output of the country. Total electricity generation in India during 2015 was 1300 TWh from both utilities and non-utilities [2]. In 2013, the electricity consumption from all sectors was 824 TWh [3], and with an average growth rate of 9%, and it was estimated to be approximately 980 TWh in 2015. The electrical network suffers from transmission losses of approximately 25%.
In 2015, per capita electricity consumption was 746 kWh [2]. Since per capita electricity consumption has a positive relation with GDP per capita (e.g., [4,5,6]), it can be used as a standard for judging the stage of economic development. Most countries with a GDP per capita of more than US$ 10,000 have an electricity consumption of more than 4500 kWh per capita [7,8]. There are few exceptions to this case, depending on the structure of the economy in that country [9]. It can be expected that with the growth of the Indian economy, the GDP per capita will improve, and hence, there will be a need for more electricity in the future.
In this regard, forecasting the electricity demand is vital, as it can help the decision makers to keep up with the pace of the growing demands of the economy and to reduce power outages. The long-range energy alternative planning, referred to as LEAP [10], is a tool that is used to forecast energy demand and supply from various scenarios and can also be used for climate change mitigation assessment (see electronic Supplemetary Materials). LEAP has been used for the Indian scenario for different cases and levels. Kale and Pohekar [11] studied the demand and supply scenarios for the state of Maharashtra, while the Indo-German Centre for Sustainability published a document that used LEAP for studying the greenhouse emissions of the country. LEAP was also used in other countries such as Panama where investigators applied LEAP to promote wind power to the Panama electricity mix [12]. Additionally, in Taiwan, LEAP was utilized to study the energy scenario where its energy requirements are met mostly by imports [13].
This study will focus on the electricity supply and demand in India. Access to the electricity, which was 84.5% in 2016 [14], is not only a social, but also a political problem. Foreseen 100% electrification (demand side) will increase the stress on the supply chain. It is not clear whether the Indian government will prefer an increase of domestic energy/electricity sources, which would be the most preferred electricity mix, and how that will comply with recent developments and policy initiatives for climate change mitigation. In our study, we would like to bring attention to such crucial questions. By set of future electricity generation mix models we have tried to show outline of possible future developments and basic problems they might bring.
2. Electricity Generation in India
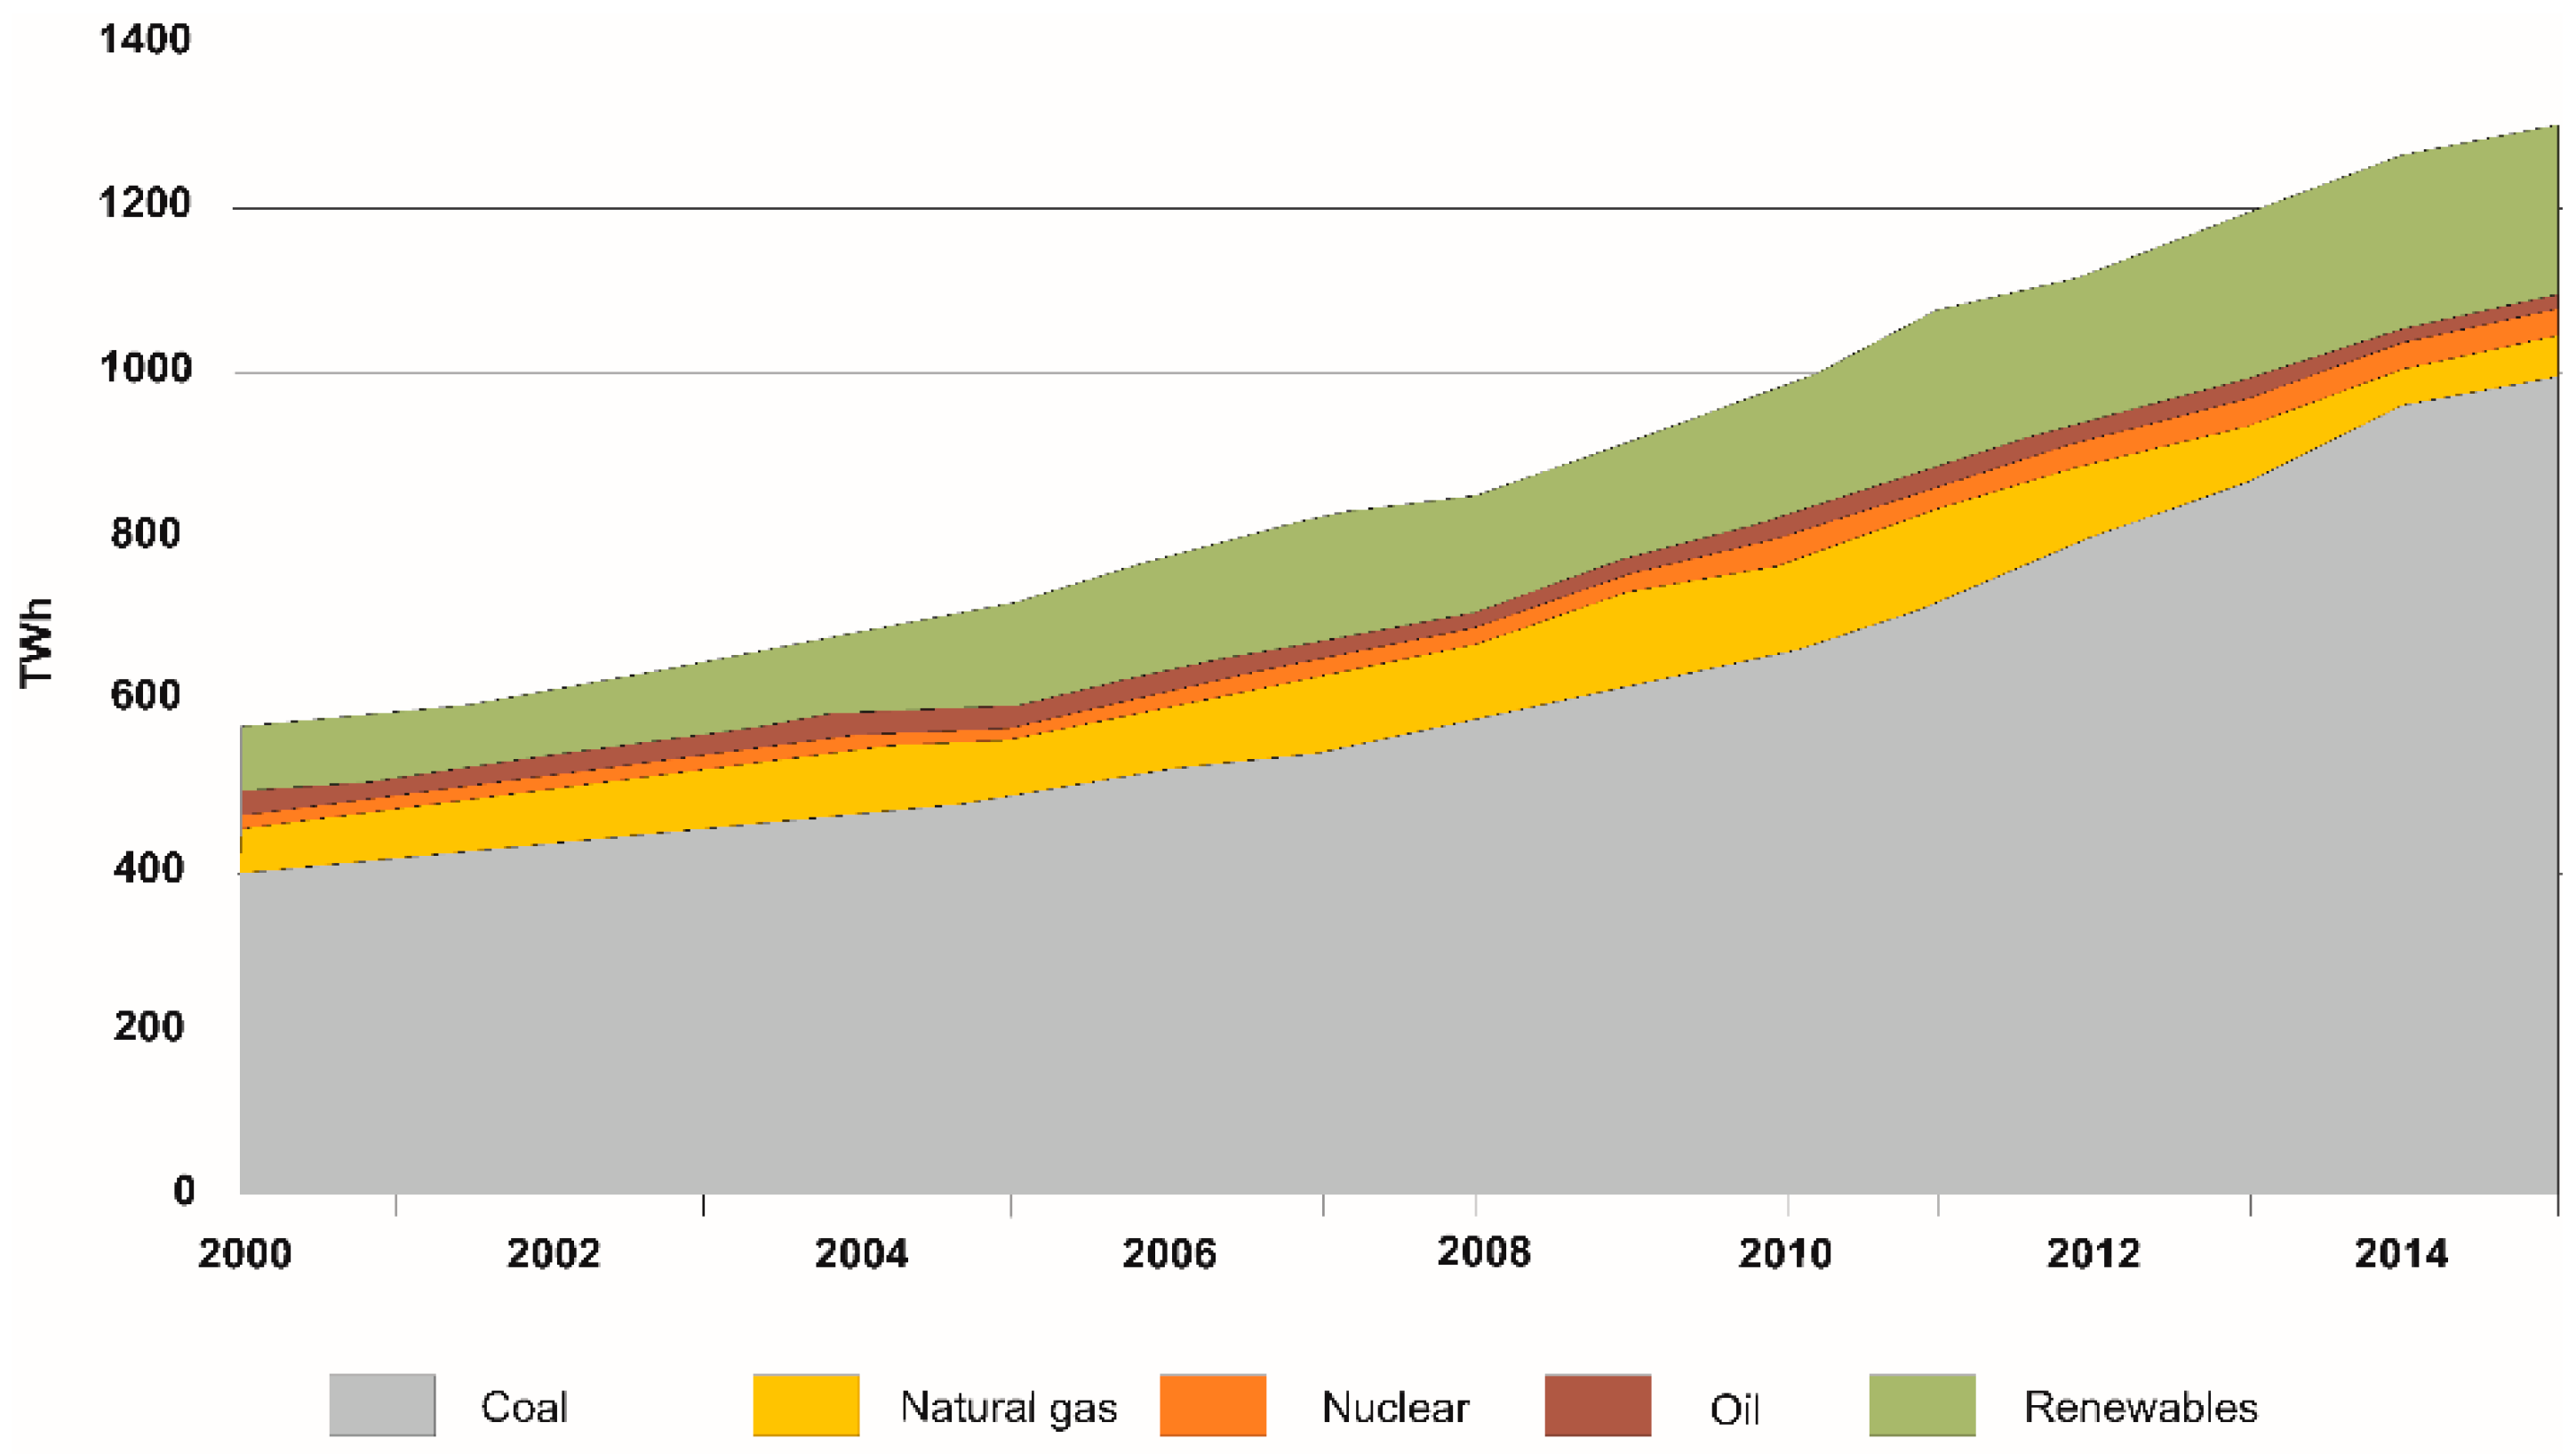
Electricity production in India is mostly achieved through coal thermal power plants (Figure 1). Although there have been efforts to diversify the options, particularly in the case of renewable energies, coal remains the dominant source of electricity in the country. Since 2000, the share of electricity production from coal has been slowly increasing; it was 68% at the start of the millennium and has increased to 73% in 2013. The percentual shares of all other energy sources, except renewables, have decreased during that time, [14].
In 2015, India generated a total of 1078 TWh from coal, natural gas, oil, nuclear and hydropower sources [2]. Renewable and alternative electricity in the form of solar, wind, biomass and small hydropower (less than 25 MW) plants are also making big progress. These types of electricity source were estimated to generate approximately 70 TWh of electricity in 2015. Non-utilities or independent power producers have also been growing at a rate of 9% over the years [3], and it was estimated that they produced approximately 185 TWh in 2015. India also imported some electricity from Bhutan in 2015 (5 TWh) to satisfy its demand.
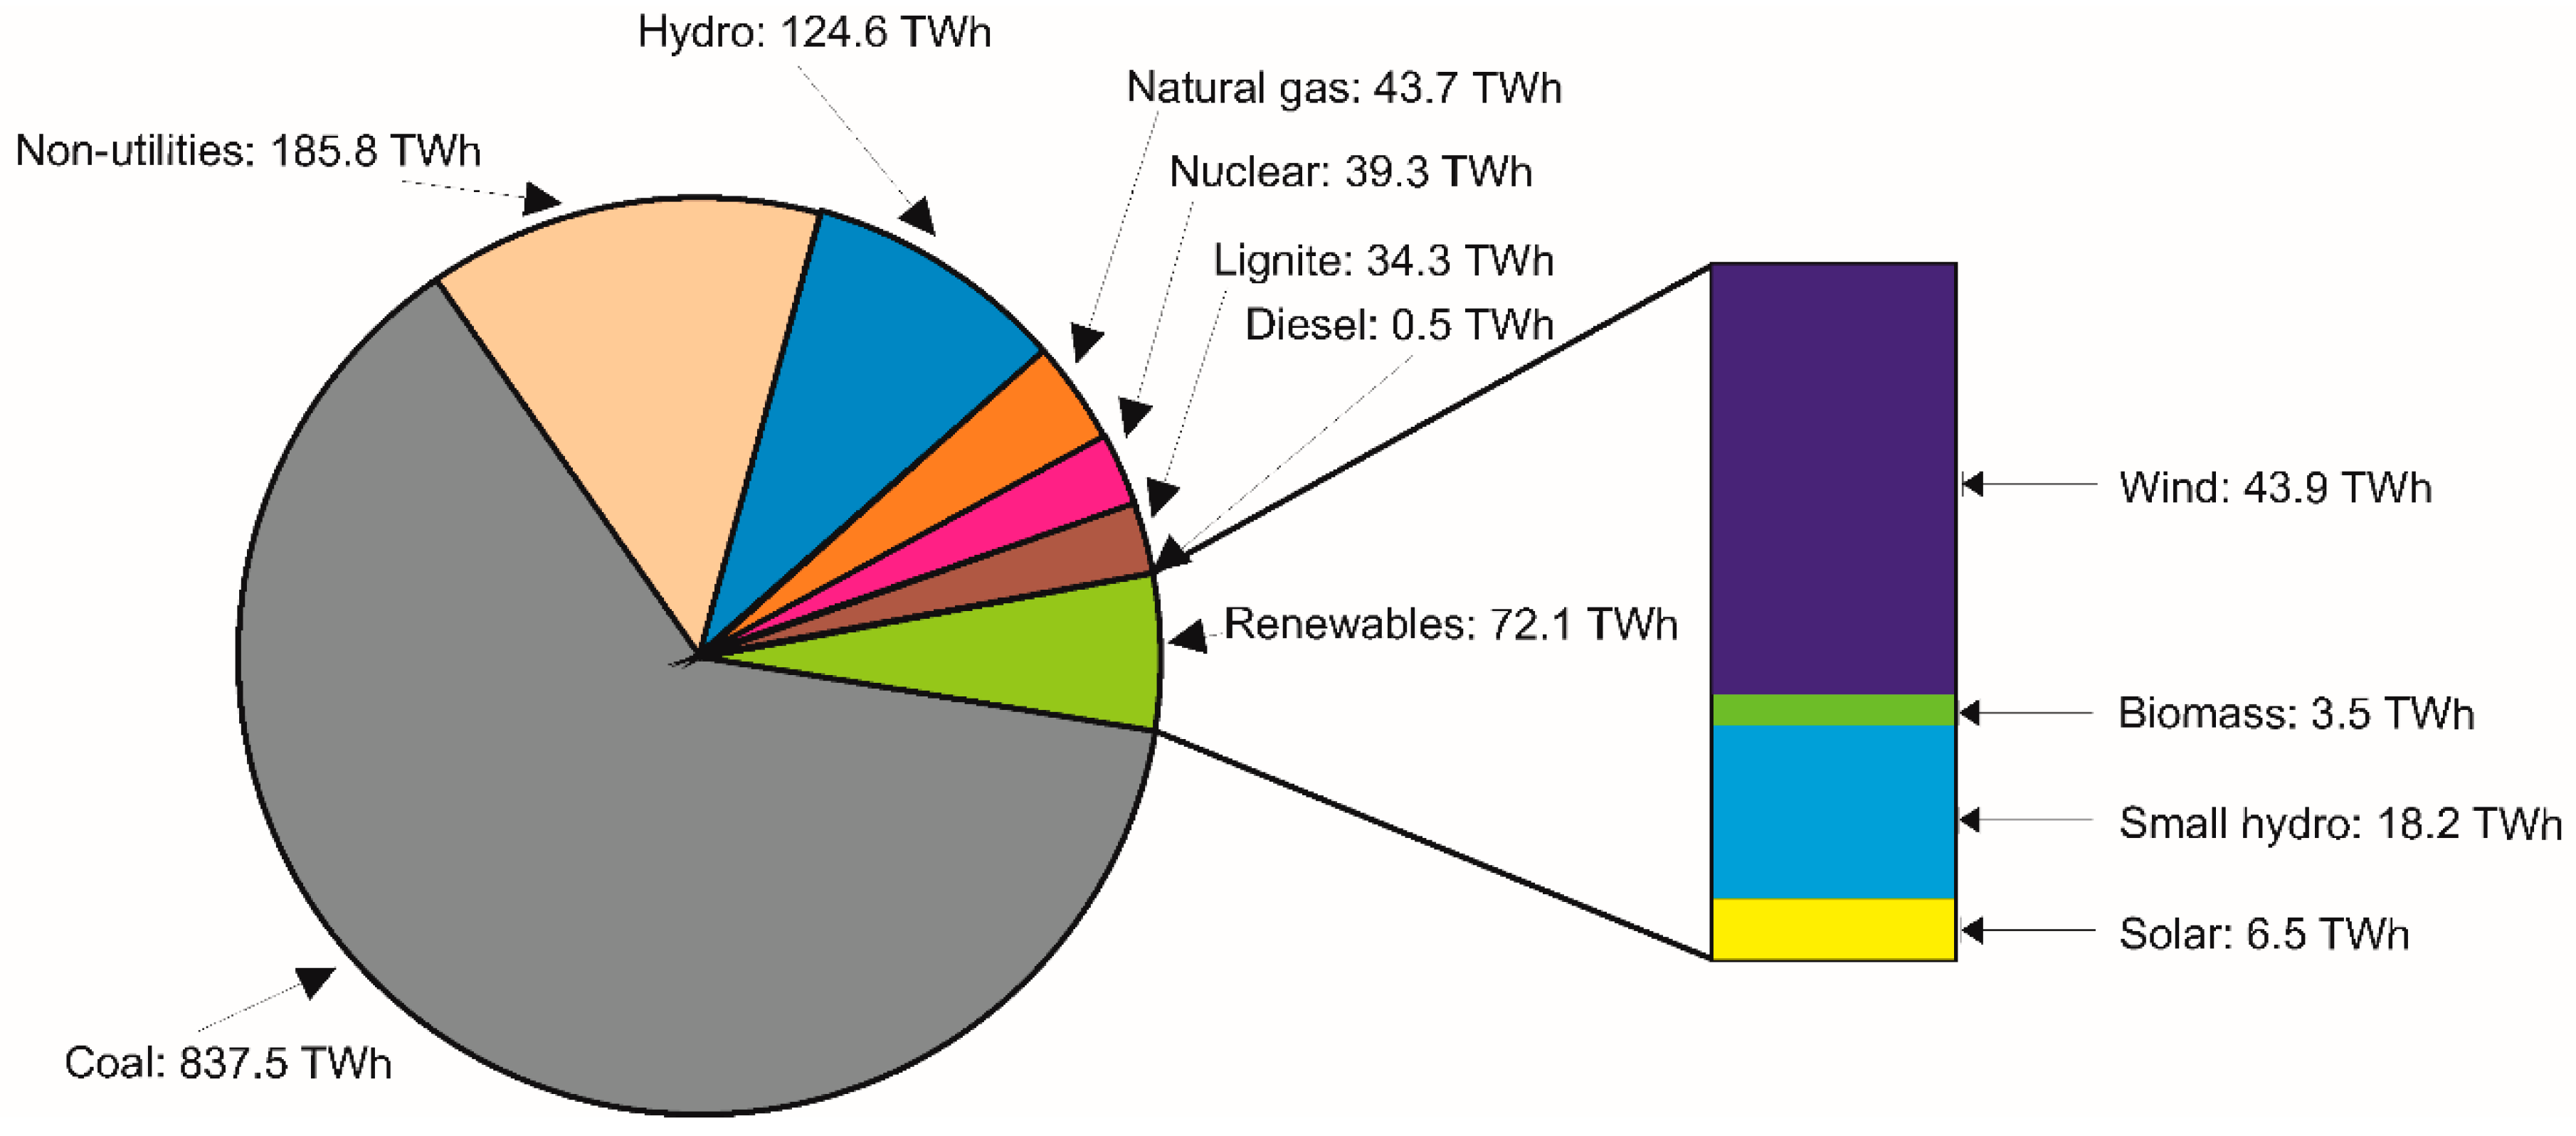
As mentioned, the bulk of the production comes from coal power plants that produced 840 TWh in 2015 (Figure 2), which is 63% of the total production, followed by non-utilities (185 TWh) and hydropower (125 TWh, excluding small hydro). Nuclear, natural gas, lignite and oil also contributed 38 TWh, 44 TWh, 34 TWh and 500 GWh, respectively, to electricity generation. Renewable sources were estimated to contribute to 70 TWh of electricity in 2015. Currently, most of the renewable electricity generation is from wind energy (e.g., [15,16,17,18]) and small hydropower plants (e.g., [19,20]). India is also keen on developing its renewable sources (e.g., [21,22,23,24,25,26,27,28,29]).
In India, coal satisfies 70% of the total demand that is mostly used in the power sector [30], and with India having the 5th largest coal reserves in the world, it has proven to be the most economical form of energy and electricity in India. Considering an increase in coal production of 5% each year, the coal reserves are expected to last for another 40–50 years [31]. The World Institute of Sustainable Energy prepared a research report for coal electricity in India and predicted that the total coal power plant capacity by the end of 2032 would be 400 TW if coal-based power plants are favored or 220 TW if renewable energy and gas are favored [31].
However, the oil supply situation is not so favorable. At the current levels of production, the domestic oil sources will last for another 23 years. However, the electricity structure as discussed does not heavily depend on oil. The share for natural gas, however, has been slowly increasing over the years due to the discovery of new gas fields, the incorporation of coal bed methane (CBM) and government interest in the exploration and production of CBM [32].
Uranium ores are of very low quality in India (average grade as low as 0.1%), which makes production and extraction of indigenous ores 2–3 times more costly compared to international supplies [31]. The import of uranium, however, is not an easy task because international trade is governed by the guidelines of the nuclear suppliers group (NSG), and the guidelines did not permit the sale of uranium to India. However, because of policy initiatives from India, NSG guidelines were relaxed in 2008 [33]. As a result, India has imported uranium and used it to fuel their nuclear power plants and this in turn improved the capacity factors of the power plants [34,35]. Despite the difficulties with low quality local supplies, India is promoting the use of nuclear energy for energy security as well as environmental benefits [36].
India is also focusing greatly on renewable energy. It was estimated that India can produce up to an 84,000 MW capacity for hydroelectricity at 60% load factors. The government also plans to accelerate a hydro development plan, where it aims to build 50,000 MW of new capacity by 2026 (roughly the end of the 14th Five-Year Plan), which is mostly concentrated in the southern part of the country [31]. A “Solar Alliance” was also announced at the Climate Summit meeting in Paris 2015, which aims to expand its renewable generating capacity to 175 GW by 2022. As the name suggests, India will develop its solar energy and plans to have 100 GW capacities by 2022. The remainder of the capacity would be distributed among wind, biomass and small hydropower plants [36,37] (NRDC, 2016; National Action Plan on Climate Change, 2008).
3. Electricity Demand in India
India’s electricity consumption was 980 TWh in 2015 [2] and has been increasing at an average rate of 8.84% [3]. Electricity consumption is highest in the industrial sector (Figure 3), which in 2015, was estimated to consume 450 TWh (46%) and shows the highest growth in electricity consumption (11%). Some of the most important industries for the Indian economy are the steel industry; aluminum industry; cement industry; petroleum industry; pulp and paper industry; fertilizer industry; micro, small and medium enterprises and other industries (they are listed as important because each of them have their own ministry). Crude steel production in India in 2015 was 89 million tons [38], and there has been a gradual trend in decreasing energy intensity per ton of crude steel produced. From an average of 6.3 GCal (26.36 TJ) in 2013, the strategic goal is 4.5 GCal (18.83 TJ) per metric ton of crude steel by 2025-26 [39]. The aluminum production in India was 2.36 million tons [40], and the electricity intensity per ton produced was estimated to be approximately 14,000–17,000 kWh [41]. Cement production in India was 300 million tons in 2015 [42], and the electricity intensity per ton was 80 kWh [41].
The petroleum industry is one of the largest industries in India, producing 221 million tons of various petroleum products [43]. India’s oil refining capacity is 5th in the world behind the United States of America, China, Russia and Japan. India’s specific energy consumption per ton of production is also improving from 76.4 MBTU/BBL in 2006 to 70.7 MBTU/BBL in 2008 [44]. The pulp and paper production in India was approximately 7 million tons in 2010 and is showing a growth rate of 8.1%. Most of the energy used in this industry is in the form of process heat, and approximately 25% of the power comes from electricity. Electricity consumption varies from 1200–2200 kWh/ton of paper [41]. Fertilizer production in India was 32.5 million tons in 2013 [45]. This industry is an energy-efficient sector consuming approximately 29 GJ/Mt owing to the best practices adopted in gas-based plants [41]. Approximately 80% of the energy used was in the form of natural gas and crude oil [46].
Micro, small and medium enterprises (MSMEs) form the backbone of the Indian manufacturing economy, contributing to approximately 8.7% of the GDP. These enterprises account for 45% of the manufacturing output and 40% of exports. The independent nature of this sector makes it free from outside control and decision making. The energy consumed by this sector was estimated to be ca. 275 TJ based on a survey of 43 enterprises [41].
In 2015, the domestic sector was estimated to consume 213 TWh [3] and is currently the 2nd highest consumer. This is to be expected with India’s high population. In 2011, there were a total of 240 million households in India in the domestic sector, of which 67% are in the rural sector. There has been a larger increase in households in the urban sector compared to the rural sector, which can be attributed to rapid urbanization and people moving from rural areas to urban areas [47]. In 2011, 55% of rural households were electrified compared to 93% of households in the urban sector. Therefore, is makes no sense to compare India with elasticities of electricity demand of developed countries such as U.S. [48,49], G7 countries [50] or Australia [51]. These data indicate that there is still a large portion of the population without access to electricity, especially in rural areas. With India adopting rural electrification programs such as the “Deendayal Upadhyaya Gram Jyoti Yojana” [52], which aims to achieve a 100% electrification rate for rural areas, the electricity consumption from the domestic sector would increase solely due to the fact that new household are being electrified. However, the consumption of electricity from this sector depends on the income level of the residents [53]. Higher income residents would have more amenities, such as televisions, computers, and refrigerators, which would result in more electricity consumption. Such trends were reported from other rapidly growing developing countries, such as Taiwan [54], Turkey [55], or Greece [56]. NSS 68th Round (July 2011–June 2012) made a nationwide survey of amenities used by different household across all the states and reported the findings [57]. As expected, the urban population had more access to modern conveniences, such as televisions. In a report by the Global Buildings Performance Network [58], the annual electricity consumption per household will increase to 2750 kWh by 2050. It was also reported that consumption can be reduced by more than half with the help of better data, policy roadmaps and a residential building energy code [58].
The agriculture sector was estimated to consume 167 TWh in 2015 and is the 3rd highest consumer with a 17% share [3]. India has 125 million hectares of land used for agriculture [59], and approximately 50% of the land is irrigated. Since 1991, the land use for agriculture remained roughly the same, while electricity consumption increased over the same period. This increase may be due to the increasing use of irrigation over agricultural lands to provide better yields (which has improved almost 2-fold per hectare since 1991).
In 2015, the commercial sector was estimated to consume 86 TWh of electricity. This sector is the 4th highest consumer (9%), but the electricity consumption in this sector is increasing at a higher rate (8.82%) compared to those of the domestic (7.89%) and agricultural (6.59%) sectors [3]. Total commercial floor space was estimated to be 660 million square meters in 2010 [60] and is experiencing an average growth of 5% every year. The commercial sector ranges from wholesale trade to public administrative buildings to buildings used for education and hospitals. USAID ECO-III Project [60] also estimated the electricity intensity per square meter for every sector under the commercial category.
The railways sector was estimated to consume 15.5 TWh in 2015 [3]. In 2012, passenger kilometers travelled were 1000 billion km, while freight traffic was 975 million km. Out of this, 50% was through electrified trains (both goods and passenger trains) [61]. Finally, the remainder of electricity consumption was from other unorganized sectors, and it was estimated that they consumed 46 TWh in 2015 [3] and have an average annual growth of 4.75%.
4. Methodology: LEAP Modelling
For the demand of electricity, the LEAP model was divided into: Industrial sector, Domestic sector, Agricultural sector, Commercial sector and others (see electronic Supplemetary Materials). For each sector, the electricity demand was measured using data related to their sector and supported by external variables like GDP and population. For the industrial sector, electricity demand was measured by using their production rates and the electricity/energy intensity per ton of material produced. For domestic sector, the electricity demand was measured from number of households and electricity consumption per house (using data from National Sample Office [57]).
For agriculture, we took the historical trend of increasing electricity consumption in this sector and for commercial sector, we took data from ECO-III [60] to make projections in commercial floor spaces in India and using the electricity intensity per sq. m, we measured the electricity demand for this sector (section Electricity demand in India). For the transformation and generation side, losses were incorporated into the model as well as the electricity-generating plants in India, namely, Coal Lignite, etc.
External factors such as the GDP and population that are needed for LEAP calculations were assumed to increase at a rate of 8% and 1.3%, respectively. International Monetary Fund expects GDP growth 7.5% and 7.7% in financial years 2020 and 2021 [62], 7.8% up to 2020 according to PwC [63]. Longer-time economic forecasts are considered to be problematic [64]. Indian population growth figures range significantly according to various sources—from 1.1% [65] per 1.17% [66] to 1.62% [67]. The steel, aluminum, cement, petroleum, pulp and paper and fertilizer industry growth rates were all based on historical rates, and their respective electricity consumption was based on kWh per ton of production. The information for kWh per ton of production was discussed earlier. The MSME sector was assumed to grow as fast as the economy (8.72% of the GDP).
Domestic households were projected to increase as much as the population (Elasticity = 1), and the rural share of households was expected to be approximately 50% by the end of 2030. Electricity consumption at the domestic level depends on the extent of electrification of households and possession of amenities. In 2015, electrified houses in the rural sector were approximately 70% and the percentage in the urban sector was assumed to be 100%. Access to household appliances depends on the income level of the household (or for simplification GDP per capita), and the average electricity usage from these appliances provides the total domestic consumption of electricity. According to the National Sample Office [57], the data was broken down into individual states with urban and rural populations. In the scenarios, it is assumed that 100% electrification rate would be possible by 2022. Commercial floor space was projected to increase at an annual rate of 5% [60]. Electricity consumption was calculated by kWh used per square meter of the commercial space. Most of the data used for this exercise came from the USAID ECO-III Project [60] estimates for commercial spaces and electricity usage.
The total land use for agriculture was not expected to rise or fall (general historical trend), but the land under irrigation and the electricity usage per hectare of land has been slowly increasing. Going with the historical trend, the electricity per hectare of land used is expected to increase at 5% annually. The total usage in the transportation sector increases with the GDP, while the percentage of electrified vehicles is assumed to increase to 75% of the total km travelled. Growth from other sectors was assumed to grow at 7% (historical rates).
There are several scenarios set. One is a conventional scenario where coal- and lignite-based power plants have the most preferences, whereas another is a renewable scenario where renewable energy and nuclear energy are preferred. From the point of view of demand, the model is set up to check the effects of how investments are used. Whether investments are used to expand the capacity of industrial output thereby increasing the production from industry or whether they are used for the research and development of energy-saving solutions. From the domestic and commercial side, the adoption of more ecofriendly or green buildings can help in total electricity consumption in this sector in the future. The Ministry of New and Renewable Energy has implemented a scheme regarding “Energy Efficient Solar/Green Buildings” [68], which aims to promote the widespread construction of energy-efficient solar/green buildings in the country through a combination of financial and promotional incentives. Green buildings help reduce the total electricity consumption by approximately 25% [69]. In India the goal is 30 to 40% of energy savings on energy used for lighting and air conditioning according to the official sources [68]. In summary, the following scenarios were used for testing:
High Renewable and Gas production (HRG): This topic focuses on the generation of electricity. More emphasis has been on the generation of electricity from renewable sources as well as nuclear energy and natural gas. In this scenario, the expansion of the electricity infrastructure from the point of view of renewables is as much as the levels expected in 2022 (175 TW capacity is expected by that time). In other words, the growth of renewables does not slow down even after 2022. In case there is shortage of electricity supply, coal- and lignite-based power plants will be set up by the model.
Low Renewable and Gas production (LRG): Again, focusing on the generation of electricity from LRG is preferred to coal- and lignite-based power plants. In this scenario, the growth of renewables after 2022 has slowed down and the shortage of supply is handled by coal- and lignite-based plants. Additionally, note that nuclear, natural gas and non-utilities power plants are also added as needed by both scenarios.
Energy Saving-Industrial, commercial and domestic sector (ES): This sector is from the point of view of the demand of electricity. In this scenario, it is assumed that investments are used to provide more energy-efficient solutions to industry, such as smart systems [70] or motivation for energy service companies, at the cost of expanding the capacity infrastructure. The attractiveness of green buildings to the domestic and commercial sectors is also considered in this scenario.
High Growth of industry (HG): In this scenario, most of the investments are used to expand the infrastructure of industrial production, while few investments are placed into energy savings. This scenario also mimics the “Make in India” initiative, which encourages multinational and domestic companies to manufacture their products in India. This scenario was chosen because showing one of the possible extremes, i.e., high-growth not supported by the energy savings at the similar level.
5. Results
5.1. Electricity Demand
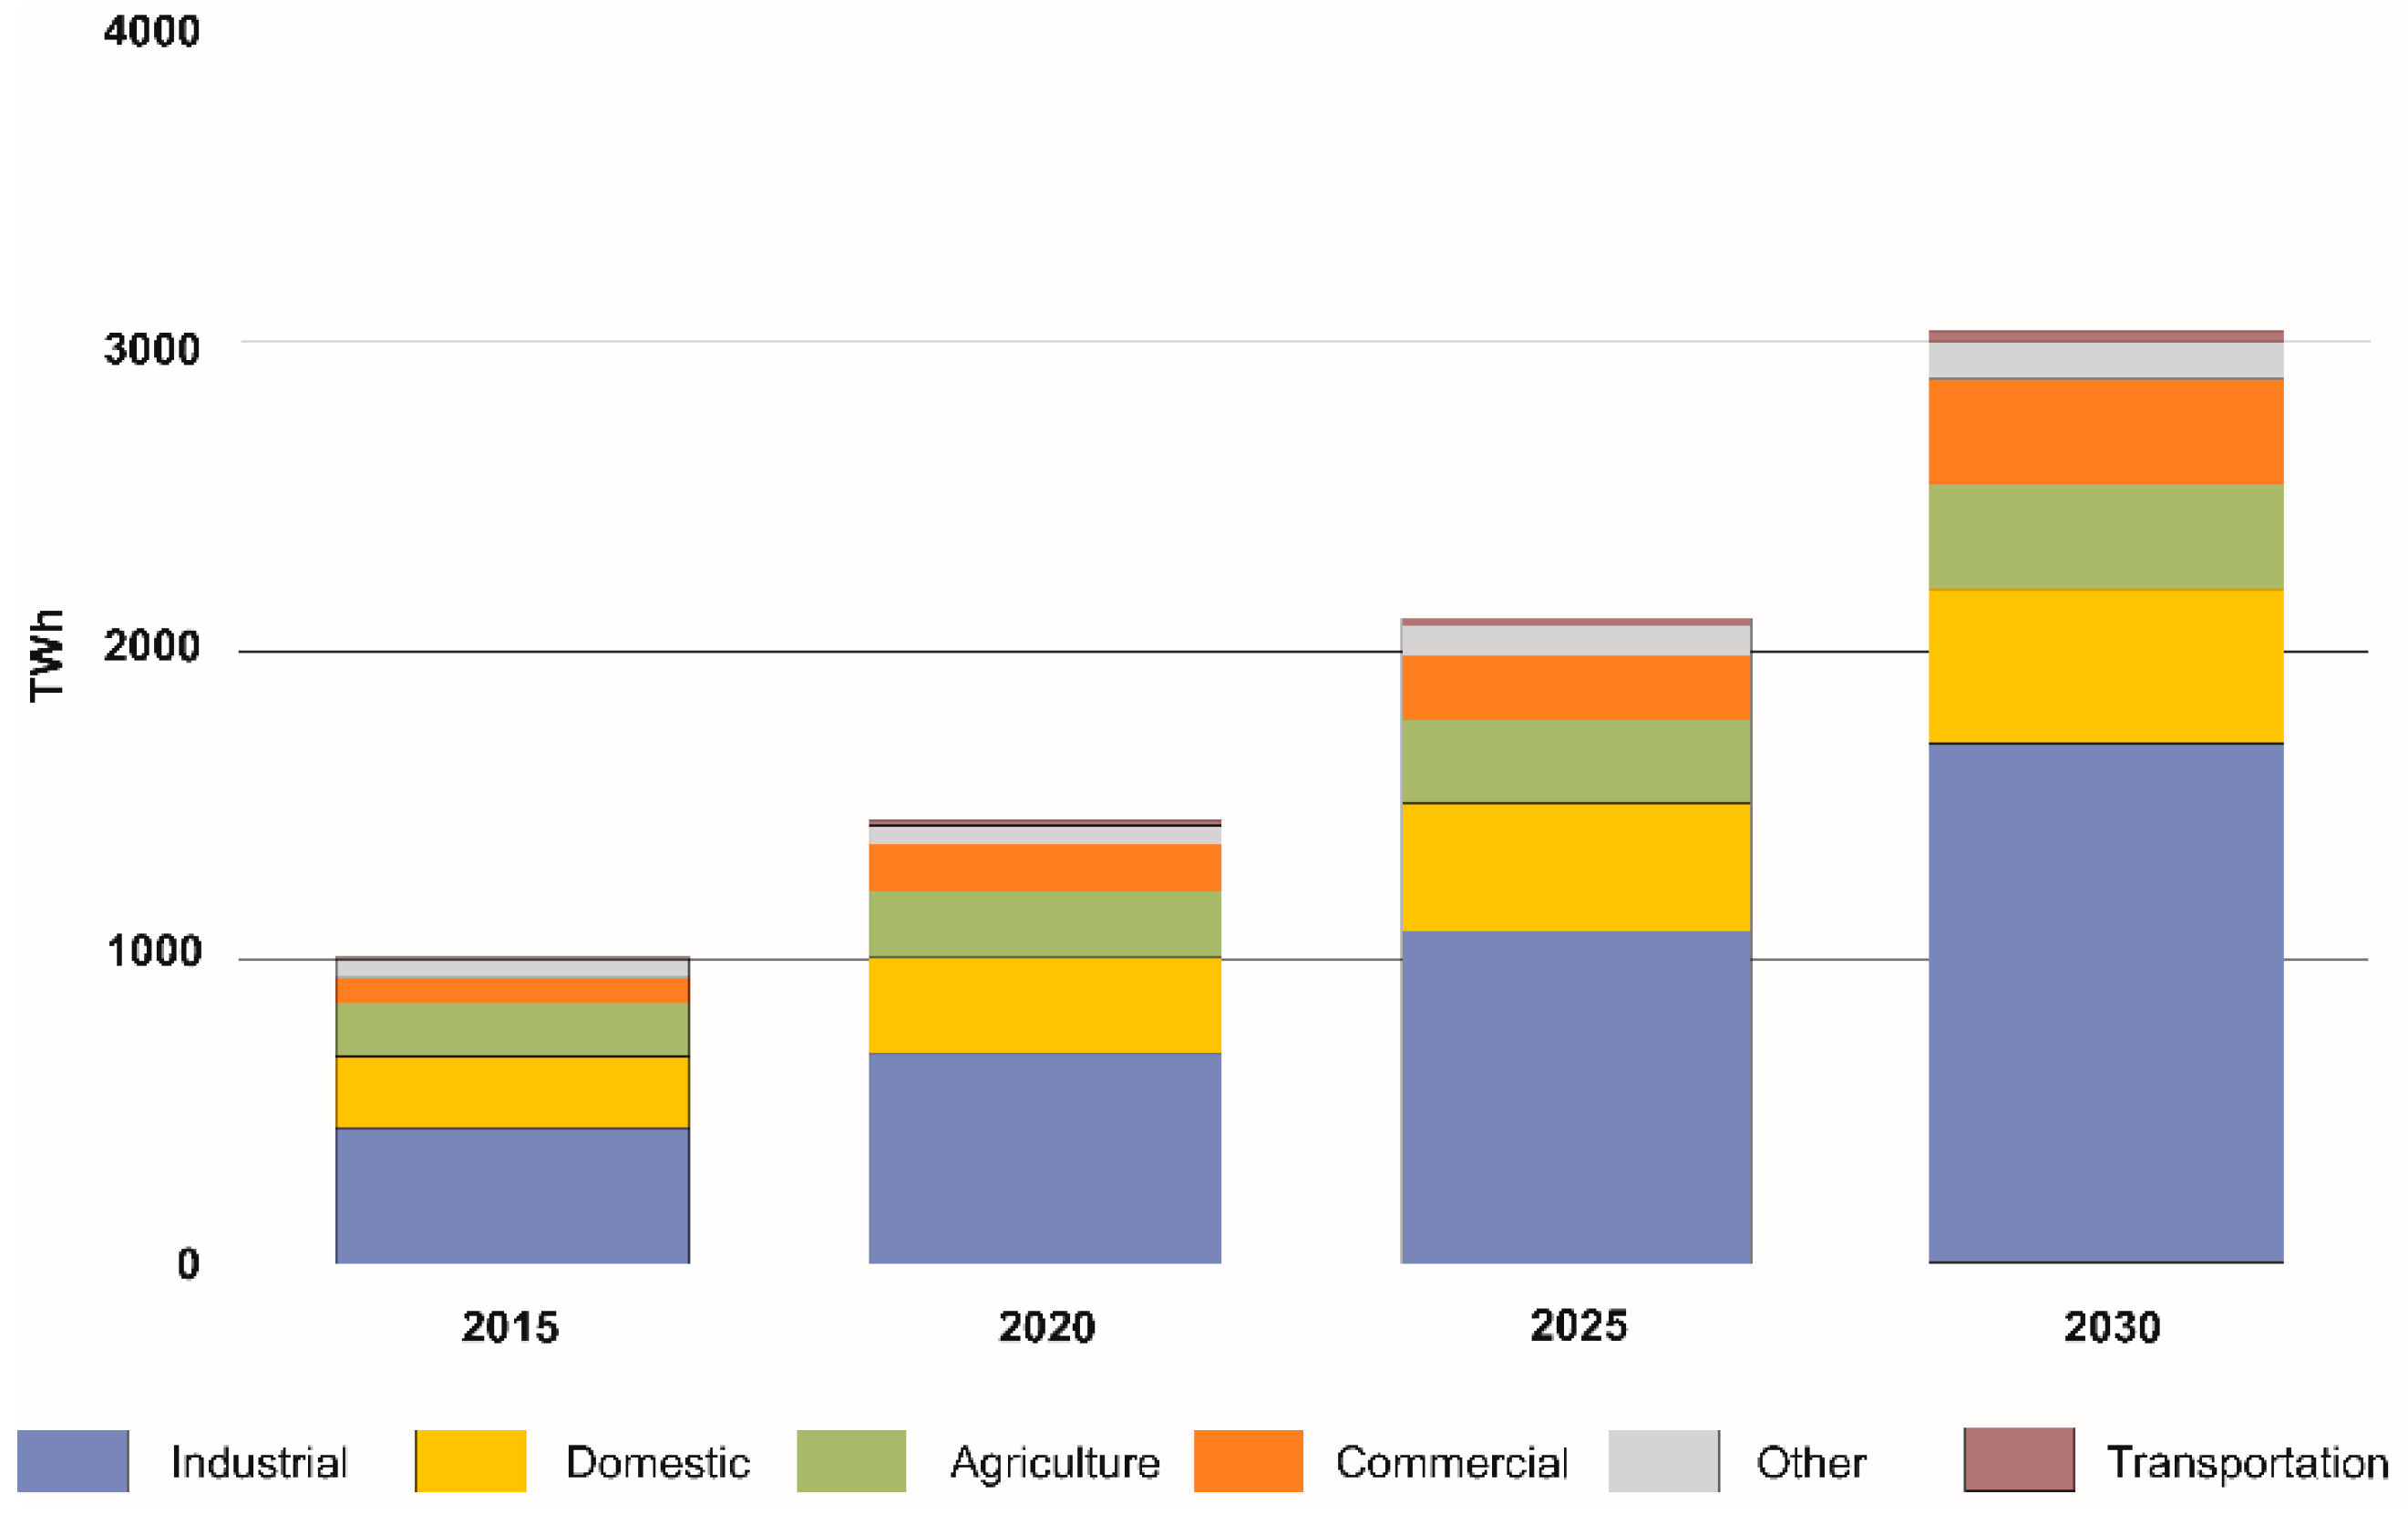
As expected, the high growth of industry shows a large number of electricity requirements from the industrial sector. All industries were assumed to grow at a slightly higher pace than the historical rates, while the electricity intensity per ton of production stayed relatively the same. Figure 4 and Figure 5 represent the demand for electricity from the different sectors to 2030 in this scenario. Industrial demand for electricity is expected to grow nearly three times compared to 2015.
All other sectors also experience growth of nearly two times compared to 2015. In the domestic sector, the growth is attributed to the rise in population and income levels of the residents. Commercial sectors grow because of expanding commercial floor space and the intensity of electricity usage per square meter. This sector shows higher growth than the agriculture sector, and these two sectors also consume the same amount of electricity by 2030.
In summary, LEAP shows that the total electricity consumption is expected to increase from 1000 TWh in 2015 to 3000 TWh in 2030. In 2030, industrial demand rises to 1700 TWh; the domestic demand rises to 490 TWh; the agricultural demand increases to 350 TWh; the commercial demand rises to 340 TWh; the transportation demand rises to 30 TWh; and the other sectors increase to 140 TWh.
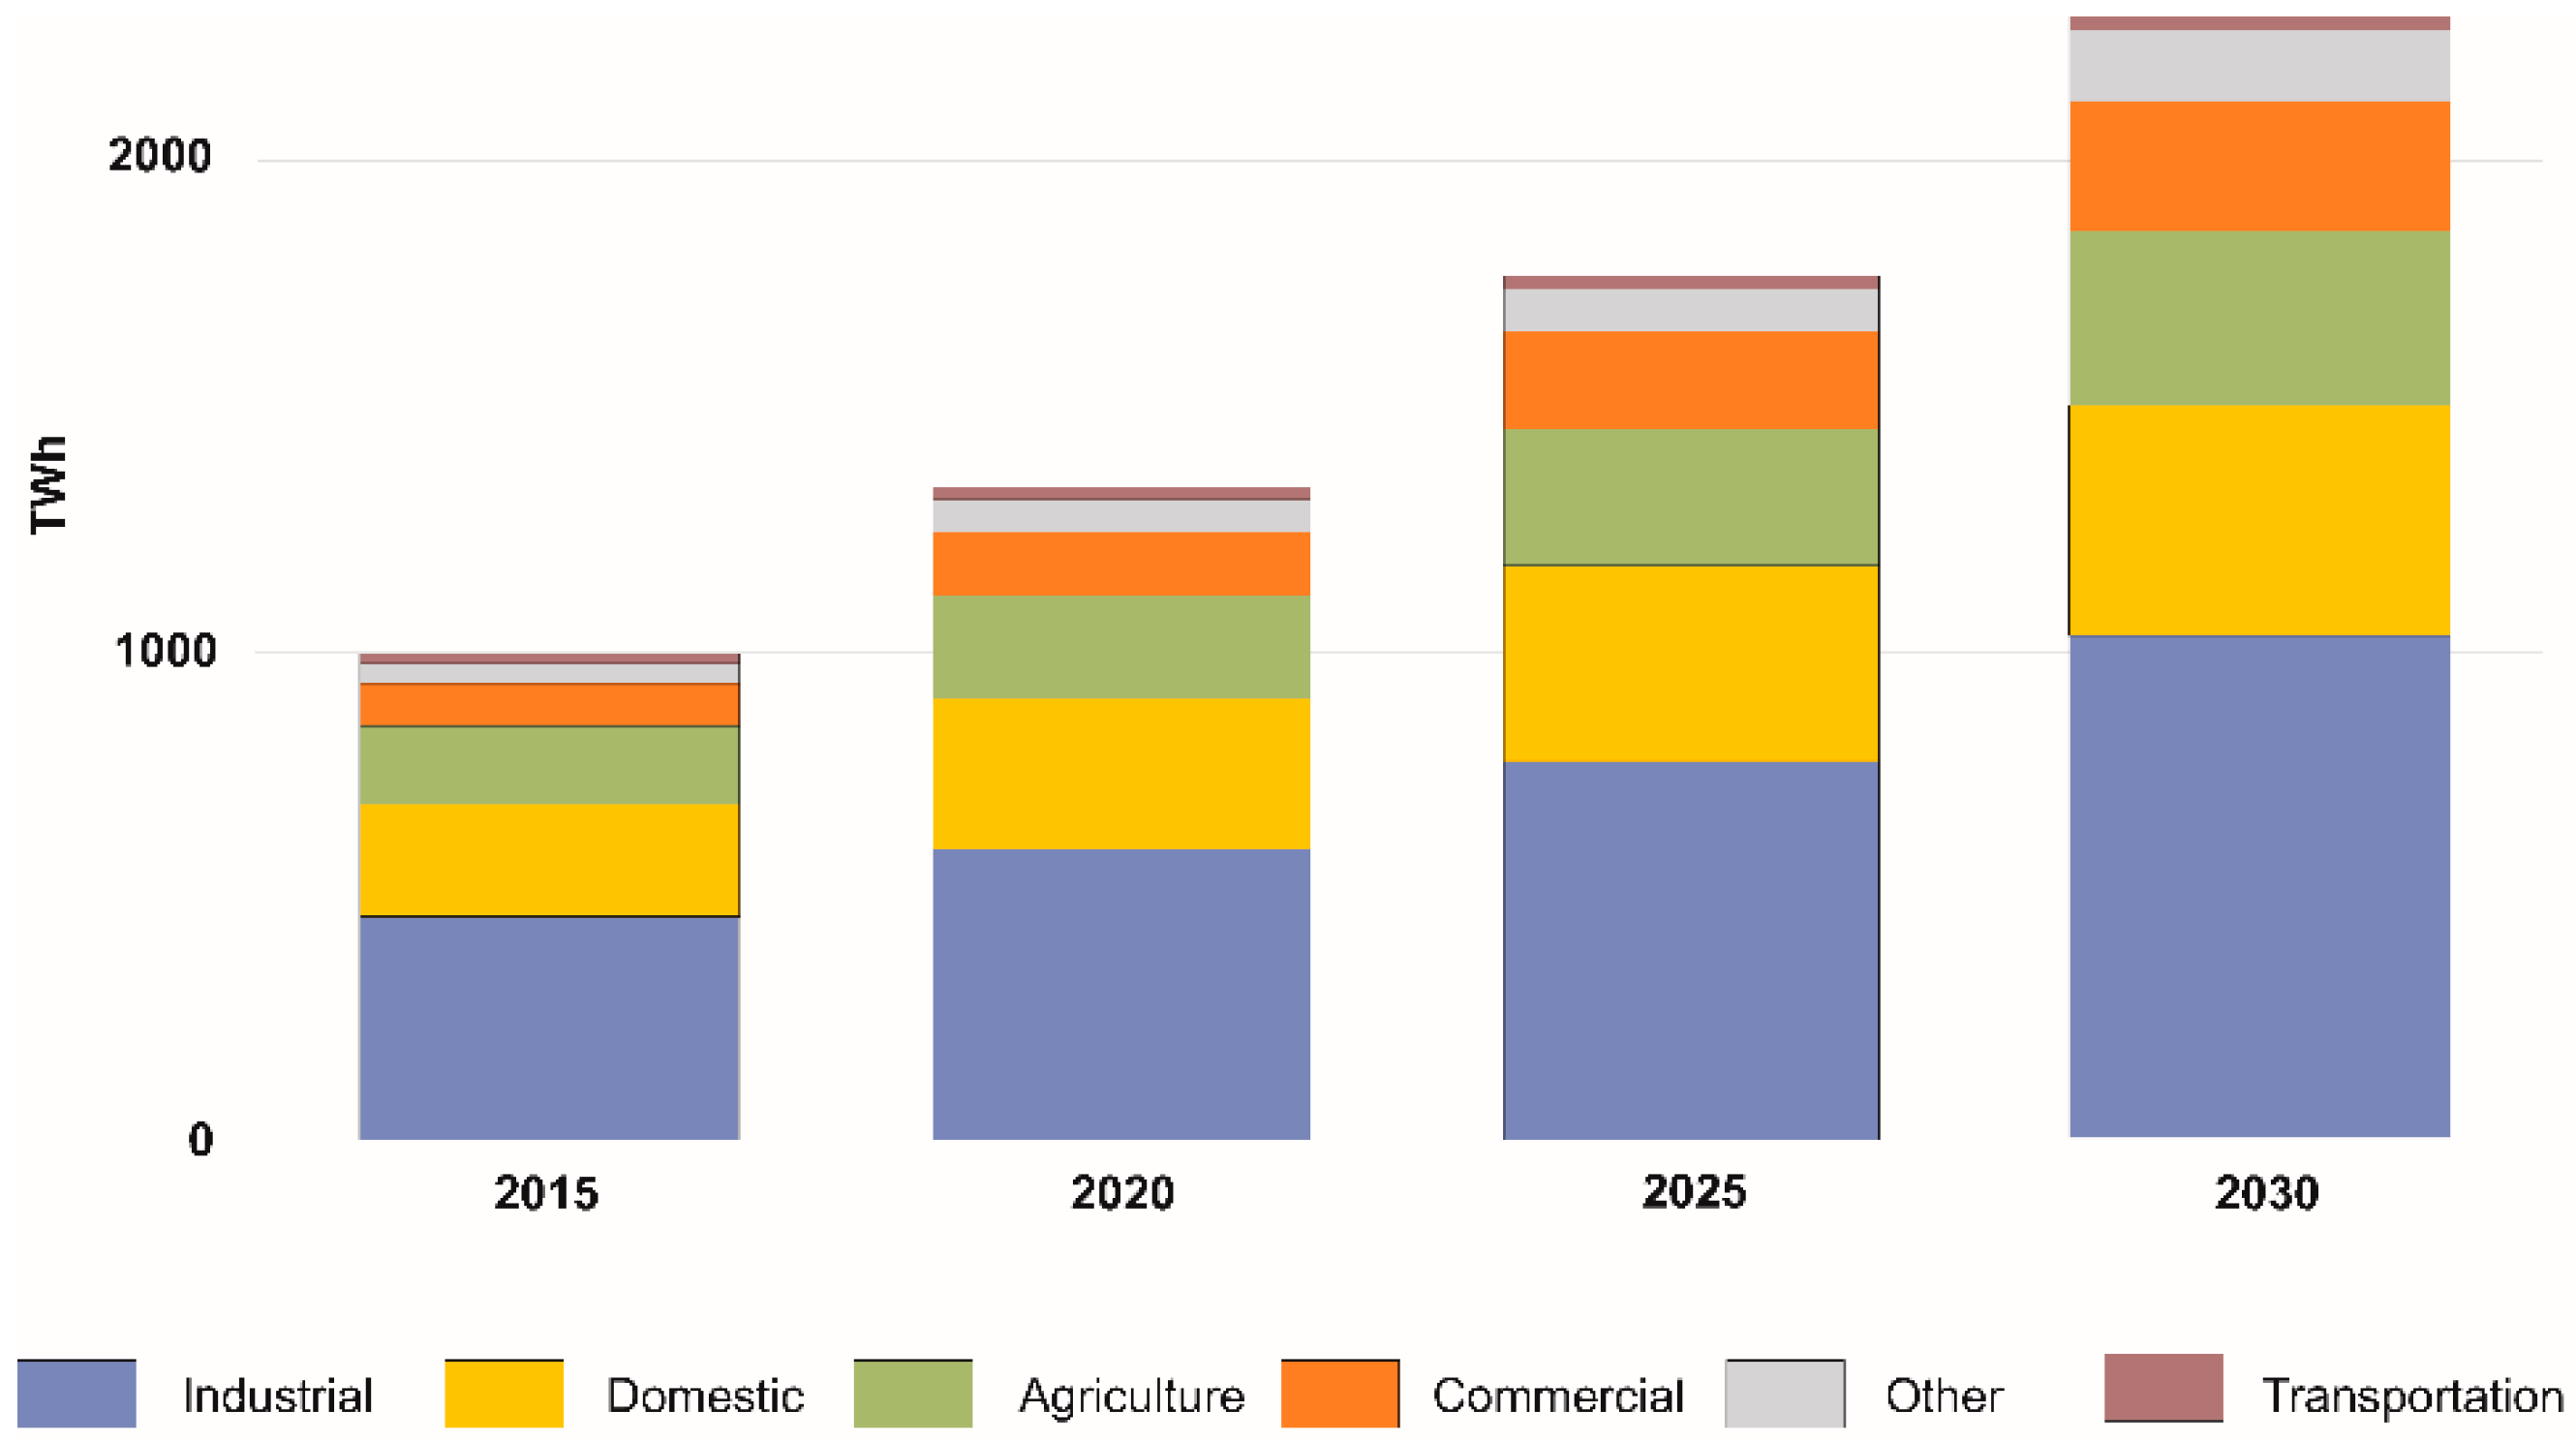
The energy saving scenario (Figure 5) in LEAP shows that the total electricity consumption from all sectors increases from approximately 1000 TWh in 2015 to 2300 TWh in 2030. The reduction in the consumption of electricity is mostly because of the energy saving options used by the industry and its slightly lower growth rate compared to the earlier scenario. Industrial demand rises by approximately a factor of 2 in this scenario from 450 TWh in 2015 to 1000 TWh in 2030.
The commercial sectors also experience many potential electricity savings in this scenario and a slight decrease in the domestic sector. This savings (input to the models) can be attributed to the expected rise in popularity of green buildings in India that have electrical savings of approximately 25% plus other energy-saving benefits. The domestic sector decreased only slightly because of the ongoing rural electrification program and the government’s priority to have a 100% electrification rate, especially in rural areas.
5.2. Electricity Generation
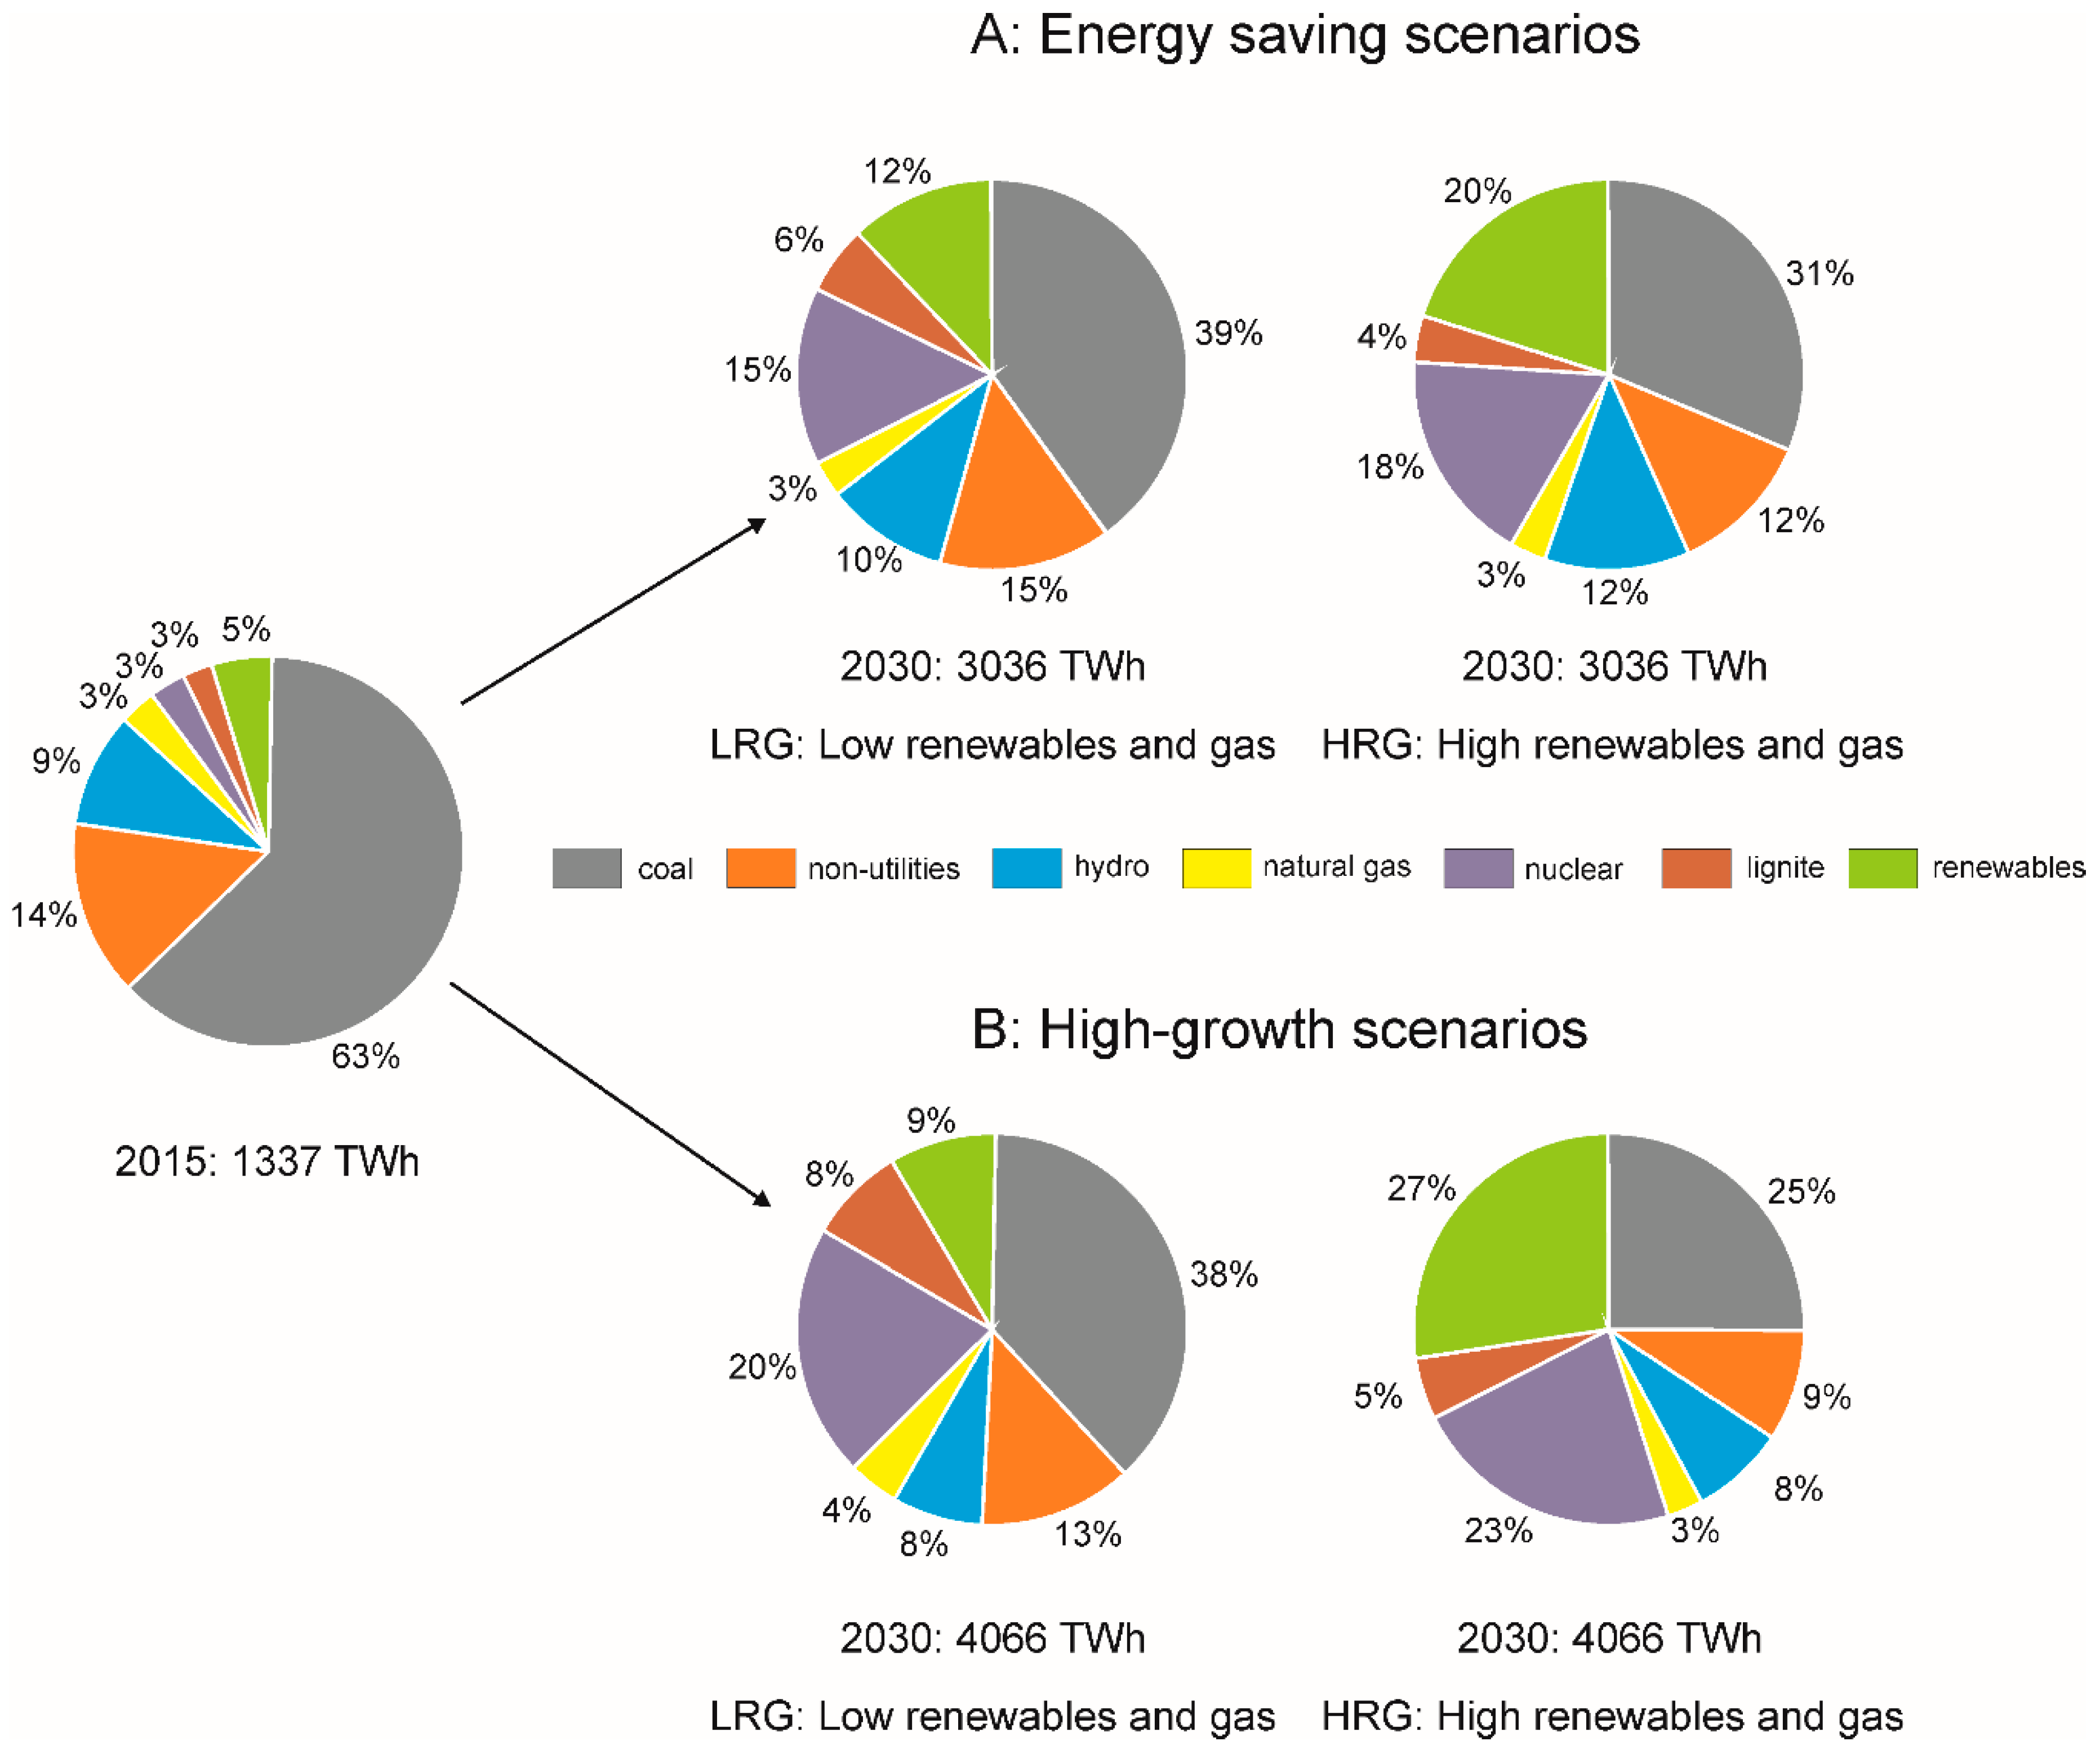
In Figure 6a, the LEAP results for electricity generation in energy saving scenarios for the LRG and HRG cases suggests that coal is still the most important fuel for generating electricity, although its shares have decreased to 23% in the LRG case and up to 32% in the HRG case. This decrease in electricity generation from coal sources is due to the rapid expansion planned with the “Solar Alliance” until 2022. The renewables’ roles in electricity generation in the LRG and HRG cases are 12% and 20%, respectively, which is also a 2-fold and 4-fold increase, respectively, in shares since 2015. Of course, total electricity generation has also increased from 1337 TWh in 2015 to 3063 TWh in 2030.
In Figure 6b, the LEAP results for the LRG and HRG cases for the high growth of industry also shows that coal is still an important fuel for electricity generation. However, in the HRG case, the generation of electricity from renewables has surpassed that by coal generation. This is due to the continuing rapid expansion of the renewable energy network in India after 2022. In both cases, and in both energy saving and industrial growth scenarios, nuclear energy is slowly becoming increasingly important for securing the electricity needs for India’s future. In both cases, oil was not regarded for the future generation of electricity because of small reserves located in the country.
6. Discussion
Publicly available official data from all sectors were available, especially for the core industries in India. Empirical data were obtained for the domestic and commercial sectors. Good estimates could be acquired from the Census data [47] and the USAID ECO-III Project [60] estimates for commercial spaces. In the case of industries, the TERI [41] energy data directory together with the Ministry of Steel and the Ministry of Petroleum [43] contained vital data regarding energy use by various types of industries in India. In the case of the micro, small and medium enterprises sector, which contributed to approximately 8% of the GDP and approximately 40% of the manufacturing output [71], there is inadequate data in terms of energy consumption because of the diversity of this sector. With major policy initiatives to develop this sector further, such as The Micro, Small and Medium Enterprises Development Act [72] and the policy for the reservation of production for manufacturers in this sector, the growth in this sector will not slow down in the future. Because of the sheer size of this sector, there is also the possibility of potentially large energy savings that can be acquired. The ministry related to this sector has many policies for expanding this sector but none for energy savings.
Judging from the simulation results, the renewable energy network needs to be properly implemented into the system to make it successful. Electricity production and distribution do not necessarily follow the typical assumptions made by neoclassical economics, which means that perfect competition between the different sources becomes inefficient. Furthermore, the government would need to intervene by subsidizing some sections of the electricity network, which would result in an optimal outcome [73]. In India, the National Electricity Policy mentions that the commission needs to determine an appropriate deferential tariff to promote renewable energy as they will take some time to compete with conventional sources on the basis of prices [74], but in the long term, they are expected to compete with all other sources in terms of cost.
The expansion of nuclear energy is important in India, which according to the National Action Plan on Climate Change is a way to reduce CO2 emissions. Following the Fukushima disaster, however, nuclear energy has faced local opposition [75]. Mishra [76] mentions that one of the reasons the public are fearful of nuclear technology is because of lack of information disseminated to the people. Convincing people that nuclear energy is a viable technology to meet the growing demands of the country should be one of the priorities of the government. To justify opening new nuclear power plants, the Indian nuclear establishment cannot just highlight their nuclear safety record but must also highlight the advanced mechanisms they have in place for safe operation. It is essential to have regular public interaction, communication and public awareness meetings to educate the people regarding nuclear energy to ensure that nuclear energy is a success in India.
With ambitions of extending the renewable energy network from the announcement of the solar alliance, the electricity mix in the future will not be dominated by coal but a mixture of coal, renewable energy and nuclear energy (Figure 6). Implementation of these sources of electricity in the electricity network in India is important to realize the potential the country has to reduce the dependence on coal for electricity generation, which would subsequently reduce overall CO2 emissions. The LEAP results show that with proper strategy and planning, renewable energy and nuclear energy can become an important energy source while still utilizing indigenous coal. The petroleum industry can cater to the needs of the transportation sector but not too much to the power sector because of India’s dependence on imported crude oil for this industry, while natural gas can contribute gradually to the network with the discovery of new fields and the stable production of CBM.
All the analyses of the production and forecasting of electricity consumption consistently point to its ever-increasing importance to the economy of India. The orientation of India to the production of electricity from coal reveals India’s fundamental problem, which is that India ranks among the three largest polluters of our planet (e.g., [77,78]). The need for growth in electricity generation in the future is boosted by the fact that almost a quarter of the state’s population does not have permanent access to electricity [2]. In the concept of Indian electricity generation, there are two ways to solve these basic problems: a nuclear alternative and a more intensive development of renewable sources, especially solar power plants [79]. The development of new technologies may lead to a partial regrouping of future power generation in favor of solar power plants at the expense of core production. Solar power plants also provide faster solutions for electrification of rural households. Expected year-on-year increases in solar projects make India the third fastest-growing solar power market [80,81,82,83] to compete with fossil electricity production in the future.
7. Conclusions
We prepared several models of electricity demand from 2015 to 2030, based on publicly available datasets and trends. Models were tested on data from previous years and adjusted accordingly. From several scenarios, we decided to introduce several reference ones, which show possible situation in case of renewable energy sources or classic energy sources preferention, and in case of low and high electricity demand. The unambiguous result is a two to three fold increase of the electricity demand in all scenarios by 2030. The way of energy mix selection depend on both internal and external factors.
The main problem of electricity generation in India is in its structure. The role of coal is emphasized, while the share of renewable energy sources (RES) including hydropower is relatively low. Considering that 14% of electricity generation is in the non-utilities group (Figure 2), where the exact shares of different energy sources are unknown, it is possible that the share of coal in electricity generation might be even higher than stated above. This situation, supported by the fact that the role of nuclear energy is insignificant, means that for the future development of the industrial sector and the growing demand of the civilian population, the structure of electricity generation must be modified [83]. It seems probable that over the long-term horizon, the current structure might not cover the growing demand for electricity due to problems in coal supply, while the switch to low-carbon energy in power, heat, and transportation sectors seems to be (at least technically) feasible [84].
What are the real options for accommodation of the future needs of India concerning electricity generation? The crucial answer seems to be an analysis of the following issues:
- Realistic possibilities of nuclear energy including its social acceptance
- Evaluation of the potential of hydropower and renewable energy sources including their environmental impact
- Reduction of the present high carbon emission sources during electricity generation with future low-emission goals.
Next, steps would be taken according to the results of abovementioned studies. Diversification is necessary, since the growing dependence on coal brings several disadvantages. For example, these disadvantages include high carbon emissions, the high cost of the transportation of coal to the final consumer destination, the high cost of the maintenance of a large electricity grid, the significant impact of coal mining on the environment, and the growing dependence on imports from other countries resulting in possible security threats.
Supplementary Materials
The following are available online at https://0-www-mdpi-com.brum.beds.ac.uk/1996-1073/12/7/1361/s1, File F1: Brief introduction to LEAP modelling.
Author Contributions
Conceptualization, M.S.; Data curation, L.S.T.; Formal analysis, L.S.T.; Funding acquisition, J.J.; Investigation, L.S.T. and J.J.; Methodology, J.J.; Project administration, J.J.; Software, L.S.T.; Supervision, J.J. and M.S.; Validation, L.S.T. and M.S.; Visualization, M.S.; Writing—original draft, L.S.T. and M.S.; Writing—review & editing, J.J.
Funding
This research was funded by the Ministry of Education, Youth, and Sports of the Czech Republic, grant numbers CZ.1.05/2.1.00/19.0389: Research Infrastructure Development of the CENET and SP 2018/33.
Conflicts of Interest
The authors declare no conflict of interest. The funders had no role in the design of the study; in the collection, analyses, or interpretation of data; in the writing of the manuscript, or in the decision to publish the results.
References
- International Monetary Fund. World Economic Outlook: Adjusting to Lower Commodity Prices; IMF: Washington, DC, USA, 2015. [Google Scholar]
- Central Electricity Authority. Annual Report 2014–2015; Government of India, Ministry of Power, Central Electricity Authority: New Delhi, India, 2015.
- Central Statistics Office. Energy Statistics; Ministry of Statistics and Pragramme Implementation: New Delhi, India, 2015.
- Ikegami, M.; Wang, Z.H. The long-time causal relation between electricity consumption and real GDP: Evidence from Japan and Germany. J. Policy Model. 2016, 38, 767–784. [Google Scholar] [CrossRef]
- Erdal, G.; Erdal, H.; Esengun, K. The causality between energy consumption and economic growth in Turkey. Energy Policy 2008, 36, 3838–3842. [Google Scholar] [CrossRef]
- Zamani, M. Energy consumption and economic activities in Iran. Energy Econ. 2007, 29, 1135–1140. [Google Scholar] [CrossRef]
- World Development Indicators: Electric Power Consumption (kWh Per Capita). The World Bank, 2016. Available online: http://data.worldbank.org/indicator/EG.USE.ELEC.KH.PC (accessed on 8 March 2017).
- World Development Indicators: GDP Per Capita. The World Bank, 2016. Available online: http://data.worldbank.org/indicator/NY.GDP.PCAP.CD (accessed on 8 March 2017).
- Hu, Z.; Hu, Z. Electricity Economics: Production Functions with Electricity; Springer: Berlin/Heidelberg, Germany, 2013. [Google Scholar]
- Heaps, C.G. Long-Range Energy Alternatives Planning (LEAP) System [Software Version 2012.0049]. Available online: http://www.energycommunity.org/ (accessed on 12 April 2017).
- Kale, R.V.; Pohekar, S.D. Electricity demand and supply scenarios for Maharashtra (India) for 2030: An application of long range energy alternatives planning. Energy Policy 2014, 72, 1–13. [Google Scholar] [CrossRef]
- McPherson, M.; Karney, B. Long-term scenario alternatives and their implications: LEAP model application of Panama’s electricity sector. Energy Policy 2014, 68, 146–157. [Google Scholar] [CrossRef]
- Yophy, H.; Jeffrey, B.Y.; Chieng-Yu, P. The long-term forecast of Taiwan’s energy supply and demand: LEAP model application. Energy Policy 2011, 39, 6790–6803. [Google Scholar]
- World Development Indicators: India. The World Bank, 2016. Available online: http://data.worldbank.org/country/india (accessed on 5 March 2017).
- Khare, V.; Nema, S.; Baredar, P. Status of solar wind renewable energy in India. Renew. Sustain. Energy Rev. 2013, 127, 1–10. [Google Scholar] [CrossRef]
- Gao, M.; Ding, Y.H.; Song, S.J.; Lu, X.; Chen, X.Y.; McElroy, M.B. Secular decrease of wind power potential in India associated with warming in the Indian Ocean. Sci. Adv. 2018, 4, 1–8. [Google Scholar] [CrossRef] [PubMed]
- Thapar, S.; Sharma, S.; Verma, A. Key determinants of wind energy growth in India: Analysis of policy and non-policy factors. Energy Policy 2018, 122, 622–638. [Google Scholar] [CrossRef]
- Deshmukh, R.; Wu, G.C.; Callaway, D.S.; Phadke, A. Geospatial and techno-economic analysis of wind and solar resources in India. Renew. Energy 2019, 134, 947–960. [Google Scholar] [CrossRef]
- Nautiyal, H.; Singal, S.K.; Varun, G.; Sharma, A. Small hydropower for sustainable energy development in India. Renew. Sustain. Energy Rev. 2011, 15, 2021–2027. [Google Scholar] [CrossRef]
- Khan, R. Small hydro power in India: Is it a sustainable business? Appl. Energy 2015, 152, 207–216. [Google Scholar] [CrossRef]
- Sharma, N.K.; Tiwari, P.K.; Sood, Y.R. Solar energy in India? Strategies, policies, perspectives and future potential. Renew. Sustain. Energy Rev. 2012, 16, 933–941. [Google Scholar] [CrossRef]
- Bijarniya, J.P.; Sudhakar, K.; Baredar, P. Concentrated solar power technology in India: A review. Renew. Sustain. Energy Rev. 2016, 63, 593–603. [Google Scholar] [CrossRef]
- Kumar, A.; Kumar, N.; Baredar, P.; Shukla, A. A review on biomass energy resources, potential, conversion and policy in India. Renew. Sustain. Energy Rev. 2015, 45, 530–539. [Google Scholar] [CrossRef]
- Ahmed, S.; Mahmood, A.; Hasan, A.; Sidhu, G.A.S.; Butt, M.F.U. A comparative review od China, India and Pakistan renewable energy sectors and sharing opportunities. Renew. Sust. Energy Rev. 2016, 57, 216–225. [Google Scholar] [CrossRef]
- Tripathi, L.; Mishra, A.K.; Dubey, A.K.; Tripathi, C.B.; Baredar, P. Renewable energy: An overview on its contribution in current energy scenario of India. Renew. Sustain. Energy Rev. 2016, 60, 226–233. [Google Scholar] [CrossRef]
- Kumar, A.; Patel, N.; Gupta, N.; Gupta, V. Photovoltaic power generation in Indian prospective considering off-grid and grid-connected systems. Int. J. Renew. Energy Res. 2018, 8, 1936–1950. [Google Scholar]
- Kumar, S.; Madlener, R. CO2 emission reduction potential assessment using renewable energy in India. Energy 2016, 97, 273–282. [Google Scholar] [CrossRef]
- Rajanna, S.; Saini, R.P. Development of optimal integrated renewable energy model with battery storage for a remote Indian area. Energy 2016, 111, 803–817. [Google Scholar] [CrossRef]
- Sen, S.; Ganguly, S.; Das, A.; Sen, J.; Dey, S. Renewable energy in India: Opportunities and challenges. J. Afr. Earth Sci. 2016, 122, 25–31. [Google Scholar] [CrossRef]
- Tiewsoh, L.S.; Sivek, M.; Jirásek, J. Traditional energy resources in India (coal, crude oil, natural gas): A review. Energy Sourc. Part. B 2017, 12, 110–118. [Google Scholar] [CrossRef]
- Planning Commission. Integrated Energy Policy: Report of the Expert Committee; Government of India: New Delhi, India, 2006.
- Directorate General of Hydrocarbons. Hydrocarbon Exploration & Production Activities, India 2014–2015; Ministry of Petroleum and Natural Gas: New Delhi, India, 2015.
- Communication Dated 10 September 2008, Received from the Permanent Mission of Germany to the Agency Regarding a “Statement on Civil Nuclear Cooperation with India”. IAEA, 2008. Available online: https://www.iaea.org/sites/default/files/publications/documents/infcircs/2008/infcirc734c.pdf (accessed on 20 March 2017).
- Grover, R.B. Policy initiative by the Government of India to accelerate the growth of installed nuclear capacity in the coming years. Energy Proced. 2011, 7, 74–78. [Google Scholar] [CrossRef]
- Grover, R.B. Green growth and role of nuclear power: A perspective from India. Energy Strateg. Rev. 2013, 1, 255–260. [Google Scholar] [CrossRef]
- National Action Plan on Climate Change; Prime Minister’s Council on Climate Change, Government of India: New Delhi, India, 2008.
- The Road from Paris: India’s Progress Towards Its Climate Pledge. NRDC, 2016. Available online: https://www.nrdc.org/sites/default/files/paris-climate-conference-India-IB.pdf (accessed on 17 February 2017).
- Fenton, M.D. Iron and steel. In Mineral Commodity Summaries 2017; U.S. Geological Survey: Reston, VA, USA, 2017; pp. 84–85. [Google Scholar]
- Krishnan, S.S.; Vunnan, V.; Sunder, P.S.; Sunil, J.V.; Ramakrishnan, A.M. A Study of Energy Efficiency in the Indian Iron and Steel Industry; Center for Study of Science, Technology and Policy: Bangalore, India, 2013. [Google Scholar]
- Bray, E.L. Aluminium. In Mineral Commodity Summaries 2017; U.S. Geological Survey: Reston, VA, USA, 2017; pp. 22–23. [Google Scholar]
- TERI. TERI Energy & Environment Data Directory and Yearbook (TEDDY) 2013/14; The Energy and Resources Institute: New Delhi, India, 2014. [Google Scholar]
- Van Oss, H.G. Cement. In Mineral Commodity Summaries 2017; U.S. Geological Survey: Reston, VA, USA, 2017; pp. 44–45. [Google Scholar]
- Ministry of Petroleum & Natural Gas. Indian Petroleum and Natural Gas. Statistics 2014–2015; Government of India: New Delhi, India, 2015.
- Ministry of Petroleum & Natural Gas. Energizing the Nation: Annual Report 2013–2014; Government of India: New Delhi, India, 2014.
- Ministry of Chemicals and Fertilizers. Indian Fertilizer Scenario; Government of India: New Delhi, India, 2014.
- Schumacher, K.; Sathaye, J. India’s Fertilizer Industry: Productivity and Energy Efficiency; Environmental Energy Technologies Division, University of California: Berkeley, CA, USA, 1999. [Google Scholar]
- Census of India. 2011. Available online: http://www.censusindia.gov.in/2011census/PCA/PCA_Highlights/pca_highlights_file/India/Chapter-1.pdf (accessed on 8 March 2017).
- Silk, J.I.; Joutz, F.L. Short and long-run elasticities in US residential electricity demand: A co-integration approach. Energy Econ. 1997, 19, 493–513. [Google Scholar] [CrossRef]
- Dergiades, T.; Tsoulfidis, L. Estimating residential demand for electricity in the United States, 1965–2006. Energy Econ. 2008, 30, 2722–2730. [Google Scholar] [CrossRef]
- Narayan, P.K.; Smyth, R.; Prasad, A. Electricity consumption in G7 countries: A panel cointegration analysis of residential demand elasticities. Energy Policy 2007, 35, 4485–4494. [Google Scholar] [CrossRef]
- Narayan, P.K.; Smyth, R. The residential demand for electricity in Australia: An application of the bounds testing approach to cointegration. Energy Policy 2005, 33, 467–474. [Google Scholar] [CrossRef]
- Ministry of Power. Deendayal Upadhyaya Gram Jyoti Yojana; Government of India: New Delhi, India, 2014.
- Filippini, M.; Pachauri, S. Elasticities of electricity demand in urban Indian households. Energy Policy 2004, 32, 429–436. [Google Scholar] [CrossRef] [Green Version]
- Holtedahl, P.; Joutz, F.L. Residential electricity demand in Taiwan. Energy Econ. 2004, 26, 201–224. [Google Scholar] [CrossRef] [Green Version]
- Halicioglu, F. Residential electricity demand dynamics in Turkey. Energy Econ. 2007, 29, 199–210. [Google Scholar] [CrossRef]
- Dergiades, T.; Tsoulfidis, L. Revisiting residential demand for electricity in Greece: New evidence from the ARDL approcach to cointegration analysis. Empir. Econ. 2011, 41, 511–531. [Google Scholar] [CrossRef]
- National Sample Office. Household consumption of Various Goods and Services in India 2011–2012, NSS 68th Round; Ministry of Statistics and Programme Implementation, Government of India: New Delhi, India, 2014.
- Rawal, R.; Shukla, Y.; Didwania, S.; Singh, M.; Maweda, V. Residential Buildings in India: Energy Use Projections and Savings Potential; Global Buildings Performance Network: Gujarat, India, 2014. [Google Scholar]
- Ministry of Agriculture. Agricultural Statistics at a Glance; Government of India: New Delhi, India, 2014.
- USAID ECO-III Project. Energy Assessment Guide for Commercial Building; International Resources Group: New Delhi, India, 2009. [Google Scholar]
- Statistical Summaries: Indian Railways. Tool Alfa, 2013. Available online: http://in.tool-alfa.com/LinkClick.aspx?fileticket=usxd2FyX02Y%3D&tabid=72&mid=486 (accessed on 8 March 2017).
- International Monetary Fund: World Economic Outlook Update. January 2019. Available online: https://www.imf.org/~/media/Files/Publications/WEO/2019/Update/January/WEOupdateJan2019.ashx?la=en (accessed on 27 March 2019).
- PricewaterhouseCoopers International Limited: The World in 2050. Available online: https://www.pwc.com/gx/en/issues/economy/the-world-in-2050.html (accessed on 27 March 2019).
- Sharma, R. The ever-emerging markets: Why economic forecasts fail. Foreign Aff. 2014, 93, 52–56. [Google Scholar]
- The World Bank: Population Growth (Annual %). 2019. Available online: https://data.worldbank.org/indicator/sp.pop.grow (accessed on 27 March 2019).
- The World Factbook 2016–2017; Government Printing Office: Washington, DC, USA, 2016.
- Kulkarni, P.M. Demographic Transition in India. 4 December 2014. Available online: http://censusindia.gov.in/DigitalLibrary/Demographic-Transition-in-India.pdf (accessed on 27 March 2019).
- Energy Efficient Solar/Green Buildings. Ministry of New and Renewable Energy, 2013. Available online: http://mnre.gov.in/file-manager/dec-green-buildings/MNRE-scheme-green-buildings.pdf (accessed on 12 March 2017).
- Fowler, K.; Rauch, E.; Henderson, J.; Kora, A. Re-Assessing Green Building Performance: A Post Occupancy Evaluation of 22 GSA Buildings; United States Department of Energy: Richland, WA, USA, 2011.
- A Diagnostic Study of the Energy Efficiency of IoT: A Technology and Energy Assessment Report. Pricewaterhouse Coppers, 2018. Available online: https://shaktifoundation.in/wp-content/uploads/2018/07/IOT.pdf (accessed on 20 November 2018).
- Ministry of Micro, Small and Medium Enterprises. Annual Report 2013–2014; Government of India: New Delhi, India, 2014.
- The Micro, Small and Medium Enterprises Development Act. 2006. Available online: http://www.wipo.int/edocs/lexdocs/laws/en/in/in114en.pdf (accessed on 8 March 2017).
- Buccirossi, P. (Ed.) Handbook of Antitrust Economics: Public Policy in Network Industries; The MIT Press: Cambridge, MA, USA, 2008. [Google Scholar]
- Singh, R.; Sood, Y.R. Current status and analysis of renewable promotional policies in Indian restructured power sector—A review. Renew. Sustain. Energy Rev. 2011, 15, 657–666. [Google Scholar] [CrossRef]
- Mahanty, M. Nuclear Energy in India: Debate and Public perception. In Proceedings of the International Conference on Gandhi, Disarmament and Development, Indore, India, 4–6 October 2013; pp. 1–6. [Google Scholar]
- Mishra, S. Socal acceptance of nuclear power in India. Air Power J. 2012, 7, 55–82. [Google Scholar]
- Lelieveld, J.; Evans, J.S.; Fnais, M.; Giannadaki, D.; Pozzer, A. The contribution of outdoor air pollution sources to premature mortality on a global scale. Nature 2015, 525, 367. [Google Scholar] [CrossRef]
- Lu, Z.; Zhang, Q.; Streets, D.G. Sulfur dioxide and primary carbonaceous aerosol emissions in China and India, 1996–2010. Atmos. Chem. Phys. 2011, 11, 9839–9864. [Google Scholar] [CrossRef] [Green Version]
- Anandarajah, G.; Gambhir, A. India’s CO2 emission pathways to 2050: What role can renewables play? Appl. Energy 2014, 131, 79–86. [Google Scholar]
- Kapoor, K.; Pandey, K.K.; Jain, A.K.; Nandan, A. Evolution of solar energy in India: A review. Renew. Sustain. Energy Rev. 2014, 40, 475–487. [Google Scholar] [CrossRef]
- Sahoo, S.K. Renewable and sustainable energy reviews solar photovoltavic energy progress in India: A review. Renew. Sustain. Energy Rev. 2016, 59, 927–939. [Google Scholar] [CrossRef]
- Kumar, A.; Prakash, O.; Dube, A. A review on progress of concentrated solar power in India. Renew. Sustain. Energy Rev. 2017, 79, 304–307. [Google Scholar] [CrossRef]
- Srikanth, R. India’s sustainable development goals—Glide path for India’s power sector. Energy Policy 2018, 123, 325–336. [Google Scholar] [CrossRef]
- Lawrentz, L.; Xiong, B.; Lorenz, L.; Krumm, A.; Hosenfeld, H.; Burands, T.; Loffler, K.; Oei, P.Y.; von Hirschhausen, C. Exploring energy pathways for the low-carbon transformation in India—A model-based approach. Energies 2018, 11, 3001. [Google Scholar] [CrossRef]
Figure 1.
Electricity production in India from different sources [14].
Figure 1.
Electricity production in India from different sources [14].

Figure 2.
Electricity mix in India 2015 [2].
Figure 2.
Electricity mix in India 2015 [2].

Figure 3.
Electricity production and consumption in India in 2015.

Figure 4.
Electricity consumption from different sectors in a high-growth scenario.

Figure 5.
Electricity consumption from different sectors in an energy-saving scenario.

Figure 6.
Electricity generation for the energy-saving and high-growth scenarios.

© 2019 by the authors. Licensee MDPI, Basel, Switzerland. This article is an open access article distributed under the terms and conditions of the Creative Commons Attribution (CC BY) license (http://creativecommons.org/licenses/by/4.0/).
Share and Cite
MDPI and ACS Style
Tiewsoh, L.S.; Jirásek, J.; Sivek, M. Electricity Generation in India: Present State, Future Outlook and Policy Implications. Energies 2019, 12, 1361. https://0-doi-org.brum.beds.ac.uk/10.3390/en12071361
AMA Style
Tiewsoh LS, Jirásek J, Sivek M. Electricity Generation in India: Present State, Future Outlook and Policy Implications. Energies. 2019; 12(7):1361. https://0-doi-org.brum.beds.ac.uk/10.3390/en12071361
Chicago/Turabian StyleTiewsoh, Lari Shanlang, Jakub Jirásek, and Martin Sivek. 2019. "Electricity Generation in India: Present State, Future Outlook and Policy Implications" Energies 12, no. 7: 1361. https://0-doi-org.brum.beds.ac.uk/10.3390/en12071361
Note that from the first issue of 2016, this journal uses article numbers instead of page numbers. See further details here.