1. Introduction
In modern times, people tend to spend at least 90% of the day indoors; thus, ecofriendly indoor environments are extremely important [
1]. The quality of indoor environments is indicated by the thermal quality, indoor air quality, acoustic quality, light quality, etc. Such factors affect the quality of life of the occupants. In particular, thermal quality is a major determinant of the indoor environment quality and indicates the thermal comfort of occupants or their satisfaction with indoor environments. Accordingly, thermal quality of adequate comfort enhances the health and productivity of occupants [
2].
In general, indoor thermal quality has been controlled using temperature and humidity. Even if the control elements are satisfactory, the level of satisfaction obtained with the overall thermal environment could be low. The temperature and humidity-based control of cooling and heating systems presents limitations with regard to comfort, energy efficiency, eco-friendliness, and economic feasibility [
3].
To address these problems, the predicted mean vote (PMV) was developed by Fanger [
4] in 1970 as an indicator for evaluation of the human-body thermal sensations and discomfort. In addition to temperature and humidity, the PMV considers four elements affecting thermal quality: the air flow rate, mean radiant temperature, metabolic rate, and clothing insulation. The satisfactory comfort level is suggested as −0.5 < PMV < +0.5 by the ISO 7730 (International Organization for Standardization) [
5]. As the PMV has proven to be useful for supplying a comfortable thermal environment, it is currently employed in various research areas on a global scale.
So far, PMV elements, such as the temperature, humidity, air flow rates, and mean radiant temperature, refer to physical values measured by sensors. Diverse approaches have been investigated for measuring personal elements such as individual metabolic rate. Metabolic rate is defined as the amount of heat generation from the body surface required for maintaining the body heat balance. The activity is a major factor for determining actual metabolic rate values and 1 met is the amount of heat generated when a person is sitting and resting.
Metabolic rate estimation methods are presented by the ISO 8896, wherein four levels are introduced [
6], namely, screening (level 1), observation (level 2), analysis (level 3), and expertise (level 4).
Table 1 summarizes the methods and describes the major contents. If a higher level is applied, a more accurate metabolic rate value can be obtained. Thus, the heart rate-based (level 3) and the oxygen consumption or more accurate device (level 4)-based methods could be sophisticated approaches to obtain the occupant metabolic rate.
Various studies have been conducted for occupant metabolic rate estimation (
Table 2). Ito and Nishi (2013) [
7] estimated occupant metabolic rate using an accelerometer. Additionally, a wearable device embedding an accelerometer was used for estimating metabolic rate by Hassan et al. (2016) [
8] and Lee (2016) [
9]. Alternatively, Bu and Shim (1997) [
10] tried to estimate metabolic rate by measuring skin temperature through infrared ray sensors.
The heart rate and oxygen consumption methods were used for metabolic rate estimation as well. Yi et al. (2008) [
11] used the heart rates and Calvaresi et al. (2018) [
12] have attempted to consider a combination of heart rate, acceleration, and respiratory rate. Gao et al. (2018) [
13] used the quantity of oxygen consumption and the emissions of carbon dioxide (CO
2) in occupant respiration measured by wearable devices. Ji et al. (2018) [
14] examined the variation of the CO
2 quantity by the respiration of occupants in a closed space.
In previous studies, the metabolic rate was estimated based on the direct information collecting from the body such as heart rate and oxygen consumption. For collecting the information, it is essential to use additional instruments attached to the body, such as sensors or wearable devices. Information, unfortunately, could be missing if such devices are not present with the occupants; in this case, it is not possible to detect activity level to estimate metabolic rate.
A simpler method that can be freely applied is required for estimating occupant metabolic rate. If the real-time information about the occupant activity could be acquired without any additional devices sticking to the body, it would be more helpful to estimate the metabolic rate without any information being missed out. In particular, if a system could automatically detect the real-time activity without any interventions of building managers or occupants, that intelligent system would provide the actual occupant activity with convenience.
Accordingly, the objective of this study is to develop an intelligent method that can classify occupant pose in real-time. For this, a deep neural network model was developed, in which the pose is classified using occupant image information from a nail-size camera. The neural network model was designed to classify sedentary activity in the home and office such as sleeping, reclining, sitting, typing, writing, and standing. In particular, the neural network model can automatically classify the type of pose without any expert intervention or devices attached on the body. The intelligent and automated method for classifying actual occupant pose would be a simpler and more practical approach that can be a basis for determining real-time occupant activity and for estimating metabolic rate and indoor thermal environment.
2. Development of Pose Classification Model
The ANN and deep learning methods were employed to judge and classify the poses according to images of the occupants. The ANN is a training algorithm that imitates the process of the human brain to solve problems via a neural network. This approach involves machine learning (ML). The most outstanding feature of the ANN is that it trains itself using the input data and handles problems accordingly. The ANN is appropriate for processing large-scale data to conduct image classification, noise recognition, natural language, video recommendation, etc. [
15]. Additionally, the ANN employs the structure of the input and output layers as well as factors such as the weight, bias, and activation function.
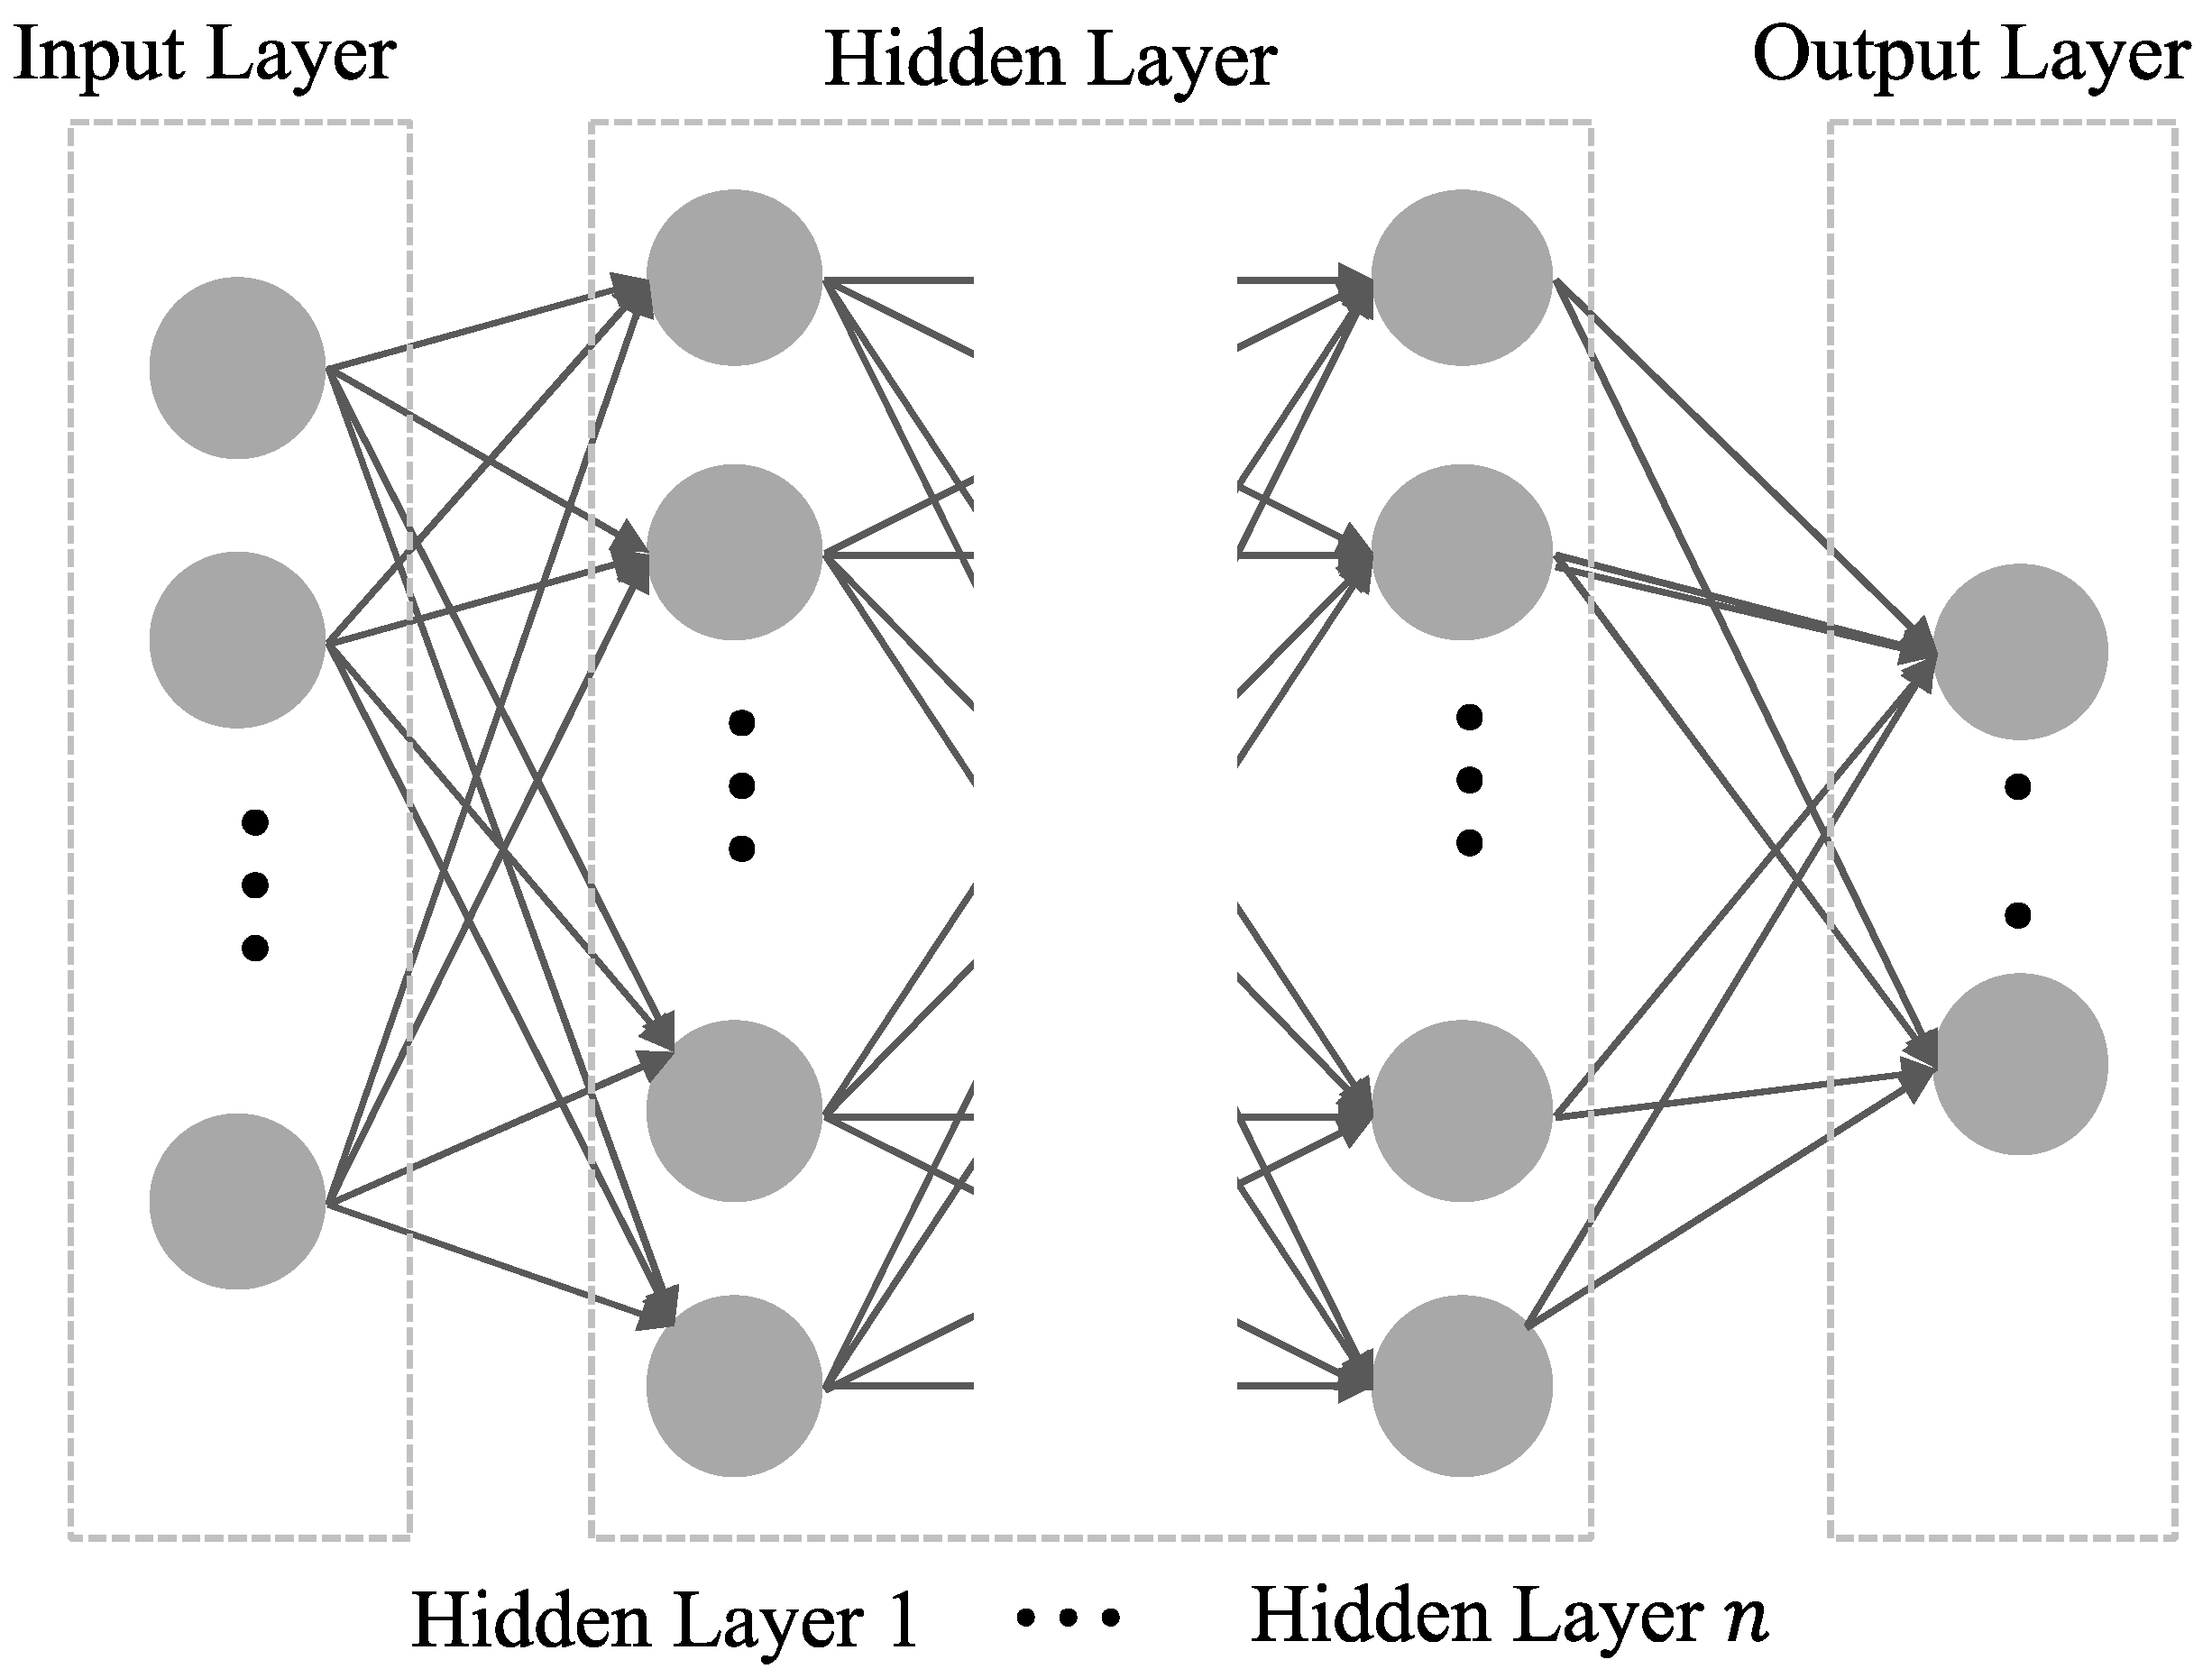
Deep learning is also called a deep neural network (DNN). The DNN is a type of ANN in which two or more of the hidden layers are deep. It consists of an input layer, multiple hidden layers, and an output layer, as illustrated in
Figure 1. The number of hidden layers (NHL) for deep learning depends on the model to be embodied. As the NHL increases, the ability of the network to handle complex data and problems is improved. Additionally, deep learning may adopt various methodologies, such as regression for analyzing the relationships among datasets to predict data values and classification of data into categories or classes. Deep learning addresses the problem of nonlinearity, which is a limitation of the existing ANN, and it achieves high accuracy as long as sufficient data are provided [
16,
17].
The learning mechanisms of deep learning are mainly classified as supervised learning, unsupervised learning, and reinforced learning. Supervised learning involves training using data with labels on correct answers and includes algorithms such as linear regression, support vector machines, decision trees, and neural networks. In contrast, unsupervised learning involves training using data with no labels on correct answers such as data clustering, visualization, and dimensionality reduction. Reinforced learning derives the best strategy by applying rewards and penalties [
15].
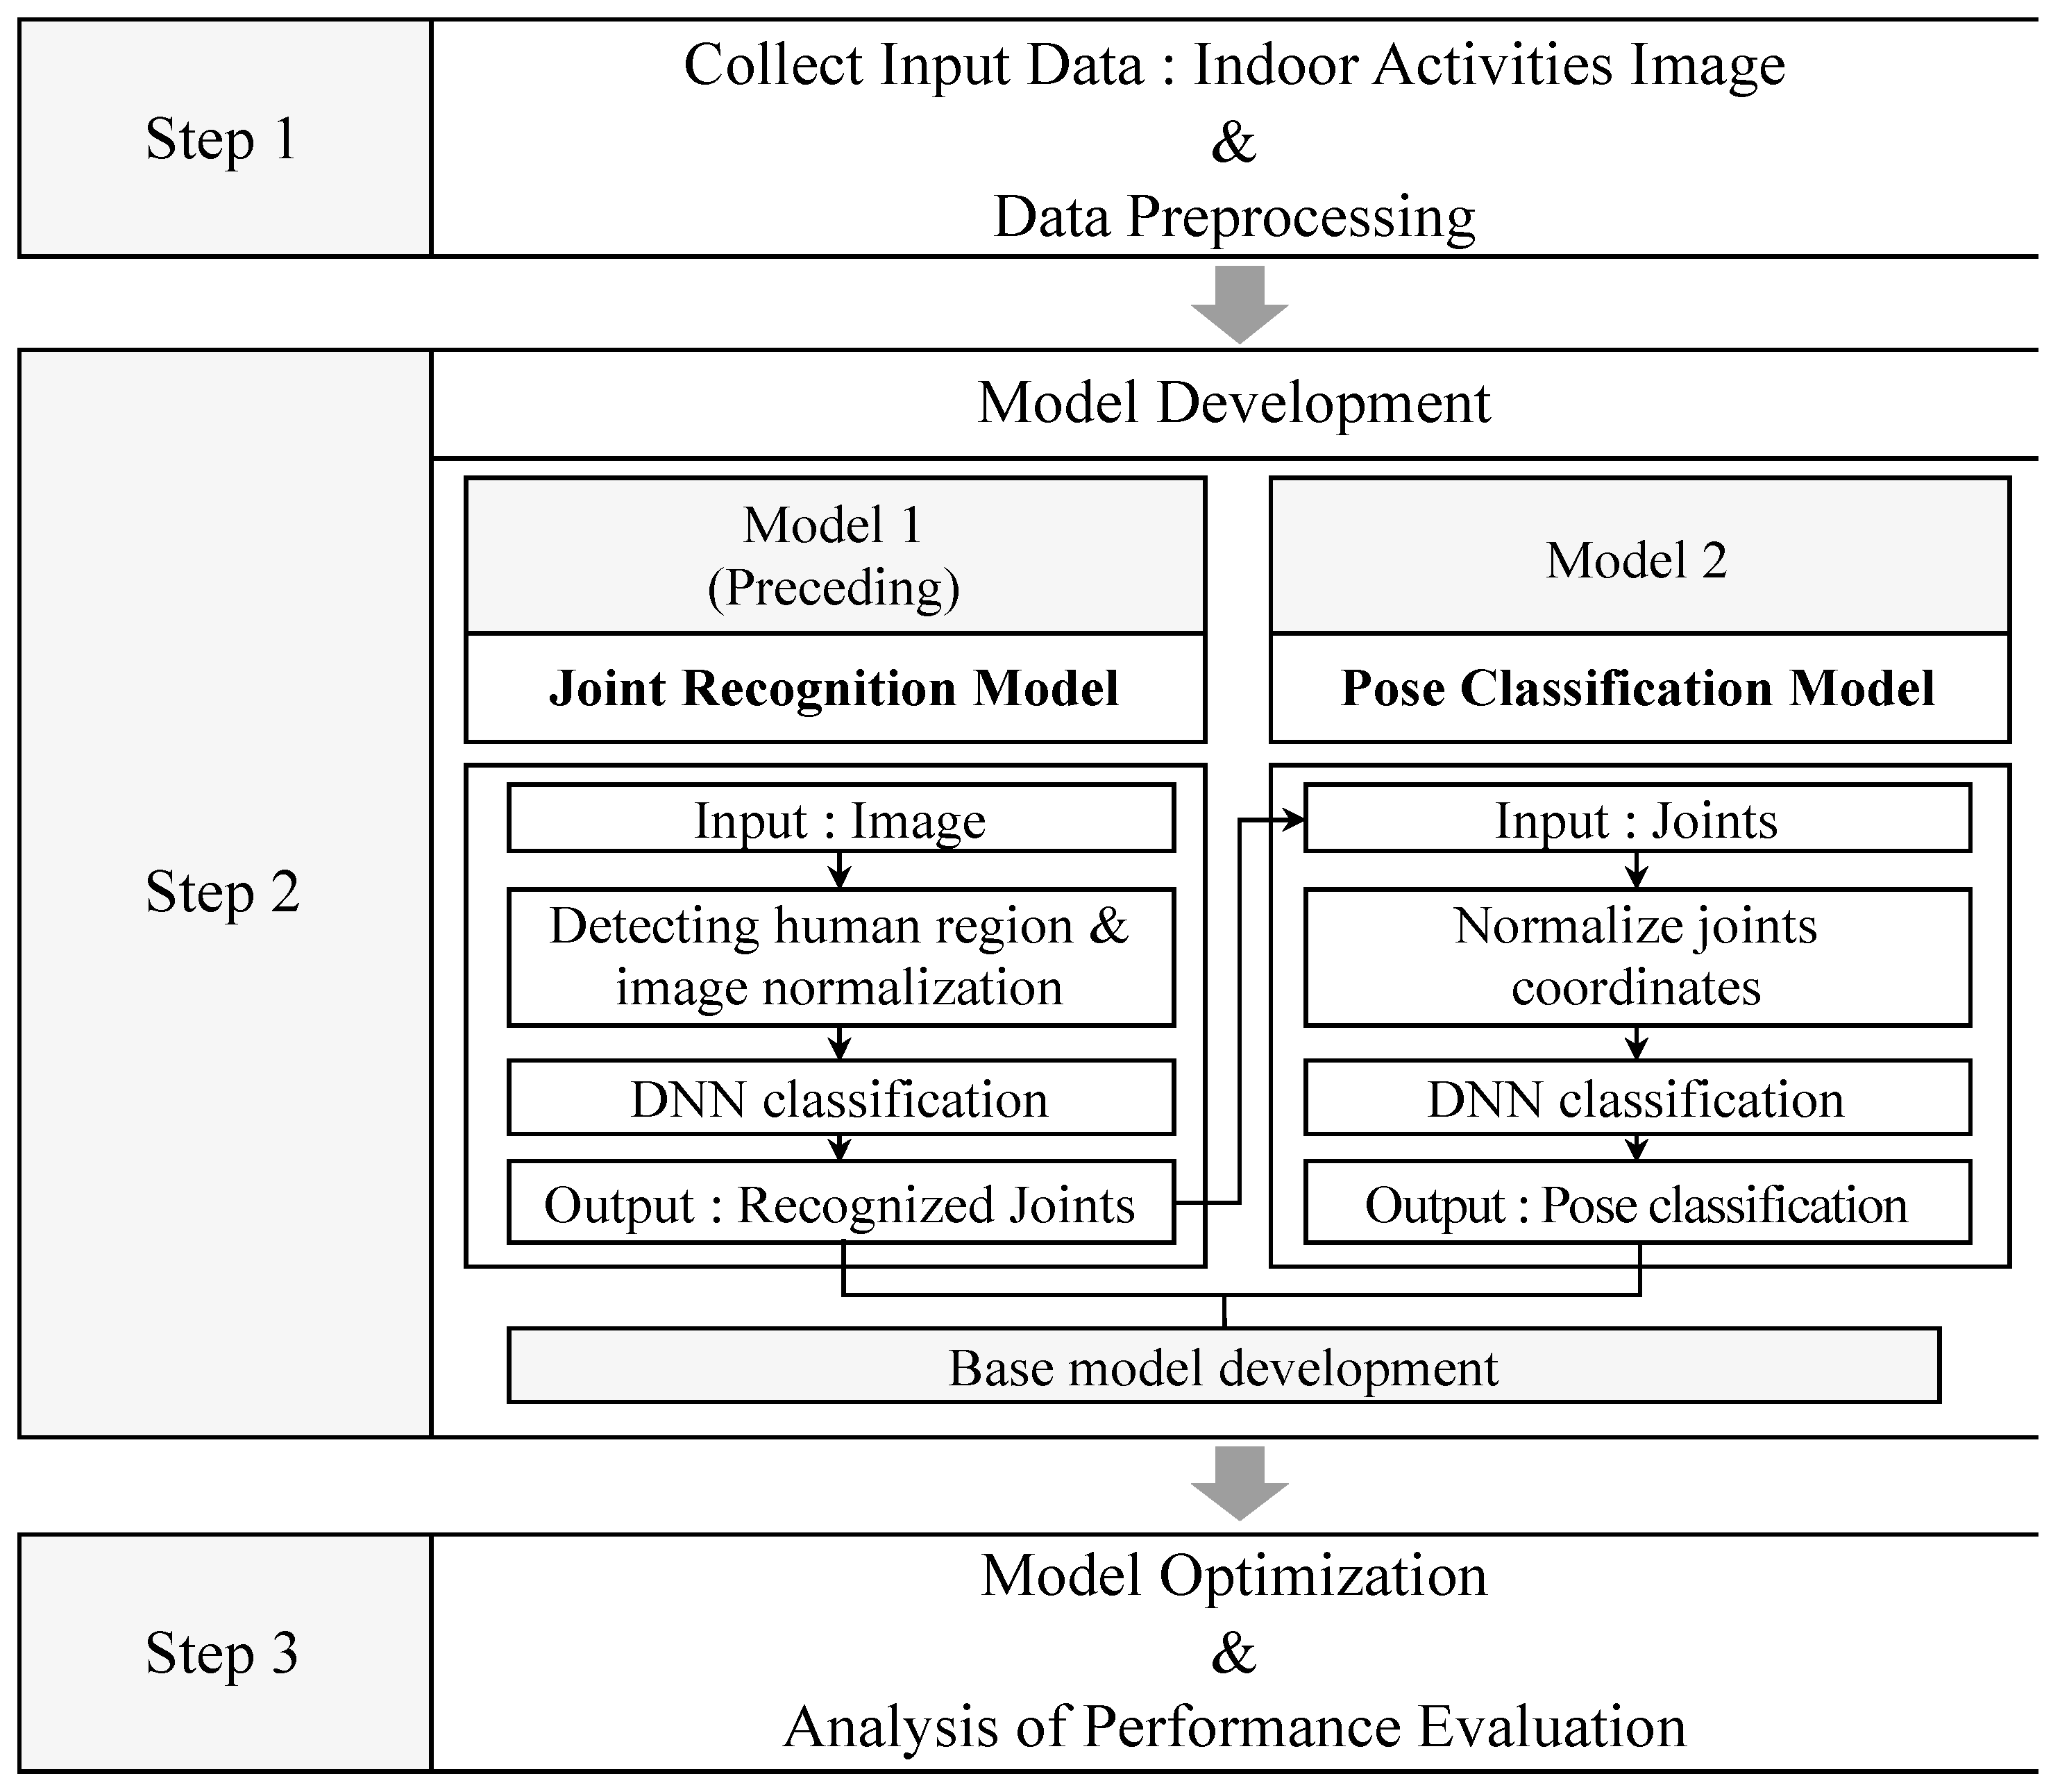
For classifying the poses of occupants in our research, two deep-neural network models were developed, as shown in
Figure 2, in which three steps were conducted. In step 1, general indoor activities were selected and the images for those activities were collected, which were to be used for training. The collected data was preprocessed for augmentation. Here, the images were acquired using a nail-size small camera, which can be easily installed to the commercial data acquisition and processing board.
In step 2, a method for classifying the occupant pose was developed using the collected and augmented data. The development process consisted of two steps: one for the joint recognition model and the other for the pose classification model. The joint recognition model (Model 1) is a pre-existing model and precedes the pose classification model in this study (Model 2). Model 1 extracts and trains features of the occupants and recognizes the coordinates of major body joints. It was developed by Han et al. [
18]. Model 2—the pose classification model—was developed in this study. The coordinates of 14 major joints recognized in Model 1 were trained to classify the occupant activities for metabolic rate estimation. In step 3, the pose classification model was optimized, and the performance of the connected two models in a mockup laboratory was evaluated.
2.1. Building Training Datasets
Every type of ML, including deep learning, is based on collected data. Thus, proper dataset establishment for training is an important step to be taken prior to model development. The data to be utilized for training were collected before pose classification model development, and this process consisted of the establishment and augmentation of the initial dataset.
The preceding model, i.e., the joint recognition model, was trained by the images for joint coordinate finding, and then the pose classification model developed in this study was trained according to the joint coordinates for pose classification. Supervised learning was practiced with both models knowing correct answers of data. The data to be used for training consisted of indoor posture image data and the body joint coordinate data from the images.
Regarding the indoor activity of the occupant, major indoor activities were selected from “Metabolic Rates for Typical Tasks” of ASHRAE 55 [
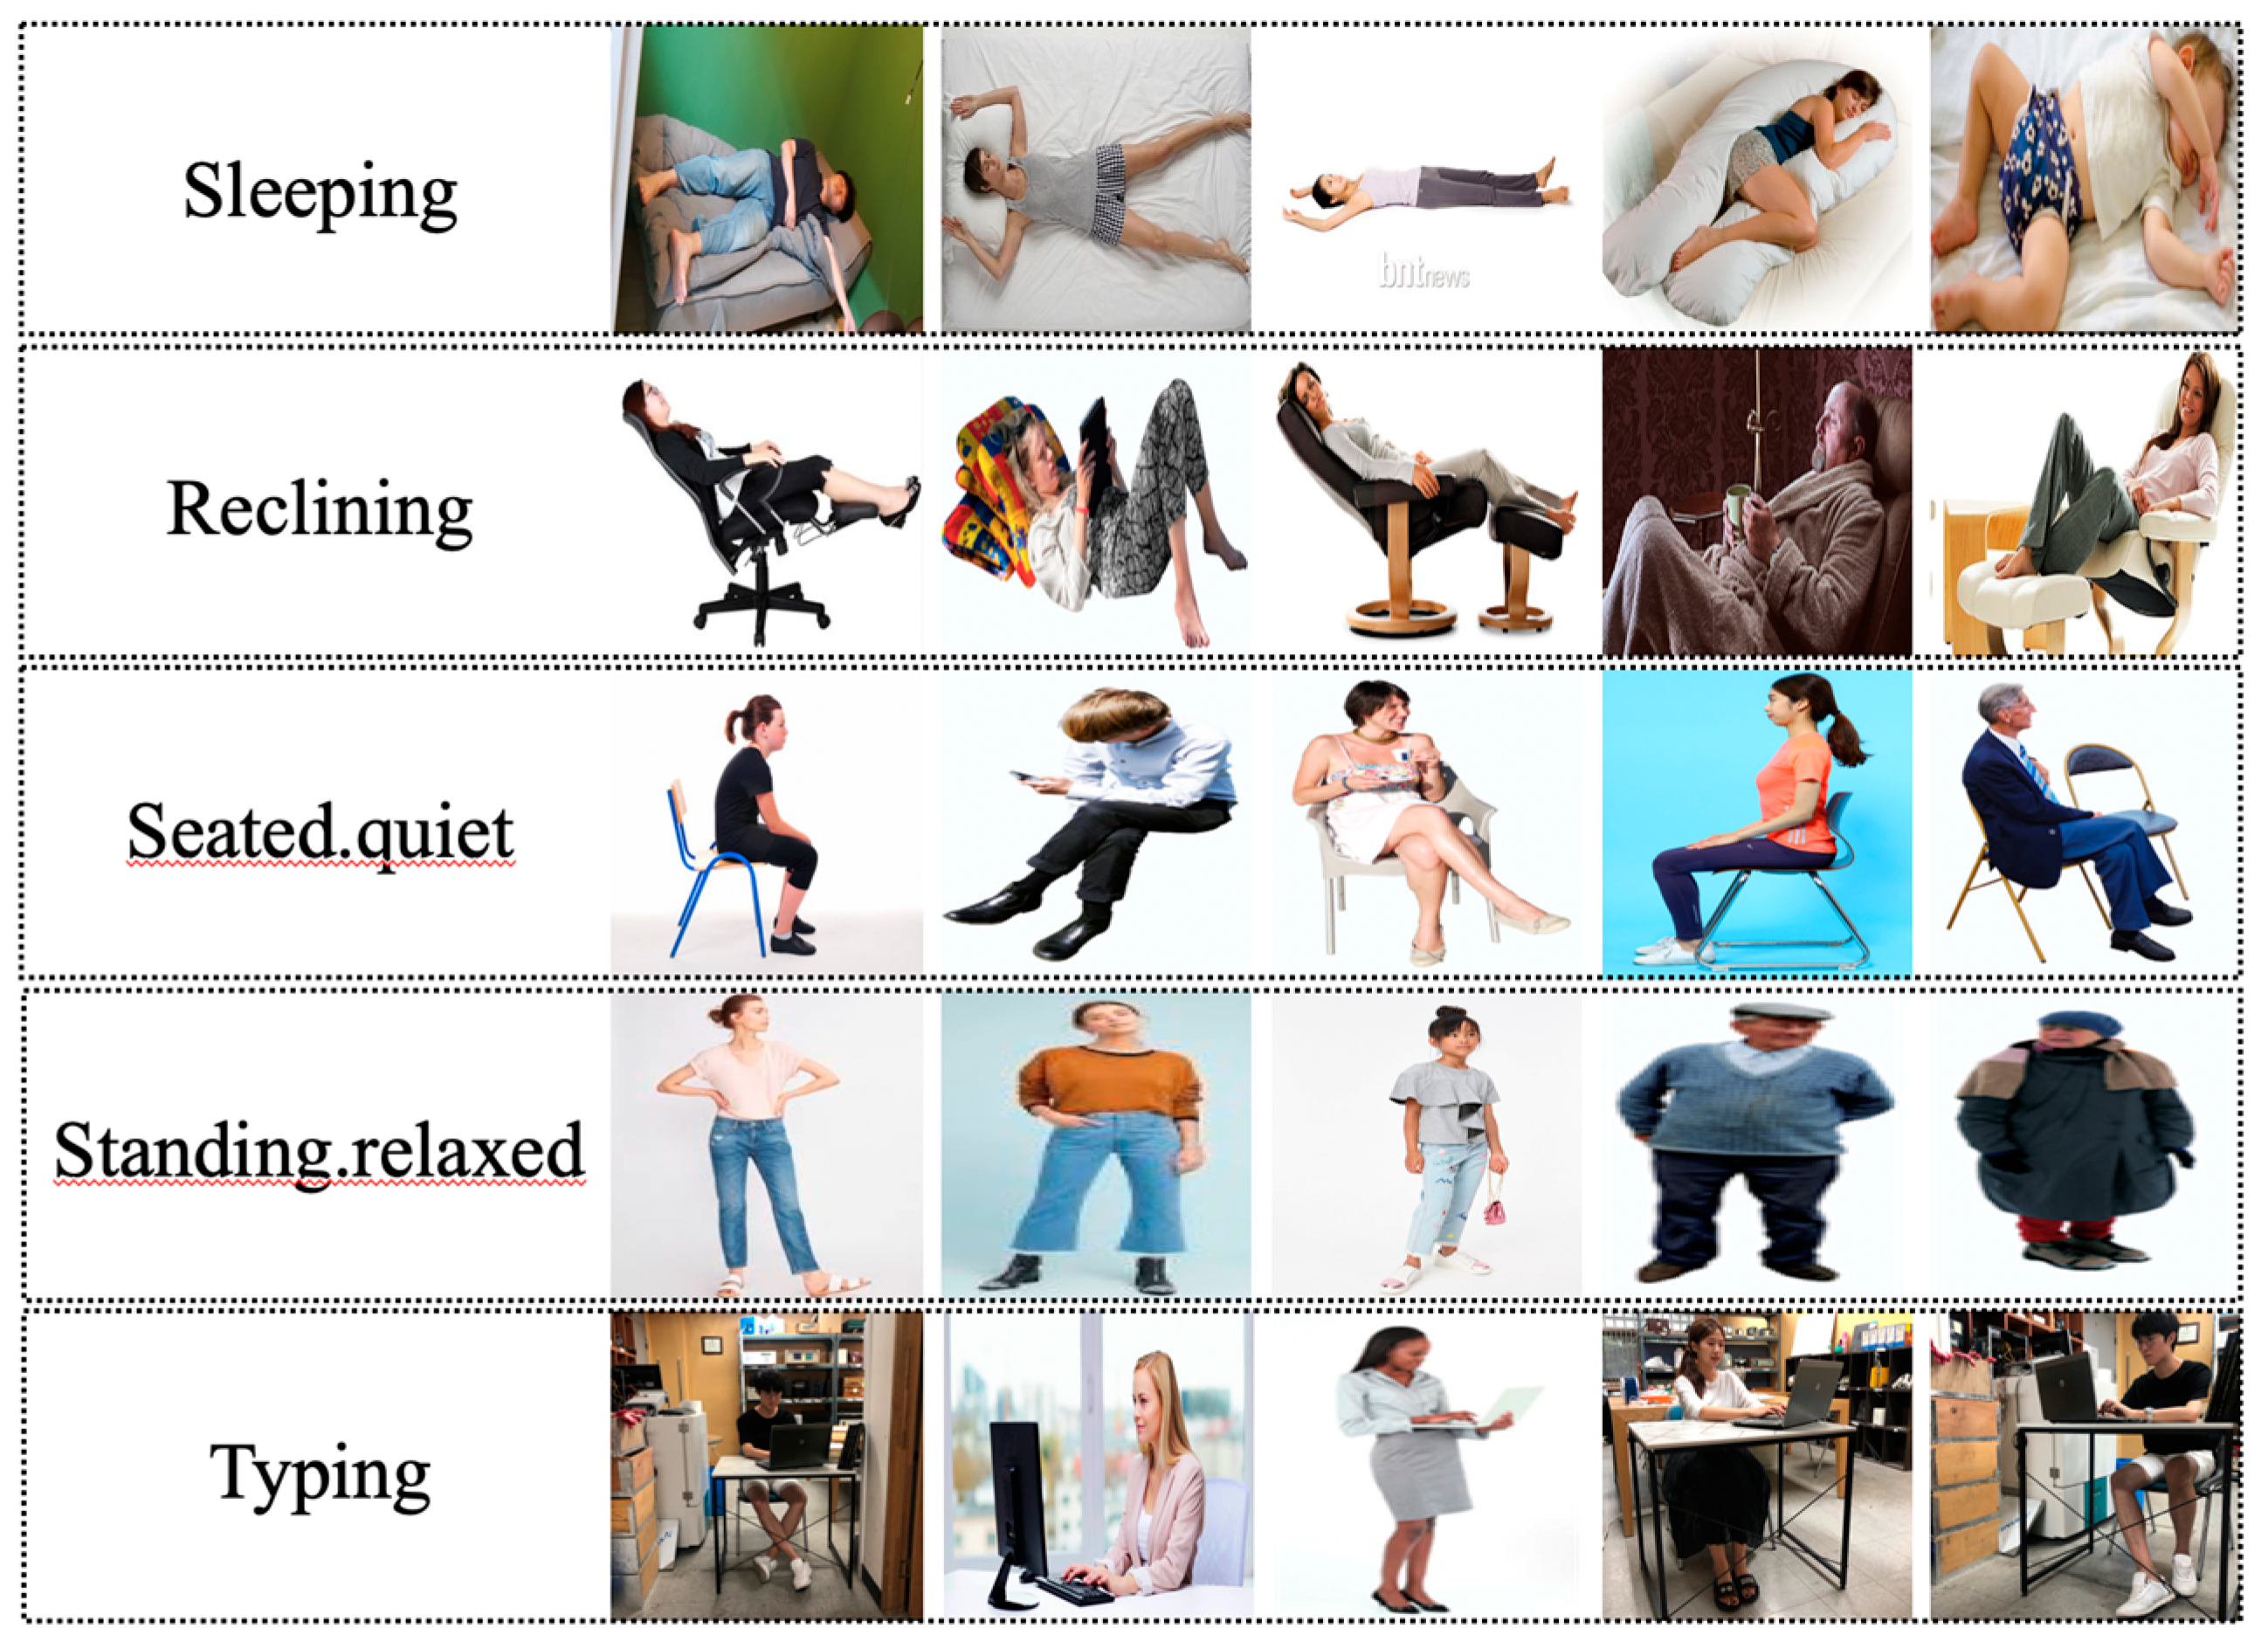
19], presented by the U.S. ASHRAE. The 10 major indoor activities used for model training were “sleeping,” “reclining,” “seated.quiet,” “standing.relaxed,” “typing,” “writing,” “reading.seated,” “filing.seated,” “filing.stand,” and “walking about.”
The indoor conditions assumed in the actual laboratory evaluation were divided between home and office environments. The most frequent activities in each environment were chosen. As shown in
Table 3, four home activities (“sleeping,” “reclining,” “seated.quiet,” and “standing.relaxed”) and three office activities (“seated.quiet,” “standing.relaxed,” and “typing”) were considered.
Table 3 shows the activities selected for each building type and the metabolic rate standards of the ASHRAE.
Images related to the selected indoor activities were collected from online open image databases for various activities, such as “LIP (look into person)” [
20], or directly from the mockup laboratories where the actual indoor environments were simulated.
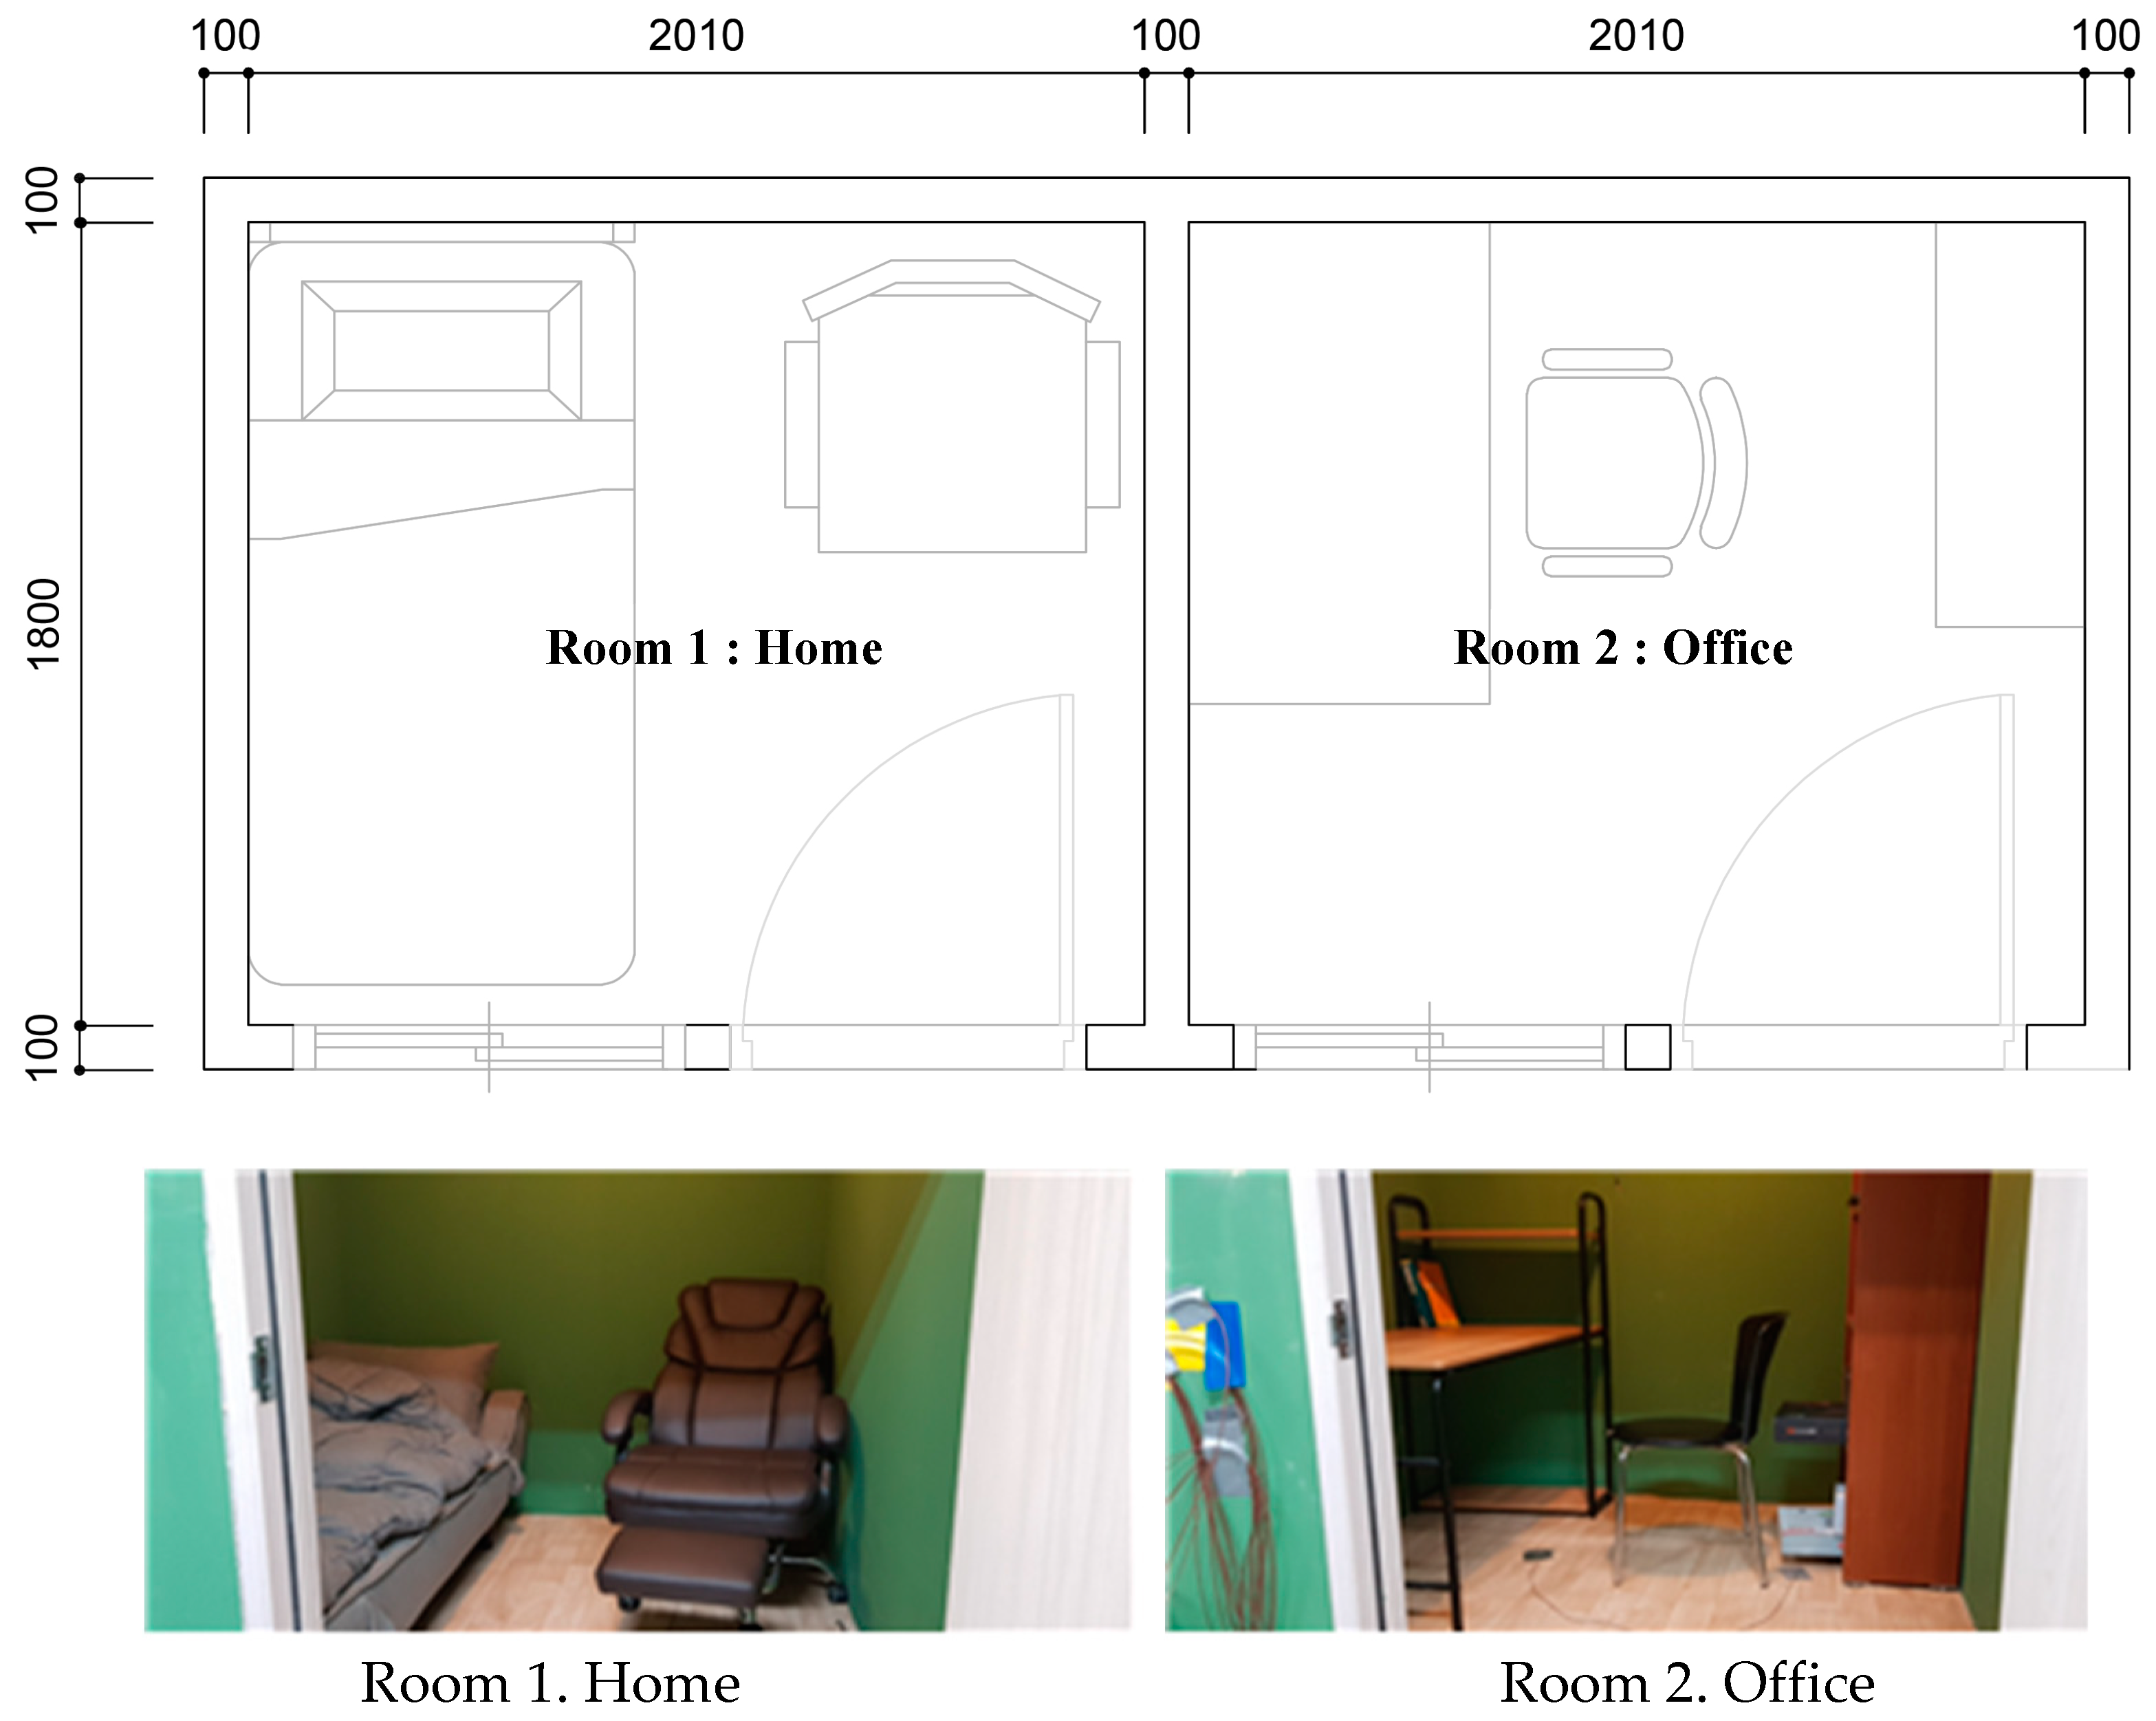
Figure 3 presents the mockup laboratories. For collecting both the indoor environment factors and an image for the occupant, the Raspberry Pi-based (i.e., a single-board computer) system was produced. The sensors inherent in the system consist of temperature, humidity, airflow, MRT, and camera, for which the total cost is about
$248 as a prototype. In each room, this system was installed to collect occupant images, and full-body images were preferentially selected for the database. A total of 50 images were collected for each of the 10 activities, and image examples for the five activities in the home and office settings are shown in
Figure 4. The resolution range of the collected images is 72 to 300 ppi (pixel per inch), and the size of the images used for the training was normalized to 128 × 128.
The general coordinates of the joints in the collected images are presented in
Table 4; 14 major joints were located. The absolute coordinate values of each joint were recorded, with (0, 0) at the top left of each image. The joint coordinate data were used as correct-answer data for the preceding model training and as the training data for the metabolic rate estimation model. The joint recognition model outputs the absolute coordinate values (x, y) of the 14 joints in each image and inputs the values to the pose classification model.
After the initial datasets were completed, augmentation was performed in three different ways to ensure a sufficient number of datasets to train the pose classification model. The first method involved switching the left and right of each image against a central line as the reference. In this process, it was possible to learn the left-to-right switched poses of each indoor activity image. The second method involved rotating each image in the range between −5° and 5°, with the central line as the reference. This method increased the volume of data while producing no outliers in the image data. The third method involved adjusting the scale of the images. This method increased the volume of data by sensing occupants in each image and adjusting the size of the surrounding margins. As the margins around a human were adjusted, the absolute coordinate values were changed, while the pose remained the same. Thus, it was possible to utilize various values as training data.
Three augmentation methods increased the volume of the collected training data by a factor of 112, thus the total number of the datasets was 56,000. In this process, the accuracy of the model was enhanced by offering diversity to the data. The increase in data needs to be continuously considered for improving performance of the model in the future.
2.2. DNN Pose Classification Model
As explained earlier, two models were developed for classifying occupant poses—the joint recognition model (Model 1) and the pose classification model (Model 2).
2.2.1. Preceding Model for Joint Recognition (Model 1)
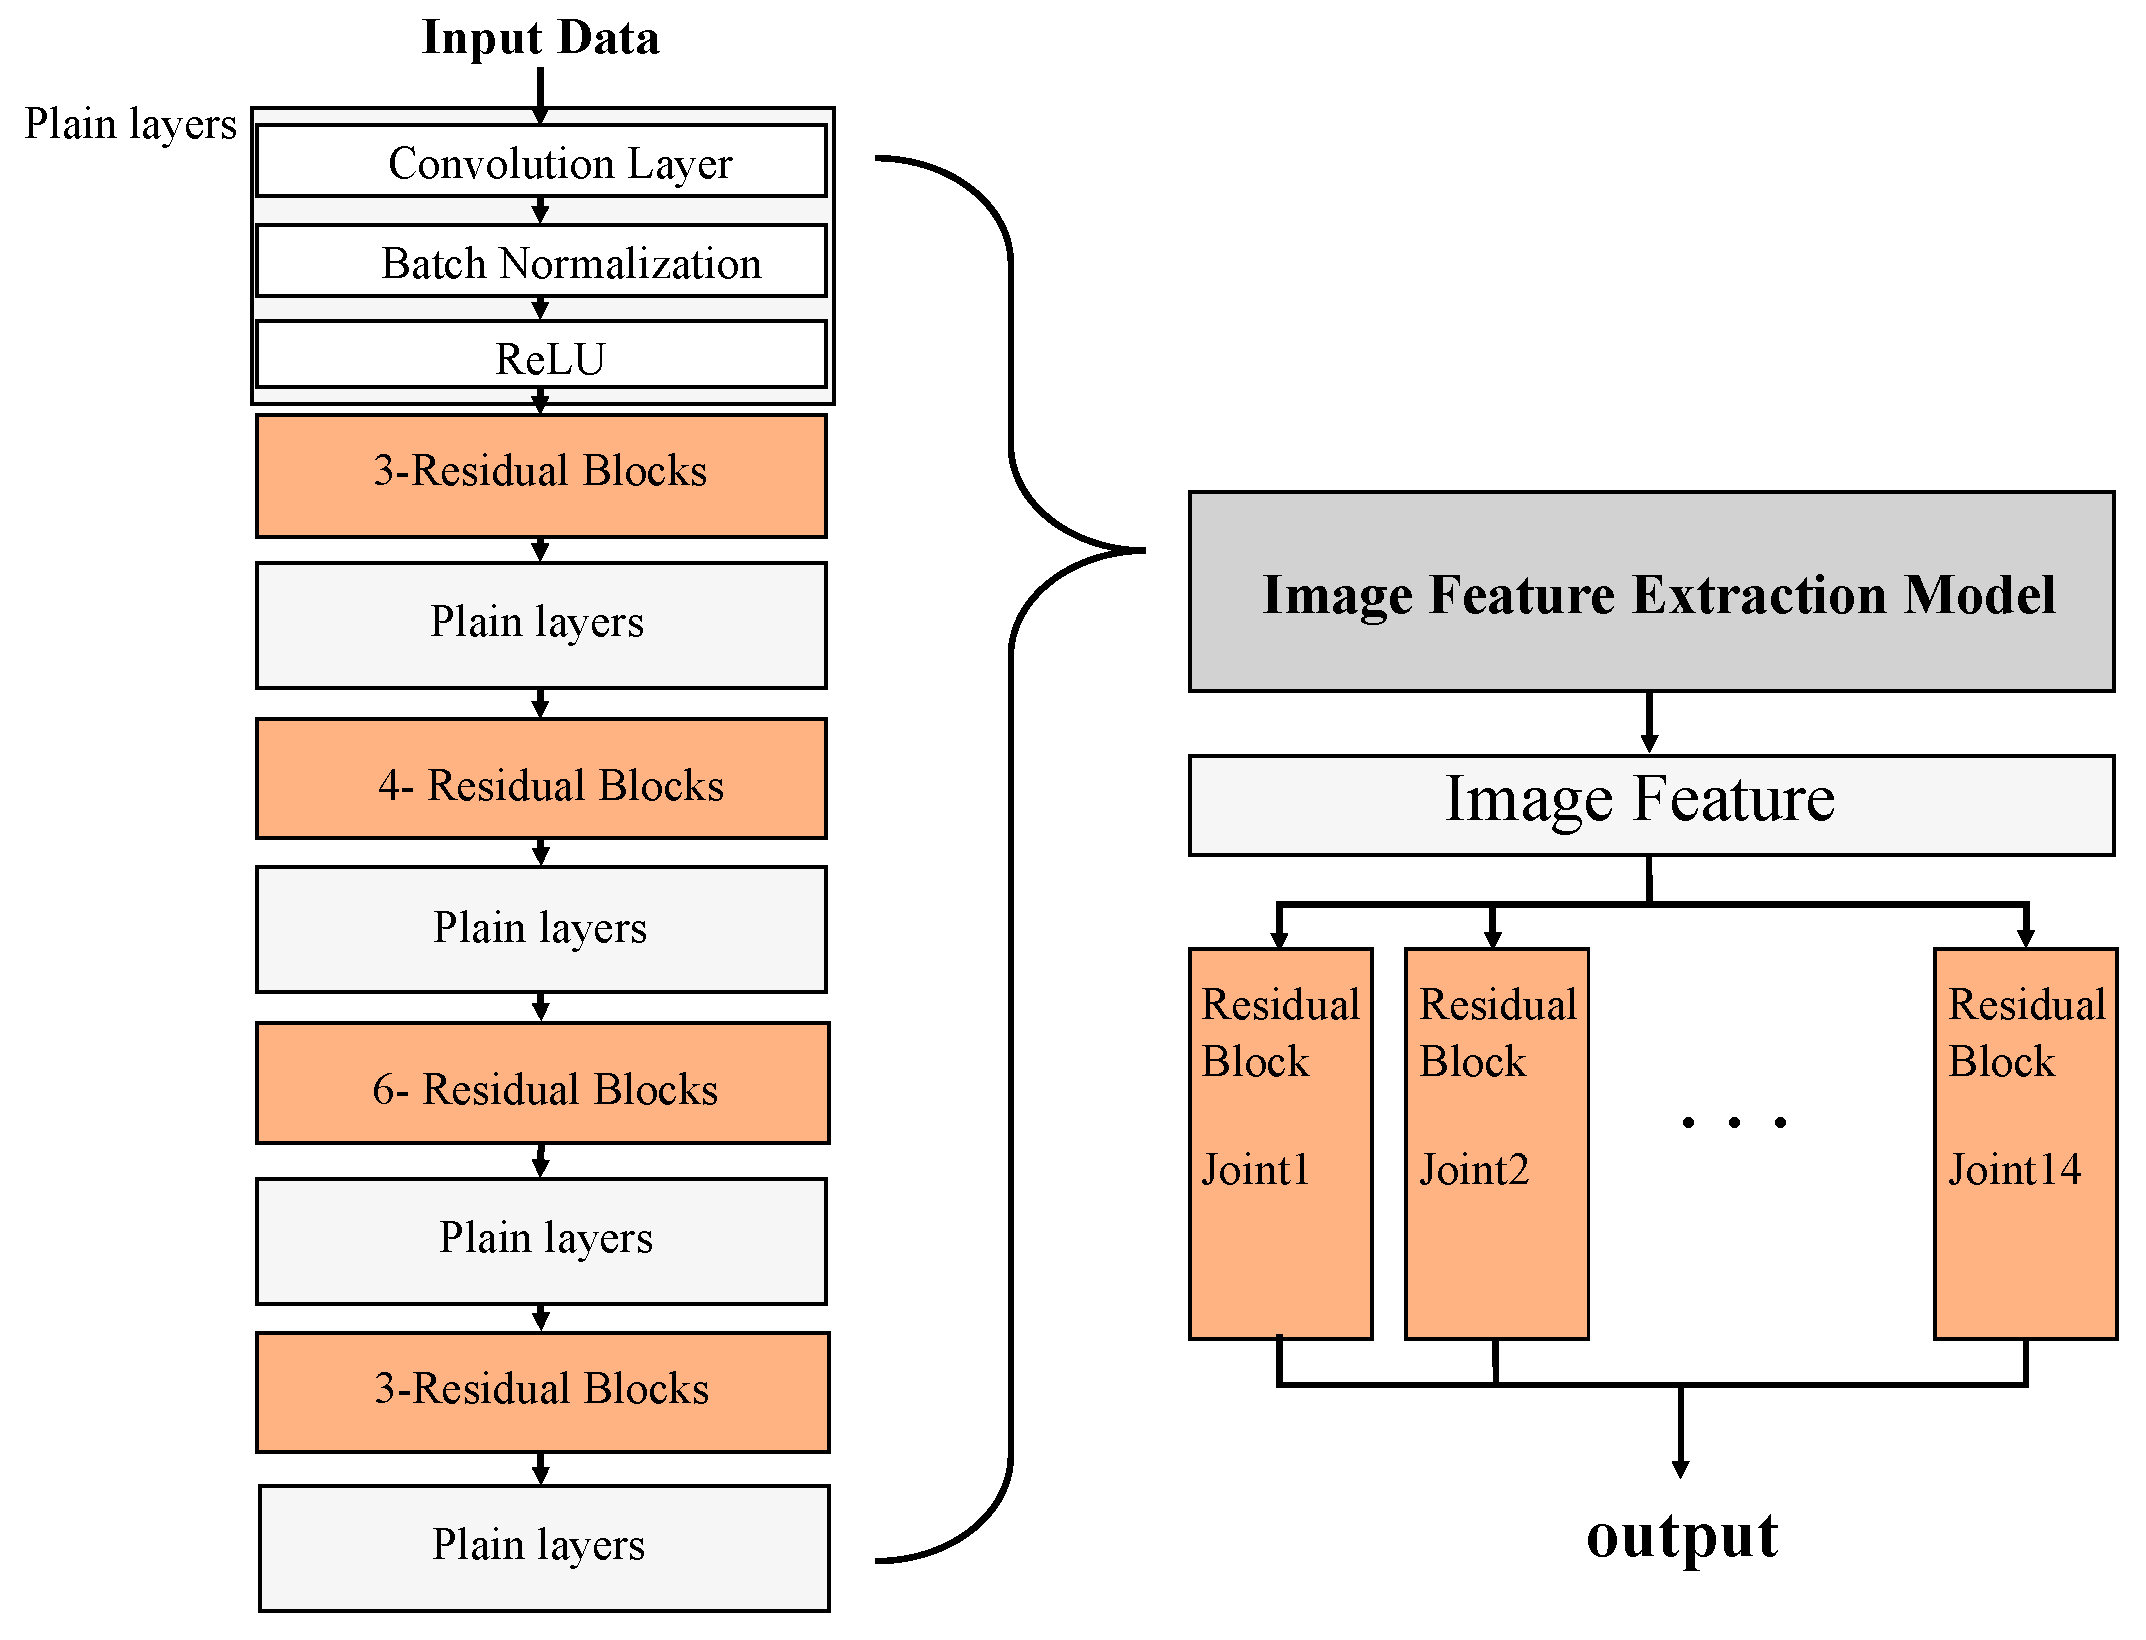
First, the joint recognition model (Model 1) received original images containing indoor activity data and extracted the occupant joint coordinate values. This model was developed by Han et al. [
18]. It was trained by calculating the distance between actual coordinate values of occupants and values extracted from model training. Among the various deep learning methods, ResNet, which has a convolutional neural network structure, was used. The key feature of ResNet is the residual block, which prevents the error values from being lost in the middle of training, and thus enhances the performance.
The structure of the joint recognition model is illustrated in
Figure 5. In the image feature extraction step, images were used as input data for extracting their features through 16 residual blocks and 52 convolution layers. The extracted image features were sent to 14 residual blocks so that the coordinate values of each joint were produced as outputs. Namely, the joint recognition model produces 14 body joint coordinate values from the images, and then the coordinate outputs were sent to the pose classification model.
2.2.2. Pose Classification Model (Model 2)
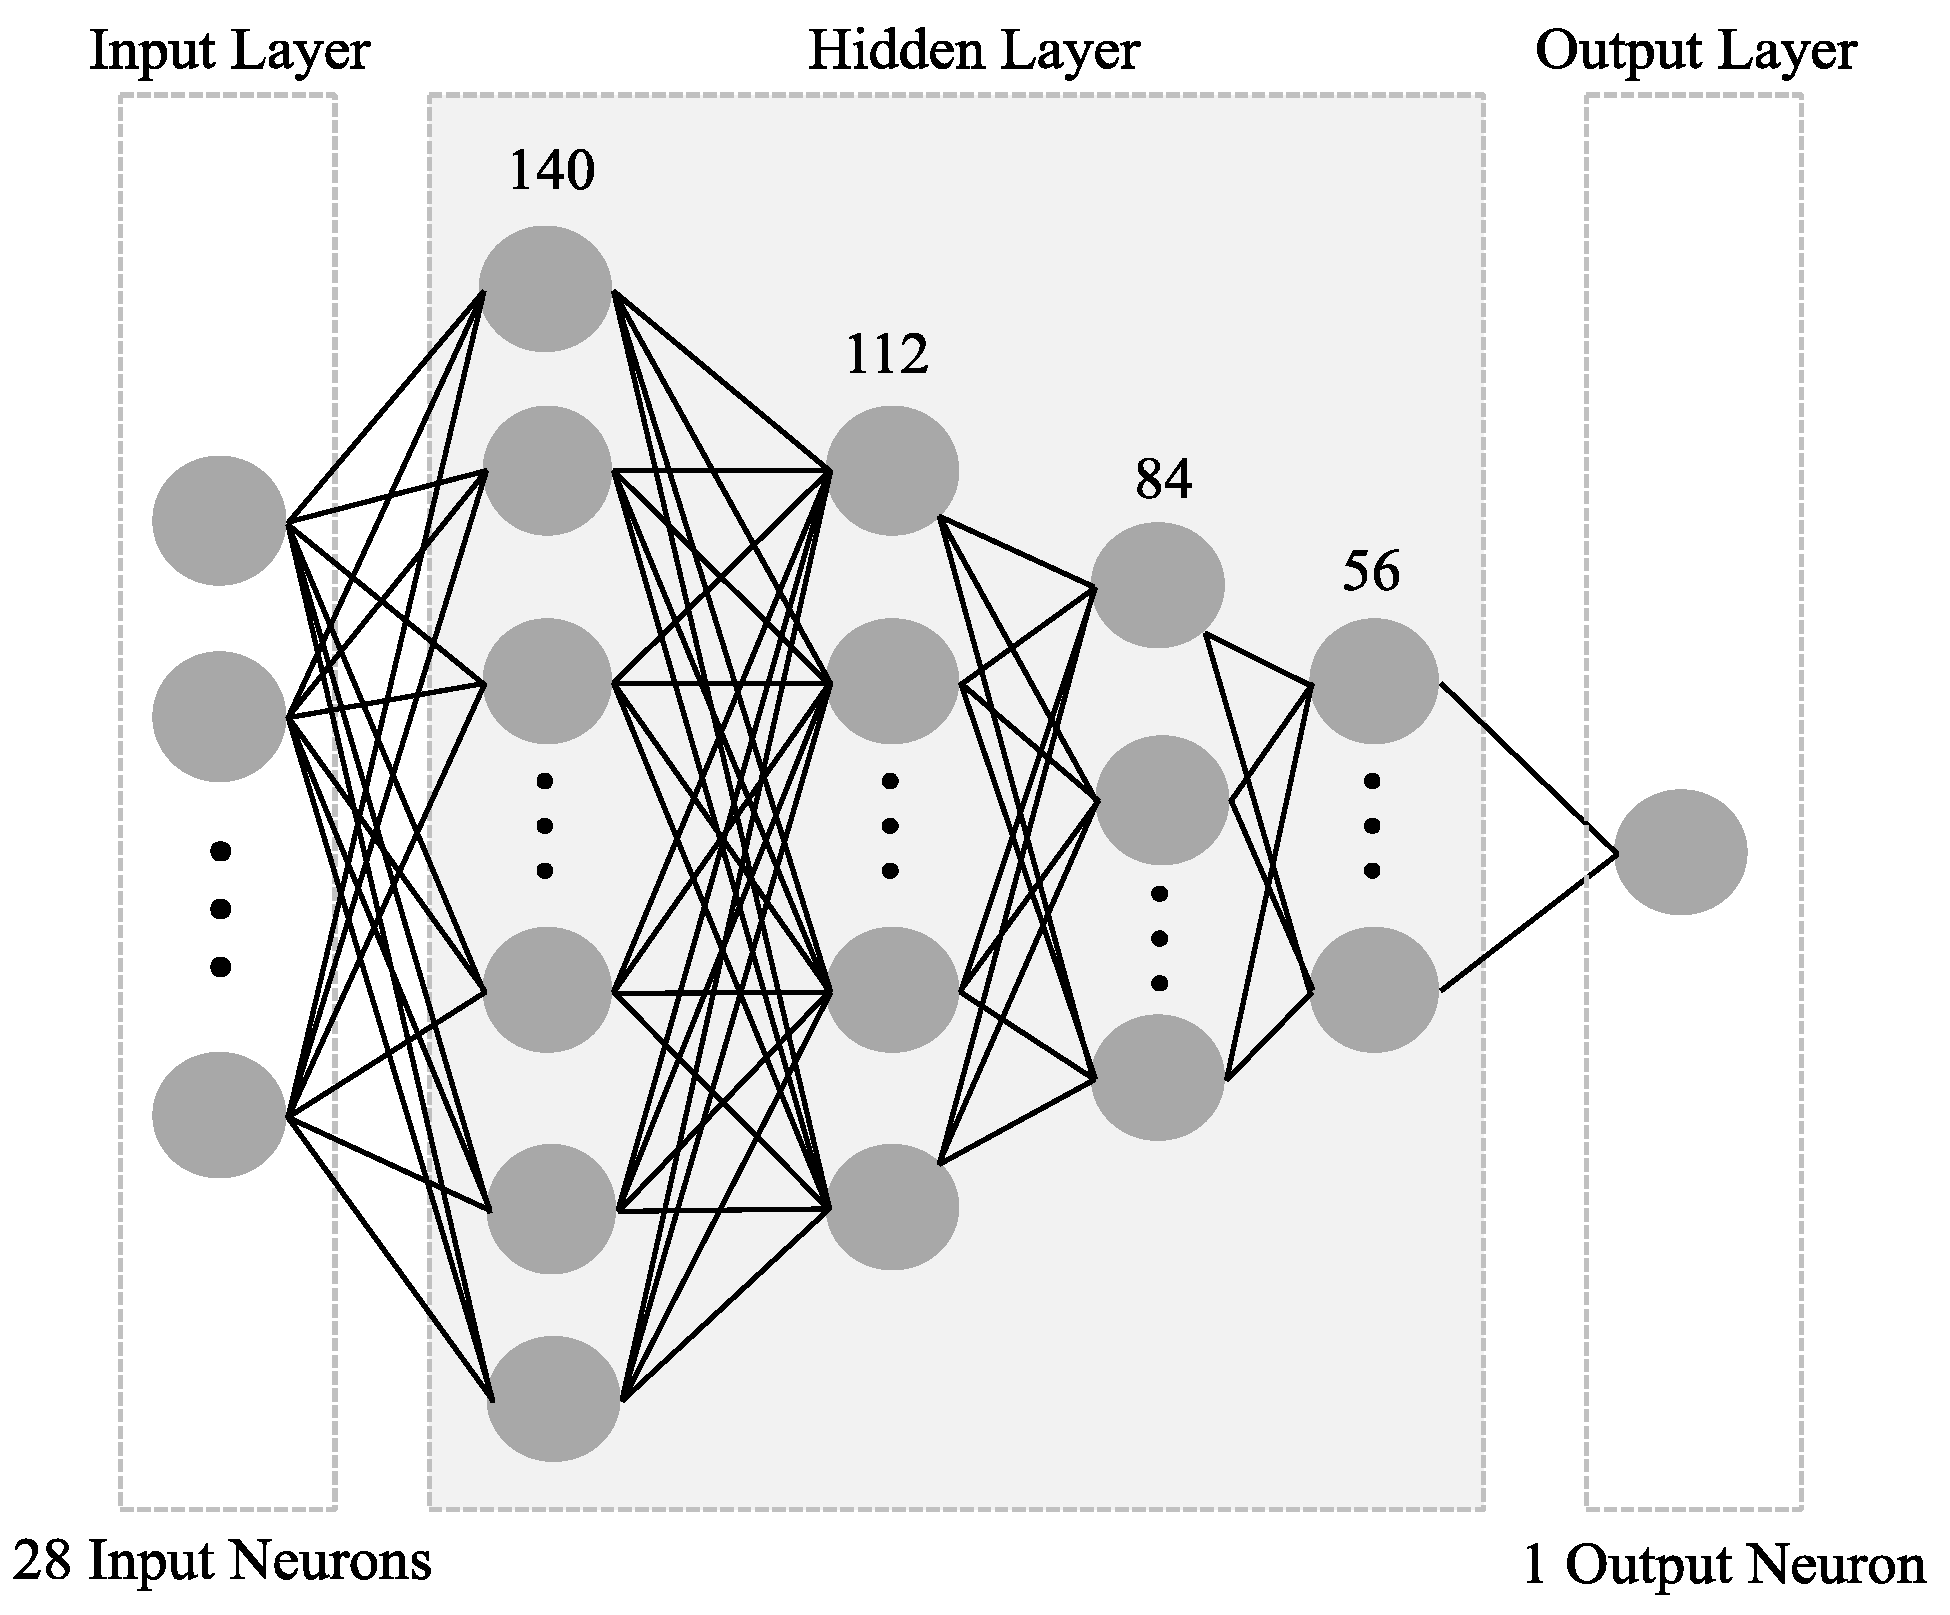
The pose classification model (Model 2) was designed to classify pose type using the 28 (x, y) coordinate values of major body joint coordinate values from the preceding Model 1. The basic structure of the pose classification model consisted of an input layer, hidden layers, and an output layer. As shown in
Figure 6, 28 input neurons and 1 output neuron were included. The model optimization process was followed for finding the optimal number of hidden layers (NHL) and number of hidden neurons (NHN). The pose classification accuracy was used for optimization.
The cross entropy, which is mainly used to check errors in classification models, was used as the error function. The optimized algorithm adjusted the learning rate autonomously via an Adam optimizer while performing the training. Prior to model training, the model parameters were set up to resolve problems such as low learning rates, overfitting, gradient vanishing, and exploding. Regarding the activation function of the pose classification model, the rectified linear unit (ReLU) function and the batch normalization method were adopted. Additionally, dropout was applied to prevent overfitting of the training data.
2.3. Model Training
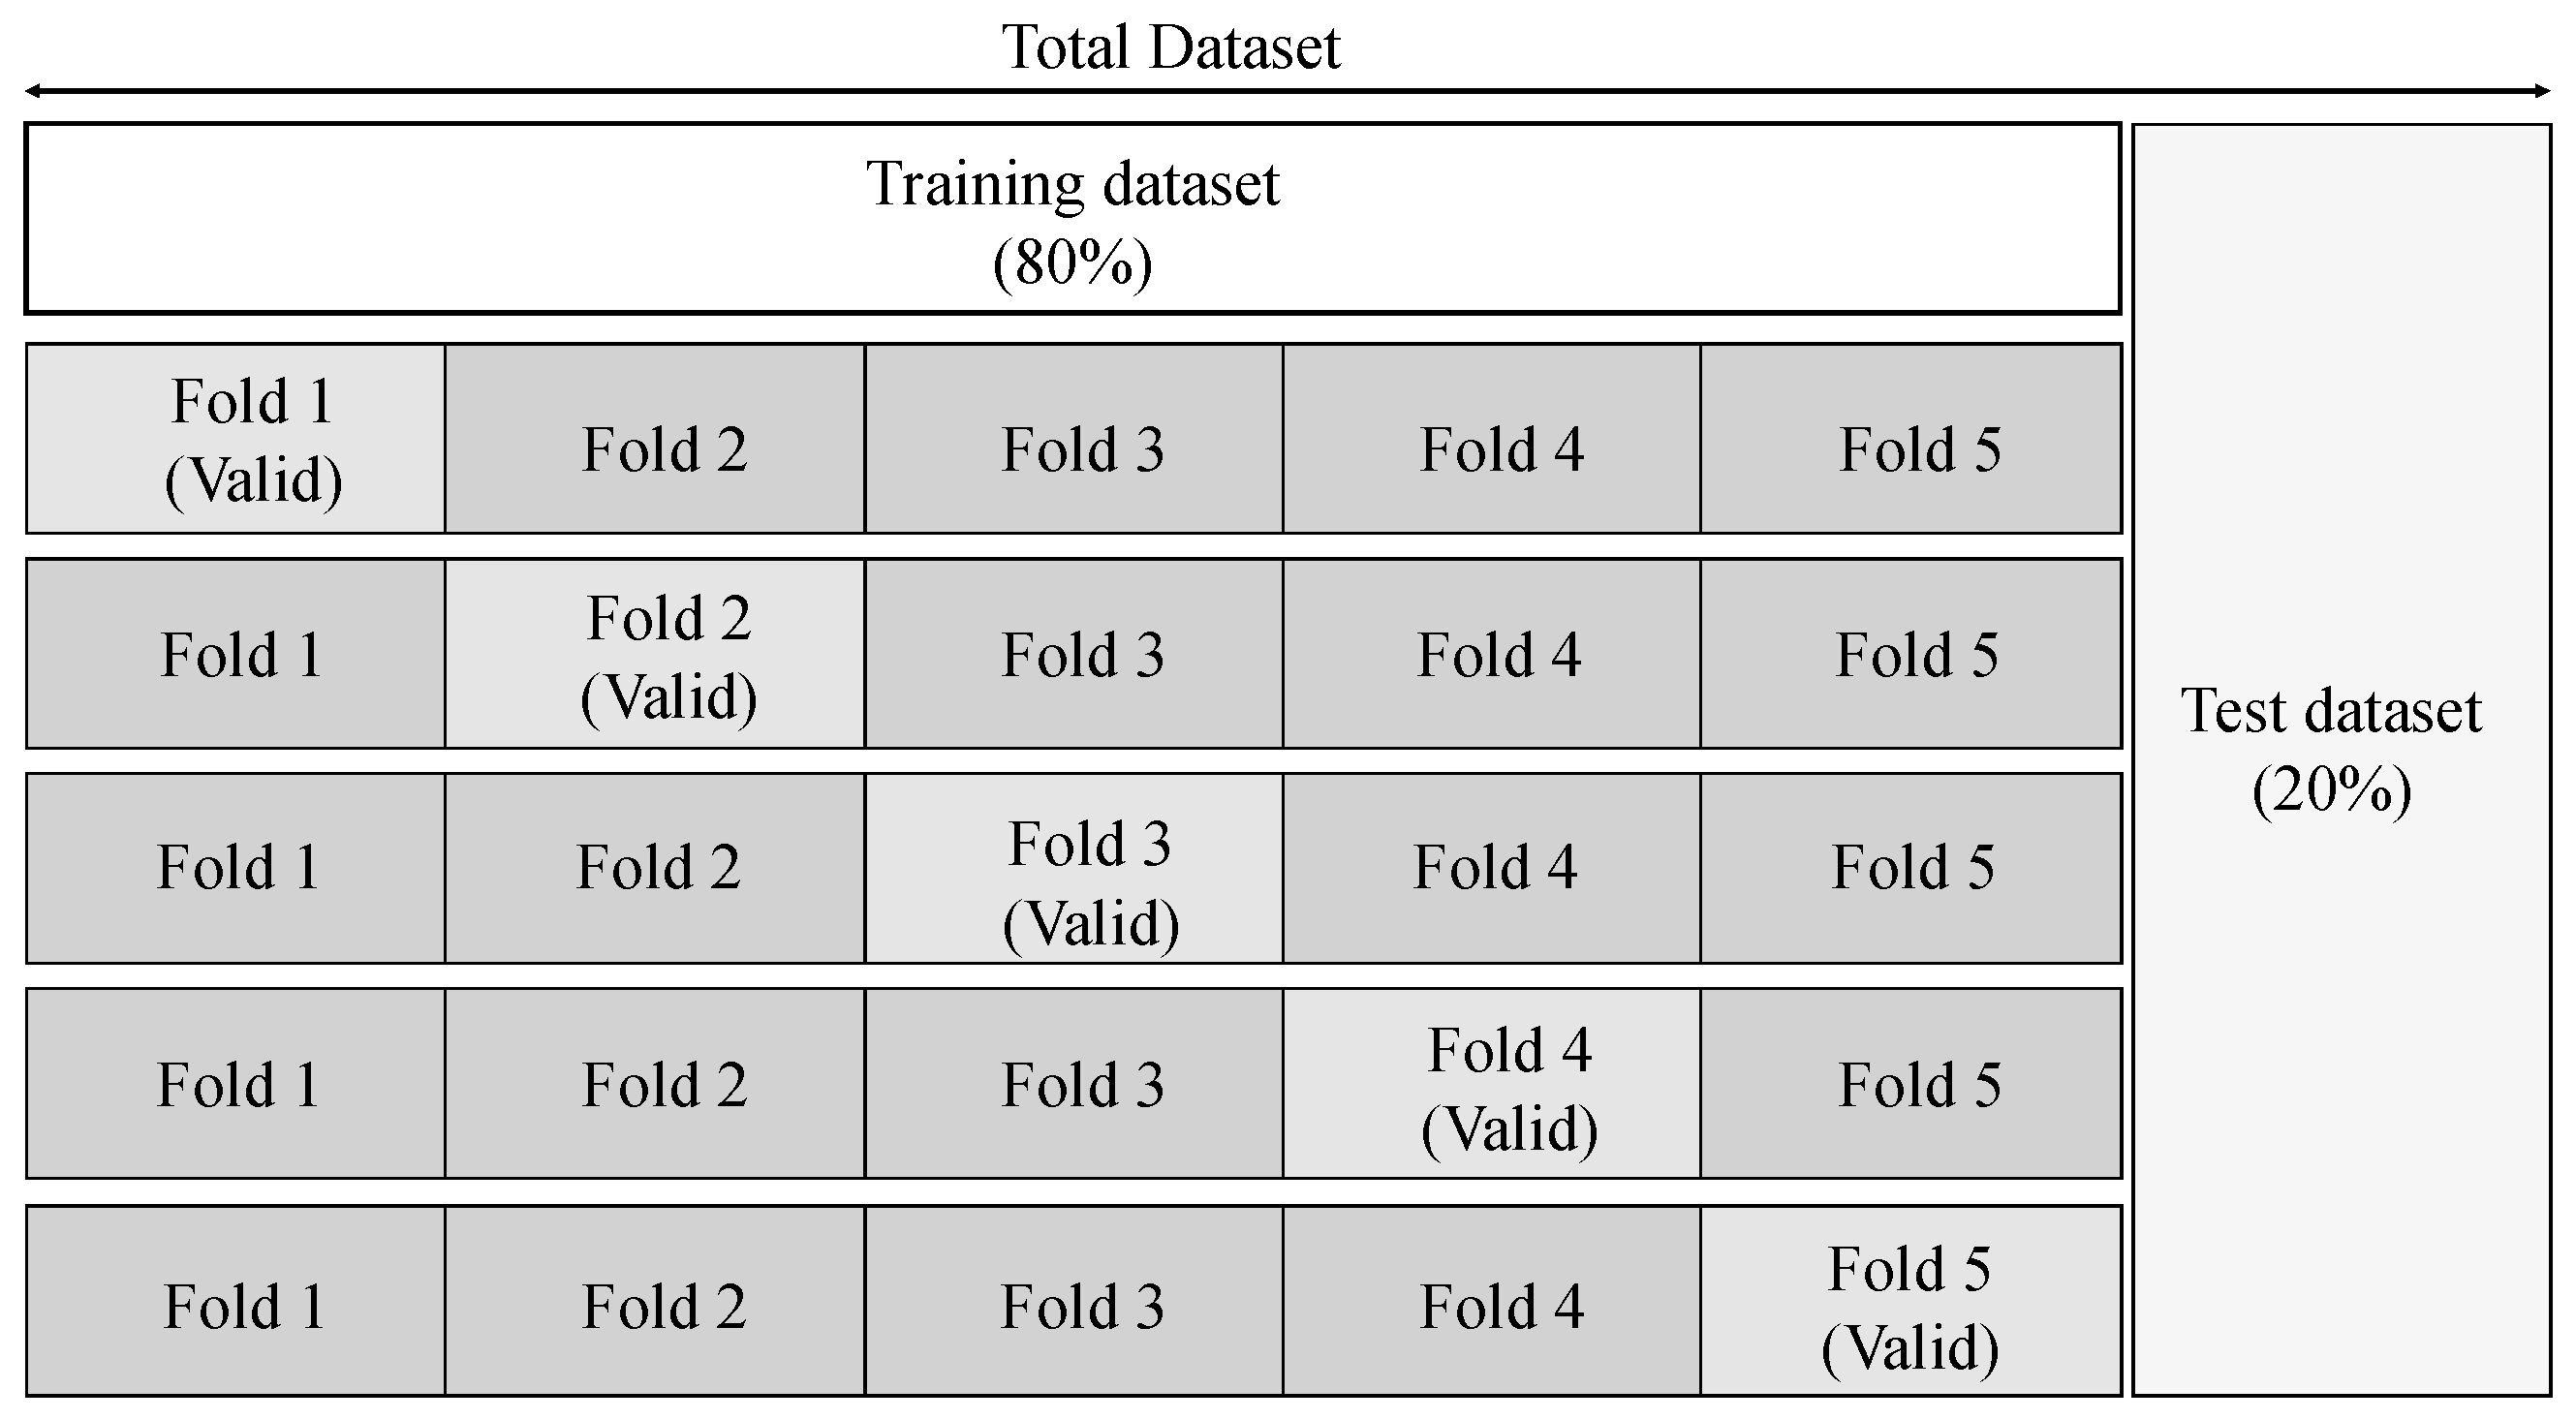
The indoor activity images and joint coordinate data were collected for three different purposes: training datasets, valid datasets for verification, and test datasets for final performance evaluation of the training model. The number of training and valid datasets was 44,800, which was 80% of the total number of datasets. The valid datasets for verification were used to determine the model parameters and the number of training repetitions. In addition, the test datasets were not used for training; rather, they were applied for final model performance evaluation. These datasets accounted for 20% (11,200 sets) of the total datasets (56,000 sets).
The K-fold cross-validation (KFCV) method was employed in the training and validation. KFCV is a verification method that divides the training datasets evenly into K folds, and each fold is used as training data and valid data alternately. KFCV prevents training performance inconsistency due to data sampling when the number of datasets is small, and it ensures the high reliability of the model. In this model, 20% of the training datasets were set as valid datasets to maintain the same percentage as the test datasets (20%), as shown in
Figure 7. The number of folds was set to K = 5 for the training. For the accuracy, the average value after five training cycles was used.
The pose classification model was developed using Python and TensorFlow, the latter of which is an open-source software library developed by the Google Brain Team for numerical calculations. The training was repeated 5000 times for each model, and models with the lowest error rate of valid datasets were saved.
3. Result of Model Optimization and Performance Analysis of the Pose Classification Model
Based on the basic structure and parameters of the model mentioned in
Section 2.2.2, the optimization and performance analysis of the pose classification model was performed. The performance was evaluated through experiments in a mockup laboratory where actual indoor environments were simulated.
3.1. Result of Model Optimization
The optimal hidden-layer structure of the model was determined according to the pose classification accuracy (%) derived from the training results. To determine the optimal structure during training, the following 10 common indoor activities presented by ASHRAE [
19] were performed: “sleeping,” “reclining,” “seated.quiet,” “standing.relaxed,” “typing,” “writing,” “reading.seated,” “filing.seated,” “filing.stand,” and “walking about.”
The training proceeded with the adjustment of the NHL and NHN for the structure of the optimal model. Neural-network nodes may show different characteristics and performance levels depending on their structure and shape [
21]. Thus, the hidden layer of the model was established with various node structures and shapes of the neural network. As shown in
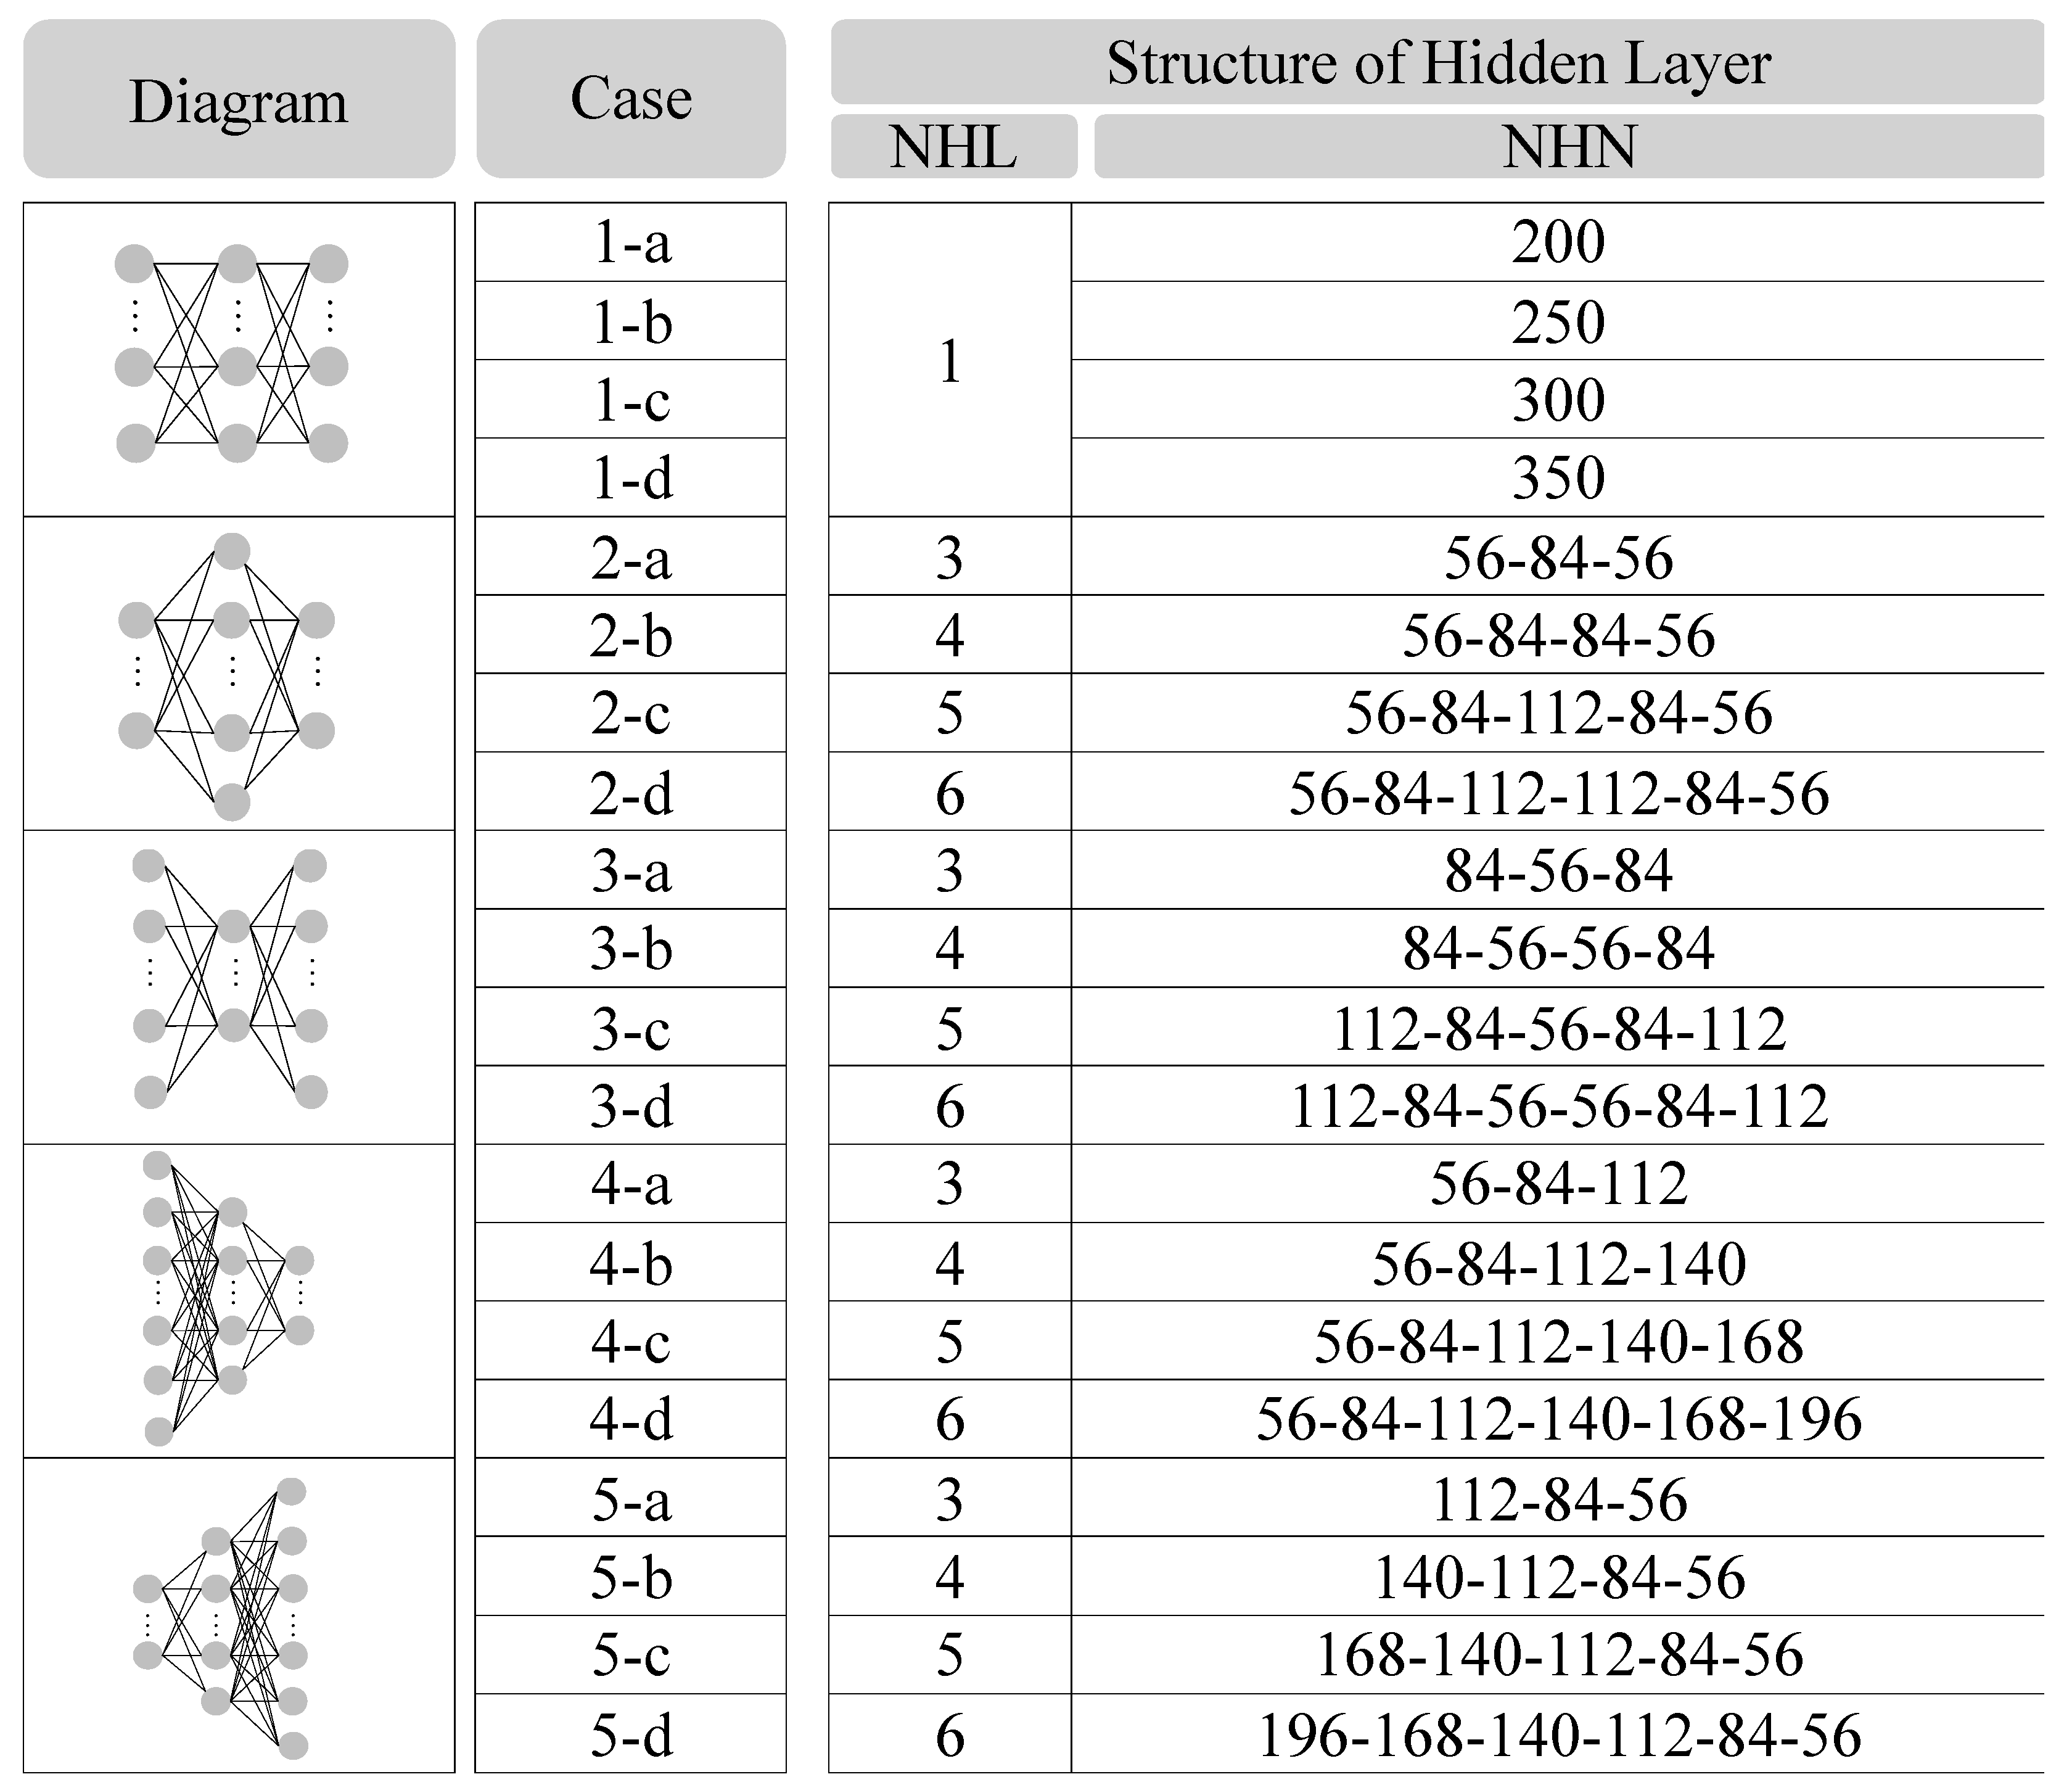
Figure 8, 20 models were tested for the model optimization. The NHL was 3–6 in cases 2–5 and 1 in case 1, yielding various shapes. The diagram in
Figure 8 shows the suggested hidden-layer structure shapes. The NHN for cases 2–5 was set as multiples of 28 input neurons. The training was performed on a total of 20 models with 5 cases (cases 1–5) depending on the hidden-layer shape, and four detailed cases with different NHNs were applied.
The training performance of each hidden-layer structure was verified for the 10 indoor activities. For model optimization, the pose classification model was trained with the joints data that is the output of the joint recognition model as an input data. For each case of the pose classification model, five-fold cross validation was implemented. The size of the training datasets was maintained as 80% of the entire data. The accuracy verified in the training of each hidden-layer structure is shown in
Table 5. Specifically,
Table 5 shows the average accuracy of each model derived in five cycles of five-fold cross validation. As shown, the average accuracy of the models was between 77.14% and 82.03%, and the maximum difference was approximately 4.9%. The model with the highest average accuracy was case 5-b. Its structure consisted of four hidden layers and 140-112-84-56 hidden neurons. The average accuracy was 82.03%.
Accordingly, the optimal structure of the pose classification model was set as follows: an input layer with 28 input neurons, four hidden layers with 140-112-84-56 hidden neurons, and an output layer with one output neuron.
The optimized model was respectively applied to the home and office indoor environments and adapted to each environment using new training process. Five-fold cross validation was applied again for training four activities (sleeping, reclining, seated.quiet, and standing.relaxed) in the home environment and three activities (seated.quiet, standing.relaxed, and typing) in the office environment.
The accuracy of each training step for the home and office indoor activities was measured with the five valid datasets. After approximately 2000 training cycles, the accuracy of both the home and office valid datasets reached 100%. When measured after the training was completed, the accuracy of the test datasets was 100% for both home and office activities.
3.2. Performance Evaluation of Pose Classification for Home and Office Environments
A mockup experiment was conducted to evaluate the performance of the pose classification model in various actual indoor environments. This experiment was performed after the developed Model 2 was combined with Model 1. As explained earlier in
Figure 3, the mockup experiment was conducted in rooms 1 and 2, where home and office environments were simulated, respectively. Home and office activity images of the occupants were collected using the camera and transmitted to the server in real time. These images were used as input data, and the occupant pose was then determined using the joint recognition model (Model 1) and the pose classification model (Model 2). A total of 720 datasets were newly collected over 1 h, at intervals of 5 s, for each indoor activity in the mockup laboratory. Six test subjects, summarized in
Table 6, participated in the experiment and shared 10 min for each activity.
The comparative analysis process was conducted for investigating the performance of the developed model. The metabolic rates corresponding to the classified occupant poses for the dynamically changing activities were compared with those of the fixed poses, which were generally applied for building thermal conditioning. Corresponding metabolic rates were obtained using the “Metabolic Rates for Typical Tasks” of ASHRAE 55 [
19]. The typical poses of the conventional method were set to “seated.quiet” (1.0 met) in the home, and “typing” (1.1 met) in the office.
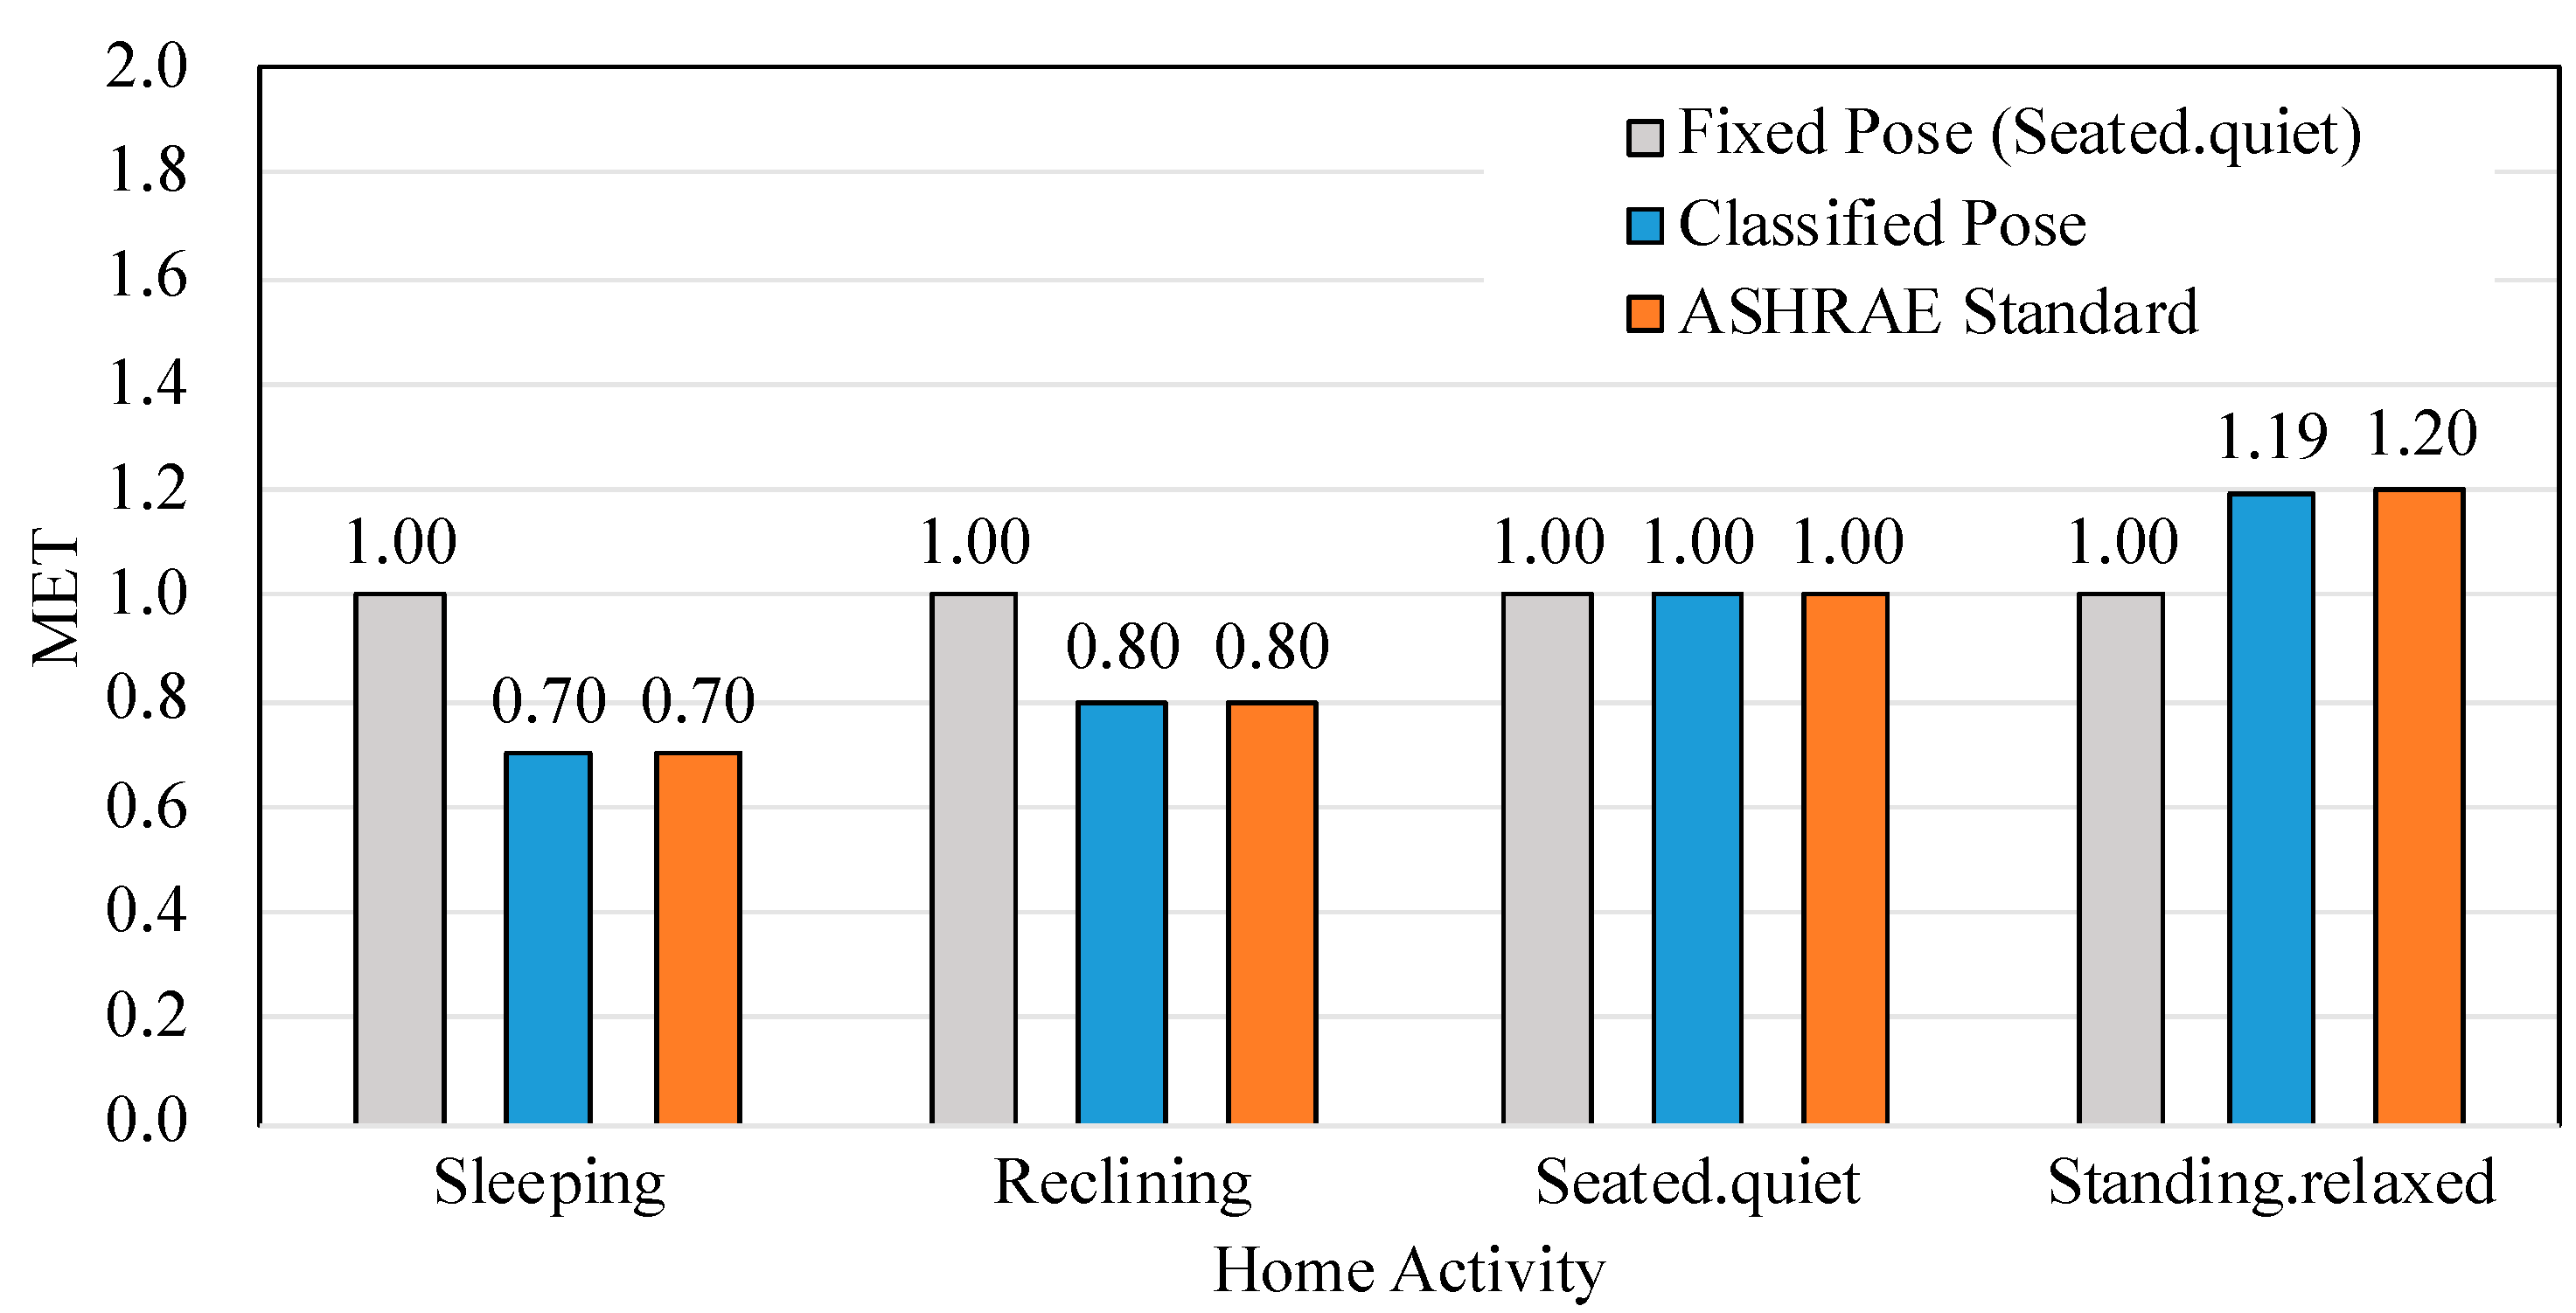
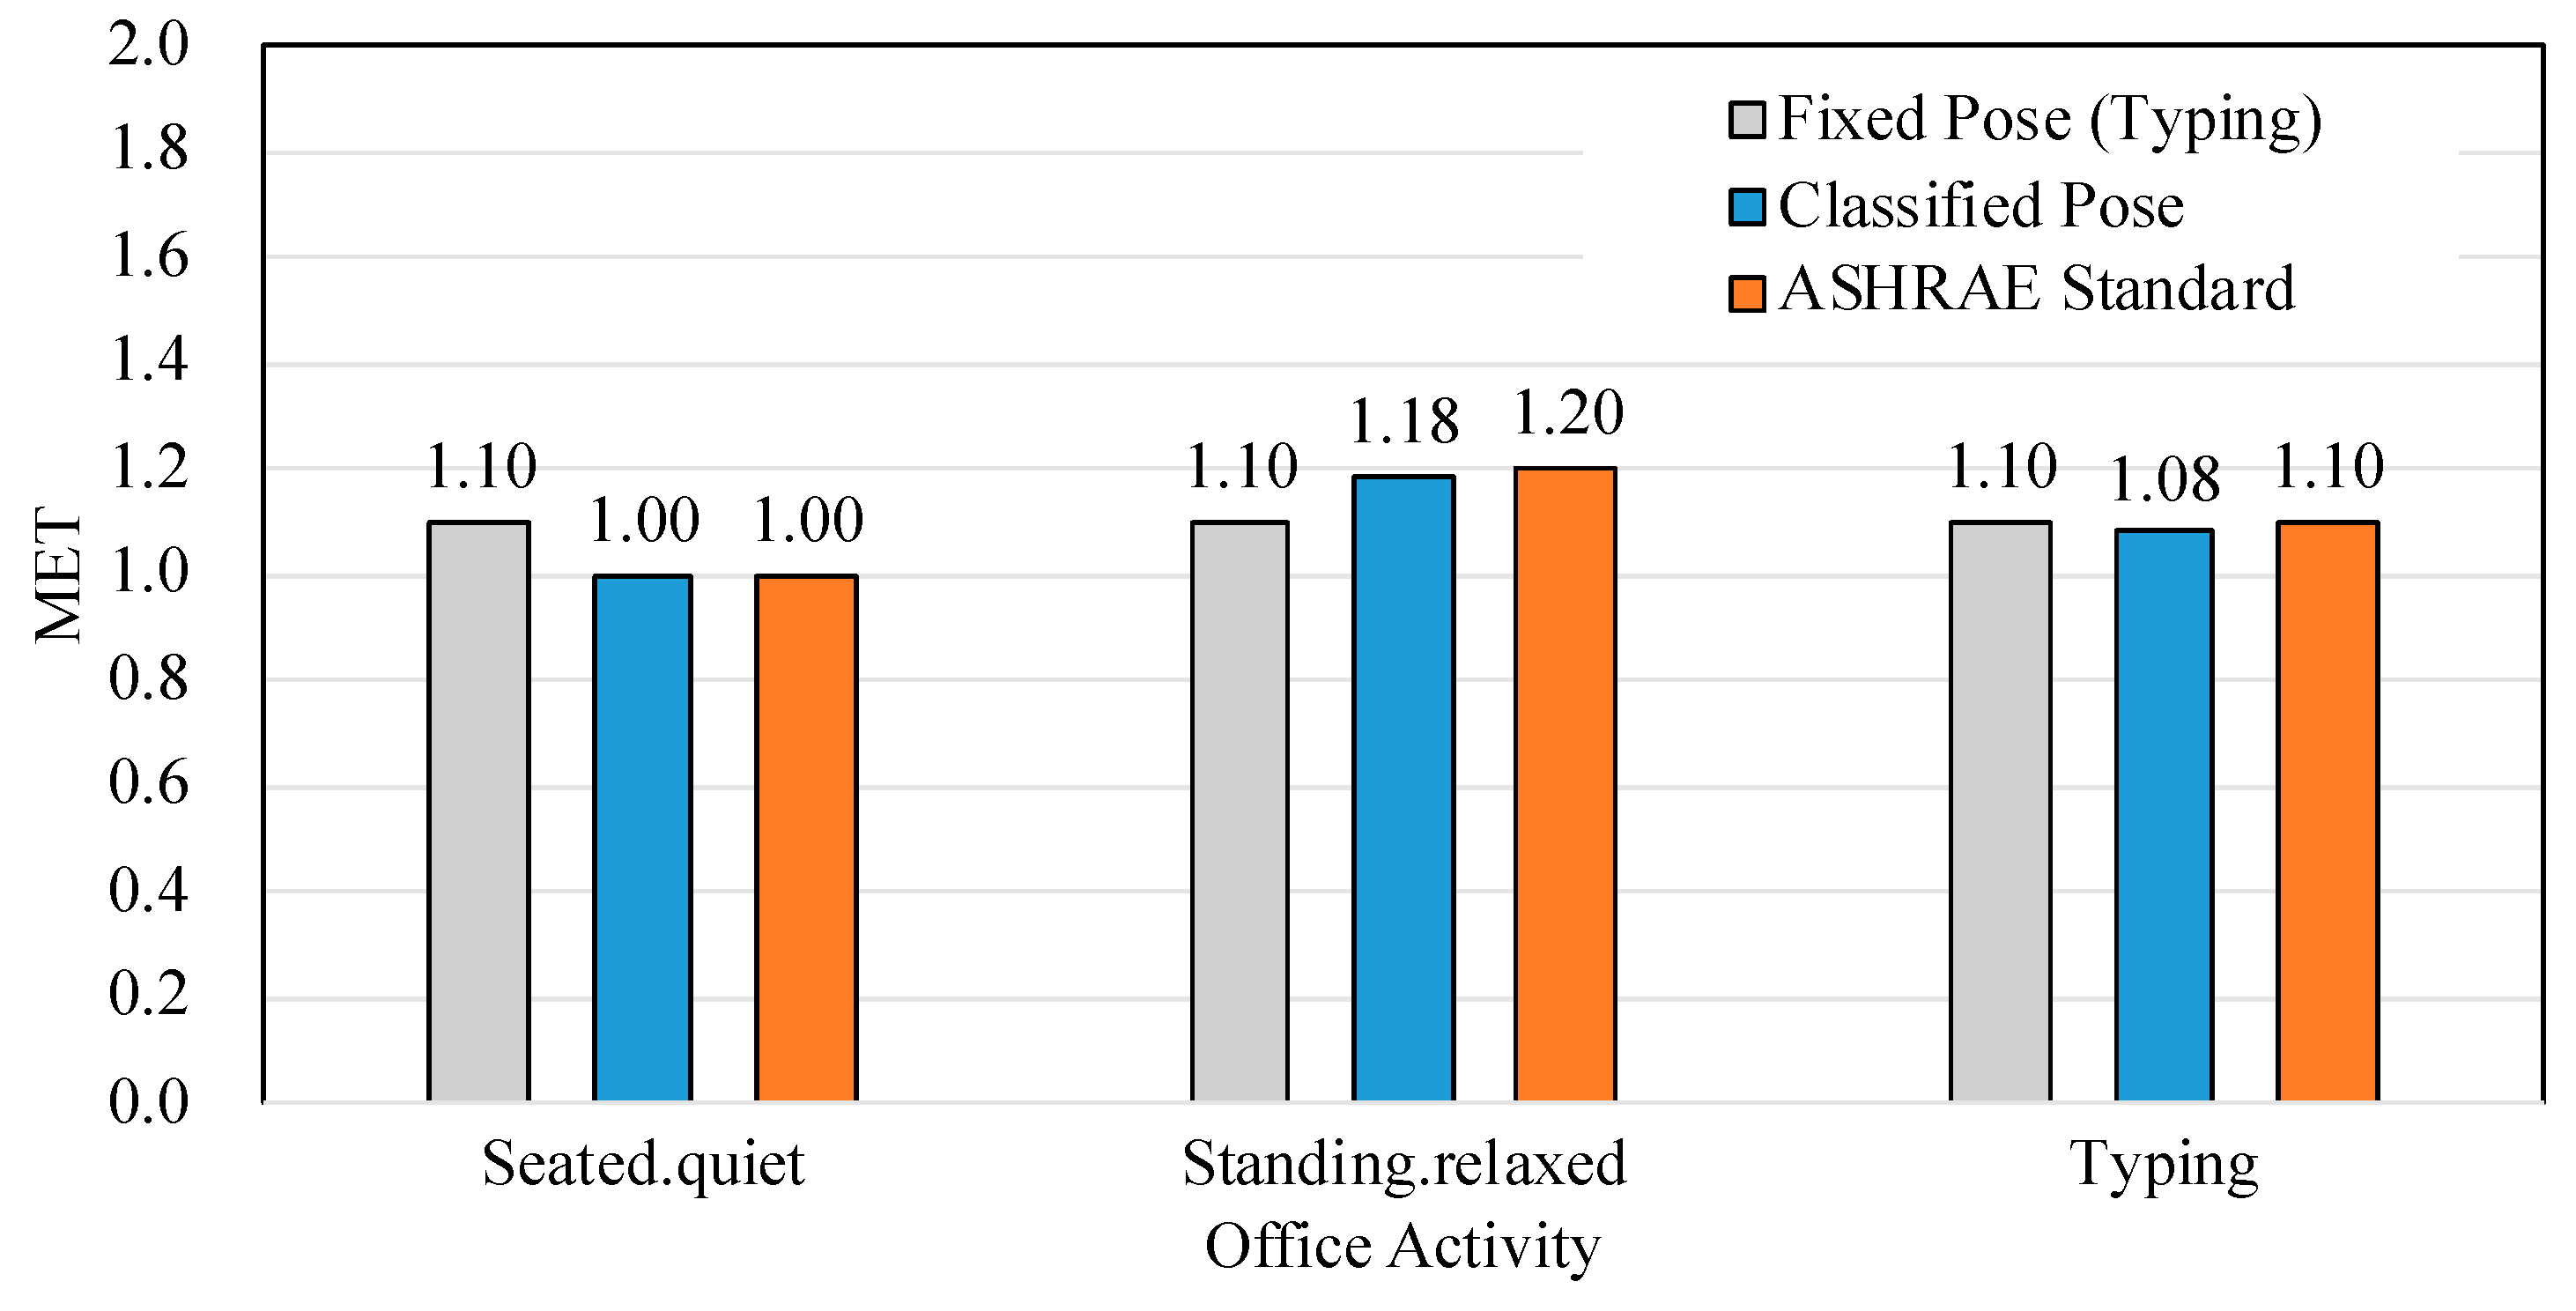
During the mockup experiment, home environments, including “sleeping,” “reclining,” “seated.quiet,” and “standing.relaxed,” and office environments, including “seated.quiet,” “standing.relaxed,” and “typing,” were evaluated. The evaluation results are presented in
Figure 9 for home environment and
Figure 10 for office environment and
Table 7. In
Figure 9;
Figure 10, the accuracy of the proposed method in this study is compared with the fixed method. In each figure, ASHRAE Standards refer to the correct answer.
Table 7a,b shows the average error rates of the two methods in comparison with the ASHRAE Standard values in home and office, respectively.
Table 7c shows the accuracy and performance enhancement in comparison with the accuracy of the fixed method for 1 h.
For the case of home activities, as shown in
Figure 9, the average of the corresponding metabolic rate using the pose classification model for “sleeping,” “reclining,” and “standing.relaxed” was 0.70, 0.80, and 1.19, respectively, which followed accurately the correct values of ASHARE. The performance was significantly improved compared with the fixed method, which was always 1.0. The average errors of the proposed method for “sleeping,” “reclining,” and “seated.quiet” in
Table 7a were 0.000, and that of “standing.relaxed” was 0.008. The main error in “standing.relaxed” was caused by categorizing the image as “seated.quiet”. This error is caused by the fact that the image is two-dimensional. When the front image of the occupant is taken, the joints location of the sitting and standing pose are similar. This problem can be solved by collecting and training various angle images of the occupant, as well as applying the object detecting model, which is currently developing in our research group for assisting in inferring the activity by recognizing objects. Nevertheless, the error rate here was significantly lower than that for fixed method.
For the case of office activities,
Figure 10 shows that the average corresponding metabolic rate values using the pose classification model for “seated.quiet” and “standing.relaxed” were 1.00 and 1.18, respectively, indicating that the performance was improved compared to that of the fixed method. In addition,
Table 7b shows that the error of the proposed method for “seated.quiet” and “standing.relaxed” was 0.000 and 0.015, respectively. These rates are lower than those of the fixed method. The most common error is the classification of “typing” as “seated.quiet”, which can be resolved by recognizing objects such as laptops and keyboards through the object detection model, which was mentioned in the upper paragraph.
The average error for “typing” was 0.02 met, which is higher than that of the fixed method, but the error was small enough and would have a negligible effect on the actual performance in application. However, in a future study, efforts must be directed toward improving the performance for office environments. The accuracy can be enhanced by increasing the model training data and performing model optimization.
Table 7c summarizes and compares the accuracy between the fixed and the proposed methods. The accuracies of the fixed method were 25.00% and 33.33% for the home and office environments, respectively, while those of the proposed method were 98.96% and 88.59%, respectively. Consequently, the accuracies of the proposed pose classification model improved to as much as 73.96% and 55.26% for home and office environments, respectively.
From the comparative analysis with the conventional fixed method, the pose classification model showed potential to work as a basis for acquiring the dynamically changing occupant activity conditions in real-time.
4. Conclusions
In this study, an intelligent method for classifying occupant pose in real-time was developed using a deep neural network model. The deep neural network model was designed to classify the sedentary activity in the home and office environment. The major findings of the development process are summarized as follows.
- (1)
To determine the optimal structure of the pose classification model, 10 common indoor activities were trained for, and the hidden-layer structure with the highest classifying accuracy was selected. The finalized optimal structure of the pose classification model consisted of an input layer with 28 input neurons and 14 pairs of joint coordinate values, four hidden layers with 140-112-84-56 neurons, and an output layer with one output neuron.
- (2)
The optimized model respectively adapted to home and office environments. After the training process for each environment, the accuracy of both the valid and test datasets was 100%.
- (3)
A mockup experiment was conducted to evaluate the performance of the pose classification model based on occupant actual images. The error rates of the pose classification model was 0.000 for “sleeping,” “reclining,” and “seated.quiet” and 0.008 for “standing.relaxed” in the home environment, and 0.000, 0.015, and 0.020 for “seated.quiet,” “standing.relaxed,” and “typing” in the office environment. Except for the error for “typing,” the error rates were significantly lower than those of the fixed pose. In the case of “typing,” the error of the metabolic rate estimation was insignificantly low, but it is necessary to improve the model performance in office environments.
- (4)
The accuracy of the pose classification model in terms of corresponding metabolic rate was remarkably improved compared to those of the conventional method. Improvements as much as 73.96% and 55.26% for home and office environment, respectively, were obtained.
The performance evaluation results show that in the home and office indoor environments, the performance of the pose classification model was significantly better than that of the fixed method. The pose classification model showed potential to work as a basis for acquiring the dynamically changing occupant activity conditions in real-time. In addition, since the relevant devices for monitoring occupant images and for computing process can be embedded as surrounding building components, the proposed pose classification model is expected to be more practically applicable to the building in a simpler manner.
Further studies are warranted regarding diverse issues. In this study, the pose classification model was developed for limited types of indoor activities. It is necessary to expand the scope of activity classification to various activities on the basis of this model. In addition, it is necessary to develop a model that detects objects in the image and the process of combining the object detecting model with the pose classification model. An object detection model can better distinguish activities of the occupant, such as writing or typing by recognizing objects used by the occupants. Furthermore, the problem in case the body of the occupant is occluded by objects can be solved by detecting the object and estimating the partial pose by the combined model. For this purpose, the scope of considered indoor activities should be expanded, and corresponding image datasets should be collected for enhancing the model performance. In addition, a method for classifying poses of multi-occupants needs to be developed. For this, a detecting and discriminating algorithm of occupants will be investigated in a further study.
A method for deriving the representative pose for a certain period also needs to be investigated. The time-based accumulated pose types will be more meaningful to supply the indoor thermal evaluation. In addition, based on the posture estimating method proposed in this study, a further study is warranted to develop the image-based strategy, which can find not only the activity, but also gender, age, BMI (body mass image builder), race, psychological condition, etc. for estimating the actual individual metabolic rate. This individualized metabolic rate will be used to calculate the PMV, which will be used as a target for the thermal conditioning. Lastly, a comparative performance analysis of accuracy among the image based personalized metabolic rate and the heart rate- and oxygen consumption-based methods is also required in the future.


