Factors Affecting Energy Performance of Large-Scale Office Buildings: Analysis of Benchmarking Data from New York City and Chicago


Abstract
:
1. Introduction
2. Materials and Methods
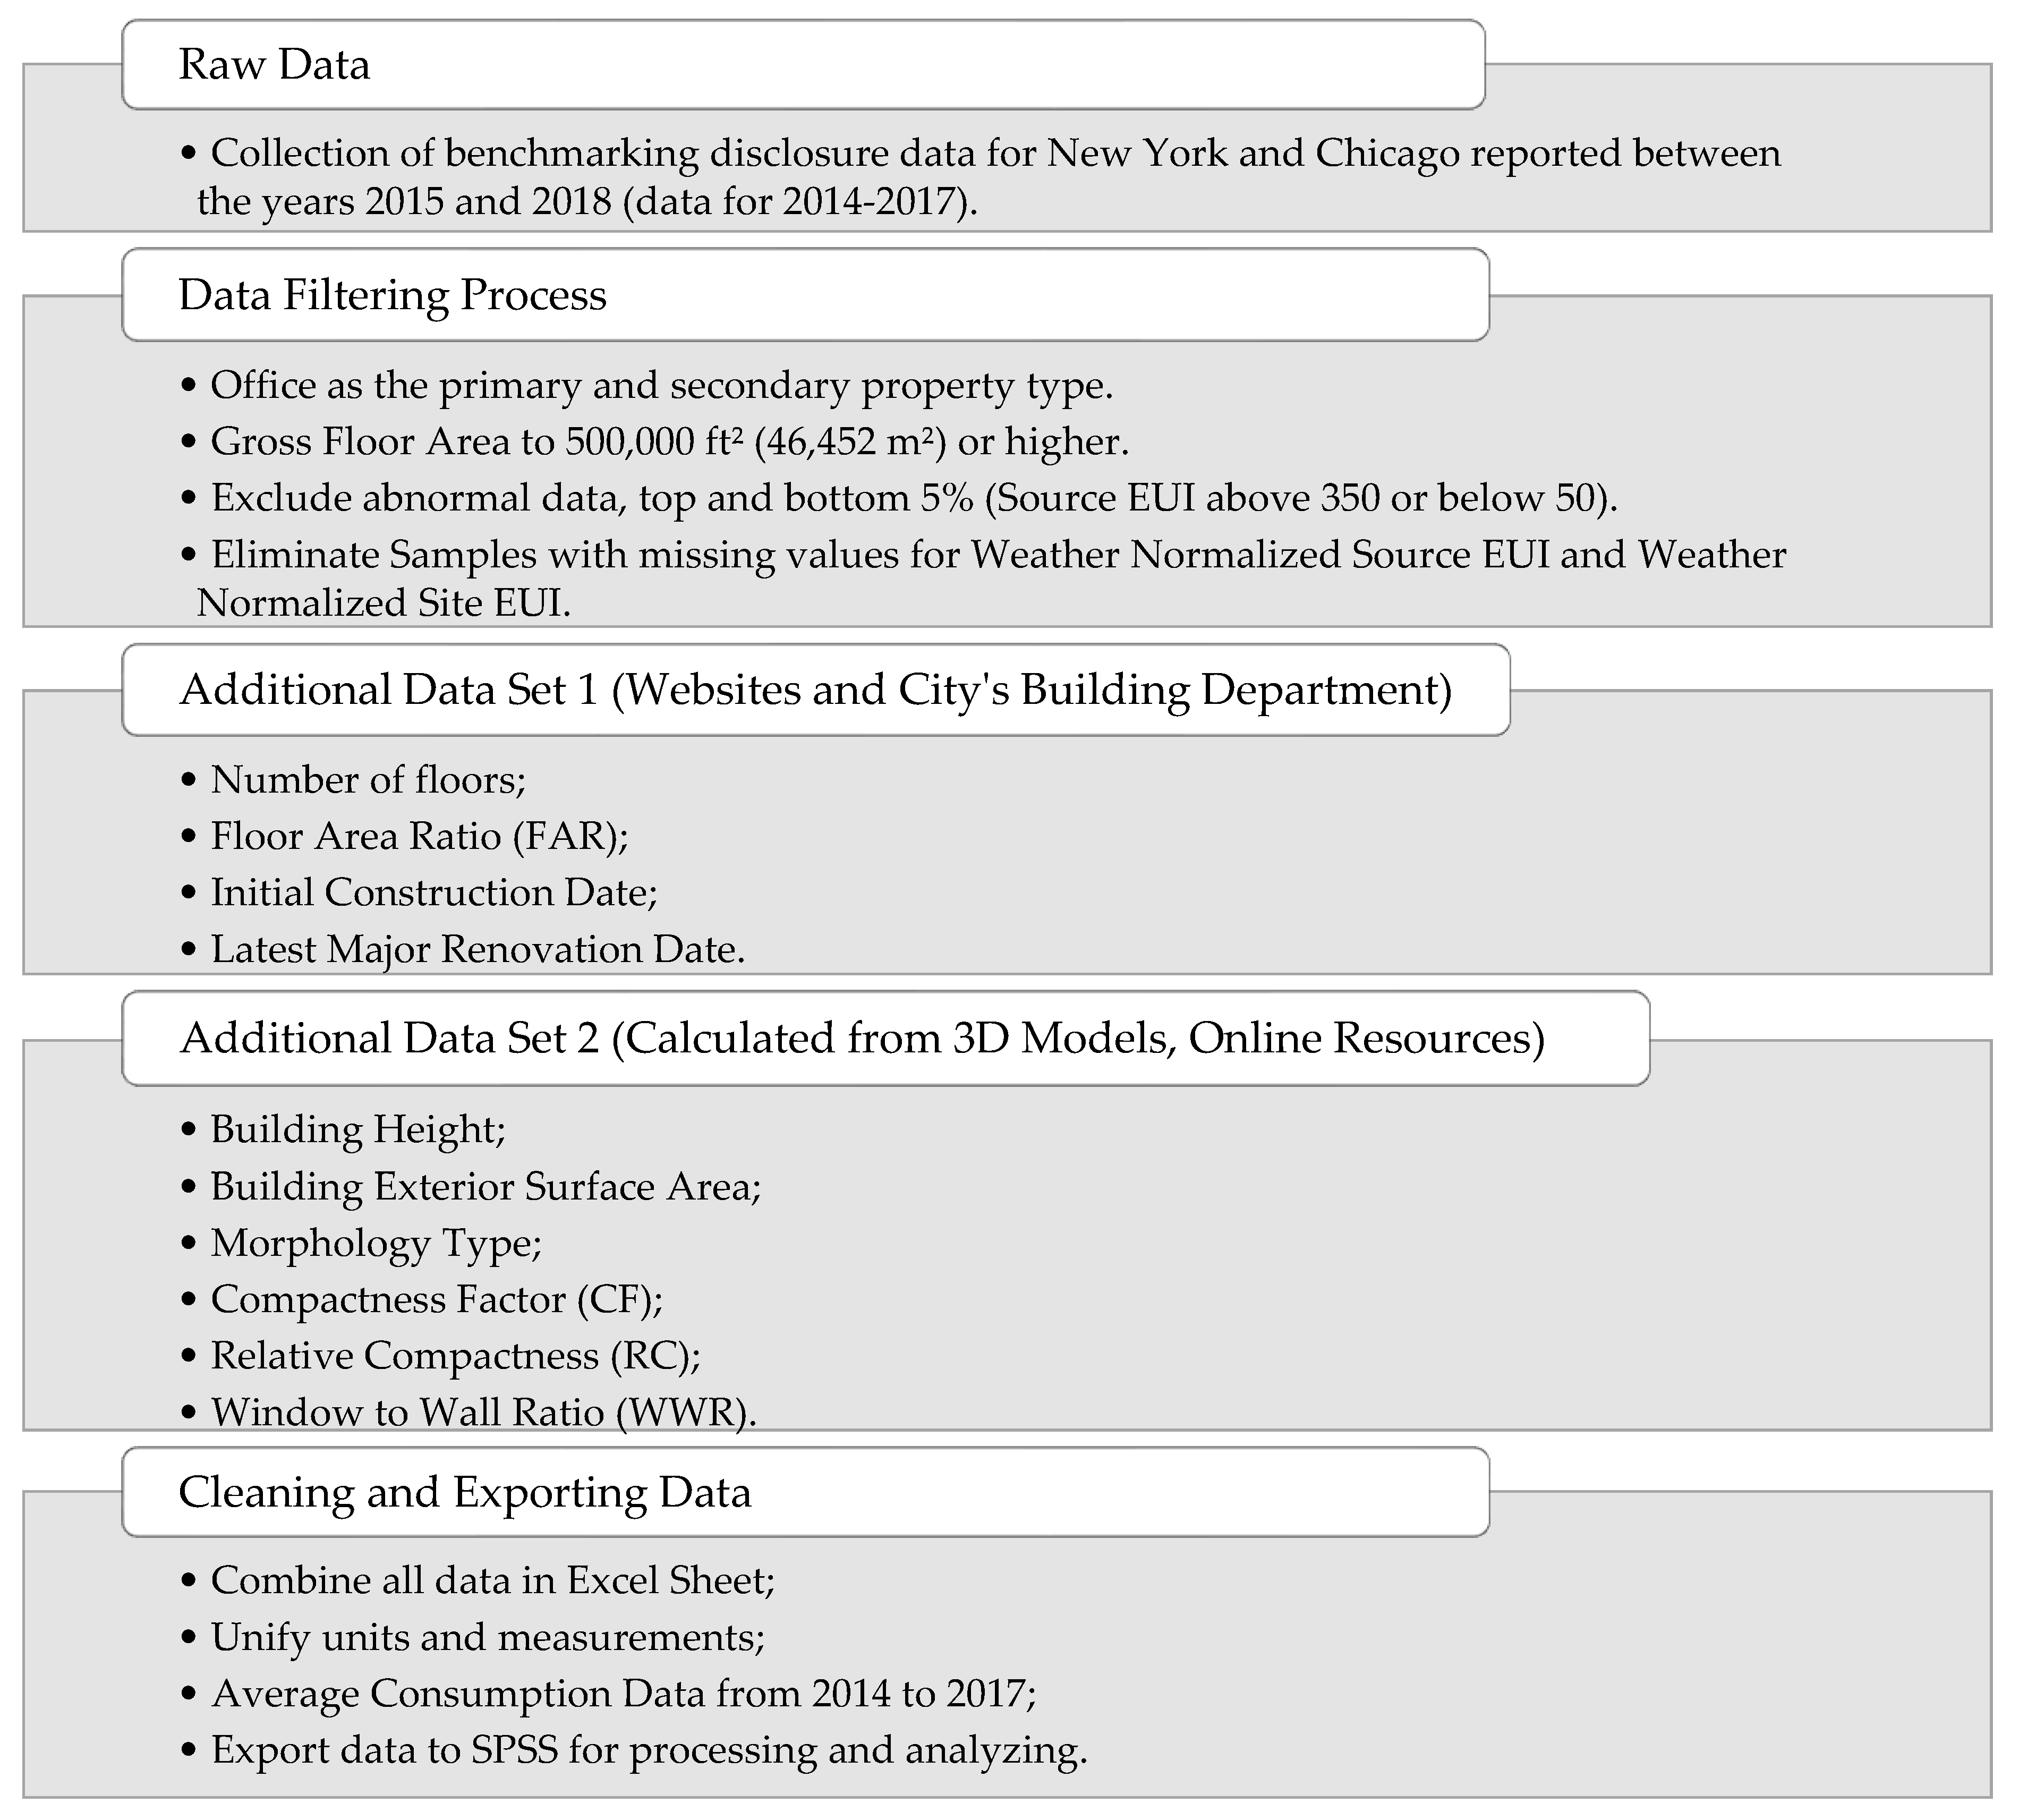
2.1. Data Sources and Preparation
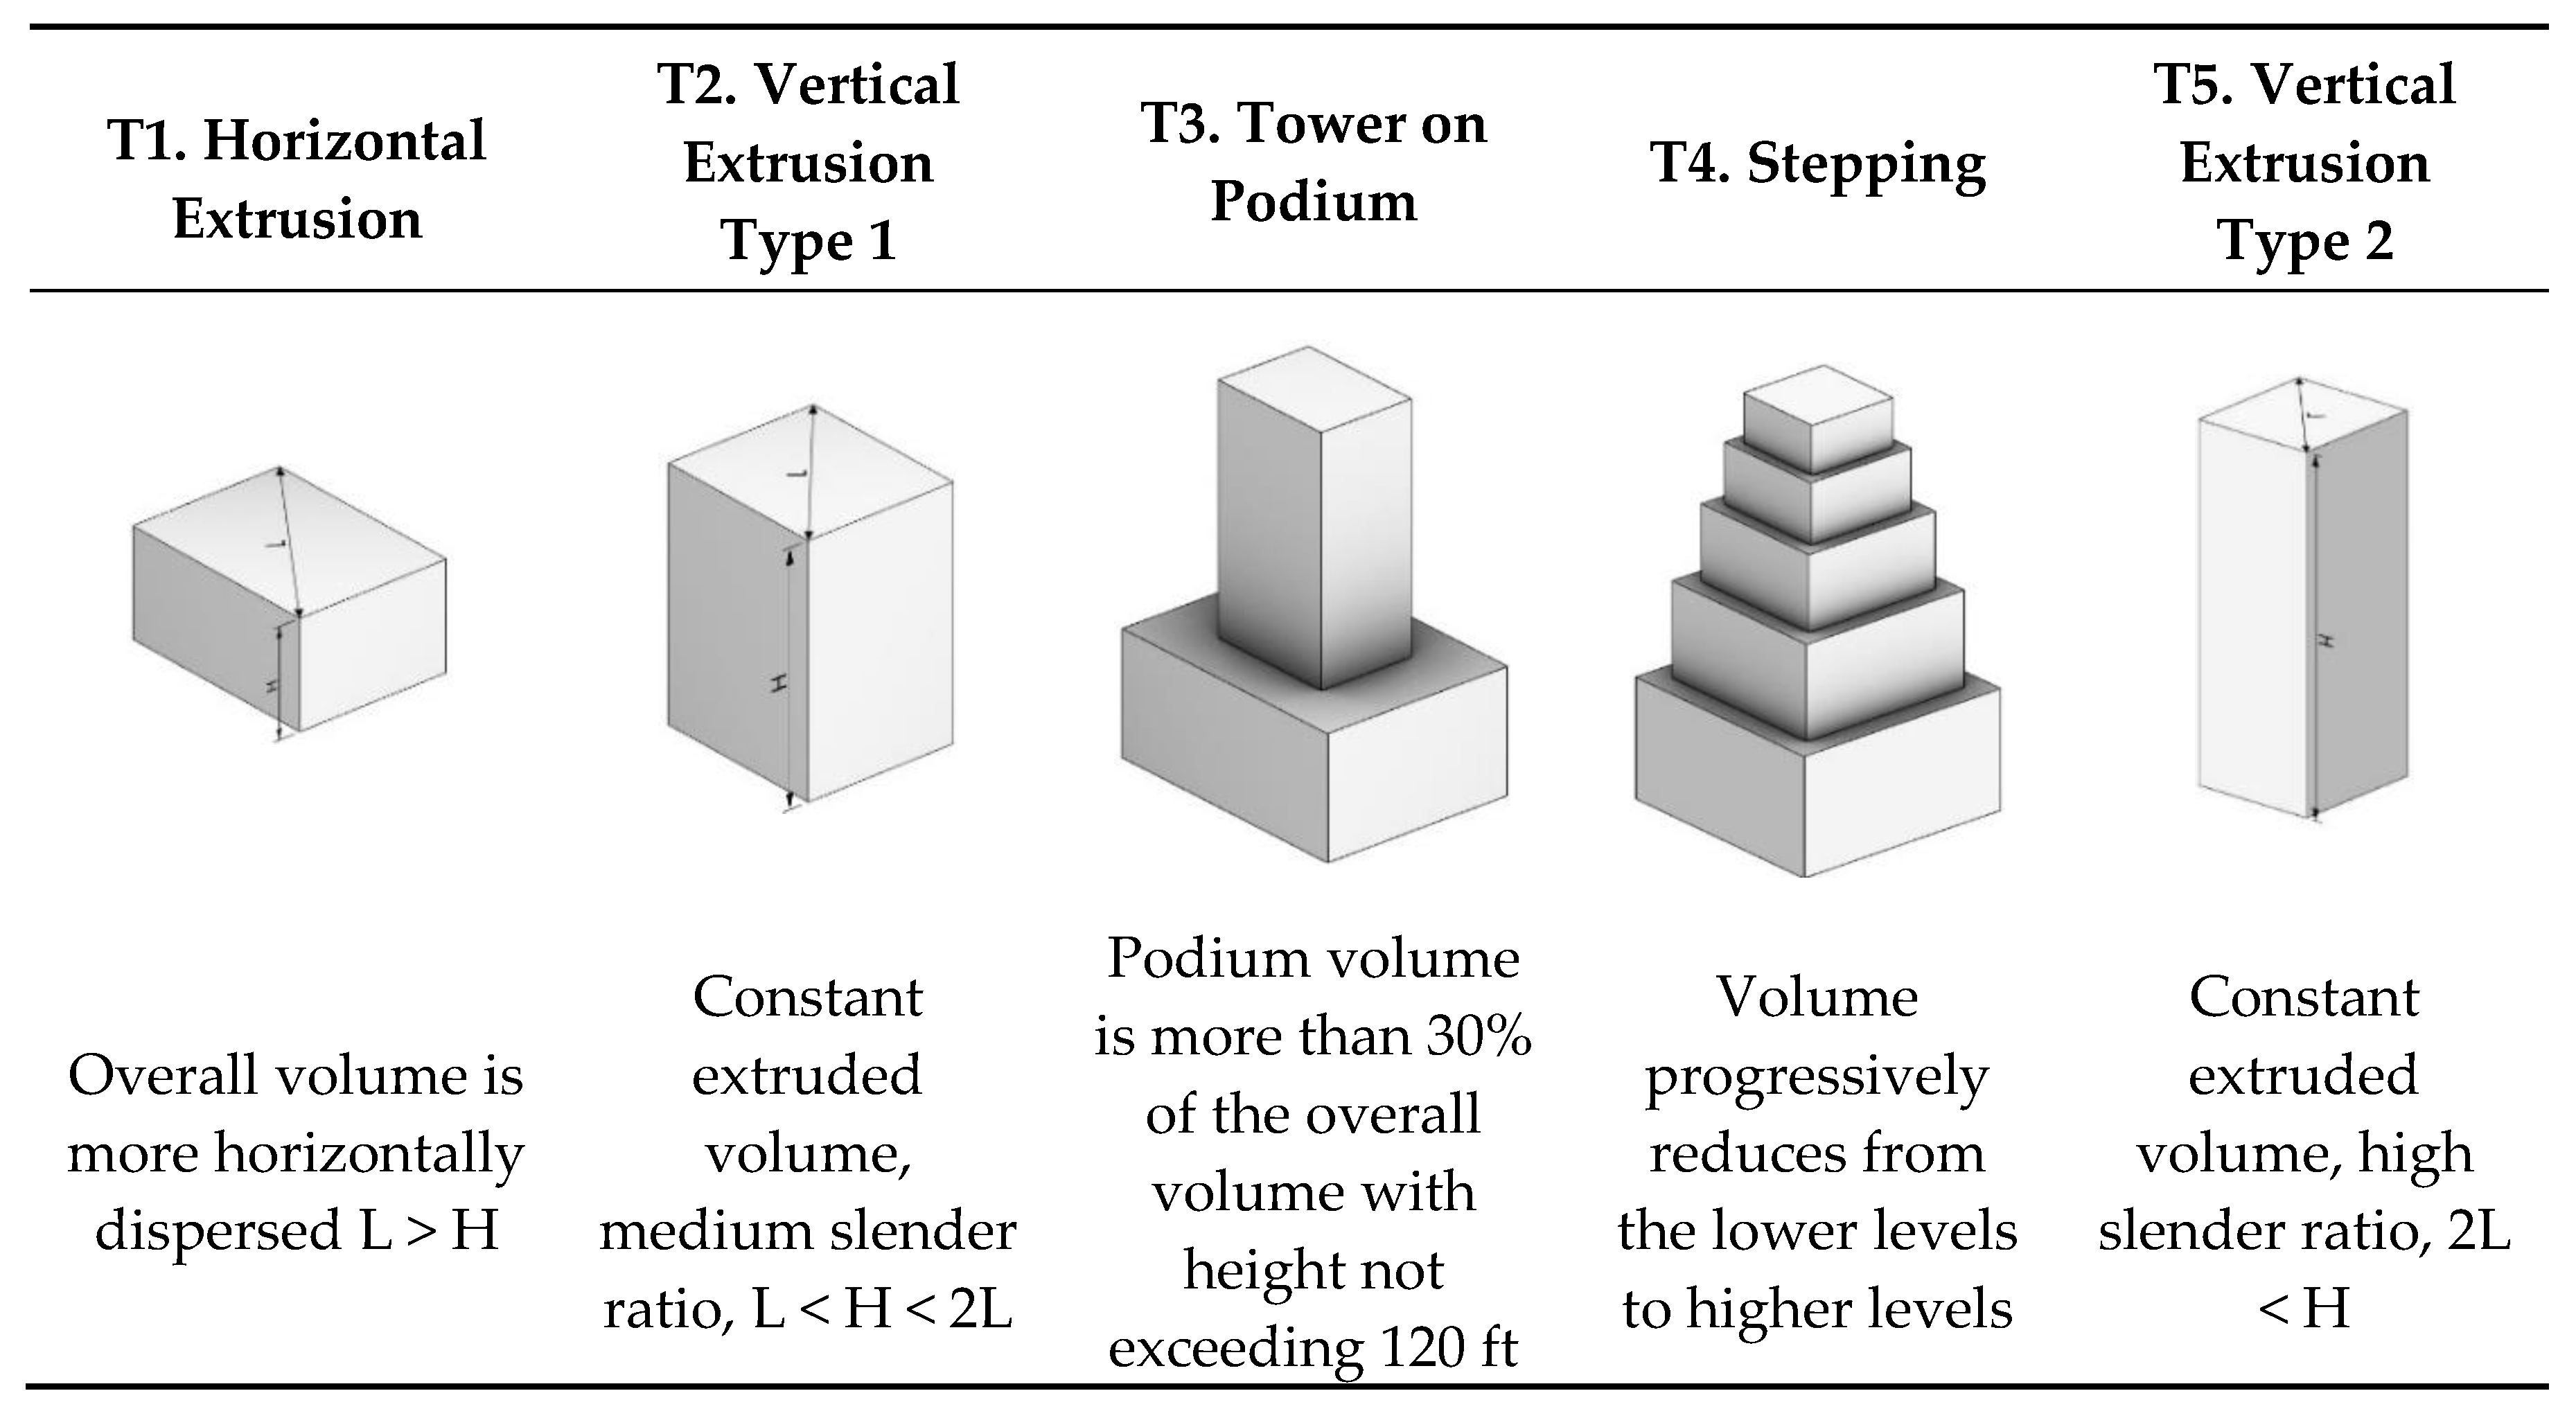
2.2. Physical Variables
2.3. Descriptive Data
2.4. Method: Multiple Regression Analysis and Spearman Correlation
3. Results and Discussion
3.1. Correlation Results between Variables
3.2. Multiple Regression Analysis
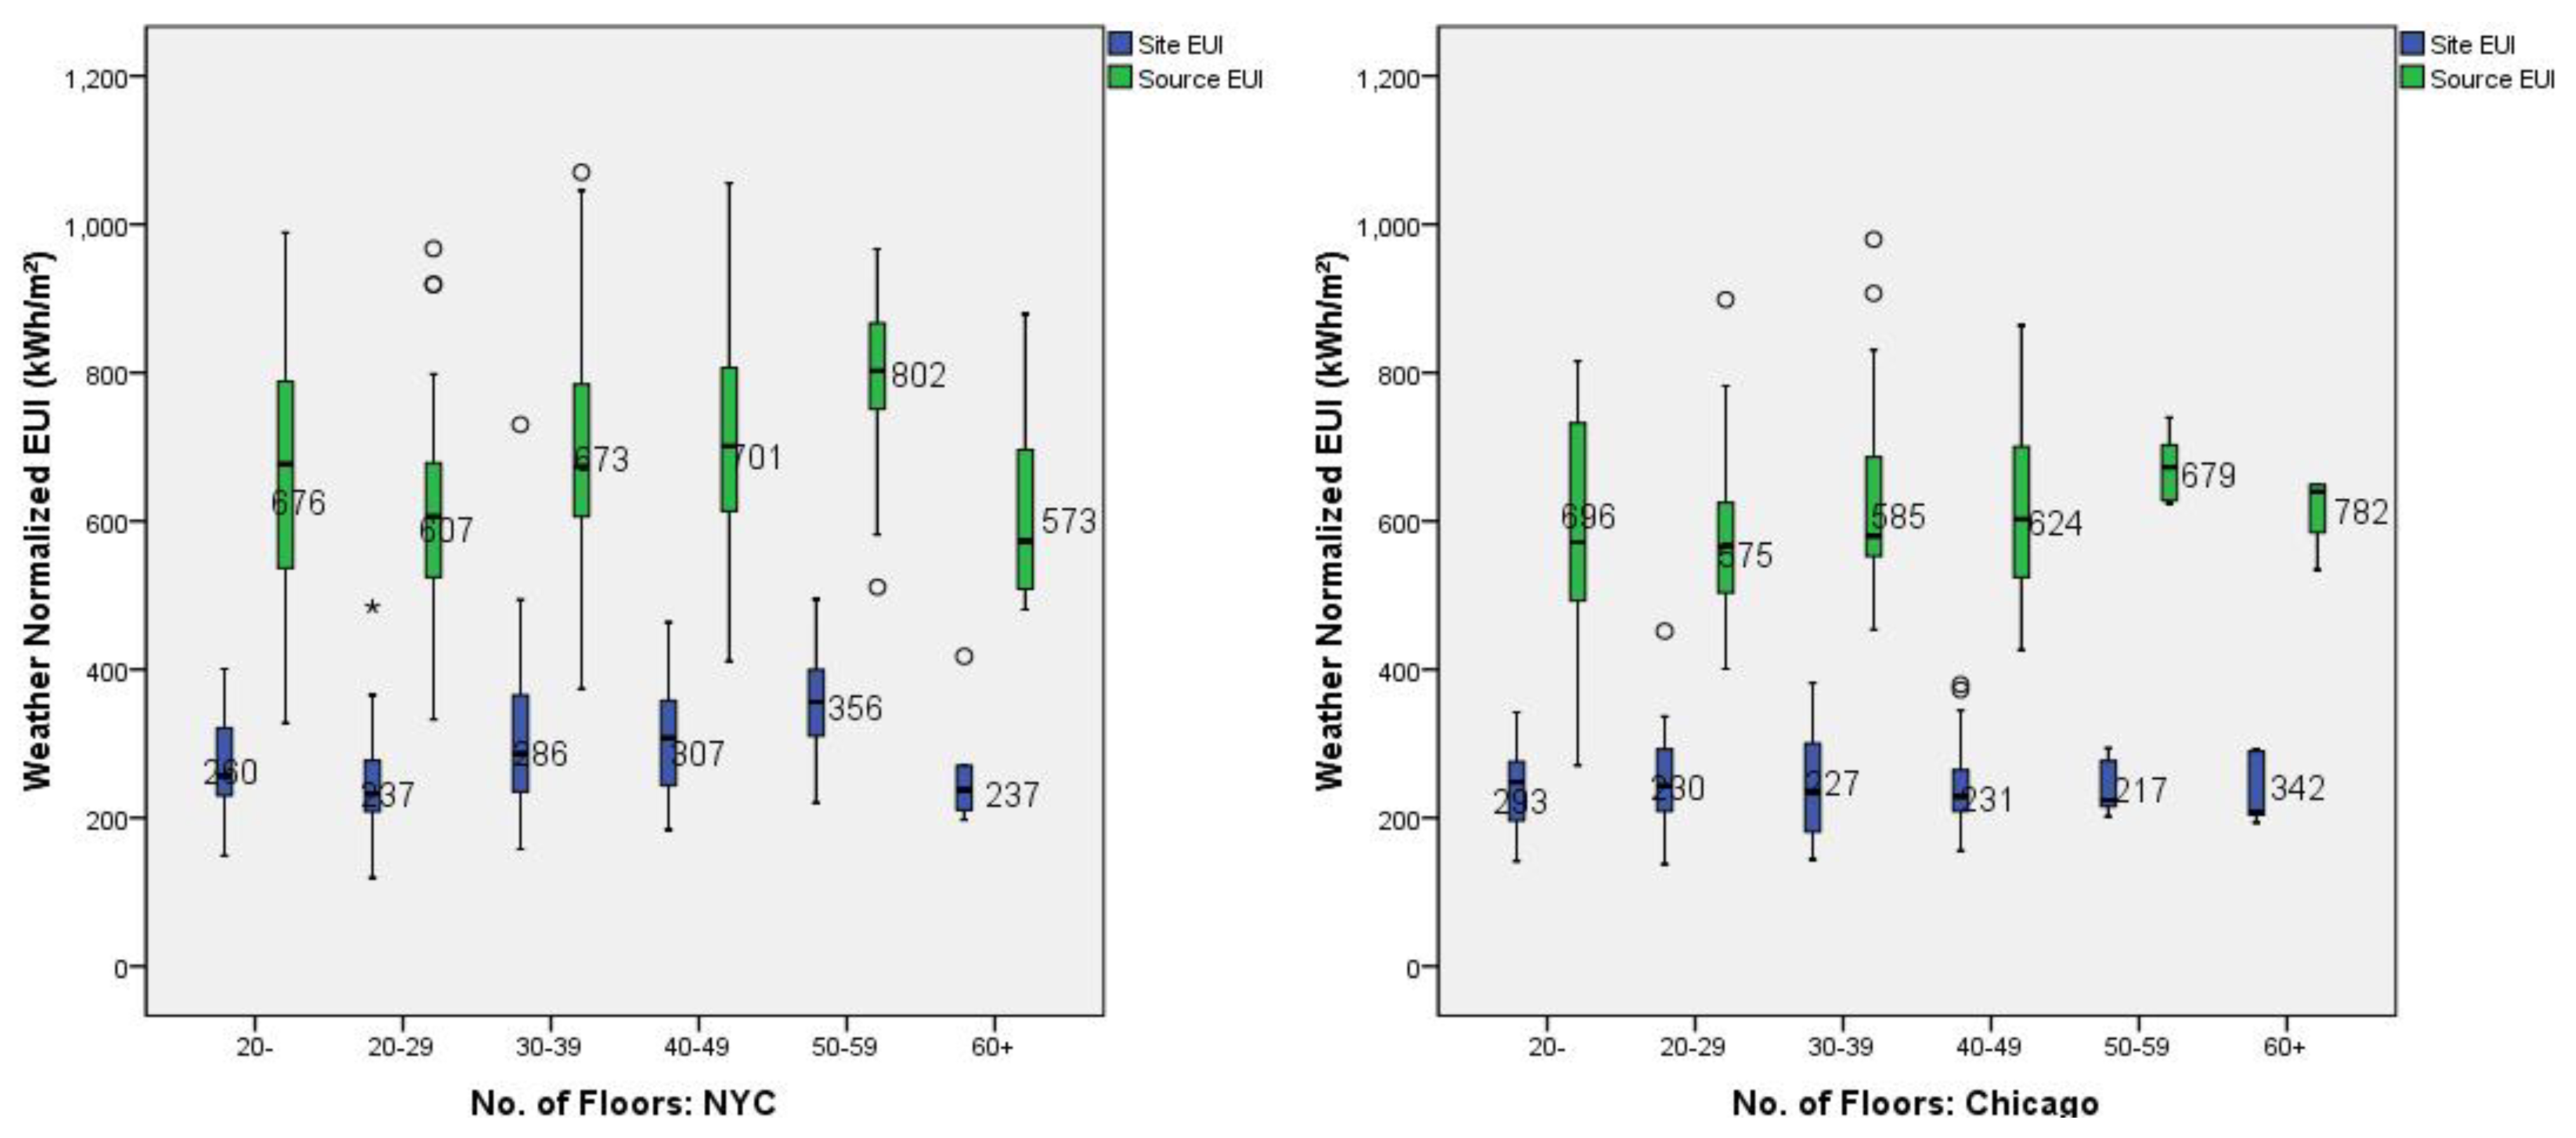
3.2.1. Number of Floors and Energy Use Intensity
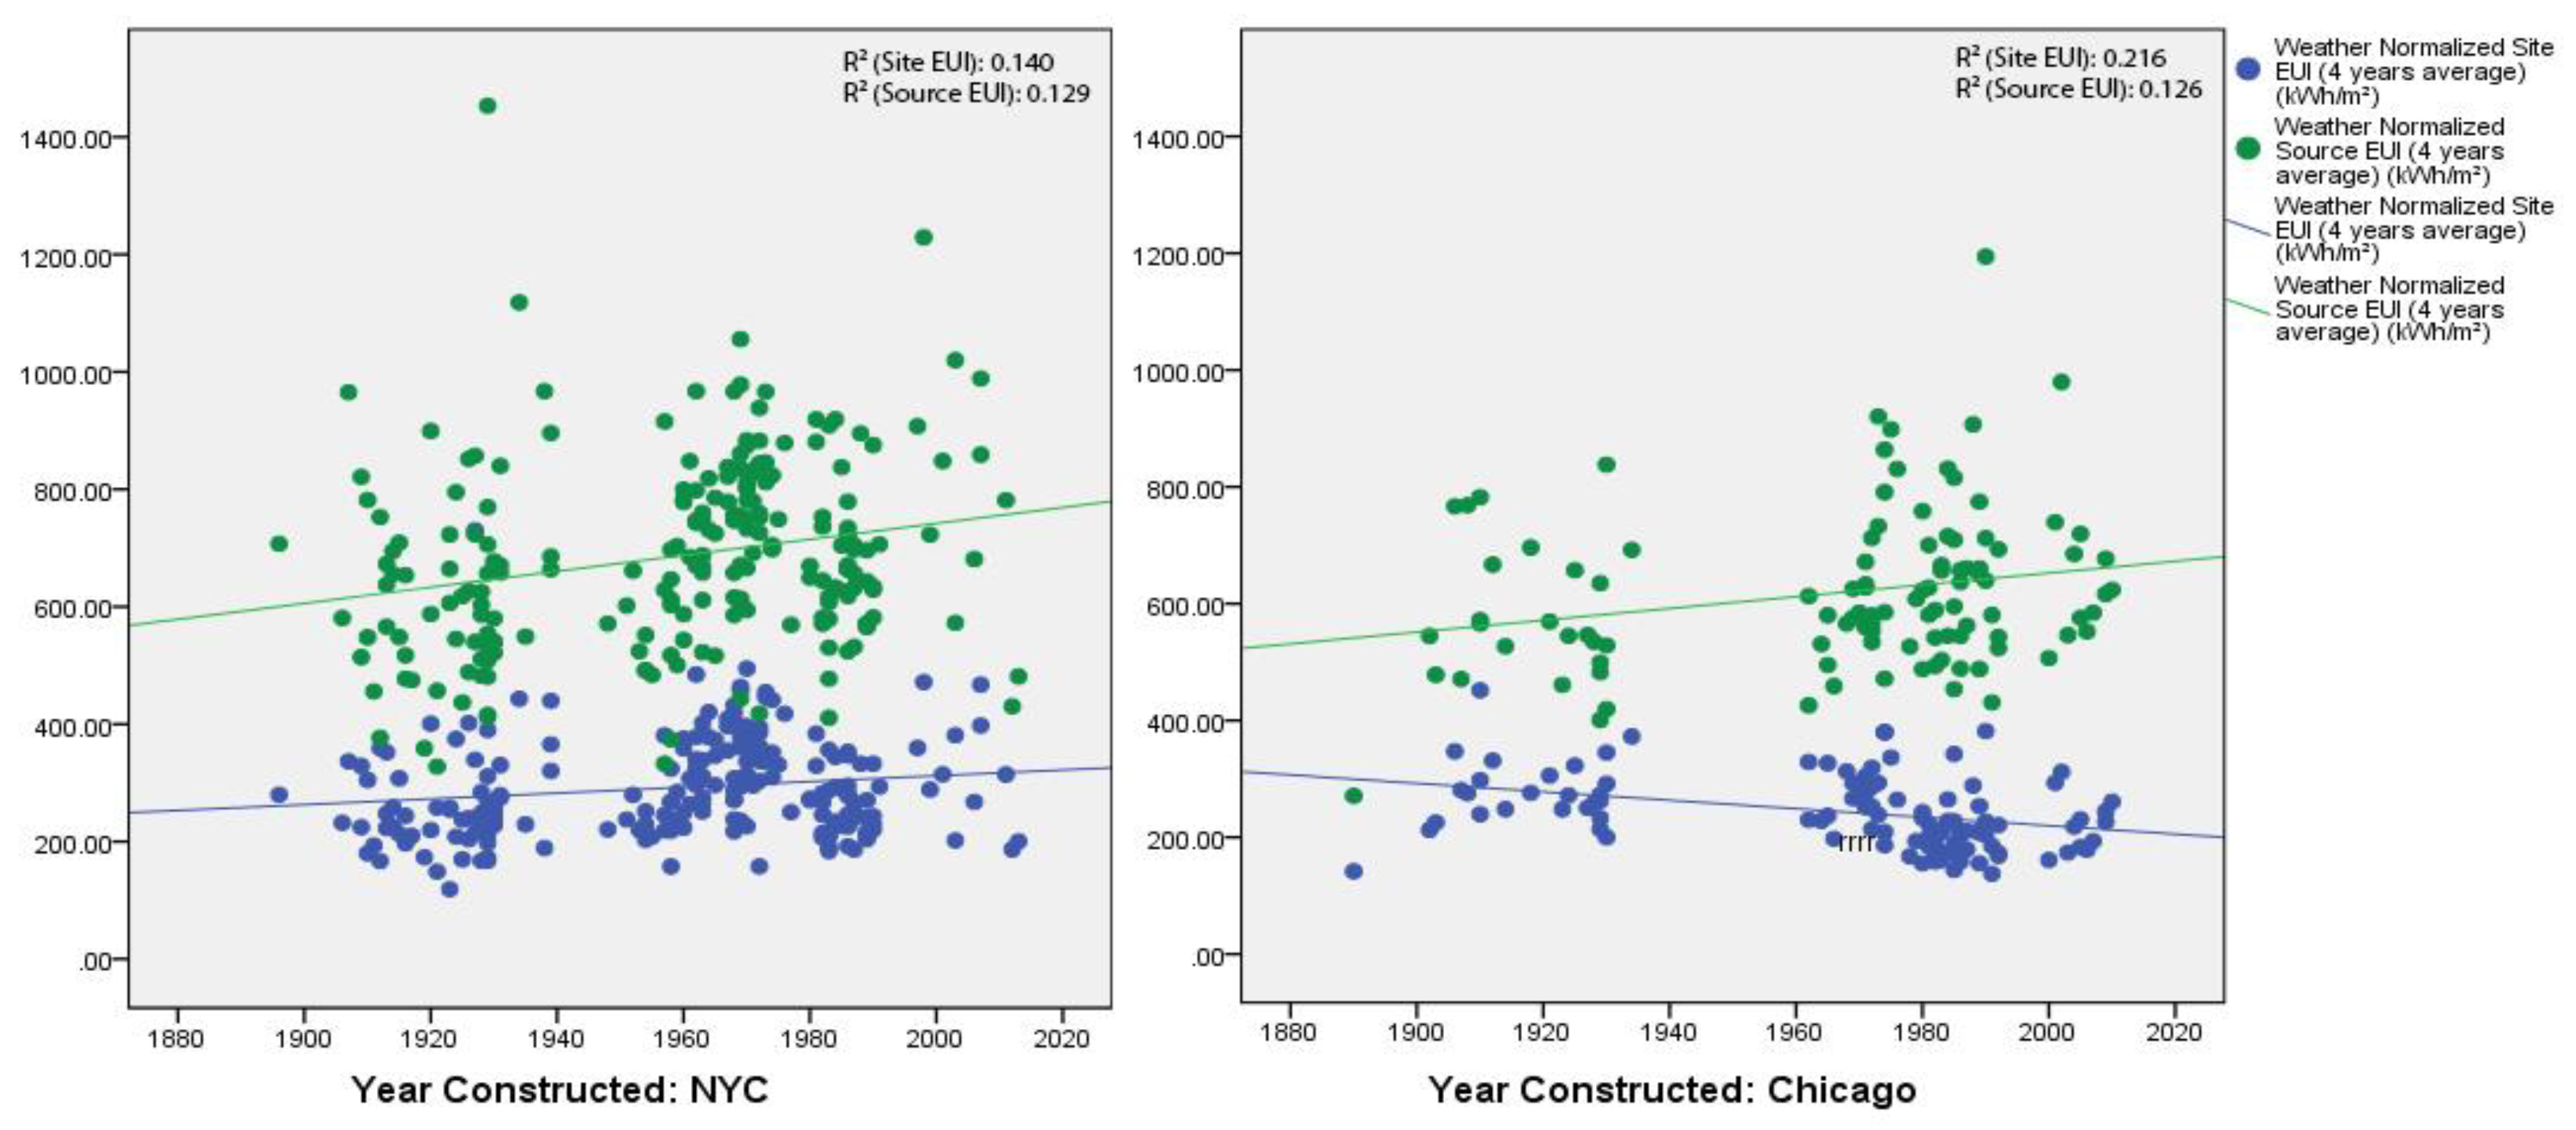
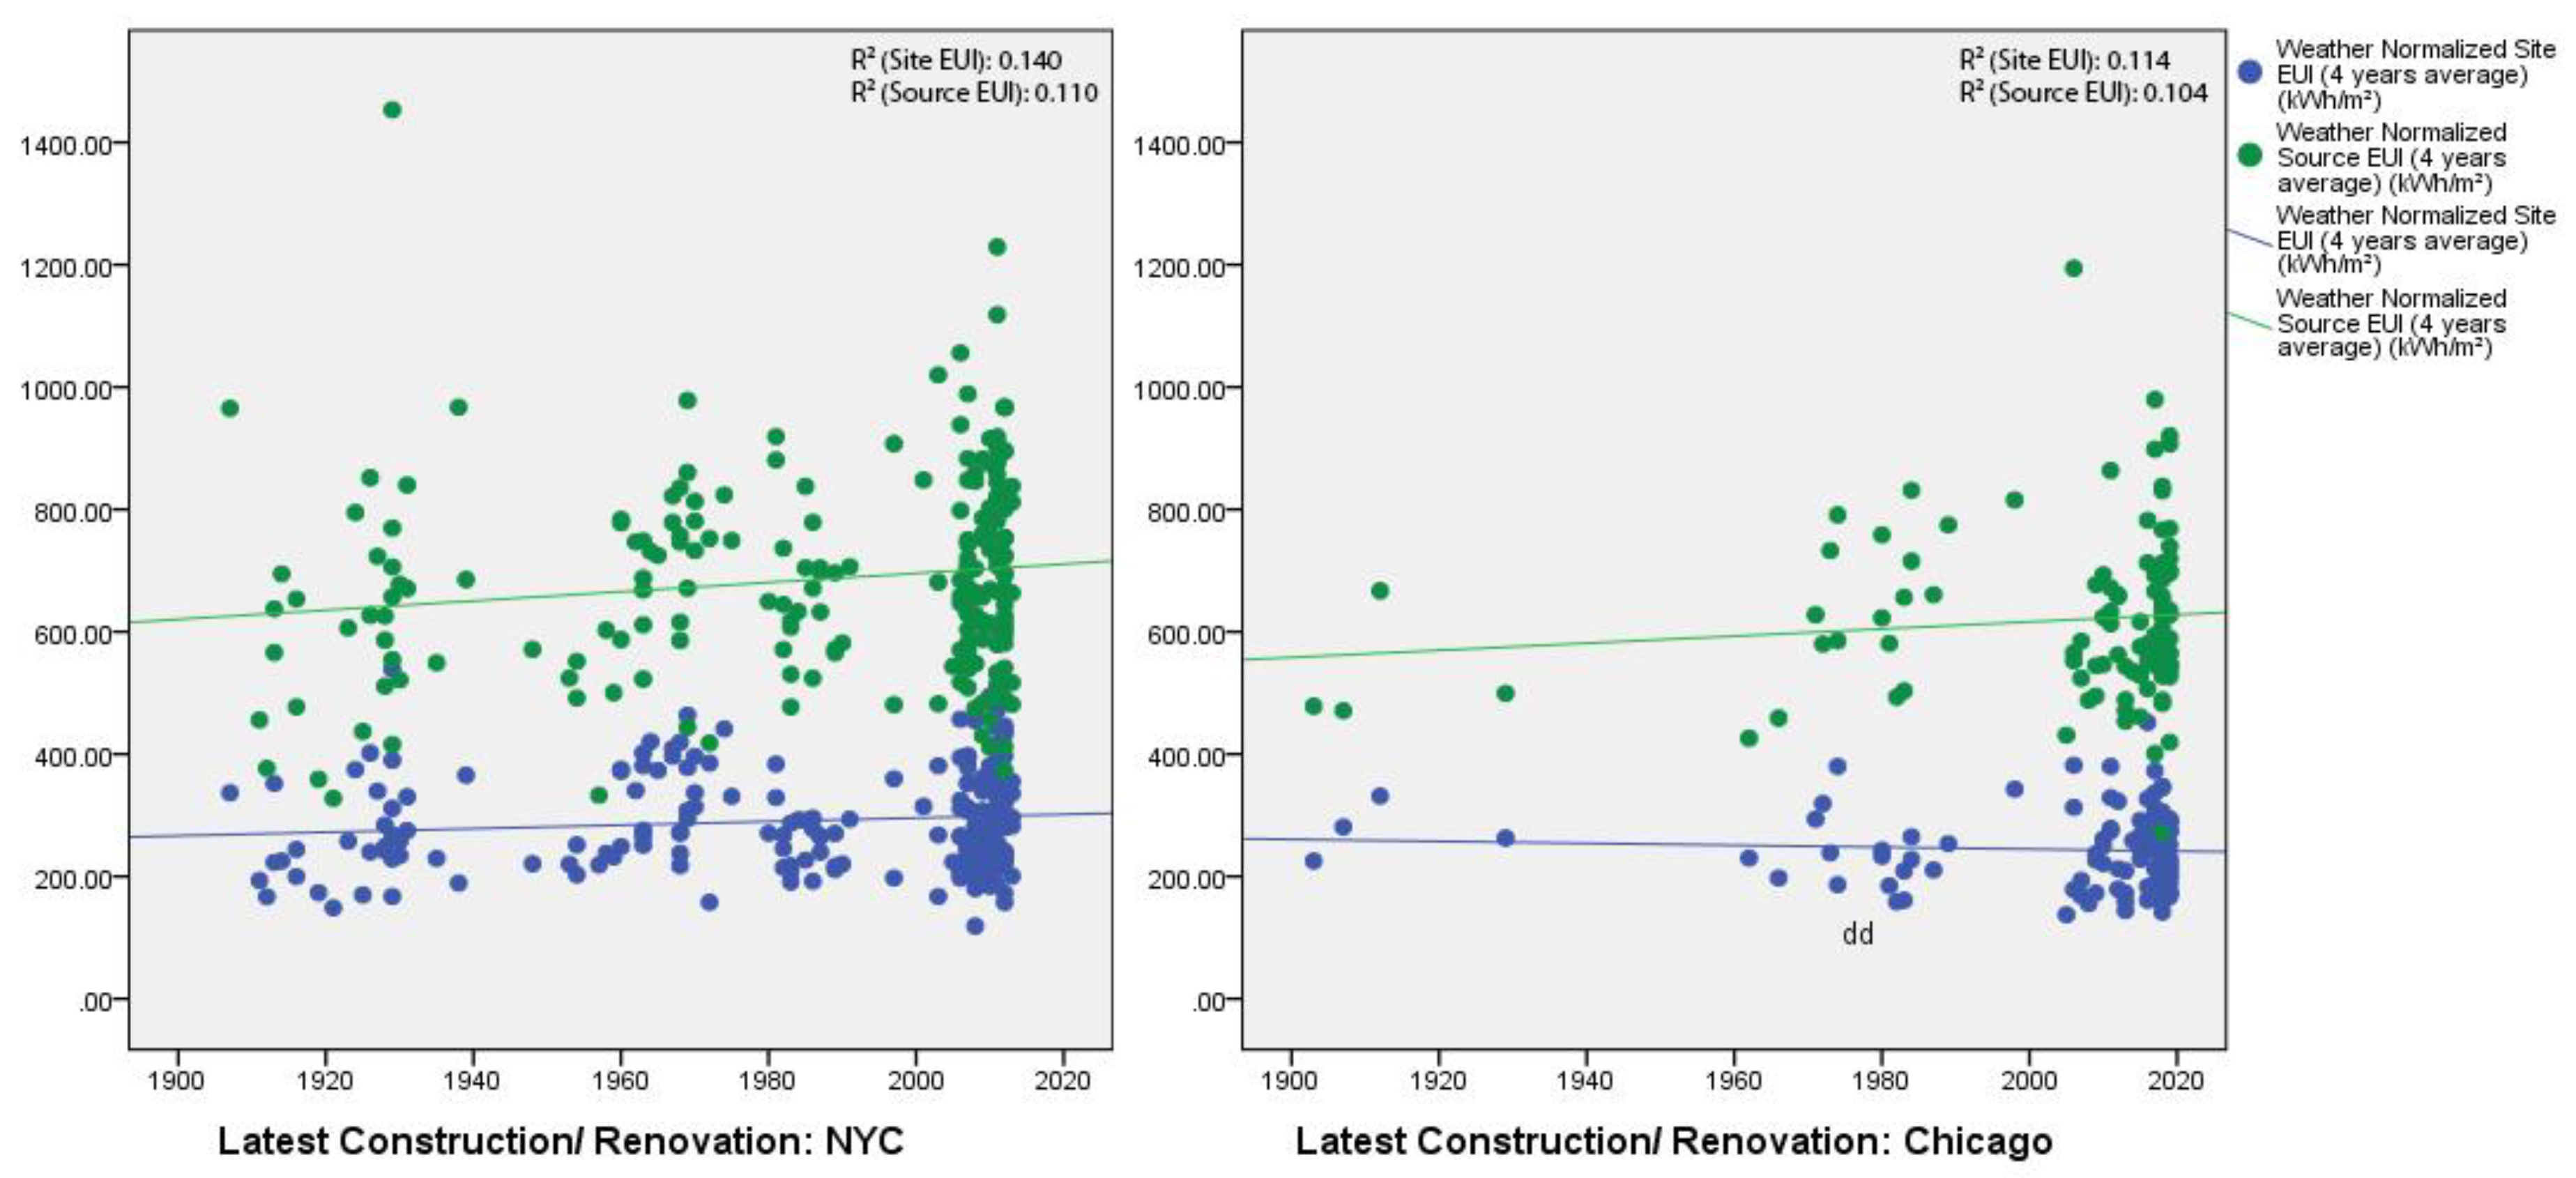
3.2.2. Construction, Renovation Years, and Energy Use Intensity
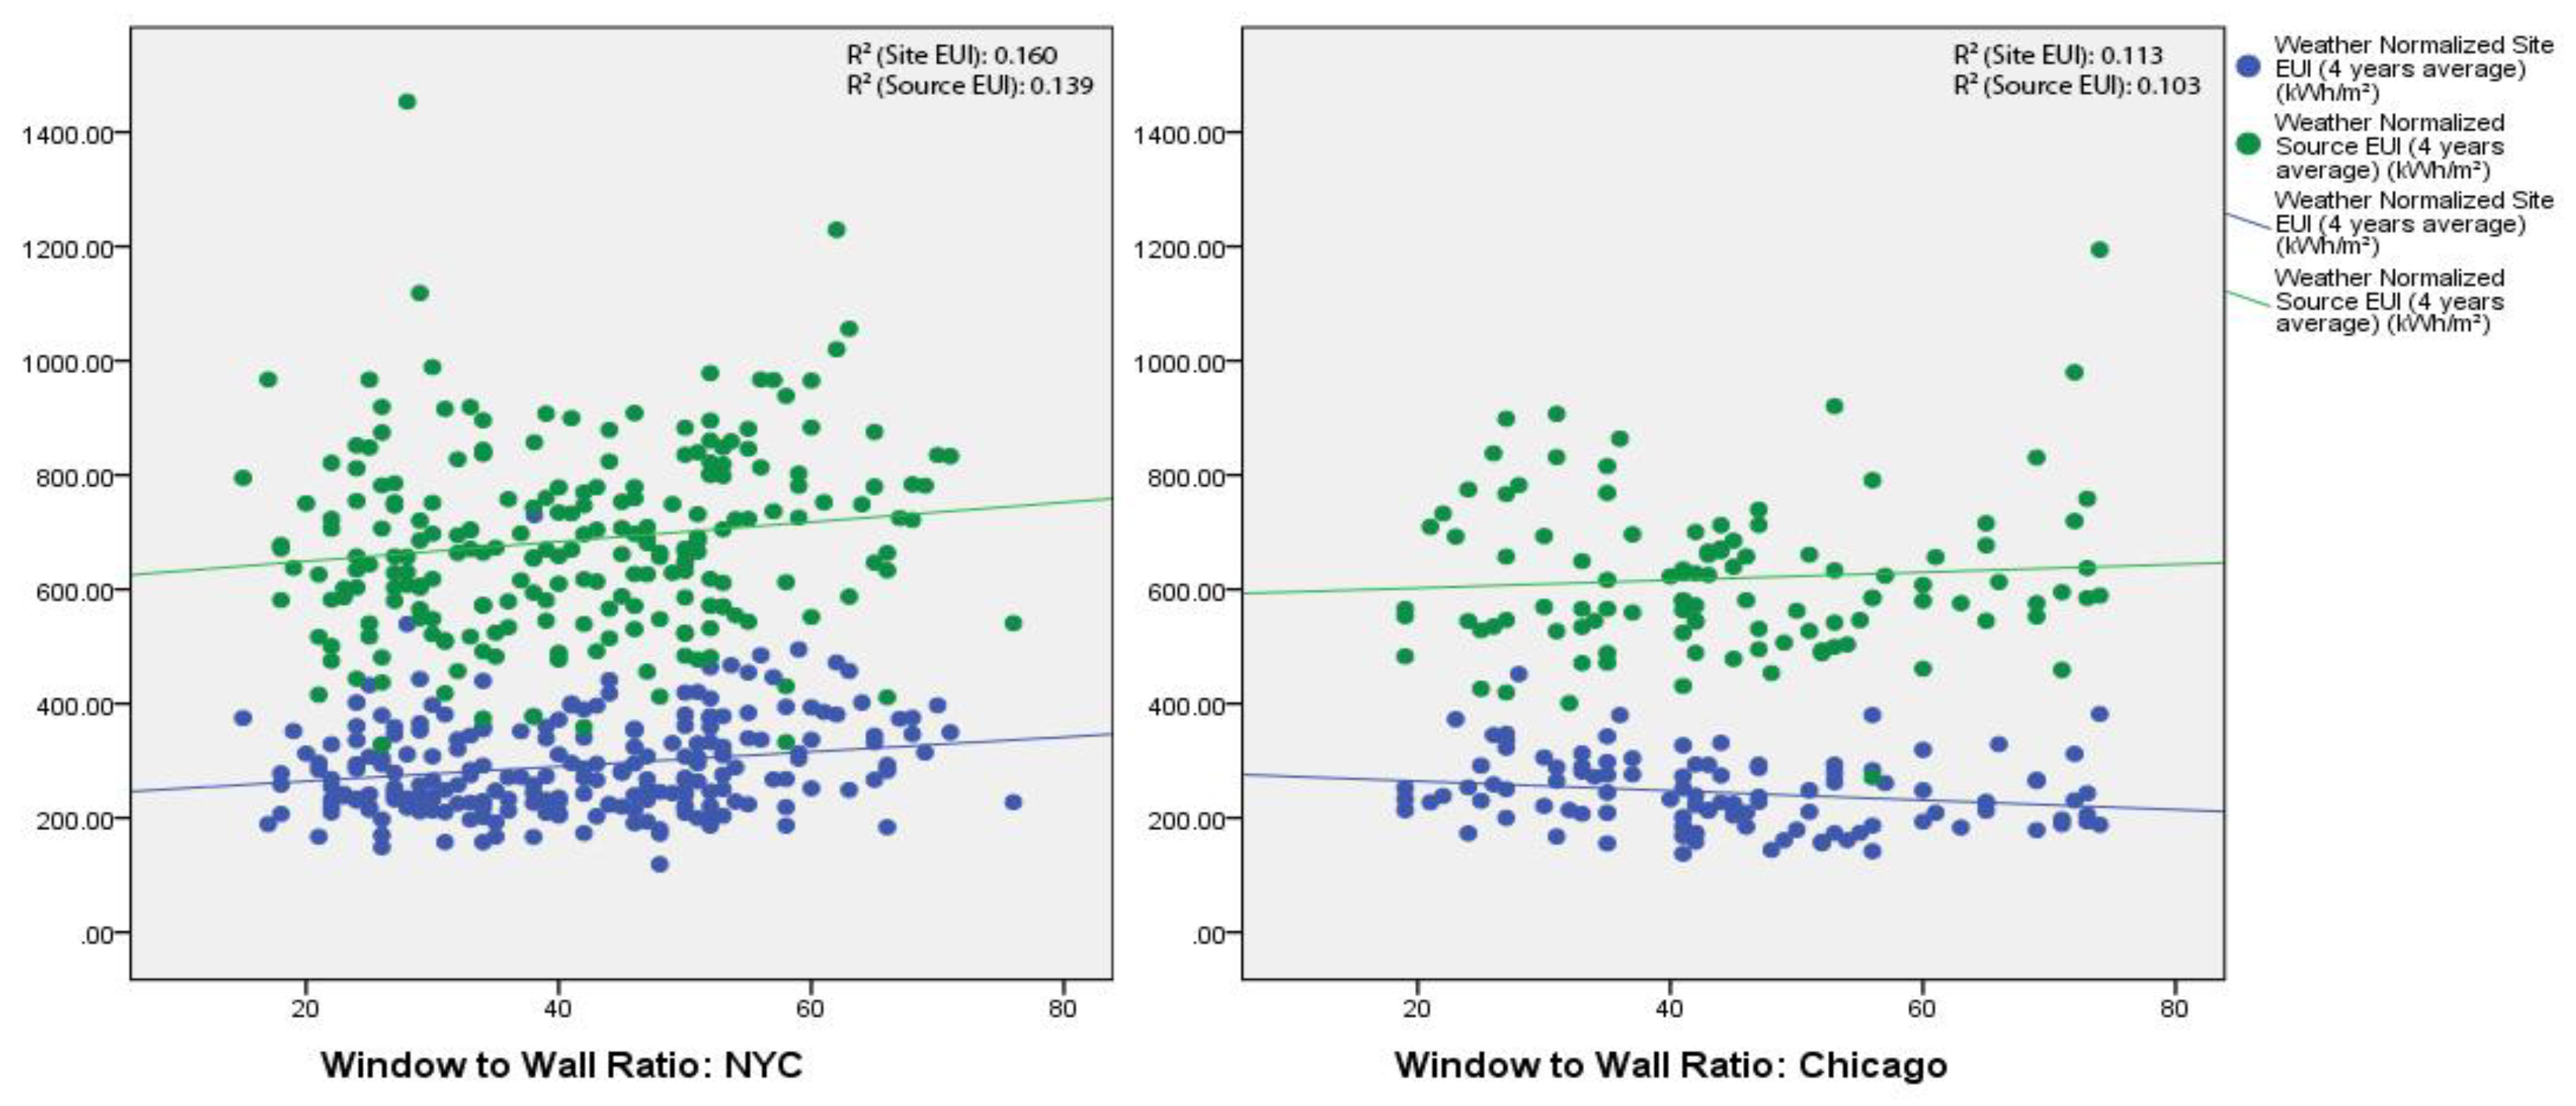
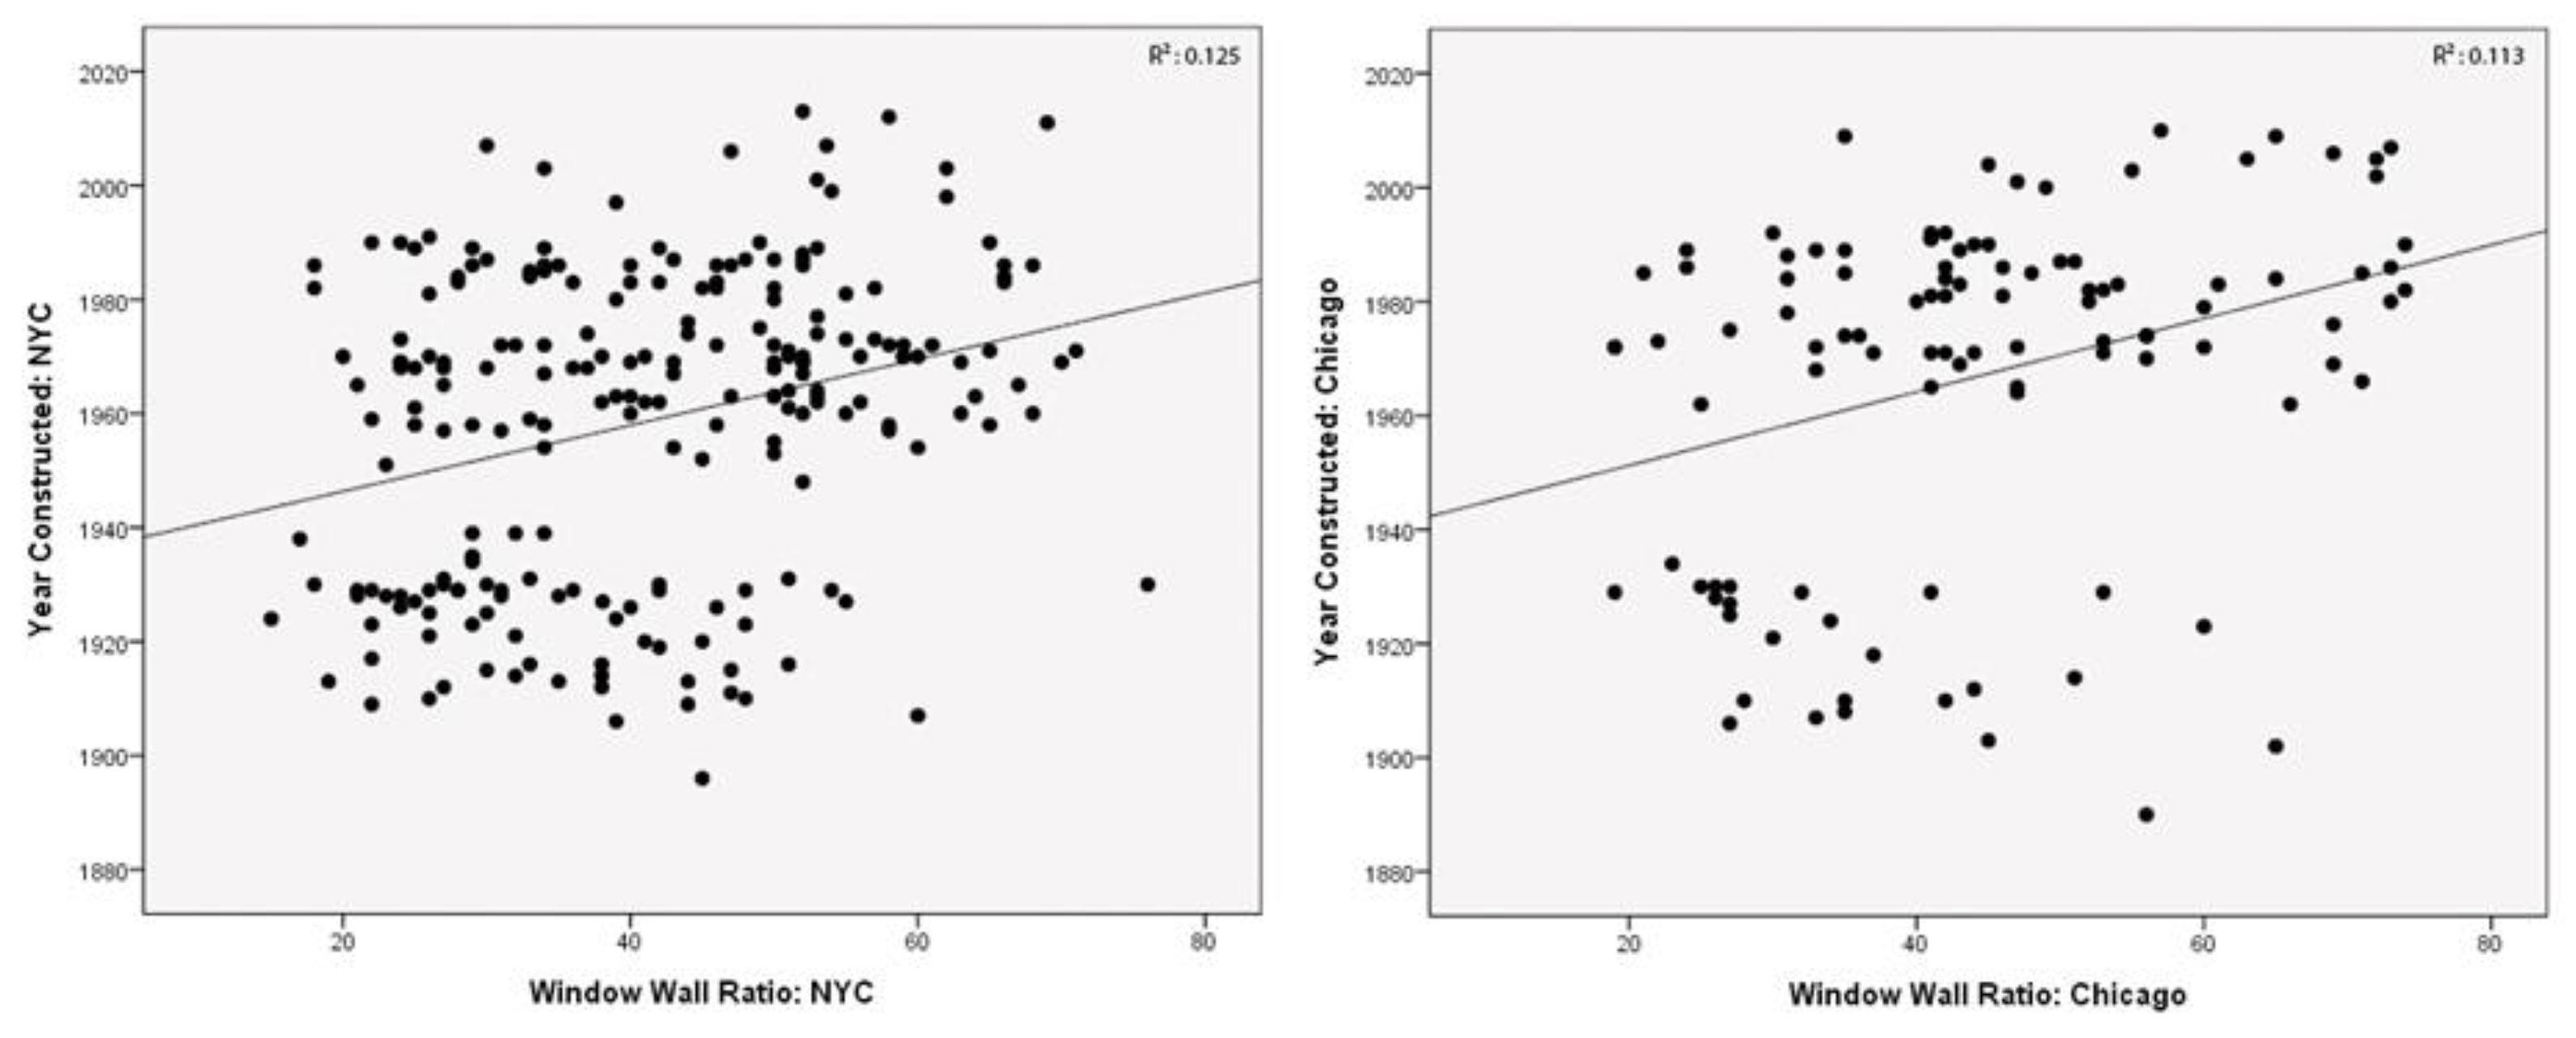
3.2.3. Window-to-Wall Ratio and Energy Use Intensity
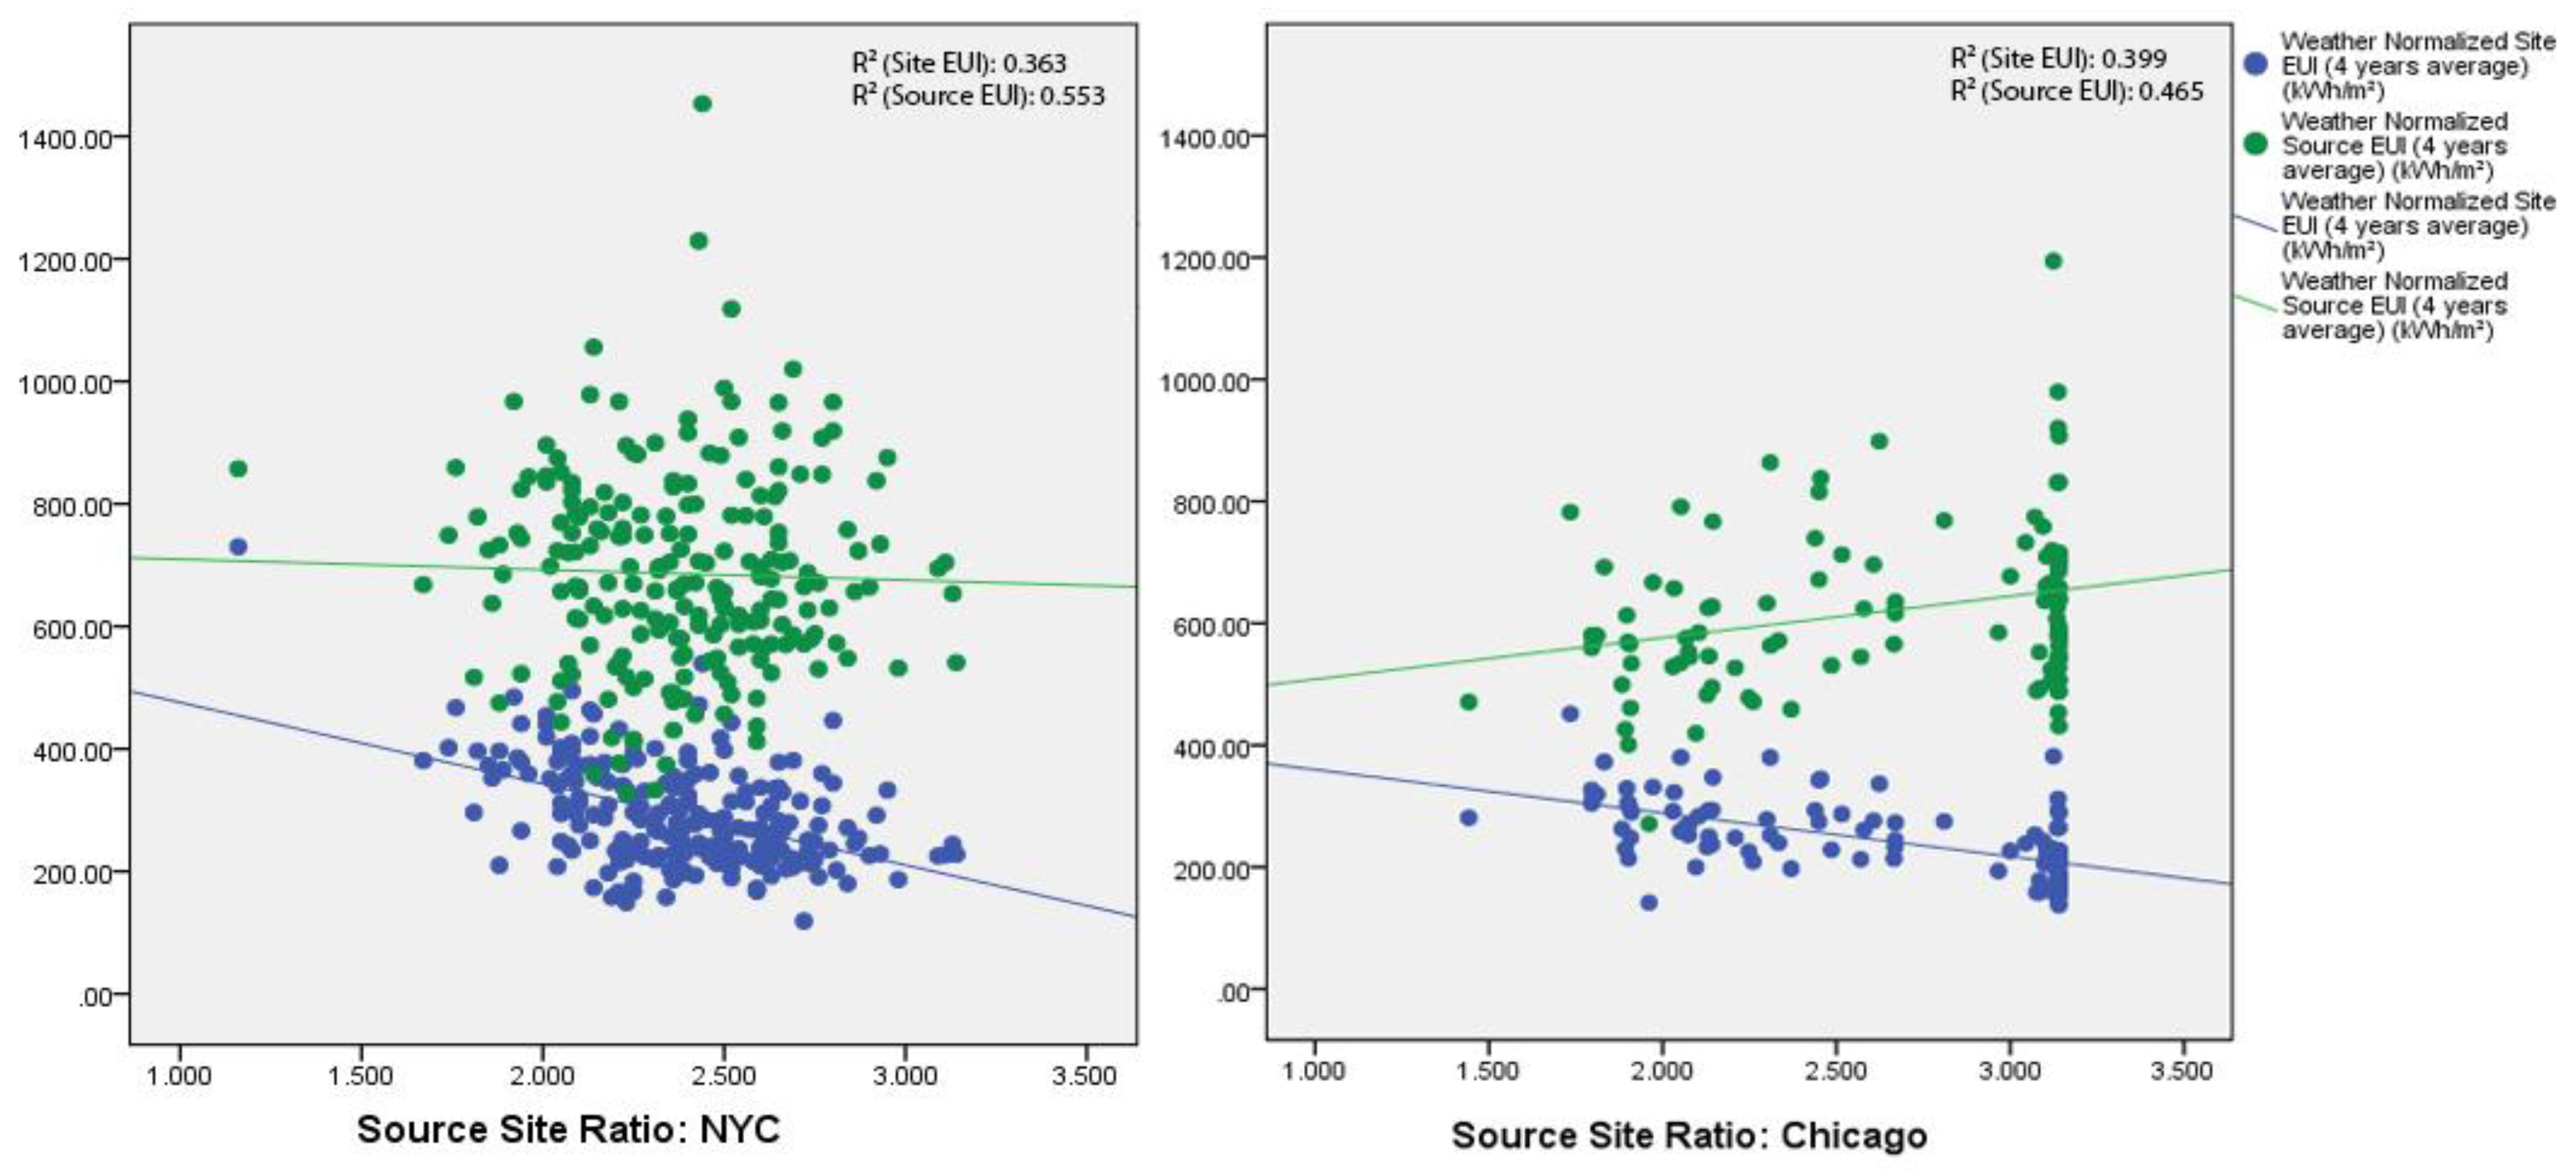
3.2.4. Source–Site Ratio and Energy Use Intensity
4. Conclusions
Author Contributions
Funding
Acknowledgments
Conflicts of Interest
References
- Managan, K.; Layke, J.; Araya, M.; NeslerJen, C. Driving Transformation to Energy Efficient Buildings: Policies and Actions, 2nd ed.; Institute for Building Efficiency: Washington, DC, USA, 2012. [Google Scholar]
- Palmer, K.; Walls, M. Using information to close the energy efficiency gap: A review of benchmarking and disclosure ordinances. Energy Effic. 2017, 10, 673–691. [Google Scholar] [CrossRef] [Green Version]
- New York City. Greater, Greener Buildings Plan. Available online: https://www1.nyc.gov/html/gbee/html/plan/ll84.shtml (accessed on 25 September 2019).
- City of Chicago. Chicago Energy Benchmarking Homepage. Available online: https://www.chicago.gov/city/en/progs/env/building-energy-benchmarking---transparency.html (accessed on 25 September 2019).
- Urban Green Council. New York City’s Energy and Water Use 2014 and 2015 Report; Urban Green Council: New York, NY, USA, 2017. [Google Scholar]
- Papadopoulos, S.; Bonczak, B.; Kontokosta, C.E. Pattern recognition in building energy performance over time using energy benchmarking data. Appl. Energy 2018, 221, 576–586. [Google Scholar] [CrossRef] [Green Version]
- Gao, X.; Malkawi, A. A new methodology for building energy performance benchmarking: An approach based on intelligent clustering algorithm. Energy Build. 2014, 84, 607–616. [Google Scholar] [CrossRef]
- Hong, S.M.; Paterson, G.; Burman, E.; Steadman, P.; Mumovic, D. A comparative study of benchmarking approaches for non-domestic buildings: Part 1—Top-down approach. Int. J. Sustain. Built Environ. 2013, 2, 119–130. [Google Scholar] [CrossRef] [Green Version]
- Kontokosta, C.E. A market-specific methodology for a commercial building energy performance index. J. Real Estate Financ. Econ. 2015, 51, 288–316. [Google Scholar] [CrossRef] [Green Version]
- Godoy-Shimizu, D.; Steadman, P.; Hamilton, I.; Donn, M.; Evans, S.; Moreno, G.; Shayesteh, H. Energy use and height in office buildings. Build. Res. Inform. 2018, 46, 845–863. [Google Scholar] [CrossRef] [Green Version]
- Steadman, P. Energy ‘High-Rise Buildings: Energy and Density’ Research Project Results; UCL: London, UK, 2017. [Google Scholar]
- Guthrie, A. Tall buildings sustainability from the bottom up. In Proceedings of the CTBUH 8th World Congress, “Tall & Green: Typology for a Sustainable Urban Future”, Dubai, March, 3–5 March 2018; pp. 3–5. [Google Scholar]
- Khamma, T.R.; Boubekri, M. Statistical analysis of Impact of Building Morphology and Orientation on its Energy Performance. J. Eng. 2017, 5, 15–25. [Google Scholar] [CrossRef] [Green Version]
- Catalina, T.; Virgone, J.; Iordache, V. Study on the impact of the building form on the energy consumption. In Proceedings of the Building Simulation 2011: 12th Conference of International Building Performance Simulation Association, Sydney, Australia, 14–16 November 2011; pp. 1726–1729. [Google Scholar]
- Raji, B.; Tenpierik, M.; Van den Dobbelsteen, A. Early-stage design considerations for the energy-efficiency of high-rise office buildings. Sustainability 2017, 9, 623. [Google Scholar] [CrossRef] [Green Version]
- Ourghi, R.; Al-Anzi, A.; Krarti, M. A simplified analysis method to predict the impact of shape on annual energy use for office buildings. Energy Convers. Manag. 2007, 48, 300–305. [Google Scholar] [CrossRef]
- Elotefy, H.; Abdelmagid, K.S.S.; Morghany, E.; Ahmed, T.M.F. Energy-efficient Tall buildings design strategies: A holistic approach. Energy Procedia 2015, 74, 1358–1369. [Google Scholar] [CrossRef] [Green Version]
- Ling, C.S.; Ahmad, M.H.; Ossen, D.R. The effect of geometric shape and building orientation on minimising solar insolation on high-rise buildings in hot humid climate. J. Constr. Dev. Ctries. 2007, 12, 27–38. [Google Scholar]
- City of Chicago; 2017 Chicago Energy Benchmarking Report. Available online: https://www.chicago.gov/city/en/depts/mayor/supp_info/chicago-energy-benchmarking/Chicago_Energy_Benchmarking_Reports_Data.html (accessed on 30 November 2019).
- New York City. LL84 Data Disclosure & Reports. Available online: https://www1.nyc.gov/html/gbee/html/plan/ll84_scores.shtml (accessed on 28 October 2019).
- City of Chicago. Chicago Energy Benchmarking Results, Analysis, & Building Data. Available online: https://www.chicago.gov/city/en/depts/mayor/supp_info/chicago-energy-benchmarking/Chicago_Energy_Benchmarking_Reports_Data.html (accessed on 28 October 2019).
- Mahdavi, A.; Gurtekin, B. Shapes, numbers, perception: Aspects and dimensions of the design-performance space. In Proceedings of the 6th International Conference Design and Decision Support Systems in Architecture, Ellecom, The Netherlands, 1 January 2002; pp. 291–300. [Google Scholar]
- CBECS. User’s Guide to the 2012 CBECS Public Use Microdata; CBECS: Washington, DC, USA, 2016.
- Ueno, K.; Straube, J. BSD-151: Understanding Primary/Source and Site Energy. Available online: https://www.buildingscience.com/documents/digests/bsd151-understanding-primary-source-site-energy (accessed on 28 October 2019).
- EPA. Portfolio Manager Degree Days Calculator. Available online: https://portfoliomanager.energystar.gov/pm/degreeDaysCalculator (accessed on 27 October 2019).
- Sivak, M. Air conditioning versus heating: Climate control is more energy demanding in Minneapolis than in Miami. Environ. Res. Lett. 2013, 8, 014050. [Google Scholar] [CrossRef]
- Millar, M.A.; Burnside, N.M.; Yu, Z. District heating challenges for the UK. Energies 2019, 12, 310. [Google Scholar] [CrossRef] [Green Version]
- Multiple Regression Analysis Using SPSS Statistics. Available online: https://statistics.laerd.com/spss-tutorials/multiple-regression-using-spss-statistics.php (accessed on 21 October 2019).
- Landau, S.; Everitt, B.S. A Handbook of Statistical Analyses Using SPSS; Chapman and Hall/CRC: Boca Raton, FL, USA, 2003. [Google Scholar]
- Burton, C. Designing High Performance MEP Systems for Supertall Buildings: A Review of Challenges and Opportunities. Int. J. High Rise Build. 2017, 6, 301–306. [Google Scholar]
- Chiesa, G.; Acquaviva, A.; Grosso, M.; Bottaccioli, L.; Floridia, M.; Pristeri, E.; Sanna, E.M. Parametric Optimization of Window-to-Wall Ratio for Passive Buildings Adopting A Scripting Methodology to Dynamic-Energy Simulation. Sustainability 2019, 11, 3078. [Google Scholar] [CrossRef] [Green Version]
- Goia, F. Search for the optimal window-to-wall ratio in office buildings in different European climates and the implications on total energy saving potential. Solar Energy 2016, 132, 467–492. [Google Scholar] [CrossRef]
- Ballarini, I.; De Luca, G.; Paragamyan, A.; Pellegrino, A.; Corrado, V. Transformation of an office building into a nearly zero energy building (nZEB): Implications for thermal and visual comfort and energy performance. Energies 2019, 12, 895. [Google Scholar] [CrossRef] [Green Version]
- Agency, E.P. Energy Star PortFolio Manager. Available online: https://www.energystar.gov/buildings/facility-owners-and-managers/existing-buildings/use-portfolio-manager/understand-metrics/difference (accessed on 12 September 2019).
- Meng, T.; Hsu, D.; Han, A. Estimating energy savings from benchmarking policies in New York City. Energy 2017, 133, 415–423. [Google Scholar] [CrossRef]


| Variable Type | New York | Chicago |
|---|---|---|
| Physical Parameters | ||
| Number of Floors | 42floors.com, skyscraper.org therealdeal.com | 42floors.com, skyscraper.org property.compstak.com |
| Gross Floor Area | ||
| Floor Area Ratio | oasisnyc.net | Calculated from Chicago Data Disclosure and Portal |
| Compactness Factor | Calculated from 3D Models 1 | Calculated from 3D Models 2 |
| Relative Compactness | Calculated from 3D Models 1 | Calculated from 3D Models 2 |
| Window/Wall Ratio | Calculated from Google Earth Pro, Photos, Plans, Elevations | Calculated from Google Earth Pro Photos, Plans, Elevations |
| Morphology Type | Calculated from 3D Models 1 | Calculated from 3D Models 2 |
| Consumption Data 1 | ||
| Source/Site EUI | NYC Energy Data Disclosure | Chicago Energy Data Disclosure |
| Electricity/Gas/Steam/Oil Use | NYC Energy Data Disclosure | Chicago Energy Data Disclosure |
| Source Site Ratio | Calculated from NYC Energy Data Disclosure | Calculated from Chicago Energy Data Disclosure |
| Year Constructed | NYC Energy Data Disclosure | Chicago Energy Data Disclosure |
| Recent Renovation Date | NYC City DOB | Chicago City DOB |
| NYC Variables Descriptive Statistics | |||||||
| Variables | Min | Max | Mean | Median | Std. Deviation | Skewness | |
| Statistic | Std. Error | ||||||
| Number of Floors | 5 | 102 | 33.64 | 34.00 | 13.080 | 0.606 | 0.164 |
| Gross Floor Area (m2) | 46,475 | 337,859 | 93,666 | 78,540 | 49,583 | 1.821 | 0.164 |
| Floor Area Ratio (%) | 2.88 | 48.08 | 20.42 | 20.27 | 6.11 | 0.816 | 0.164 |
| Compactness Factor (CF) | 0.072 | 0.262 | 0.124 | 0.121 | 0.026 | 1.399 | 0.164 |
| Relative Compactness (RC) | 0.313 | 0.948 | 0.75 | 0.74 | 0.09 | −0.552 | 0.164 |
| Window Wall Ratio (%) | 15 | 76 | 41.40 | 41.00 | 13.554 | 0.189 | 0.164 |
| Source Site Ratio | 1.170 | 5.590 | 2.41 | 2.40 | 0.42 | −0.020 | 0.164 |
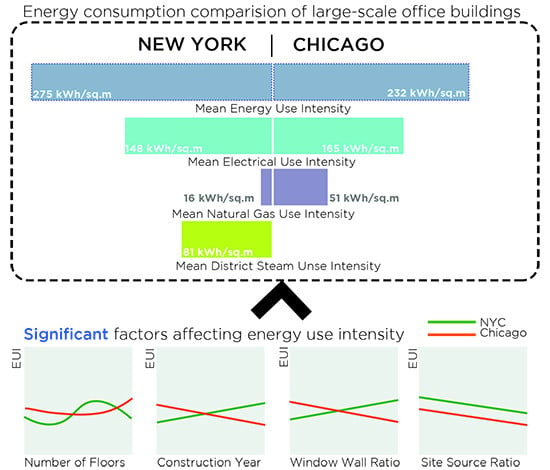
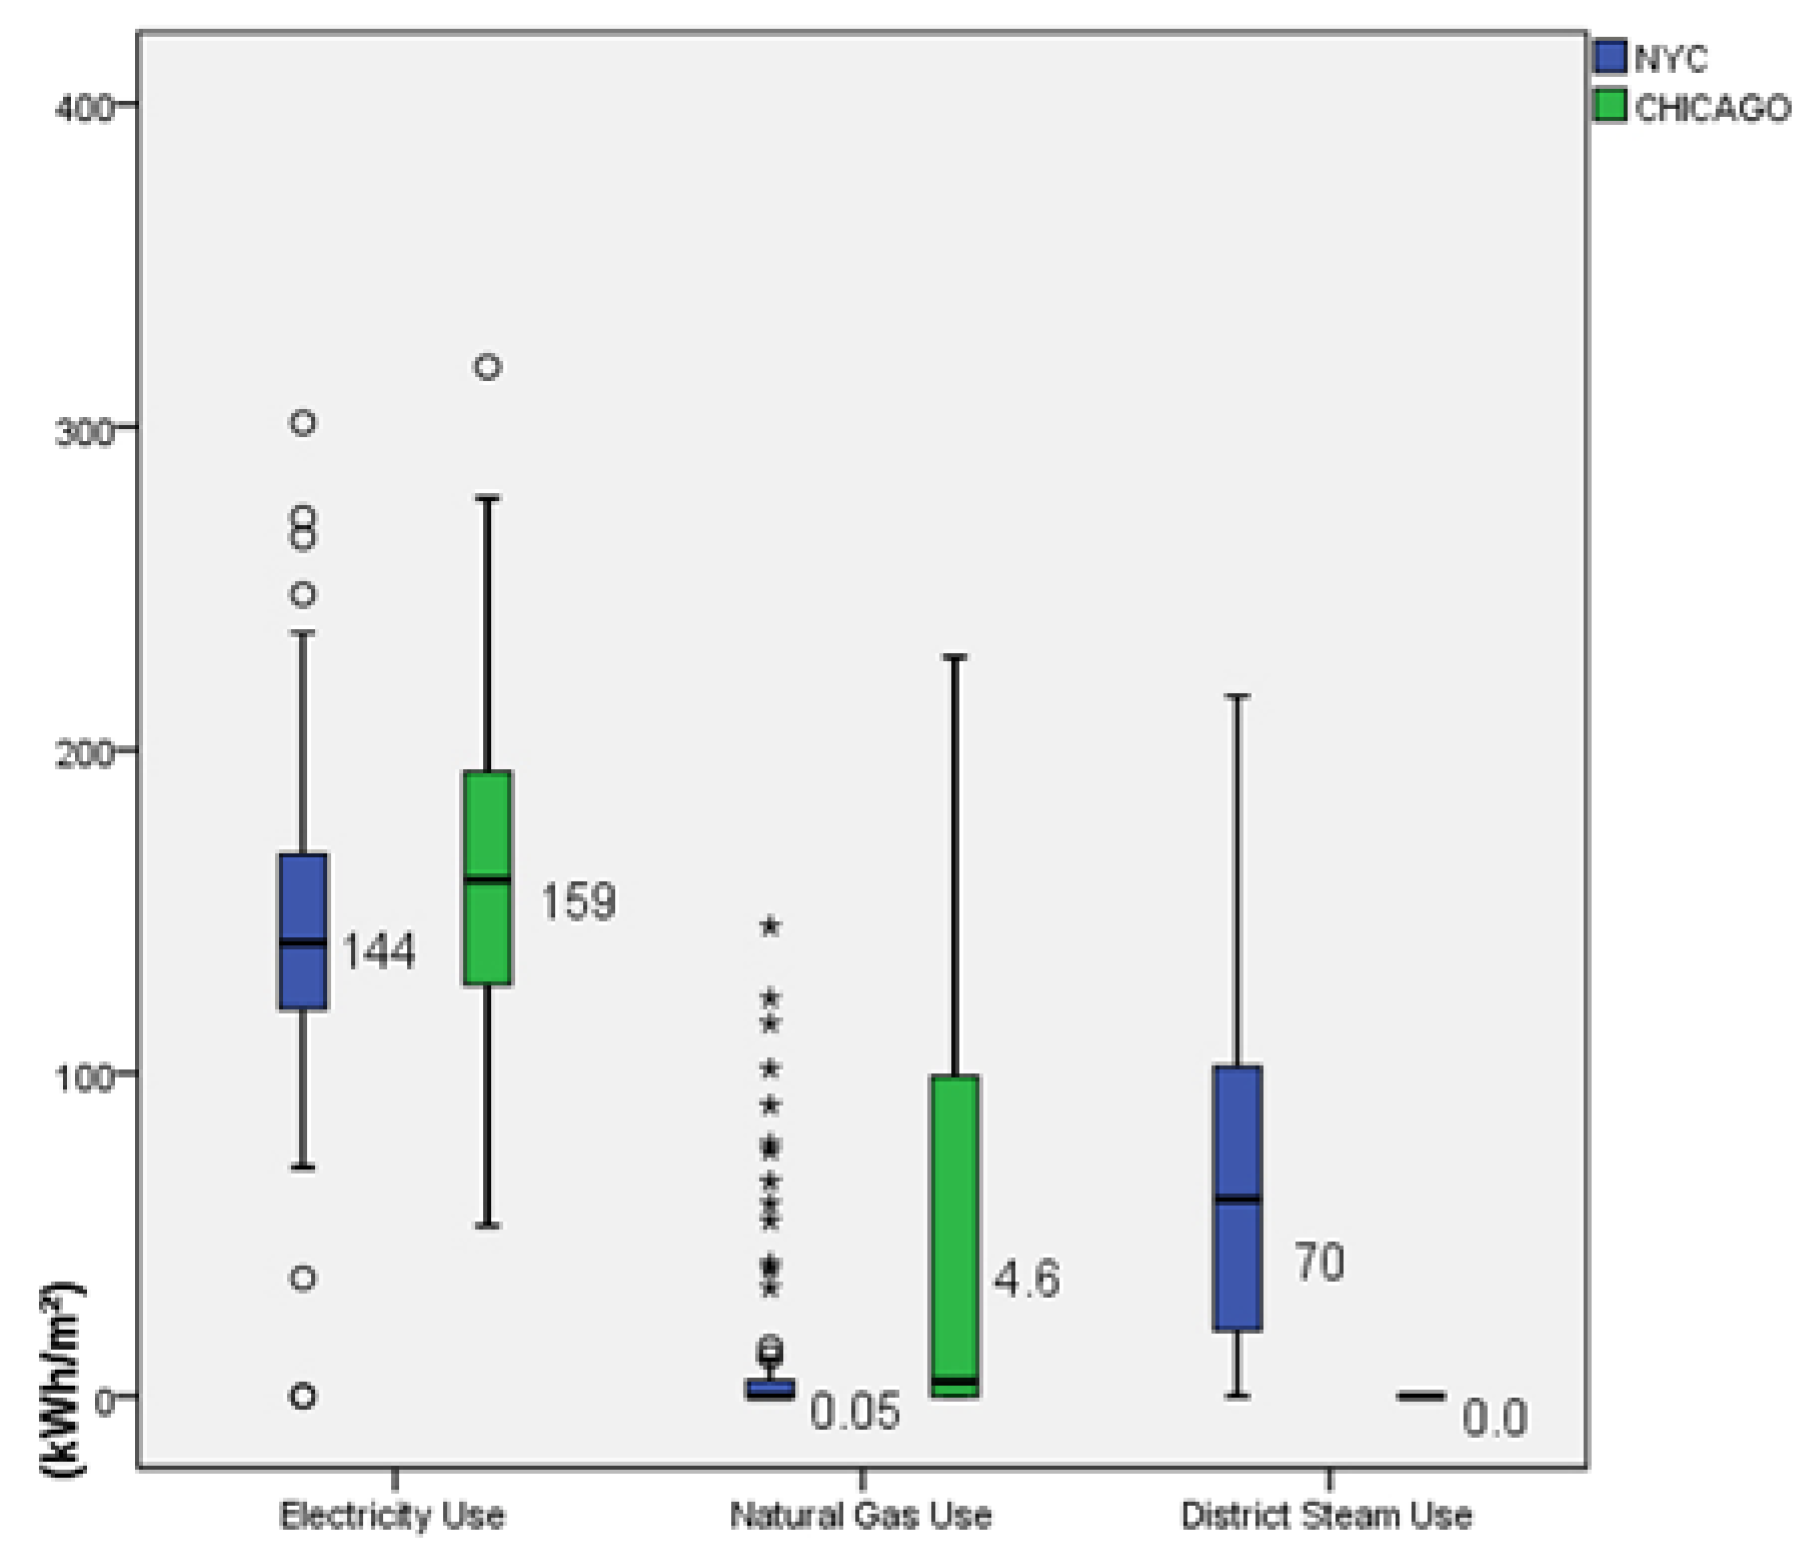
| Electricity Intensity (kWh/m2) | 0.00 | 309.46 | 148.47 | 144.49 | 48.62 | 0.916 | 0.164 |
| Natural Gas Use (kWh/m2 | 0.00 | 700.33 | 16.31 | 0.05 | 55.81 | 8.988 | 0.164 |
| District Steam Use (kWh/m2) | 0.00 | 251.08 | 81.72 | 69.60 | 64.51 | 0.561 | 0.164 |
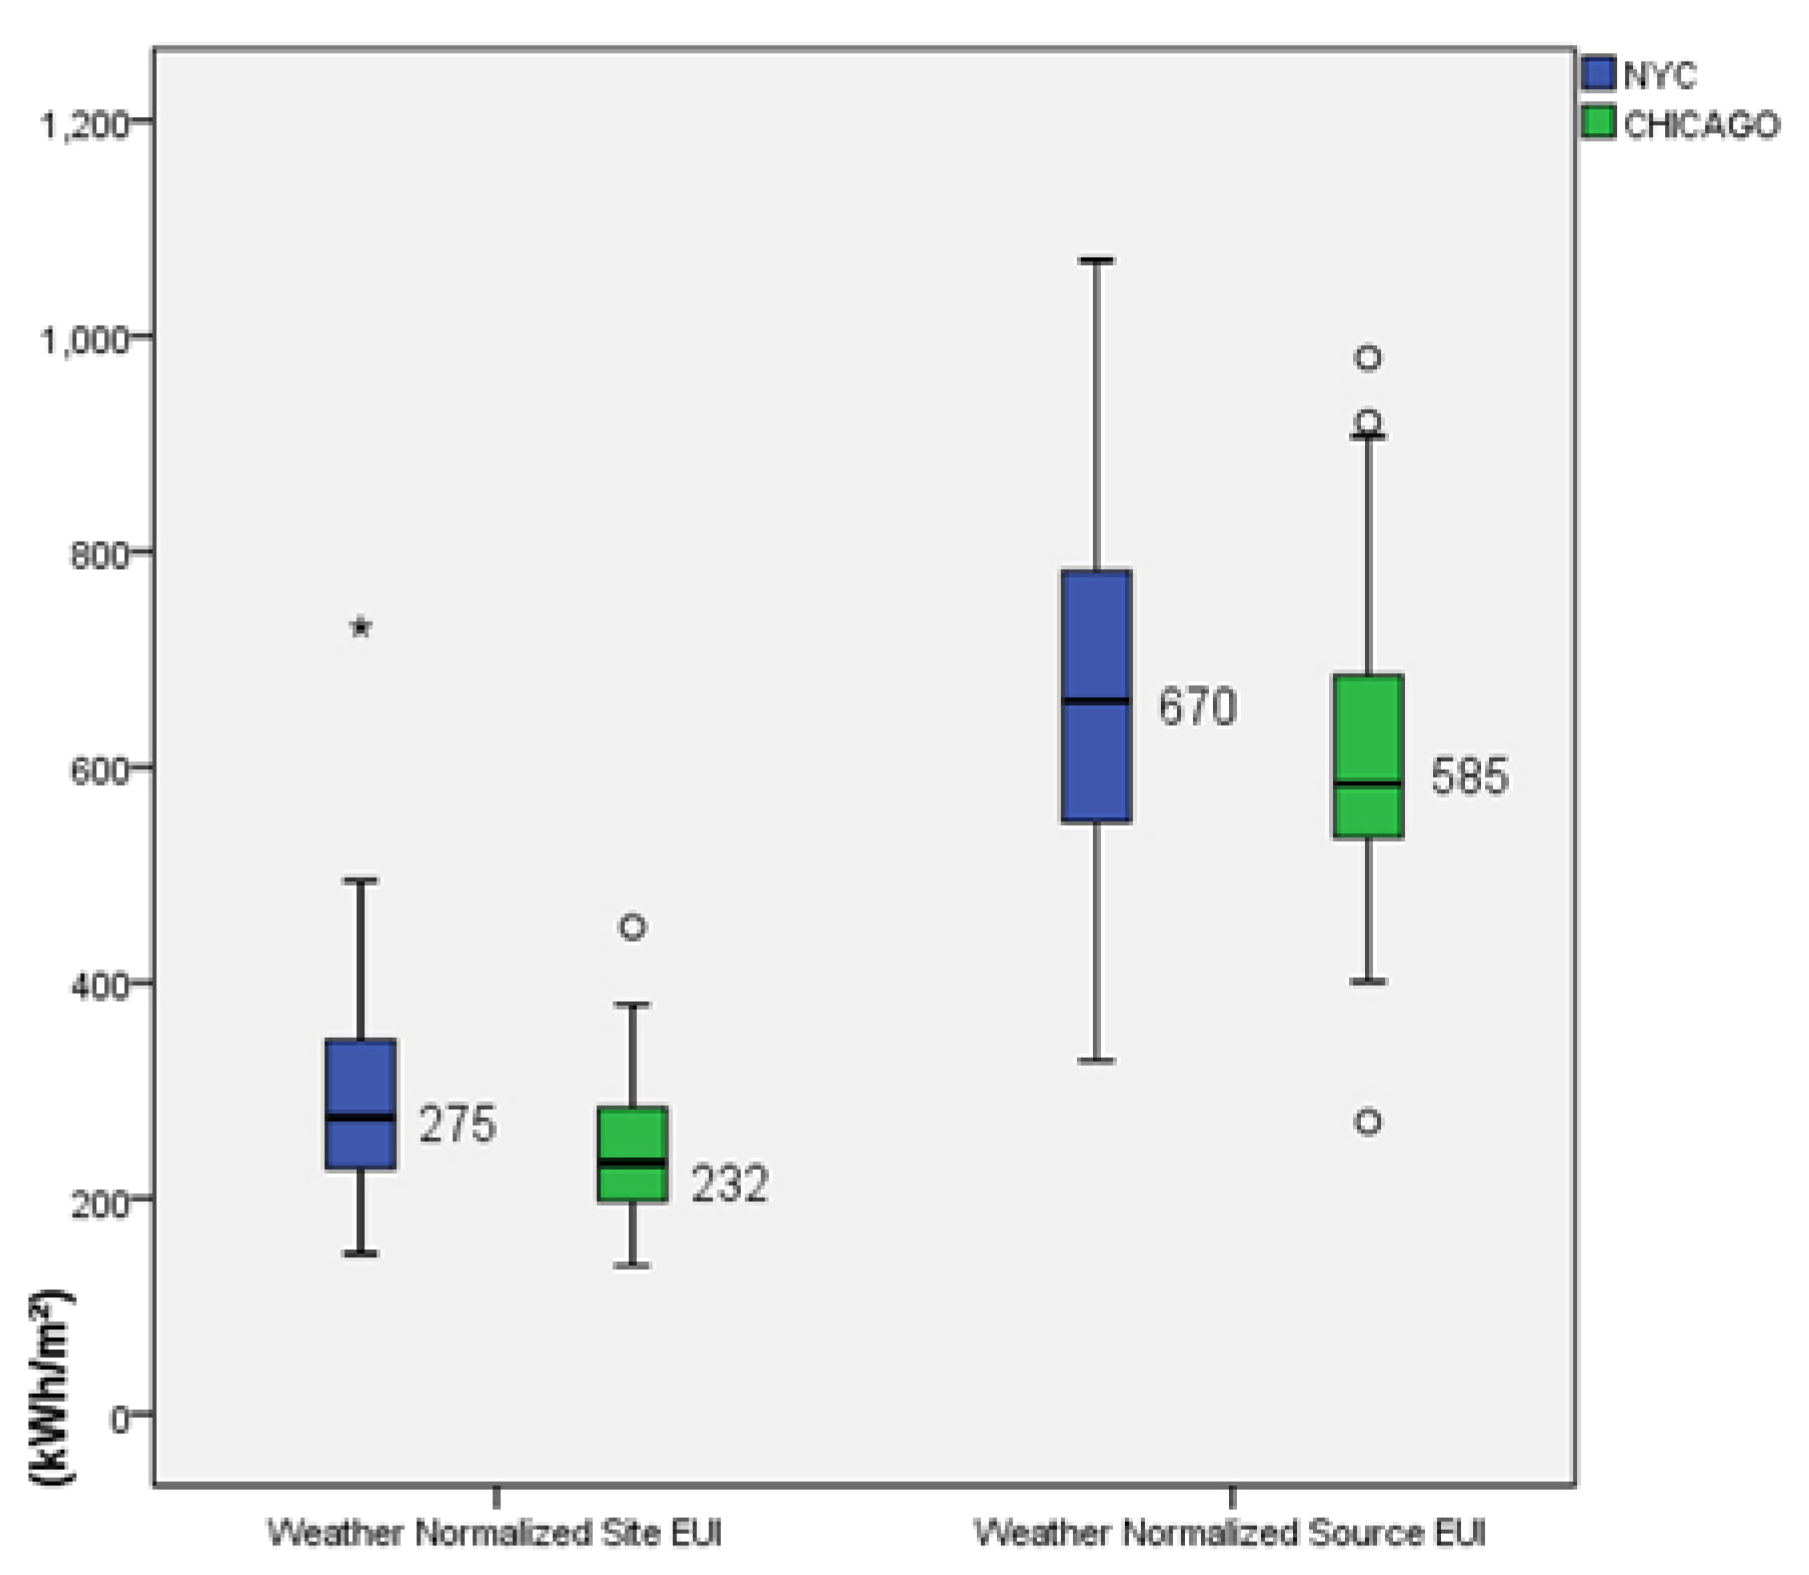
| Site EUI (kWh/m2) | 118.91 | 730.04 | 291.87 | 275.51 | 84.46 | 1.020 | 0.164 |
| Source EUI (kWh/m2) | 327.55 | 1453.24 | 685.93 | 670.71 | 161.91 | 0.693 | 0.164 |
| Chicago Variables Descriptive Statistics | |||||||
| Variables | Min | Max | Mean | Median | Std. Deviation | Skewness | |
| Statistic | Std. Error | ||||||
| Number of Floors | 6 | 110 | 34.99 | 36.00 | 15.117 | 1.379 | 0.235 |
| Gross Floor Area (m2) | 46,574 | 416,514 | 107,030 | 89,151 | 64,586 | 2.432 | 0.235 |
| Floor Area Ratio (%) | 3.48 | 61.93 | 22.67 | 22.19 | 10.79 | 0.824 | 0.235 |
| Compactness Factor (CF) | 0.068 | 0.194 | 0.113 | 0.109 | 0.024 | 0.948 | 0.235 |
| Relative Compactness (RC) | 0.447 | 0.975 | 0.78 | 0.80 | 0.11 | −0.499 | 0.235 |
| Window Wall Ratio | 19 | 74 | 44.74 | 43.00 | 14.996 | 0.314 | 0.235 |
| Source Site Ratio | 1.442 | 3.142 | 2.63 | 2.67 | 0.52 | −0.381 | 0.235 |
| Electricity Intensity (kWh/ft2) | 52.74 | 318.59 | 165.12 | 160.10 | 49.47 | 0.543 | 0.235 |
| Natural Gas Use (kBtu/ft2) | 0.00 | 228.83 | 51.36 | 4.54 | 0.235 | 0.00 | 228.83 |
| District Steam Use (kBtu/ft2) | No use reported for the selected samples | ||||||
| Site EUI (kWh/m2) | 137.44 | 451.66 | 243.74 | 232.89 | 62.27 | 0.628 | 0.235 |
| Source EUI (kWh/m2) | 270.93 | 1194.22 | 619.37 | 585.04 | 135.41 | 1.049 | 0.235 |
| New York City | Morphology Type | Year Constructed | Latest Construction | Floor Area Ratio (%) | Window Wall Ratio (WWR) | Compactness Factor (CF) | (RC) Relative Compactness | Source Site Ratio |
| Number of Floors | −0.386** | 0.362** | 0.115 | 0.567** | 0.104 | −0.125 | −0.450** | −0.229** |
| Morphology Type | −0.300** | −0.128 | −0.127 | −0.183** | 0.044 | 0.272** | 0.039 | |
| Year Constructed | 0.234** | 0.165* | 0.262** | −0.132* | −0.035 | 0.151* | ||
| Latest Construction Date | −0.051 | 0.029 | −0.113 | −0.098 | 0.064 | |||
| Floor Area Ratio (%) | 0.046 | 0.100 | −0.169* | 0.071 | ||||
| Window Wall Ratio (WWR) | 0.032 | 0.043 | −0.060 | |||||
| (CF) Compactness Factor | −0.465** | 0.025 | ||||||
| (RC) Relative Compactness | 0.137* | |||||||
| *. Correlation is significant at the 0.05 level (2-tailed), **. Correlation is significant at the 0.01 level (2-tailed). | ||||||||
| Chicago | Morphology Type | Year Constructed | Latest Construction | Floor Area Ratio (%) | Window Wall Ratio (WWR) | Compactness Factor (CF) | (RC) Relative Compactness | Source Site Ratio |
| Number of Floors | −0.327** | 0.459** | 0.119 | 0.639** | 0.036 | −0.397** | −0.086 | 0.233* |
| Morphology Type | −0.138 | −0.206* | −0.169 | −0.002 | 0.002 | 0.184 | −0.113 | |
| Year Constructed | −0.027 | 0.460** | 0.307** | −0.411** | 0.265** | 0.727** | ||
| Latest Construction Date | 0.011 | −0.121 | 0.068 | −0.394** | 0.154 | |||
| Floor Area Ratio (%) | 0.133 | −0.229* | 0.253** | 0.352** | ||||
| Window Wall Ratio (WWR) | −0.098 | 0.289** | 0.281** | |||||
| (CF) Compactness Factor | −0.476** | −0.144 | ||||||
| (RC) Relative Compactness | 0.076 | |||||||
| *. Correlation is significant at the 0.05 level (2-tailed), **. Correlation is significant at the 0.01 level (2-tailed). | ||||||||
| NYC | Weather Normalized Site EUI | Weather Normalized Source EUI | ||||
|---|---|---|---|---|---|---|
| R = 0.872 | R2 = 0.761 | R = 0.799 | R2 = 0.639 | |||
| Standard-ized Coefficients | t | Sig | Standard-ized Coefficients | t | Sig. | |
| Number of Floors | −0.232 | 1.552 | 0.063 * | −0.289 | 0.452 | 0.056* |
| Grouped by Number of Floors | 0.302 | −1.869 | 0.012 ** | 0.343 | −1.923 | 0.019 ** |
| Morphology | −0.026 | 2.523 | 0.530 | −0.036 | 2.366 | 0.460 |
| Window Wall Ratio | 0.062 | −0.629 | 0.013 ** | 0.054 | −0.740 | 0.237 |
| Gross Floor Area | 0.106 | 1.643 | 0.065 | 0.165 | 1.186 | 0.018 ** |
| Year Constructed | −0.089 | 1.855 | 0.048 ** | −0.070 | 2.383 | 0.195 |
| Latest Construction Date | 0.051 | −1.988 | 0.188 | 0.044 | −1.300 | 0.347 |
| Floor Area Ratio (%) | −0.038 | 1.321 | 0.427 | −0.037 | 0.943 | 0.530 |
| (CF) Compactness Factor | 0.045 | −0.796 | 0.488 | 0.054 | −0.629 | 0.494 |
| (RC) Relative Compactness | 0.050 | 0.695 | 0.425 | 0.067 | 0.685 | 0.378 |
| Source Site Ratio | −0.251 | 0.799 | 0.000 *** | 0.176 | 0.884 | 0.001 *** |
| Electricity Intensity | 0.439 | −5.775 | 0.000 *** | 0.636 | 3.34 | 0.000 *** |
| Natural Gas Use | 0.463 | 11.460 | 0.000 *** | 0.309 | 13.71 | 0.000 *** |
| District Steam Use | 0.522 | 12.047 | 0.000 *** | 0.465 | 6.633 | 0.000 *** |
| CHICAGO | Weather Normalized Site EUI | Weather Normalized Source EUI | ||||
|---|---|---|---|---|---|---|
| R = 0.919 | R2 = 0.845 | R = 0.902 | R2 = 0.814 | |||
| Standardized Coefficients | t | Sig. | Standardized Coefficients | t | Sig | |
| Number of Floors | 0.544 | −0.188 | 0.014 ** | 1.389 | 0.158 | 0.027 ** |
| Grouped by Number of Floors | −6.770 | 1.074 | 0.018 ** | −16.445 | 1.193 | 0.059 * |
| Morphology | 1.500 | −1.173 | 0.374 | 1.639 | −1.238 | 0.649 |
| Window Wall Ratio | −3.057 | 0.742 | 0.009 ** | −5.114 | 0.353 | 0.117 |
| Gross Floor Area | −8.201 × 10⁻⁵ | −1.575 | 0.072 | 0 | −1.145 | 0.059 * |
| Year Constructed | 0.140 | −1.109 | 0.054 * | 0.058 | −1.203 | 0.675 |
| Latest Construction Date | 0.079 | 0.935 | 0.320 | 0.094 | 0.168 | 0.536 |
| Floor Area Ratio (%) | 0.248 | 0.675 | 0.365 | 0.042 | 0.347 | 0.937 |
| (CF) Compactness Factor | −41.743 | 0.748 | 0.739 | −284.712 | 0.055 | 0.302 |
| (RC) Relative Compactness | −72.377 | −0.182 | 0.009 | −179.293 | −0.541 | 0.023 |
| Source Site Ratio | −97.220 | −1.517 | 0.005 ** | −50.714 | −1.633 | 0.009 ** |
| Electricity Intensity | 1.094 | −7.810 | 0.005 ** | 3.046 | −1.770 | 0.005 ** |
© 2019 by the authors. Licensee MDPI, Basel, Switzerland. This article is an open access article distributed under the terms and conditions of the Creative Commons Attribution (CC BY) license (http://creativecommons.org/licenses/by/4.0/).
Share and Cite
Won, C.; No, S.; Alhadidi, Q. Factors Affecting Energy Performance of Large-Scale Office Buildings: Analysis of Benchmarking Data from New York City and Chicago. Energies 2019, 12, 4783. https://0-doi-org.brum.beds.ac.uk/10.3390/en12244783
Won C, No S, Alhadidi Q. Factors Affecting Energy Performance of Large-Scale Office Buildings: Analysis of Benchmarking Data from New York City and Chicago. Energies. 2019; 12(24):4783. https://0-doi-org.brum.beds.ac.uk/10.3390/en12244783
Chicago/Turabian StyleWon, ChungYeon, SangTae No, and Qamar Alhadidi. 2019. "Factors Affecting Energy Performance of Large-Scale Office Buildings: Analysis of Benchmarking Data from New York City and Chicago" Energies 12, no. 24: 4783. https://0-doi-org.brum.beds.ac.uk/10.3390/en12244783