Factors That Contribute to Changes in Local or Municipal GHG Emissions: A Framework Derived from a Systematic Literature Review


Institute of Science and Innovation in Mechanical and Industrial Engineering (INEGI), Faculty of Engineering of the University of Porto (FEUP), Rua Dr. Roberto Frias, 400, 4200-465 Porto, Portugal
*
Author to whom correspondence should be addressed.
Energies 2020, 13(12), 3205; https://0-doi-org.brum.beds.ac.uk/10.3390/en13123205
Submission received: 15 April 2020
/
Revised: 15 June 2020
/
Accepted: 16 June 2020
/
Published: 19 June 2020
(This article belongs to the Special Issue Energy Saving at Cities)
Abstract
:The changes observed in a municipal or local energy system over a period of time is due a number of concurrent dynamics such as the local social and economic trends, higher-level policies (e.g., national), and the local policies. Thus, a thorough identification and characterization of the many factors of change is key for an adequate assessment of the effectiveness of policies adopted at the local level, as well as for future planning. Such thorough identification and characterization of the factors that are determinant for the evolution of the local energy system is the content of this paper. The identification is performed through a systematic literature review, followed by a synthesis process. The factors identified are grouped into the categories of local context, local socio-economic and cultural evolution, higher-level governance framework, and local climate change mitigation actions. They are represented through a set of measurable variables. The factors and respective variables can be used to improve the disaggregation of changes in the local energy system into individual causes, leading to a better assessment of the evolution over time.
1. Introduction
Local actions are crucial for the achievement of global climate change mitigation goals. Both the physical characteristics of the local energy systems and the regulatory competences of local authorities prompt local level as an appropriate level for action [1]. Moreover, local actions are becoming more common, due to the increasingly active role of local authorities and to the recognition of their importance by policy makers at higher governance levels. Thus, there is an increasing need to assess their contribution towards climate change mitigation, and to the achievement of global targets.
However, given the universal scope of climate policy and the link between the local energy system and local context, it is currently very difficult to properly assess the actual contribution of local policy actions. Indeed, the local energy system is influenced by numerous factors, of which only some are related with actions promoted by local authorities. The changes in the economic activity or on population are two examples. The assessment difficulties are amplified by the fact that local policies and actions are implemented as a part of a complex multi-level governance framework.
Previous studies have already highlighted the importance of considering external factors when evaluating local actions. Within the studies reviewed in [2], several factors were identified as key in the link between observed changes and actual effects of local climate change mitigation actions. For instance, the evolution of local socio-economic features (structure of local economy, demographic and economic conditions of local population, etc.), prompted by economic, social, and technological changes, is one of the aspects that are commonly considered relevant for the observed variation in local GHG emissions. However, within existing studies, a comprehensive analysis of all the relevant factors that influence the local energy system and the corresponding GHG emissions was not found.
Moreover, the analysis of empirical studies focusing on assessing the effects of local actions has emphasized this need to thoroughly identify all the factors that contribute to changes in local GHG emissions [3,4,5]. For instance, in [3], Millard-Ball performed a quantitative analysis on the effects of city climate policy, without considering any external factors; although some scattered evidence of climate plans effects was found, the findings are not sufficiently robust (which could be partly explained by the non-consideration of other relevant factors). The evidence for impact of local climate plans in the different sectors is not demonstrated with the empirical analysis, which does not provide a coherent result across the different models that were tested. Similarly, in [5], the conclusions drawn were also insufficient to prove the causal link between local actions and GHG emissions. Within the results from the linear regression analysis with panel data, the coefficient associated with the effect of local actions is not statistically significant for any of the countries that were included in the study. However, in the same analysis, the relevance of municipality specificities as well as of higher-level context (i.e., country) for the assessment of local GHG emissions and their evolution over time was confirmed (resulting in coefficients that are statistically significant). Both these studies show the need for a comprehensive consideration of the different factors that impact local GHG emissions to ensure a robust and meaningful assessment of the specific impact of local climate change mitigation actions.
Thus, the identification of the factors of change of local GHG emissions is a crucial step towards a more complete understanding of the observed changes within the local energy system and assessment of the actual effects of local climate change mitigation actions. Indeed, to develop a model that is able to adequately represent the evolution of the local energy system, identifying the links between the changes in local GHG emissions and the different explanatory factors, it is necessary to first identify all the factors that may have an impact on local GHG emissions (factors of change). Herein, factors of change refer to all features and events that lead to changes in the local energy system and respective GHG emissions. These include factors related with local climate change mitigation actions as well as external factors (i.e., factors that are not directly influenced by actions promoted by local authorities). For instance, local demographic evolution—size and structure of local population—may lead to significant changes in the local energy system and, consequently, on the respective GHG emissions.
This paper attempts to perform a systematic identification and characterization of the factors of change of local GHG emissions. This comprises the identification of all factors that may potentially influence local emissions, even if their specific effects in the local energy system are not quantifiable or even relevant (depending on the local system being studied). In order for this to be applicable in the future, it is necessary not only to identify the relevant factors of change, but also to characterize them with indicators. Therefore, that is also covered by this paper. The work is presented in five sections. Section 2 describes the methodological approach that was used to identify the factors of change of local GHG emissions and the review process, including the documents used as reference to this analytical framework, as well as the presentation of the final list of factors identified. Section 3 is dedicated to the presentation of the results, including the description of the identified factors of change and the listing of the respective quantifiable indicators. Section 4 presents a brief discussion of the obtained results, focusing on their potential contribution for improved planning and evaluation of local climate change mitigation actions. The paper ends with some final remarks regarding the results obtained (Section 5).
2. Methodology
Considering the extensive research that has already been done on this topic, a wide literature review was considered an adequate methodological approach to identify and characterize the factors of change of local GHG emissions. More specifically, the method used consisted in a systematic literature review, using content analysis—which allowed reviewing, assessing, and aggregating a body of literature utilizing pre-specified standardized techniques to all the documents reviewed [6]. The definition of the specifications for data collection and analysis beforehand and respective use as a guide for performing the process aimed to avoid bias in the review.
A systematic literature review process consists of these four sequential steps: (i) definition of the objective; (ii) definition of the specifications to be followed; (iii) the retrieval and assessment of the information; and (iv) synthesis of the results obtained. In what concerns the specifications defined a priori as guidelines for the review, these consist in three types of rules/criteria: (1) the eligibility criteria to retrieve the literature; (2) the rules to retrieve information from literature; and (3) the rules for the analysis and screening of the obtained information. Table 1 presents the details of these three types of criteria.
The selection of relevant research covered the following keywords: “Energy system characterization”; “Energy system modelling”; “Energy system planning”; “Energy system scenarios”; “Energy policy evaluation”; and “Local climate change mitigation”. The keyword selection was based on the different contexts within which this discussion has been raised, including planning, policy evaluation, and energy management.
To guarantee the reliability of the results, the documents considered in the review were restricted to peer-reviewed articles published in scientific journals or conference journals, reports or working papers published by internationally reputed entities (as e.g., International Energy Agency and European Union), and PhD theses. The reviewed documents were published between 1999 and 2017. A list of the documents with a description of their main focus of research is presented in Table 2.
The information collected from the documents comprised three types of relevant information: (1) factors of change of GHG emissions; (2) variables that may be helpful to characterize the factors of change identified; and (3) information on the relation between the different factors of change and local GHG emissions.
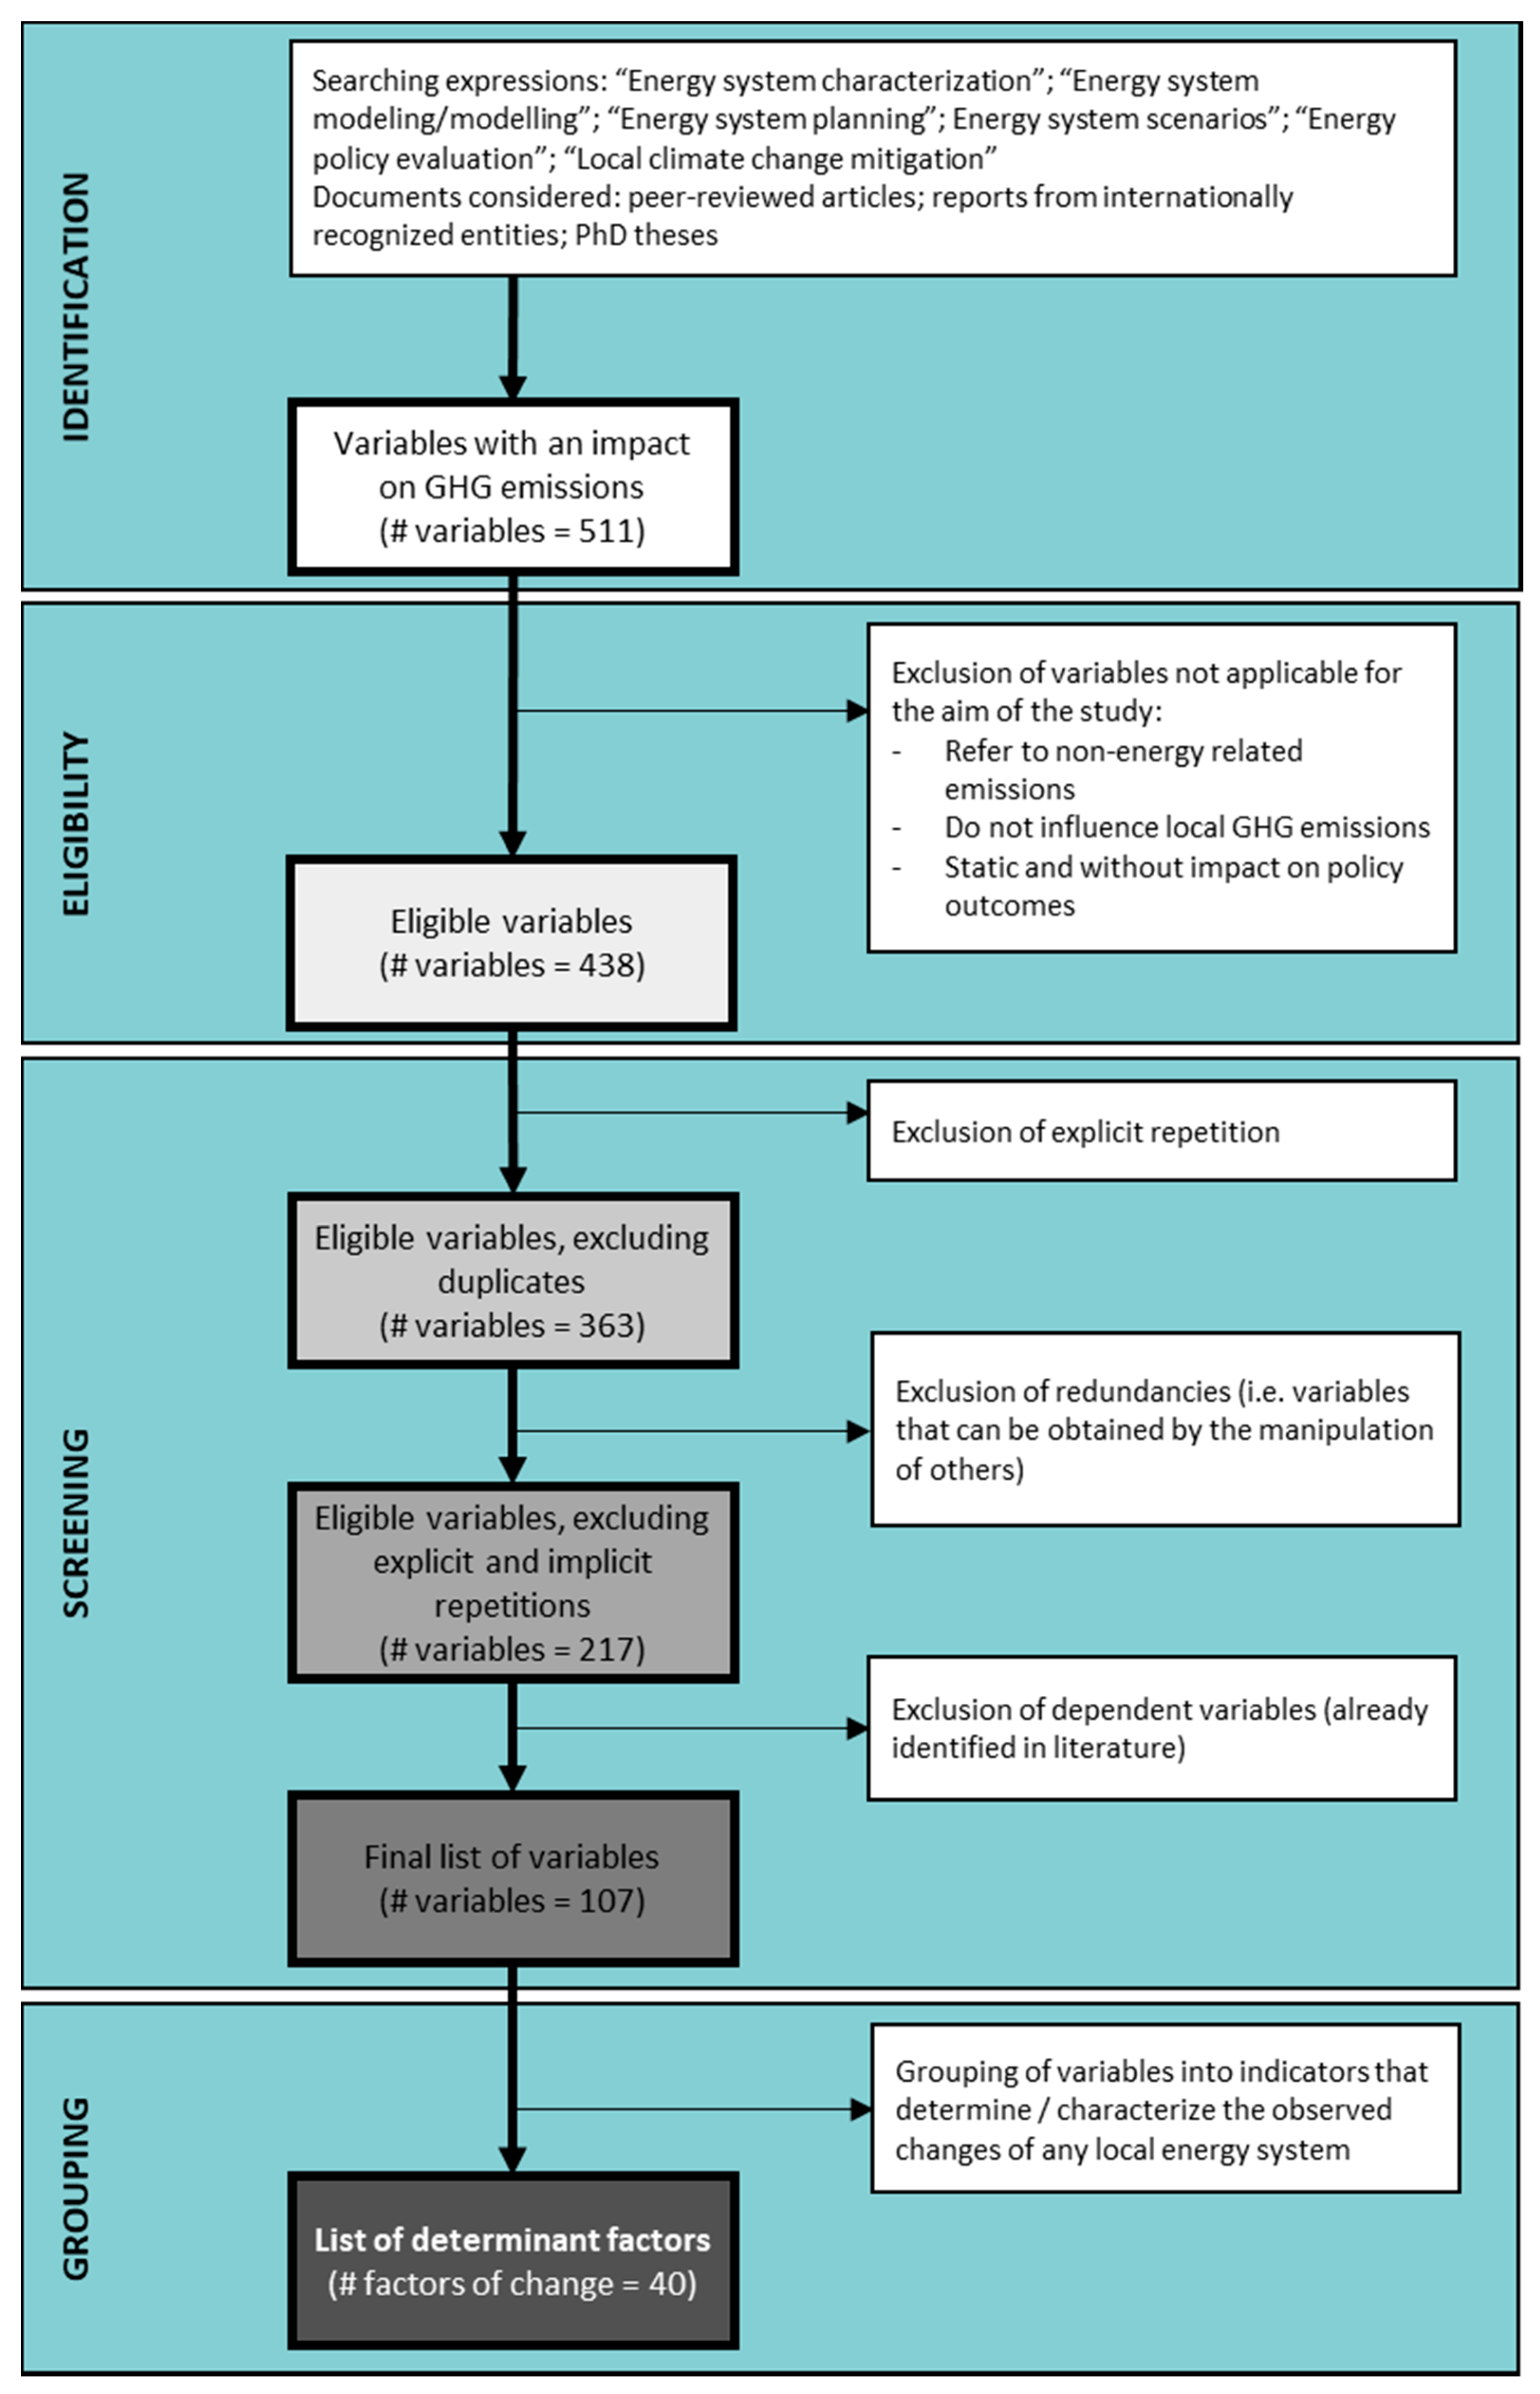
In regard to the identification of the factors of change, Figure 1 presents a schematic representation of the whole process. The analysis of these documents resulted in a list composed of 511 variables with an impact on GHG emissions. The full list, as well as the reference to the documents where each variable has been referred, is presented in Table A1 (Appendix A).
Then, to reduce the list to the essential, both the eligibility criteria (Box 2 in Figure 1) and the screening filters (Box 3 in Figure 1) were applied successively. The following paragraphs describe this process in detail.
The eligibility criteria were defined to guarantee the applicability of the framework to the assessment of local climate change mitigation actions. Firstly, it was assumed that the respective change must be associated with energy-related GHG emissions, excluding, e.g., the emissions from crops and livestock. Then, the associated effect on the energy system should also be on Scope 1 and 2 emissions—GHG emissions that can be attributed to each municipality (i.e., that local inhabitants can be made accountable for). For instance, with this condition, changes in aviation and international commerce emissions are excluded, since typically an airport serves an area much larger than the municipality. Finally, it was also defined that factors should either change over time and/or influence the effect of the other factors identified. As the goal is to decouple the observed changes in a specific local energy system into effects of the different factors of change, it makes sense that factors that are constant over time (even if determinant for local energy use) must be disregarded. For example, topography of the local territory can have significant implications for local energy use, but it cannot be considered a factor of change as it cannot lead to changes of a specific local energy system over time.
The implementation of this step corresponded to the exclusion of variables that do not comply with at least one of the three eligibility criteria. The first eligibility criteria led to the exclusion of variables such as the “existence of strategies for landfill methane capture” and “changes in cattle production or fertilization strategies”. Moreover, the constraint that implies that each factor must influence local GHG emissions led to the removal of variables such as “level of international trade” and “trade allowances between regions”. Lastly, the criteria that exclude variables that do not change over time nor have an impact on policy outcomes implied the exclusion of factors “latitude”, “topography”, and others. Overall, with the application of the eligibility criteria, 73 variables were excluded from the list. The full list of the non-eligible variables is presented in the Appendix (Table A2).
Furthermore, a screening process was defined and implemented to reduce the list of identified factors to the essential. This screening process is composed by three main steps that correspond to the application of three distinct filters: (1) explicit repetition; (2) implicit repetition; and (3) redundancy. The screening of the list of variables led to the exclusion of 331 variables. The full list of the excluded variables and the identification of the filters that led to their exclusion are presented in the Appendix A (Table A3, Table A4 and Table A5).
The filter of explicit repetition refers to the removal of duplicates, i.e., factors that were identified by more than one document. For example, the number of inhabitants (or overall local population) and GDP were two of the variables that appeared more than once in the list.
Implicit repetition refers to factors that, even if not literally in duplicate, if withdrawn from the list do not imply an information loss. This includes factors that are a combination of other two or more factors that are also listed. For instance, average household area per capita can be considered as implicit repetition if both overall population and built area for residential purposes are already listed. This led to the exclusion of variables such as average household area per person (as total household area and overall population were also listed) and sectorial GDP (as GDP per subsector was also included).
Finally, the redundancy filter corresponds to the screening for dependent factors, whose relation has already been identified by literature. With this filter, for instance, average income per capita was excluded, considering that changes in private consumption (also linked to average income) would imply the exact same impact on local GHG emissions.
Once the variables with an impact on local GHG emissions have been identified and screened, a final list that is consistent with the goal of this work was obtained. The application of the eligibility criteria and the screening filters led to a final list of 107 variables that were grouped into 40 factors of change. This was done through an aggregation process, distinguishing policy-based factors from the ones that occur naturally, and factors related to actions implemented at local level from factors associated with governance actions at higher-levels. This grouping process is detailed in Table 3.
Finally, to complete the theoretical framework, each individual factor was characterized with (preferably quantifiable) indicators. For most of the factors, the documents where they were extracted from also mentioned possible indicators. When more than one indicator was available, the choice fell back on the indicators whose data are more commonly available. When the documents did not mention possible indicators, these were searched for in national statistical agencies and policy reports from national or international governments. Within this step, there was an effort to choose indicators that use data that are commonly available for the municipality level, or equivalent scale, to avoid the need for downscaling.
3. Factors of Change of Local or Municipal GHG Emissions and Respective Characterization
This section presents the results obtained by the systematic literature review process described in the previous section. This includes discussion detailed description and an analysis of the final list of factors of change that were identified as well as the listing of the characterizing indicators for each factor of change.
To better understand the relation between the different factors of change and prompt a more fulfilling discussion, the 40 factors of change identified in the review were grouped into four distinct sets. Three of these groups correspond to three sources of change: local socio-economic and cultural changes; higher-level governance framework; and local climate change mitigation actions. The fourth group (herein referred to as local context) comprises variables that, despite not leading directly to changes of local GHG emissions, have influence on how the different sources of change impact local GHG emissions (e.g., climate awareness). A schematic representation of the relation between these sources of change and the observed changes in local GHG emissions, considering the local context, is presented in Figure 2.
3.1. Local Context
Local context refers to the local characteristics that, despite not leading directly to changes on the local energy system, influence the outcomes of both local and higher-level policies. On the one hand, this comprises the local inhabitants’ characteristics, as education level, cultural diversity, and awareness towards the problematic of climate change. On the other hand, local context also includes characteristics referring to the local authority as an entity, including human and financial resources as well as legal competences. In general, the characteristics here referred as local context do not change significantly in the medium-term.
A complete list of the factors of change considered as local context is presented in Table 4, along with the respective characterizing indicators.
A summarized description of each of the factors of change associated with local context is presented below.
3.1.1. Local Inhabitants’ Characteristics
Education level refers to the average level of education of the local population, e.g., whether the majority of local citizens have completed high school, or even a bachelor degree. Here, it was assumed that the distribution of local population per education level could be a good indicator.
Cultural diversity refers to the heterogeneity of local population in terms of cultural background. This is mostly linked with the scale of immigration to the city, currently but also in the last decades. Culture is associated with daily habits and, thus, with specific patterns of energy use and reaction towards certain policy actions/incentives. One of the possibilities to assess this diversity could be through the number of residence permits by reason (or by country of origin).
Willingness to act refers to the level of motivation of the local citizens in having an active role towards climate change mitigation, which is highly associated with their level of awareness to the problem and their civic involvement in the community. For instance, the level of awareness of local population on environmental and climate change issues can have a huge influence on the outcome of any related policy independently on the level of implementation. Even if waste associated emissions are not considered within this work, it is assumed that the share of waste separation could be a good indicator of the local population awareness on climate change issues. Moreover, the degree of civic involvement may be assessed by the number and scale of environmental nonprofits that were created at the local level.
3.1.2. Local Authorities’ Characteristics
Legal competences refers to the regulatory competences of local authorities regarding climate change mitigation, i.e., their scope of action. These may vary significantly from country to country and are determinant for the type of actions that are promoted at the local level. The level of autonomy of local authorities can be seen as a good indicator of their scope of action.
Qualified personnel corresponds to the technical competences of the municipal staff for developing and implementing actions targeting climate change mitigation. This can be assessed through the existence of a dedicated agency or municipal department to climate change mitigation, and from past experiences with these issues.
Economic situation translates the economic capacity of the local authority in financing and promoting actions towards climate change mitigation. This can be assessed by the relation between income and expenses of the local authority, which provides a characterization of their yearly profit or debt. Moreover, the ability to obtain funding, through private partnerships or public tenders, is also a relevant indicator.
3.2. Local Socio-Economic and Cultural Changes
Local socio-economic and cultural changes refer to the group of changes that result from local demographic, social, and economic changes, thus not directly caused by energy-related policies. In planning terms, this would correspond to the “business as usual” or “reference” scenario, i.e., the potential evolution of the system between two distinct moments in time, considering that no policies would be implemented in this timeframe. This comprises demographic, social, and economic changes, as well as climate variability.
The full list of factors of change associated with the local socio-economic and cultural changes that have been identified is presented in Table 5, along with the respective characterizing indicators.
3.2.1. Demographic Evolution
Demographic changes include the population growth (due to migration and natural growth) and also changes in the age pyramid and in the share of population living in urban and rural areas. All these variations imply changes in the local energy system—in the overall energy use as well as in the structure of this use. For example, energy use in urban areas differ from that in rural areas, due to the differences in heating options available (natural gas vs. traditional wood) and the different household conditions (housing type and size). A summarized description of each of the factors of change associated with demographic changes is presented below.
Population growth refers to the changes regarding the size of local population that occur within the studied timeframe. This is assessed through the number of local inhabitants and their evolution over time.
Migration to urban areas translates the level of urbanization of a municipality and its evolution over time. A change in the level of urbanization has an impact in the local energy system, in terms of preferred transportation modes, average distances traveled, and even in the type of housing. The changes in the level of urbanization can be assessed through the share of local population living in rural/urban areas.
Age pyramid refers to the distribution of the population according to their age. A change in this distribution implies changes in the local energy system, caused by the distinct energy service needs. The differences are more significant between active and inactive citizens. Thus, it is assumed that this factor of change can be assessed by the quantification of the share of active population.
3.2.2. Social Evolution
Social changes refer to the lifestyle changes of local inhabitants that occur naturally, not promoted by energy-related policies. These may include e.g., the increase of appliances ownership per capita and changes in the number of persons per household, in the residential sector, and a change in the average distance between home and work or school, in the transportation sector. Each of the factors of change associated with social evolution are described below.
Household conditions refer to lifestyle changes associated with the residential building. This includes changes in the average number of people per household (usually also linked with the evolution in families’ typology) and changes in the average size of the household. These changes can imply significant changes in the energy use for space heating and cooling, lighting, and even cooking. Moreover, changes in appliances ownership must also be considered.
Commuting needs reflect the distance between home and work/school for the local inhabitants. A variation in this distance implies also a change in the daily transportation needs, and often even a change in the transportation modes that are used for commuting. It is assumed that this factor can be assessed through the average distance traveled per person per day, for commuting purposes.
Transportation habits refer to changes in the preferences for daily traveling, for both commuting and leisure purposes. These characteristics may change over time for multiple reasons—economic, social or other. It is assumed that a large share of these changes can be estimated based on the changes in car ownership of local population.
3.2.3. Economic Evolution
Economic evolution refers to the economic situation of local inhabitants and also to the evolution of local economic activities. The effect of these changes on local energy system may be affected, even if not in a very significant way, by local context. For instance, the increase in average income of local population leads to an increase in energy use; however, the growth rate may depend on the level of awareness of the local inhabitants towards climate change issues. The factors of change associated with the economic evolution at the local level are described below.
Overall growth of local economy refers to changes in the level of activity, i.e., the overall value of the local economy. Changes in the local gross domestic products (GDP) are a good indicator for the variation in the level of activity.
Structure of local economy refers to the weight that different economic sectors (or subsectors) represent to the overall local economy. Describing the structure of economy of a specific municipality would consist on identifying the sectors responsible for a larger share of gross value added or for employing more workers and which sectors are less relevant.
Economic situation of households translates the financial situation of individuals. This includes the employment situation, which has a significant impact in the local energy system given the difference in the daily habits between employed and unemployed citizens, and the individuals purchase power. On the latter, there are several studies that demonstrate the relation between private purchase power and energy use.
3.2.4. Climate Variability
Finally, the effects of differences in climate conditions have also been included in the natural evolution of the local energy system. These vary from year to year, and temperature differences lead to changes in energy needs (mostly for heating and cooling), which must be considered. It is assumed that these changes can be assessed through the variations in annual heating and cooling degree days.
3.3. Higher-Level Governance Framework
Higher-level governance framework refers to the characteristics of international, national, and regional governance frameworks existing within the studied timeframe and focusing on energy and climate issues. Considering the variables identified in the review, it is assumed to be appropriate to separate technology evolution from specific energy and climate policies.
The full list of factors that characterize higher-level governance framework is presented in Table 6, along with the respective characterizing indicators.
3.3.1. Technology Evolution
Technology evolution can be prompted by energy related policies (targeting energy efficiency and others) but it may also be market driven (following industry needs or an attempt to reduce costs). The evolution of the energy supply sector can be seen as a mix between natural technology evolution and an effect of energy and climate policies. The energy efficiency improvement on conversion plants is an example of the former, while the preference for renewable energy sources to produce electricity, due to fee-in tariffs in the technological maturation phase, is an example of the latter.
Technical evolution refers to the technology development that occurs naturally, i.e., excluding development that is promoted by energy efficiency policies and other related instruments. This evolution can be assessed by the variation in the energy intensity for each activity sector, at national or even international level.
Market evolution corresponds to the changes in the market that lead to changes in the technology choices by both individuals and companies. This can be translated into changes in technology costs, as well as the presence of market barriers that hamper the shift towards more efficient solutions. The variation in technology costs can be characterized by, e.g., the over cost of A++ appliances compared to a B equivalent. The presence of market barriers and respective evolution over time can be assessed by the quantification of the energy efficiency gap in different moments in time.
Energy supply sector represents the changes in the national and regional energy transformation and transport activities. It includes the evolution in electricity and heat production and transport, as well as the changes in the refinery of fossil fuels. Thus, it comprises the changes in the fuel-mix of electricity and heat generation, i.e., the increase/decrease in the share of renewable energy sources that are used in electricity production, as well as the changes in the efficiency of the energy supply sector (electricity and heat production, but also oil products transformation).
3.3.2. National and International Energy-Related Policies
On what concerns the factors of change associated to energy and climate policies, two distinct groups of factors were found: the ones that characterize the existing energy and climate related policies, e.g., in terms of implementation and specific targets, and the ones that characterize the existing institutional framework regarding the promotion and support of local actions towards climate change mitigation. It is also important to mention the influence that the local context may have on the overall effect of these factors of change on the local energy system. The effects of national and international policies depend on the reaction of targeted actors to the policy instruments put in place. In turn, their reaction depends on their level of education and awareness as well as cultural habits and financial situation. All the identified factors associated with energy and climate policies are briefly described below.
Existing policies correspond to the policies that are implemented at regional, national, and international level that have a climate and/or energy purpose. These may impact positively or negatively local GHG emissions, depending on the coherence between local policies and the ones defined at higher levels of governance. Here, it is assumed that the public and private investments on environmental management and protection could be a good indicator of the scale of existing policies at governance levels other than local.
Energy costs refer to the changes in the average cost of the different energy products and the impact that these may have in the local energy system. Energy prices are usually established at the national and/or regional level, and thus are included within the changes associated with the higher-level governance framework. The average unitary price per energy product in the consumer sector, as well as the respective evolution over time, is considered a good indicator to characterize this factor of change.
Coherence with local policies refers to whether national and regional policy objectives are aligned with those that were defined at the local/municipal level. Here, the quantification of this alignment is not feasible, thus a yes or no question is suggested.
Support of local action refers to the existence of initiatives promoted at national and international level that promote actions taken at the local level. This may include technical support for the development of action plans, and energy dedicated actions, and economic incentives and support (as low-rate loans). A possible indicator to characterize the level of support could be the number of initiatives promoted at higher levels of governance that support local action.
3.4. Local Climate Change Mitigation Actions
Finally, local climate change mitigation actions include any policy actions that are promoted at the local level, by (or with the support of) local authorities, with the aim of reducing local GHG emissions. These include actions taken under a formal and wider plan and also isolated actions with a very specific target (e.g., the improvement of energy efficiency in public lighting). Here, the factors of change that have been identified are mostly related with the characterization of these actions, in terms of objectives and targeted actors as well as in what concerns implementation procedures. The factors that were identified as important for the characterization of local climate change mitigation actions are briefly described below and presented in Table 7.
Actors’ involvement refers to the group of actors that were/are involved in the local climate change mitigation actions. A distinction is made between the actors that are involved in the planning process (where actions are defined) and the ones involved in the implementation stage. The involvement of different stakeholders in the planning and implementation of climate and energy actions is considered to be beneficial for the respective acceptance and adherence by local citizens. The characterization of this involvement may be achieved by the identification of the groups of actors that were involved (e.g., local authority, local/regional energy agency, external consultant, local NGOs, citizens, etc.) and their level of involvement (co-creation, draft version public consultation, etc.).
Timeframe refers to the time span of the actions being planned/implemented. Throughout the review, the consideration of the time span of the ex-ante planning exercise (when existing) was also noted as relevant for the assessment of the outcomes of local actions. This is translated into the beginning and end years of the actual (or projected) action implementation.
Targets refer to the objectives that were defined at the local level. These include the level of GHG emissions reductions that is aimed, the wider vision concerning the local energy system, and whether there are other goals besides GHG emissions (such as creation of jobs or decrease in energy costs).
Current implementation status refers to the degree of implementation of the wider action plan (if existing) and of the different individual actions that are projected. It can be assessed as a percentage of the overall implementation target. For instance, considering an action that implied the installation of solar thermal systems for water heating in 100 residential buildings, the degree of implementation would correspond to the identification of the share of systems that were already installed.
Estimated impact corresponds to the projected outcome of the proposed actions, in terms of both energy use and GHG emissions. When a mid-term assessment is also performed, the quantification of the already achieved reductions could also be performed.
Budget refers to the level of investment needed to implement the proposed actions. Here, it is important to distinguish between the overall projected budget and the investments made thus far.
Financing sources correspond to the entities responsible for financing the actions’ implementation. This may comprise different entities, both public and private. The characterization of the financing sources could be performed by the identification of the type of entities financing the local actions (local authority’s own resources, national funds and programs, EU funds and programs, other), and the level of investment of each of the different entities.
Actions characterization corresponds to the characterization of the individual actions planned and/or implemented at the local level, in terms of: (1) area of intervention; (2) type of technical measure; and (3) policy instrument. Area of intervention is the sector and subsector of the local energy system which will be impacted by the action (residential, services, transports, etc.). Then, the technical measure refers to the type of change that is aimed at, as well as the degree of change that is intended. For instance, the shift of 10% of private cars passenger-kilometers to soft modes of transportation could be seen as a technical measure. Finally, the choice of policy instrument corresponds to the type of mechanism that is used to achieve the desired changes in the system. Using the same example, this could comprise the creation of dedicated bike lanes and/or the implementation of a congestion charge. When assessing the policy instruments, it is also useful to identify the level of financial support that is provided to the adopters of the measures (i.e., if there are economic incentives to change) and which actors are involved in their implementation.
Similar to what was said regarding the effects of higher-level policies, the influence of local context on the contribution of local actions cannot be disregarded. Local inhabitants’ characteristics may influence the outcomes of policy actions in a significant manner. Moreover, local authorities’ characteristics are an important feature on the definition and implementation of local actions. Thus, even if local actions are similar in their characteristics, their outcome can be very different if the context in which they are implemented is not the same.
4. Discussion
There are several studies that analyze the changes in local GHG emissions and potential explanatory factors. However, it was noted throughout the review that existing work is usually constrained to the consideration of a specific set of factors of change, disregarding others that may also have a significant impact on local emissions. For instance, it is common to narrow the focus to the actions that are being taken at the local level, disregarding the influence of higher-level governance framework in which they are being implemented and that may have confounding effects.
Such non-consideration of other potential factors of change hinders the accuracy of the results, as the effects calculated and associated with the considered factors may turn out to be either under- or overestimated. Indeed, the evaluation of the effects of local climate change mitigation actions will not lead to accurate results unless the remaining factors of change are taken into account. For example, in [5], the impact of local climate actions was inconclusive, partly due to the non-consideration of factors associated with the changes in local socio-economic and cultural conditions. Moreover, a better understanding of all potential factors of change of local GHG emissions can lead to better planning at local as well as regional and national levels. The interaction between the policies implemented at different governance levels could be improved by a comprehensive consideration of all factors of change and their interactions.
It is worth noting the overly simplified consideration of the local context in most of the existing work. Some of the reviewed documents refer to its importance, and how the local context specificities can be determinant for the success of local actions implementation, yet quantification methods tend to be overlooked. The systematic identification of the factors of change associated with local context may thus be a step forward for their consideration in future empirical ex-post evaluation studies and/or ex-ante planning exercises.
5. Conclusions
This paper is dedicated to a comprehensive and systematic identification and characterization of the factors that are relevant for the assessment of the observed changes in GHG emissions associated with local energy systems. This is an important contribution for the assessment of the actual effects of local climate change mitigation actions, by establishing the bases for developing analytical frameworks.
The identification was performed through a systematic literature review process. The complete list of variables encountered in the review was reduced using eligibility criteria, as well as three screening filters (explicit repetition, implicit repetition, and dependent variables). A list of 107 variables that were grouped into 40 factors of change was finally obtained.
The factors of change were grouped into four subsets, corresponding to three sources of change plus the local context. The sources of changes subsets are: local socio-economic and cultural changes; higher-level governance framework; and local climate change mitigation actions. The local context corresponds to a group of variables that, despite not leading directly to changes in local GHG emissions, have influence on how the remaining factors impact the local energy system—e.g., local inhabitants’ level of awareness and commitment towards environmental problems or local authorities’ legal scope of action.
Even if the identification of the major categories has been previously accomplished in academic studies, the major advancement of this work corresponds to their disaggregation into individual factors of change and respective characterization.
The factors identified correspond to all the factors that may potentially lead to changes in local GHG emissions. The relevance of the effects associated with each factor of change will depend on the local system in question, as well as on the timeframe addressed. Moreover, even acknowledging the difficulty of empirical validation (and quantification) of each factor individually, the obtained results comprise an advancement from what was possible thus far, providing a basis for more accurate models and analyses of the evolution of the energy systems at the local level.
These results can be used to build an analytical framework to characterize and model the evolution of a local energy system, assessing the individual effect of each of the different explanatory factors. This will allow for more accurate energy planning at the local level, taking into account the potential interactions with the external factors of change (i.e., the factors that are not controlled by local authorities). For instance, it may be used for ex-post evaluation of local climate change mitigation actions, allowing for the disaggregation of the observed changes in local GHG emissions into the causes and the isolation of the effects that were solely associated to local policies and actions.
The outcome of this work can be seen as a fundamental step towards a comprehensive assessment of the evolution of local energy systems. Such assessment is crucial for a better evaluation of the actual contribution of local climate-related policies and actions towards climate change mitigation.
Author Contributions
Conceptualization, I.A. and V.L.; Formal analysis, I.A. and V.L.; Funding acquisition, I.A.; Investigation, I.A.; Methodology, I.A.; Supervision, V.L.; Validation, I.A. and V.L.; Visualization, I.A.; Writing—original draft, I.A.; and Writing—review and editing, I.A. and V.L. All authors have read and agreed to the published version of the manuscript.
Funding
This research was funded by Fundação para a Ciência e Tecnologia (FCT—Portugal), grant number PD/BD/105862/2014, in the frame of the MIT Portugal Program. INEGI (LAETA—Grupo de Energia e Ambiente) provided financial support with the article processing charges.
Conflicts of Interest
The authors declare no conflict of interest.
Appendix A
This appendix presents in detail the process of identification and screening of the factors of change that are relevant for local GHG emissions. Table A1 presents the full list of variables identified in the literature. The four following tables are dedicated to the screening process: Table A2 presents the variables that were excluded for non-applicability; Table A3 and Table A4 present the variables that were eliminated due to explicit and implicit repetition, respectively; and Table A5 presents the variables that were excluded to avoid dependent variables.

Table A1.
Full list of variables identified in the systematic literature review process and respective sources.
Table A1.
Full list of variables identified in the systematic literature review process and respective sources.
| Document | Code | Variable |
|---|---|---|
| Auld et al. (2014) | 1.001 | Agenda setting processes |
| 1.002 | Favorable public opinion | |
| 1.003 | Favorable party platform | |
| 1.004 | Recent change in government | |
| 1.005 | Presence of champions | |
| 1.006 | Social appeal | |
| 1.007 | Availability of technology | |
| 1.008 | International processes | |
| 1.009 | Focusing events | |
| 1.010 | Action of feedback mechanism | |
| 1.011 | Timeframe | |
| 1.012 | Reporting nature | |
| 1.013 | Policy instruments | |
| 1.014 | State of activity | |
| 1.015 | Target of policy (actors) | |
| 1.016 | Source of authority at different stages (Hybrid or Government) | |
| 1.017 | Presence of flexibility mechanisms | |
| Boonekamp (2004) | 2.001 | GDP growth |
| 2.002 | Structure, main sectors | |
| 2.003 | Structure, subsectors | |
| 2.004 | Structure, final demand | |
| 2.005 | Savings, final demand | |
| 2.006 | Conversion efficiency end-users | |
| 2.007 | Co-generation end-users | |
| 2.008 | Fuel mix end-users | |
| 2.009 | Export | |
| 2.010 | Structure electricity production sectors | |
| 2.011 | Co-generation electricity production sectors | |
| 2.012 | Import | |
| 2.013 | Fuel mix electricity production sectors | |
| Boonekamp (2005) | 3.001 | Energy statistics (statistical figures) |
| 3.002 | Corrected statistics (corrections from trend breaks, etc.) | |
| 3.003 | Climate (degree-days and fraction room heating) | |
| 3.004 | GDP growth (GDP growth rate) | |
| 3.005 | Structure, main sectors (growth rate main sectors) | |
| 3.006 | Structure, subsectors (growth rate per subsector) | |
| 3.007 | Structure, final demand (Reference final demand per subsector) | |
| 3.008 | Savings, final demand (Actual final heat/electricity demand) | |
| 3.009 | Conversion efficiency end-users (Actual efficiency boilers, etc.) | |
| 3.010 | Cogeneration end-users (actual CHP figures) | |
| 3.011 | Fuel-mix end-users (Actual energy use) | |
| 3.012 | Export (Actual energy exports) | |
| 3.013 | Structure energy transformation sectors (reference use refineries/gas supply) | |
| 3.014 | Cogeneration energy transformation sectors (actual cogeneration figures) | |
| 3.015 | Efficiency energy transformation sectors (actual conversion efficiencies) | |
| 3.016 | Import (actual energy imports) | |
| 3.017 | Fuel-mix electricity production sectors (actual energy use) | |
| Broto and Bulkeley (2013) | 4.001 | Country |
| 4.002 | Urban area | |
| 4.003 | Population | |
| 4.004 | Density | |
| 4.005 | GDP | |
| 4.006 | GDP per capita | |
| 4.007 | World City Rank | |
| 4.008 | Annual population rank | |
| 4.009 | Location | |
| 4.010 | Dates | |
| 4.011 | Urban character | |
| 4.012 | Type of experiment | |
| 4.013 | Objectives | |
| 4.014 | Type of innovation | |
| 4.015 | Institutional factors | |
| 4.016 | Sector specific information | |
| 4.017 | Actors involved | |
| 4.018 | Funding | |
| 4.019 | Mode of governance | |
| 4.020 | Environmental justice | |
| 4.021 | Action targeted sectors | |
| 4.022 | Action type of schemes | |
| CoM (2010) | 5.001 | Overall CO2 reduction target |
| 5.002 | Vision | |
| 5.003 | Coordination and organizational structures created/assigned | |
| 5.004 | Staff capacity allocated | |
| 5.005 | Involvement of stakeholders and citizens | |
| 5.006 | Overall estimated budget for the Sustainable Energy Action Plan implementation | |
| 5.007 | Foreseen financing sources for the implementation | |
| 5.008 | Monitoring process | |
| 5.009 | Year | |
| 5.010 | Population | |
| 5.011 | Final energy consumption per sector and carrier | |
| 5.012 | Energy supply sources | |
| 5.013 | CO2 emissions per sector and carrier | |
| 5.014 | Date of approval | |
| 5.015 | Decision body approving the plan | |
| 5.016 | Business-as-usual projections | |
| 5.017 | Area of intervention | |
| 5.018 | Policy instrument | |
| 5.019 | Origin of the action (local or other) | |
| 5.020 | Responsible body | |
| 5.021 | Implementation timeframe | |
| 5.022 | Estimated implementation cost | |
| 5.023 | Energy savings | |
| 5.024 | Renewable energy production | |
| 5.025 | CO2 reduction | |
| 5.026 | Newest inventory year | |
| 5.027 | Population | |
| 5.028 | Final energy consumption per sector and carrier | |
| 5.029 | Energy supply sources | |
| 5.030 | CO2 emissions per sector and carrier | |
| 5.031 | Status implementation | |
| 5.032 | Implementation cost spent so far | |
| 5.033 | Renewable energy production from actions implemented so far | |
| 5.034 | CO2 reduction from actions implemented so far | |
| Corfee-Morlot et al. (2009) | 6.001 | Coherent multi-level policy framework (vertically and horizontally) |
| 6.002 | Existence of a dedicated institution/agency to deal with climate change mitigation actions/plans | |
| 6.003 | Local authority’s capacity and expertise on climate change mitigation | |
| 6.004 | Local authority’s ability to obtain funding | |
| 6.005 | Local authority’s responsibility and competences | |
| 6.006 | Support from central governments to local policies | |
| Farla and Blok (2000) | 7.001 | Total dwelling area |
| 7.002 | Average number of inhabitants | |
| 7.003 | Number of appliances per type | |
| 7.004 | Number of vehicle-kilometers of personal cars per fuel | |
| 7.005 | Number of passenger-kilometers per mode (except car) | |
| 7.006 | Number of vehicle-kilometers of freight road transportation | |
| 7.007 | Number of ton-kilometers per mode (other freight transportation) | |
| 7.008 | Number of employee-years | |
| 7.009 | Production of goods per type (piece, kg or m2) | |
| 7.010 | Cultivated land area | |
| 7.011 | Raising of cattle, pigs and chickens | |
| 7.012 | Volume index of production | |
| Fortes et al. (2014) | 8.001 | Gross domestic product (GDP) |
| 8.002 | Population | |
| 8.003 | Private consumption | |
| 8.004 | Gross value-added Agriculture | |
| 8.005 | Gross value-added Services | |
| 8.006 | Gross value-added Transports | |
| 8.007 | Gross value-added Industry | |
| Fortes et al. (2015) | 9.001 | Annual growth rate of the socio-economic indicator |
| 9.002 | Demand elasticity | |
| 9.003 | Autonomous efficiency improvement factor (industrial sectors) | |
| 9.004 | Energy and environmental policies | |
| 9.005 | Energy and environmental policy instruments | |
| 9.006 | Technical and costs evolution | |
| 9.007 | Availability and capacity limits | |
| 9.008 | Other information (discount rate, etc.) | |
| 9.009 | Endogenous resources potential and prices | |
| 9.010 | Import/export prices and boundaries | |
| Gustavsson et al. (2009) | 10.001 | Actors involved in local Climate Change mitigation |
| 10.002 | Formulation of the climate-policy strategy | |
| 10.003 | Results in terms of GHG emissions reduction | |
| 10.004 | Geography | |
| 10.005 | Business structure | |
| 10.006 | Physical circumstances | |
| 10.007 | Actors involvement | |
| Gysen et al. (2002) | 11.001 | Objectives |
| 11.002 | Instruments | |
| 11.003 | Means—Societal | |
| 11.004 | Means—Policy process | |
| 11.005 | Policy output | |
| 11.006 | Policy outcome | |
| 11.007 | Policy impact | |
| IAEA (2006) | 12.001 | Total population |
| 12.002 | Average annual growth rate of population | |
| 12.003 | Share of urban population | |
| 12.004 | Average household size in urban areas | |
| 12.005 | Average household size in rural areas | |
| 12.006 | Share of population of age 15–64 in total population | |
| 12.007 | Share of potential labor force actually working | |
| 12.008 | Share of population living in large cities | |
| 12.009 | GDP | |
| 12.010 | Average annual growth rate of GDP | |
| 12.011 | Distribution of GDP formation by kind of economic activity | |
| 12.012 | Distribution of sector gross value-added by subsectors | |
| 12.013 | Energy intensities in industry | |
| 12.014 | Penetration of energy carriers into useful thermal energy demand of the different sectors | |
| 12.015 | Average efficiencies of fuels for thermal uses per sector | |
| 12.016 | Share of transportation modes in the total demand for freight transportation | |
| 12.017 | Energy intensity of freight transportation modes | |
| 12.018 | Average intracity distance traveled per person per day | |
| 12.019 | Average load factor of intracity passenger transportation mode(s) | |
| 12.020 | Share of transportation mode(s) in the total demand for intracity passenger transportation | |
| 12.021 | Energy intensity of transportation mode(s) in intracity travel | |
| 12.022 | Average intercity distance traveled per person per day | |
| 12.023 | Inverse of car ownership ratio | |
| 12.024 | Average intercity distance driven per car per year | |
| 12.025 | Average load factor of intercity transportation mode(s) | |
| 12.026 | Share of car type(s) in the intercity transportation mode(s) | |
| 12.027 | Share of public transportation mode(s) in the intercity passenger travel by public modes | |
| 12.028 | Energy intensity of transportation mode(s) | |
| 12.029 | Fraction of urban dwellings in areas where space heating is required | |
| 12.030 | Degree days for urban dwellings | |
| 12.031 | Fraction of urban dwellings per type | |
| 12.032 | Average size of urban dwellings by type | |
| 12.033 | Fraction of floor area that is actually heated in urban areas per dwelling type | |
| 12.034 | Specific heat loss rate by urban dwelling type | |
| 12.035 | Share of urban dwellings with air conditioning, by dwelling type | |
| 12.036 | Specific cooling requirements by urban dwelling type | |
| 12.037 | Specific energy consumption for cooking in urban dwellings | |
| 12.038 | Share of urban dwellings with hot water facilities | |
| 12.039 | Specific energy consumption per urban dwelling for electric appliances | |
| 12.040 | Electricity penetration for appliances in urban households | |
| IAEA (2006) | 12.041 | Specific fossil fuel consumption per urban dwelling for lighting and non-electric appliances |
| 12.042 | Penetration of various energy forms into space heating in urban households | |
| 12.043 | Efficiency of various fuels use, relative to that of electricity use, for space heating in urban households | |
| 12.044 | Coefficient of performance of heat pumps for space heating in urban households | |
| 12.045 | Penetration of various energy forms into water heating in urban households | |
| 12.046 | Efficiency of various fuels use, relative to that of electricity use, for water heating in urban households | |
| 12.047 | Coefficient of performance of heat pumps for water heating in urban households | |
| 12.048 | Approximate share of water heating demand in urban households that can be met with solar installations | |
| 12.049 | Penetration of various energy forms into cooking in urban households | |
| 12.050 | Efficiency of various fuels use, relative to that of electricity, for cooking in urban households | |
| 12.051 | Approximate share of cooking demand in urban households that can be met with solar installations | |
| 12.052 | Share of air conditioning demand of urban households that can be met with electricity | |
| 12.053 | Coefficient of performance of electric air conditioning in urban households | |
| 12.054 | Coefficient of performance of non-electric air conditioning in urban households | |
| 12.055 | Fraction of rural dwellings in areas where space heating is required | |
| 12.056 | Degree days for rural dwellings | |
| 12.057 | Fraction of rural dwellings per type | |
| 12.058 | Average size of rural dwellings by type | |
| 12.059 | Fraction of floor area that is actually heated in rural areas per dwelling type | |
| 12.060 | Specific heat loss rate by rural dwelling type | |
| 12.061 | Share of rural dwellings with air conditioning, by dwelling type | |
| 12.062 | Specific cooling requirements by rural dwelling type | |
| 12.063 | Specific energy consumption for cooking in rural dwellings | |
| 12.064 | Share of rural dwellings with hot water facilities | |
| 12.065 | Specific energy consumption per rural dwelling for electric appliances | |
| 12.066 | Electricity penetration for appliances in rural households | |
| 12.067 | Specific fossil fuel consumption per rural dwelling for lighting and non-electric appliances | |
| 12.068 | Penetration of various energy forms into space heating in rural households | |
| 12.069 | Efficiency of various fuels use, relative to that of electricity use, for space heating in rural households | |
| 12.070 | Coefficient of performance of heat pumps for space heating in rural households | |
| 12.071 | Penetration of various energy forms into water heating in rural households | |
| 12.072 | Efficiency of various fuels use, relative to that of electricity use, for water heating in rural households | |
| 12.073 | Coefficient of performance of heat pumps for water heating in rural households | |
| 12.074 | Approximate share of water heating demand in rural households that can be met with solar installations | |
| IAEA (2006) | 12.075 | Penetration of various energy forms into cooking in rural households |
| 12.076 | Efficiency of various fuels use, relative to that of electricity, for cooking in rural households | |
| 12.077 | Approximate share of cooking demand in rural households that can be met with solar installations | |
| 12.078 | Share of air conditioning demand of rural households that can be met with electricity | |
| 12.079 | Coefficient of performance of electric air conditioning in rural households | |
| 12.080 | Coefficient of performance of non-electric air conditioning in rural households | |
| 12.081 | Share of service sector in the total active labor force | |
| 12.082 | Average floor area per employee in the Service sector | |
| 12.083 | Share of Service sector floor area requiring space heating | |
| 12.084 | Share of Service sector floor area requiring space heating that is actually heated | |
| 12.085 | Specific space heat requirements of Service sector floor area | |
| 12.086 | Share of air-conditioned Service sector floor area | |
| 12.087 | Specific cooling requirements in the Service sector | |
| 12.088 | Energy intensity of motor fuel use per Services’ subsector | |
| 12.089 | Energy intensity of electricity specific uses per Services’ subsector | |
| 12.090 | Energy intensity of thermal uses (except space heating) per Services’ subsector | |
| 12.091 | Penetration of various energy forms into space heating in Service sector | |
| 12.092 | Penetration of various energy forms into other thermal uses in the Service sector | |
| 12.093 | Efficiency of various fuels use, relative to that of electricity use, for thermal uses in Service sector | |
| 12.094 | Coefficient of performance of heat pumps in space heating in Service sector | |
| 12.095 | Share of low-rise buildings in the total Service sector floor area | |
| 12.096 | Approximate share of thermal uses in the Service sector that can be met by solar installations | |
| 12.097 | Share of air-conditioning that can be met with electricity | |
| 12.098 | Coefficient of performance of electric air conditioning in Service sector | |
| 12.099 | Coefficient of performance of non-electric air conditioning in Service sector | |
| IEA (2014) | 13.001 | Population |
| 13.002 | Floor area per capita | |
| 13.003 | Persons per household | |
| 13.004 | Appliances ownership per capita | |
| 13.005 | Heat per floor area | |
| 13.006 | Domestic how water energy per capita | |
| 13.007 | Cooking energy per capita | |
| 13.008 | Electricity for lighting per floor area | |
| 13.009 | Energy per appliance | |
| 13.010 | Passenger-kilometers | |
| 13.011 | Share of total passenger-kilometers by mode | |
| 13.012 | Energy per passenger-kilometer by mode | |
| 13.013 | Tons-kilometers | |
| 13.014 | Share of total ton-kilometers by mode | |
| 13.015 | Energy per ton-kilometer by mode | |
| 13.016 | Services value-added | |
| 13.017 | Energy per value-added (services) | |
| 13.018 | Industry subsectors value-added | |
| 13.019 | Share of total value-added by subsector | |
| 13.020 | Energy per value-added by subsector | |
| 13.021 | Agriculture value-Added | |
| 13.022 | Share of total value-added by subsector | |
| 13.023 | Energy per value-added by subsector | |
| 13.024 | Changes in CO2 intensity | |
| 13.025 | Changes in input coefficients | |
| 13.026 | Changes in the composition of final demand | |
| 13.027 | Changes in the level of final demand (economic growth) | |
| Jovanovic et al. (2010) | 14.001 | Population growth |
| 14.002 | Persons per household | |
| 14.003 | Share of the potential labor force | |
| 14.004 | Share of the population outside the community | |
| 14.005 | Share of rural population | |
| 14.006 | GDP | |
| 14.007 | GDP growth rate | |
| 14.008 | Monetary values per capita of the major sectors and subsectors | |
| 14.009 | Efficiency of appliances/vehicles | |
| 14.010 | Buildings insulation | |
| Kasperson et al. (1995) | 15.001 | Population growth |
| 15.002 | Migration | |
| 15.003 | Natural growth | |
| 15.004 | Irrigation development | |
| 15.005 | Mechanization | |
| 15.006 | Fertilization | |
| 15.007 | Pasture improvement | |
| 15.008 | Industrialization infrastructure | |
| 15.009 | Agricultural intensification | |
| 15.010 | Urbanization | |
| 15.011 | Poverty | |
| 15.012 | International market | |
| 15.013 | National market | |
| 15.014 | State policy | |
| 15.015 | Shift to commodity production | |
| 15.016 | Foreign debt, balance of trade | |
| 15.017 | Resource allocation rules and institutions | |
| 15.018 | Capital extraction | |
| 15.019 | Political corruption | |
| 15.020 | Frontier development | |
| 15.021 | Ethnic/religious views | |
| 15.022 | Mass-consuming view of nature | |
| 15.023 | Acceptance of corruption | |
| Lin et al. (2010) | 16.001 | Population |
| 16.002 | Population growth rate | |
| 16.003 | Size of households | |
| 16.004 | Number of households | |
| 16.005 | GDP | |
| 16.006 | Growth rate of GDP | |
| 16.007 | Measures and policies already promulgated | |
| 16.008 | Measure/Action | |
| 16.009 | Intensity of measure (degree of implementation) | |
| 16.010 | Competences of local authorities in implementation fields | |
| 16.011 | Investment costs | |
| 16.012 | Implementation experiences | |
| Millard-Ball (2012) | 17.001 | Population |
| 17.002 | Employment | |
| 17.003 | Average income | |
| 17.004 | Education | |
| 17.005 | Environmental voting | |
| 17.006 | Civic | |
| 17.007 | Non-residential building | |
| 17.008 | Latitude | |
| 17.009 | Ped/bike mode share | |
| 17.010 | Time | |
| 17.011 | Number of certified buildings | |
| 17.012 | Share of renewable energy sources electricity microgeneration | |
| 17.013 | Street lighting expenditure | |
| 17.014 | Use of soft modes | |
| Morlet and Keirstead (2013) | 18.001 | City power (EU, 2007) |
| 18.002 | City size (population) | |
| 18.003 | Legal structure and status | |
| 18.004 | Spending power | |
| 18.005 | Control over income | |
| 18.006 | Civic involvement (voting patterns) | |
| 18.007 | Herfindahl–Hirschman index (degree of competition in the national electricity system) | |
| 18.008 | Degree of electricity generated in combined heat and power systems | |
| 18.009 | City’s population | |
| 18.010 | Wealth (GDP per capita) | |
| 18.011 | Climate (Heating Degree Days) | |
| 18.012 | Price of energy (gas and electricity) and relative share of any taxes or levies—energy costs | |
| 18.013 | Carbon intensity of fuels | |
| 18.014 | Targets set by each city for GHG emissions reductions | |
| 18.015 | Annual energy demand | |
| 18.016 | Policy type (Financial/Non-financial) | |
| Murphy et al. (2012) | 19.001 | Policy instrument combinations |
| 19.002 | Obligating/Incentivizing balance | |
| 19.003 | Long-term program | |
| 19.004 | Non-generic instruments | |
| 19.005 | Primacy to energy efficiency | |
| 19.006 | Whole house/deep retrofit | |
| 19.007 | Energy sufficiency | |
| 19.008 | Policy theory associated with instruments applied | |
| 19.009 | Description of the impact of instruments (secondary sources and interviews) | |
| Nassen (2014) | 20.001 | Total consumption |
| 20.002 | Household size | |
| 20.003 | Age of occupants | |
| 20.004 | Education of occupants | |
| 20.005 | Dwelling type | |
| 20.006 | Urbanity | |
| Neji and Astrand (2006) | 21.001 | Changes in knowledge |
| 21.002 | Awareness and behavior of important actors | |
| 21.003 | Technology performance | |
| 21.004 | Price development | |
| 21.005 | Sales data | |
| 21.006 | Market share | |
| 21.007 | Changes in manufacturers assortment | |
| Praznik et al. (2013) | 22.001 | Surface area to volume ratio |
| 22.002 | Orientation of the facades’ transparent elements | |
| 22.003 | Thermal zoning of the building and the separation of its unheated parts from the thermal envelope | |
| 22.004 | Heated area per occupant | |
| Rai and Robinson (2015) | 23.001 | Attitude factors |
| 23.002 | Economic factors | |
| 23.003 | Social factors (impact on agents’ attitude) | |
| Schipper et al. (2001) | 24.001 | Population |
| 24.002 | Floor area per capita | |
| 24.003 | Persons per household | |
| 24.004 | Appliances ownership per capita | |
| 24.005 | Intensity for different uses | |
| 24.006 | Total passenger-kilometers | |
| 24.007 | Distribution of passenger-kilometers per mode | |
| 24.008 | Energy/passenger-kilometer per mode | |
| 24.009 | Distribution of value-added per subsector | |
| 24.010 | Average energy/value-added per subsector | |
| Sobrino and Monzon (2014) | 25.001 | Carbon intensity of road transport |
| 25.002 | Energy intensity of road transport | |
| 25.003 | Use intensity | |
| 25.004 | Motorization rate | |
| 25.005 | Job intensity | |
| 25.006 | Workers income intensity | |
| 25.007 | GDP | |
| Spyridaki and Flamos (2014) | 26.001 | Electricity market structure and design |
| 26.002 | Interconnection of domestic electricity markets in Europe | |
| 26.003 | Primary factor: labor, capital, conventional and non-conventional resources | |
| 26.004 | Supply and demand parameters | |
| 26.005 | Incumbent policy framework included in the reference scenario | |
| 26.006 | Different renewable energy sources penetration levels | |
| 26.007 | Renewable energy source potential | |
| 26.008 | Efficiency of the whole electricity system | |
| 26.009 | Emissions of other air pollutants | |
| 26.010 | Discount rate for investments | |
| 26.011 | Firm behavior | |
| 26.012 | Allowance trade patterns among regions | |
| 26.013 | Socio-demographic and lifestyle trends | |
| 26.014 | Interconnection of domestic electricity markets in Europe | |
| 26.015 | Political context in which policy instruments are imposed | |
| 26.016 | Supply and demand parameters | |
| 26.017 | Firm behavior | |
| 26.018 | Simplification in technology production options and load segments of electricity production | |
| 26.019 | Limited analysis of constraints in output | |
| 26.020 | Slope of demand and supply curves | |
| 26.021 | Electricity market structure and design | |
| 26.022 | Technology market failures and other externalities related to electricity generation design | |
| 26.023 | Trading options | |
| 26.024 | Banking of emissions | |
| 26.025 | Alternative compliance payments | |
| 26.026 | Distinctions between price based or quantity-based policy instruments with variations in prices and quotas for commodities | |
| 26.027 | Uniform/Differentiated feed in tariff rate | |
| 26.028 | Phase in of Renewable Portfolio Standard | |
| 26.029 | Annual digression rate of feed in tariff rate | |
| 26.030 | Limitation of the payment period | |
| 26.031 | Tariff reduction due to inflation | |
| 26.032 | Distinctions between price based or quantity-based policy instruments with variations in prices and quotas for commodities | |
| 26.033 | International emissions trading | |
| 26.034 | Uniform and unilateral imposition of carbon taxes across all EU-ETS regions | |
| 26.035 | Lump-sum treatment of additional tax revenues | |
| 26.036 | Stringency levels | |
| 26.037 | Different application scope | |
| 26.038 | Nature of targets, the target groups, the policy-implementing agents, the available budget, the available information on the initially expected energy-savings impact, and the cost effectiveness of the instrument | |
| Spyridaki and Flamos (2014) | 26.039 | Distinctions between price-based or quantity-based policy instruments |
| 26.040 | Different renewable energy sources and support design elements | |
| 26.041 | Variable scenarios in the short and long run for key policy parameters such as price of certificate, level of obligation, level of sales tax and the level of penalty | |
| 26.042 | Fixed-price policies and endogenous price policies | |
| 26.043 | Technology specific hurdle rates reflecting market barriers, consumer preferences and risk factors limiting purchase of new energy technologies | |
| 26.044 | Conditions for implementation and proper utilization of saving options (technology equipment availability, familiarity with the policy, overcoming barriers, motivation to invest) | |
| 26.045 | Specific implementation of policy instruments with regard to their funding | |
| 26.046 | Transaction costs | |
| 26.047 | Stability and credibility in policy regime | |
| 26.048 | Implementation period of the policy instrument | |
| 26.049 | Circumstances in which to apply a policy instrument (challenges in addressing different target groups, challenges in addressing different scopes, addressing a financial, knowledge barrier, internalizing externalities, addressing market competition, conditions under which a policy combination is required, conditions of policy redundancy) | |
| 26.050 | Implicit and explicit assumptions in the policy implementation process and mapping the cause-impact relationships | |
| 26.051 | Transaction costs related to the combined policy cycle | |
| 26.052 | Regulatory decisions on the additionality of energy savings from individual projects | |
| Tang et al. (2010) | 27.001 | Political will |
| 27.002 | State-level mandates concerning climate change (national) | |
| 27.003 | Wealth | |
| 27.004 | Coastal distance | |
| 27.005 | Population density | |
| 27.006 | Hazard damage | |
| 27.007 | Energy consumption | |
| 27.008 | Light transportation (soft modes and public transportation) | |
| 27.009 | Average commuting time | |
| 27.010 | Vehicular emission | |
| 27.015 | Concept of climate change or global warming | |
| 27.016 | Concept of GHG emission | |
| 27.017 | Effects and impact of climate change | |
| 27.018 | Long-term goals and detailed targets for GHG emissions | |
| 27.019 | Emissions inventory | |
| 27.020 | Base year emissions | |
| 27.021 | Emissions trend forecast | |
| 27.022 | Vulnerability assessment | |
| 27.023 | Cost estimates for GHG emissions reduction | |
| 27.024 | Using analysis tools | |
| 27.025 | Public awareness, education, and participation | |
| Tang et al. (2010) | 27.026 | Inter-organizational coordination procedures |
| 27.027 | GHG emissions reduction fee | |
| 27.028 | Establish a carbon tax | |
| 27.029 | Disaster resistant land use and building code | |
| 27.030 | Mixed use and compact development | |
| 27.031 | Infill development and reuse of remediated brownfield sites | |
| 27.032 | Green building and green infrastructure | |
| 27.033 | Low-impact design for impervious surface | |
| 27.034 | Control of urban service/growth boundaries | |
| 27.035 | Alternative transportation strategies | |
| 27.036 | Transit-oriented development and corridor improvements | |
| 27.037 | Parking standards adjustment | |
| 27.038 | Pedestrian/resident friendly, bicycle friendly, transit-oriented community design | |
| 27.039 | Renewable energy and solar energy | |
| 27.040 | Energy efficiency and energy stars | |
| 27.041 | Landfill methane capture strategies | |
| 27.042 | Zero waste reduction and high recycling strategy | |
| 27.043 | Creation of conservation zones or protected areas | |
| 27.044 | Watershed-based and ecosystem-based land management | |
| 27.045 | Vegetation protection | |
| 27.046 | Establish implementation priorities for actions | |
| 27.047 | Financial/budget commitment | |
| 27.048 | Identify roles and responsibilities among sectors and stakeholders | |
| 27.049 | Continuous monitoring, evaluation and update | |
| 27.050 | Overall energy efficiency gains | |
| 27.051 | Final intensity | |
| 27.052 | Primary intensity | |
| 27.053 | Energy efficiency gains | |
| 27.054 | Energy intensity (industry, manufacturing, chemicals, European Union structure) | |
| 27.055 | Specific consumption (steel, cement, paper) | |
| 27.056 | Energy efficiency gains | |
| 27.057 | Consumption per unit of traffic (road car equivalent, freight, air) | |
| 27.058 | Car efficiency (fleet average, new cars) | |
| 27.059 | Mobility in transport (public transport, freight) | |
| 27.060 | Energy efficiency gains | |
| 27.061 | Consumption per dwelling (total, electricity, scaled to European Union climate) | |
| 27.062 | Heating consumption (per dwelling, per m2) | |
| 27.063 | Energy consumption per employee (total, electricity) | |
| 27.064 | Energy intensity (total, electricity) |
Table A2.
Variables excluded for non-applicability in the systematic literature review process.
| Code | Variable |
|---|---|
| 1.004 | Recent change in government |
| 1.005 | Presence of champions |
| 1.008 | International processes |
| 1.009 | Focusing events |
| 1.010 | Action of feedback mechanism |
| 4.007 | World City Rank |
| 4.009 | Location |
| 9.002 | Demand elasticity |
| 9.009 | Endogenous resources potential and prices |
| 9.010 | Import/export prices and boundaries |
| 10.003 | Results in terms of GHG emissions reduction |
| 10.004 | Geography |
| 10.005 | Business structure |
| 10.006 | Physical circumstances |
| 11.005 | Policy output |
| 11.006 | Policy outcome |
| 11.007 | Policy impact |
| 12.008 | Share of population living in large cities |
| 12.037 | Specific energy consumption for cooking in urban dwellings |
| 12.039 | Specific energy consumption per urban dwelling for electric appliances |
| 12.041 | Specific fossil fuel consumption per urban dwelling for lighting and non-electric appliances |
| 12.063 | Specific energy consumption for cooking in rural dwellings |
| 12.065 | Specific energy consumption per rural dwelling for electric appliances |
| 12.067 | Specific fossil fuel consumption per rural dwelling for lighting and non-electric appliances |
| 15.006 | Fertilization |
| 15.007 | Pasture improvement |
| 15.015 | Shift to commodity production |
| 15.016 | Foreign debt, balance of trade |
| 15.017 | Resource allocation rules and institutions |
| 15.018 | Capital extraction |
| 15.019 | Political corruption |
| 15.020 | Frontier development |
| 15.023 | Acceptance of corruption |
| 17.007 | Non-residential building |
| 17.008 | Latitude |
| 17.011 | Number of certified buildings |
| 17.013 | Street lighting expenditure |
| 18.007 | Herfindahl–Hirschman index (degree of competition in the national electricity system) |
| 18.013 | Carbon intensity of fuels |
| 18.015 | Annual energy demand |
| 20.001 | Total consumption |
| 21.007 | Changes in manufacturers assortment |
| 22.001 | Surface area to volume ratio |
| 22.002 | Orientation of the facades’ transparent elements |
| 22.003 | Thermal zoning of the building and the separation of its unheated parts from the thermal envelope |
| 22.004 | Heated area per occupant |
| 26.001 | Electricity market structure and design |
| 26.002 | Interconnection of domestic electricity markets in Europe |
| 26.003 | Primary factor: labor, capital, conventional and non-conventional resources |
| 26.004 | Supply and demand parameters |
| 26.005 | Incumbent policy framework included in the reference scenario |
| 26.007 | Renewable energy source potential |
| 26.009 | Emissions of other air pollutants |
| 26.011 | Firm behavior |
| 26.012 | Allowance trade patterns among regions |
| 26.014 | Interconnection of domestic electricity markets in Europe |
| 26.016 | Supply and demand parameters |
| 26.017 | Firm behavior |
| 26.019 | Limited analysis of constraints in output |
| 26.020 | Slope of demand and supply curves |
| 26.049 | Circumstances in which to apply policy instrument (challenges in addressing different target groups, challenges in addressing different scopes, addressing a financial, knowledge barrier, internalizing externalities, addressing market competition, conditions under which a policy combination is required, conditions of policy redundancy) |
| 26.050 | Implicit and explicit assumptions in the policy implementation process and mapping the cause-impact relationships |
| 26.051 | Transaction costs related to the combined policy cycle |
| 26.052 | Regulatory decisions on the additionality of energy savings from individual projects |
| 27.004 | Coastal distance |
| 27.006 | Hazard damage |
| 27.007 | Energy consumption |
| 27.019 | Emissions inventory |
| 27.020 | Base year emissions |
| 27.022 | Vulnerability assessment |
| 27.024 | Using analysis tools |
| 27.062 | Heating consumption (per dwelling, per m2) |
| 27.063 | Energy consumption per employee (total, electricity) |
Table A3.
Variables excluded for explicit repetition in the systematic literature review process.
| Code | Variable |
|---|---|
| 1.011 | Timeframe |
| 1.013 | Policy instruments |
| 1.015 | Target of policy (actors) |
| 1.016 | Source of authority at different stages (Hybrid or Government) |
| 2.002 | Structure, main sectors |
| 2.003 | Structure, subsectors |
| 2.004 | Structure, final demand |
| 2.005 | Savings, final demand |
| 2.006 | Conversion efficiency end-users |
| 2.007 | Co-generation end-users |
| 2.008 | Fuel mix end-users |
| 2.009 | Export |
| 2.010 | Structure electricity production sectors |
| 2.011 | Co-generation electricity production sectors |
| 2.012 | Import |
| 2.013 | Fuel mix electricity production sectors |
| 3.004 | GDP growth (GDP growth rate) |
| 4.003 | Population |
| 4.004 | Density |
| 4.005 | GDP |
| 4.010 | Dates |
| 4.011 | Urban character |
| 4.017 | Actors involved |
| 4.020 | Environmental justice |
| 5.010 | Population |
| 5.027 | Population |
| 7.002 | Average number of inhabitants |
| 9.001 | Annual growth rate of the socio-economic indicator |
| 9.008 | Other information (discount rate, etc.) |
| 11.001 | Objectives |
| 11.002 | Instruments |
| 12.009 | GDP |
| 12.010 | Average annual growth rate of GDP |
| 12.011 | Distribution of GDP formation by kind of economic activity |
| 12.013 | Energy intensities in industry |
| 13.001 | Population |
| 13.002 | Floor area per capita |
| 13.003 | Persons per household |
| 13.004 | Appliances ownership per capita |
| 13.016 | Services value-added |
| 13.018 | Industry subsectors value-added |
| 13.021 | Agriculture value-Added |
| 14.006 | GDP |
| 16.001 | Population |
| 16.002 | Population growth rate |
| 16.003 | Size of households |
| 16.005 | GDP |
| 16.006 | Growth rate of GDP |
| 16.011 | Investment costs |
| 17.001 | Population |
| 17.006 | Civic |
| 17.010 | Time |
| 17.014 | Use of soft modes |
| 18.002 | City size (population) |
| 18.009 | City’s population |
| 18.010 | Wealth (GDP per capita) |
| 18.016 | Policy type (Financial/Non-financial) |
| 20.004 | Education of occupants |
| 20.006 | Urbanity |
| 24.001 | Population |
| 24.003 | Persons per household |
| 24.006 | Total passenger-kilometers |
| 24.007 | Distribution of passenger-kilometers per mode |
| 24.008 | Energy/passenger-kilometer per mode |
| 24.009 | Distribution of value-added per subsector |
| 25.007 | GDP |
| 26.008 | Efficiency of the whole electricity system |
| 26.048 | Implementation period of the policy instrument |
| 27.008 | Light transportation (soft modes and public transportation) |
| 27.023 | Cost estimates for GHG emissions reduction |
| 27.047 | Financial/budget commitment |
| 27.049 | Continuous monitoring, evaluation and update |
| 27.059 | Mobility in transport (public transport, freight) |
| 27.061 | Consumption per dwelling (total, electricity, scaled to European Union climate) |
Table A4.
Variables excluded for implicit repetition in the systematic literature review process.
| Code | Variable |
|---|---|
| 1.003 | Favorable party platform |
| 1.007 | Availability of technology |
| 1.012 | Reporting nature |
| 3.005 | Structure, main sectors (growth rate main sectors) |
| 3.006 | Structure, subsectors (growth rate per subsector) |
| 4.001 | Country |
| 4.002 | Urban area |
| 4.006 | GDP per capita |
| 4.008 | Annual population rank |
| 4.013 | Objectives |
| 4.016 | Sector specific information |
| 4.022 | Action type of schemes |
| 5.005 | Involvement of stakeholders and citizens |
| 5.009 | Year |
| 7.001 | Total dwelling area |
| 7.003 | Number of appliances per type |
| 7.004 | Number of vehicle-kilometers of personal cars per fuel |
| 7.005 | Number of passenger-kilometers per mode (except car) |
| 7.006 | Number of vehicle-kilometers of freight road transportation |
| 7.007 | Number of ton-kilometers per mode (other freight transportation) |
| 7.008 | Number of employee-years |
| 8.002 | Population |
| 9.003 | Autonomous efficiency improvement factor (industrial sectors) |
| 10.002 | Formulation of the climate-policy strategy |
| 10.007 | Actors involvement |
| 11.003 | Means—Societal |
| 12.001 | Total population |
| 12.002 | Average annual growth rate of population |
| 12.004 | Average household size in urban areas |
| 12.005 | Average household size in rural areas |
| 12.006 | Share of population of age 15–64 in total population |
| 12.016 | Share of transportation modes in the total demand for freight transportation |
| 12.017 | Energy intensity of freight transportation modes |
| 12.020 | Share of transportation mode(s) in the total demand for intracity passenger transportation |
| 12.021 | Energy intensity of transportation mode(s) in intracity travel |
| 12.027 | Share of public transportation mode(s) in the intercity passenger travel by public modes |
| 12.028 | Energy intensity of transportation mode(s) |
| 12.029 | Fraction of urban dwellings in areas where space heating is required |
| 12.030 | Degree days for urban dwellings |
| 12.031 | Fraction of urban dwellings per type |
| 12.032 | Average size of urban dwellings by type |
| 12.033 | Fraction of floor area that is actually heated in urban areas per dwelling type |
| 12.034 | Specific heat loss rate by urban dwelling type |
| 12.036 | Specific cooling requirements by urban dwelling type |
| 12.038 | Share of urban dwellings with hot water facilities |
| 12.055 | Fraction of rural dwellings in areas where space heating is required |
| 12.056 | Degree days for rural dwellings |
| 12.057 | Fraction of rural dwellings per type |
| 12.058 | Average size of rural dwellings by type |
| 12.059 | Fraction of floor area that is actually heated in rural areas per dwelling type |
| 12.060 | Specific heat loss rate by rural dwelling type |
| 12.062 | Specific cooling requirements by rural dwelling type |
| 12.064 | Share of rural dwellings with hot water facilities |
| 13.019 | Share of total value-added by subsector |
| 13.022 | Share of total value-added by subsector |
| 13.024 | Changes in CO2 intensity |
| 13.025 | Changes in input coefficients |
| 13.026 | Changes in the composition of final demand |
| 13.027 | Changes in the level of final demand (economic growth) |
| 14.005 | Share of rural population |
| 14.007 | GDP growth rate |
| 14.008 | Monetary values per capita of the major sectors and subsectors |
| 14.009 | Efficiency of appliances/vehicles |
| 15.009 | Agricultural intensification |
| 15.010 | Urbanization |
| 16.004 | Number of households |
| 16.010 | Competences of local authorities in implementation fields |
| 17.009 | Ped/bike mode share |
| 17.012 | Share of renewable energy sources electricity microgeneration |
| 18.001 | City power (EU, 2007) |
| 18.008 | Degree of electricity generated in combined heat and power systems |
| 18.011 | Climate (Heating Degree Days) |
| 18.014 | Targets set by each city for GHG emissions reductions |
| 19.001 | Policy instrument combinations |
| 19.002 | Obligating/Incentivizing balance |
| 19.003 | Long-term program |
| 19.004 | Non-generic instruments |
| 19.005 | Primacy to energy efficiency |
| 19.006 | Whole house/deep retrofit |
| 19.007 | Energy sufficiency |
| 20.002 | Household size |
| 21.001 | Changes in knowledge |
| 21.002 | Awareness and behavior of important actors |
| 21.003 | Technology performance |
| 21.006 | Market share |
| 25.001 | Carbon intensity of road transport |
| 25.002 | Energy intensity of road transport |
| 25.003 | Use intensity |
| 25.006 | Workers income intensity |
| 26.018 | Simplification in technology production options and load segments of electricity production |
| 26.023 | Trading options |
| 26.024 | Banking of emissions |
| 26.025 | Alternative compliance payments |
| 26.026 | Distinctions between price based or quantity-based policy instruments with variations in prices and quotas for commodities |
| 26.027 | Uniform/Differentiated feed in tariff rate |
| 26.028 | Phase in of Renewable Portfolio Standard |
| 26.029 | Annual digression rate of feed in tariff rate |
| 26.030 | Limitation of the payment period |
| 26.031 | Tariff reduction due to inflation |
| 26.032 | Distinctions between price based or quantity-based policy instruments with variations in prices and quotas for commodities |
| 26.033 | International emissions trading |
| 26.034 | Uniform and unilateral imposition of carbon taxes across all EU-ETS regions |
| 26.035 | Lump-sum treatment of additional tax revenues |
| 26.036 | Stringency levels |
| 26.037 | Different application scope |
| 26.038 | Nature of targets, the target groups, the policy-implementing agents, the available budget, the available information on the initially expected energy-savings impact, and the cost effectiveness of the instrument |
| 26.039 | Distinctions between price-based or quantity-based policy instruments |
| 26.040 | Different renewable energy sources and support design elements |
| 26.041 | Variable scenarios in the short and long run for key policy parameters such as price of certificate, level of obligation, level of sales tax and the level of penalty |
| 26.042 | Fixed-price policies and endogenous price policies |
| 26.043 | Technology specific hurdle rates reflecting market barriers, consumer preferences and risk factors limiting purchase of new energy technologies |
| 26.044 | Conditions for implementation and proper utilization of saving options (technology equipment availability, familiarity with the policy, overcoming barriers, motivation to invest) |
| 26.045 | Specific implementation of policy instruments with regard to their funding |
| 27.002 | State-level mandates concerning climate change (national) |
| 27.010 | Vehicular emission |
| 27.018 | Long-term goals and detailed targets for GHG emissions |
| 27.021 | Emissions trend forecast |
| 27.025 | Public awareness, education, and participation |
| 27.026 | Inter-organizational coordination procedures |
| 27.027 | GHG emissions reduction fee |
| 27.028 | Establish a carbon tax |
| 27.029 | Disaster resistant land use and building code |
| 27.030 | Mixed use and compact development |
| 27.031 | Infill development and reuse of remediated brownfield sites |
| 27.032 | Green building and green infrastructure |
| 27.033 | Low-impact design for impervious surface |
| 27.034 | Control of urban service/growth boundaries |
| 27.035 | Alternative transportation strategies |
| 27.036 | Transit-oriented development and corridor improvements |
| 27.037 | Parking standards adjustment |
| 27.038 | Pedestrian/resident friendly, bicycle friendly, transit-oriented community design |
| 27.039 | Renewable energy and solar energy |
| 27.040 | Energy efficiency and energy stars |
| 27.041 | Landfill methane capture strategies |
| 27.042 | Zero waste reduction and high recycling strategy |
| 27.043 | Creation of conservation zones or protected areas |
| 27.044 | Watershed-based and ecosystem-based land management |
| 27.045 | Vegetation protection |
| 27.048 | Identify roles and responsibilities among sectors and stakeholders |
| 27.050 | Overall energy efficiency gains |
| 27.053 | Energy efficiency gains |
| 27.054 | Energy intensity (industry, manufacturing, chemicals, European Union structure) |
| 27.055 | Specific consumption (steel, cement, paper) |
| 27.057 | Consumption per unit of traffic (road car equivalent, freight, air) |
| 27.058 | Car efficiency (fleet average, new cars) |
| 27.060 | Energy efficiency gains |
Table A5.
Variables excluded to avoid the presence of dependent variables in the systematic literature review process.
Table A5.
Variables excluded to avoid the presence of dependent variables in the systematic literature review process.
| Code | Variable |
|---|---|
| 1.002 | Favorable public opinion |
| 1.006 | Social appeal |
| 3.001 | Energy statistics (statistical figures) |
| 3.007 | Structure, final demand (Reference final demand per subsector) |
| 3.008 | Savings, final demand (Actual final heat/electricity demand) |
| 3.009 | Conversion efficiency end-users (Actual efficiency boilers, etc.) |
| 4.015 | Institutional factors |
| 4.019 | Mode of governance |
| 7.009 | Production of goods per type (piece, kg or m2) |
| 7.010 | Cultivated land area |
| 7.011 | Raising of cattle, pigs and chickens |
| 7.012 | Volume index of production |
| 8.001 | Gross domestic product (GDP) |
| 11.004 | Means—Policy process |
| 12.014 | Penetration of energy carriers into useful thermal energy demand of the different sectors |
| 12.018 | Average intracity distance traveled per person per day |
| 12.019 | Average load factor of intracity passenger transportation mode(s) |
| 12.022 | Average intercity distance traveled per person per day |
| 12.024 | Average intercity distance driven per car per year |
| 12.025 | Average load factor of intercity transportation mode(s) |
| 12.026 | Share of car type(s) in the intercity transportation mode(s) |
| 12.035 | Share of urban dwellings with air conditioning, by dwelling type |
| 12.040 | Electricity penetration for appliances in urban households |
| 12.042 | Penetration of various energy forms into space heating in urban households |
| 12.043 | Efficiency of various fuels use, relative to that of electricity use, for space heating in urban households |
| 12.044 | Coefficient of performance of heat pumps for space heating in urban households |
| 12.045 | Penetration of various energy forms into water heating in urban households |
| 12.046 | Efficiency of various fuels use, relative to that of electricity use, for water heating in urban households |
| 12.047 | Coefficient of performance of heat pumps for water heating in urban households |
| 12.048 | Approximate share of water heating demand in urban households that can be met with solar installations |
| 12.049 | Penetration of various energy forms into cooking in urban households |
| 12.050 | Efficiency of various fuels use, relative to that of electricity, for cooking in urban households |
| 12.051 | Approximate share of cooking demand in urban households that can be met with solar installations |
| 12.052 | Share of air conditioning demand of urban households that can be met with electricity |
| 12.053 | Coefficient of performance of electric air conditioning in urban households |
| 12.054 | Coefficient of performance of non-electric air conditioning in urban households |
| 12.061 | Share of rural dwellings with air conditioning, by dwelling type |
| 12.066 | Electricity penetration for appliances in rural households |
| 12.068 | Penetration of various energy forms into space heating in rural households |
| 12.069 | Efficiency of various fuels use, relative to that of electricity use, for space heating in rural households |
| 12.070 | Coefficient of performance of heat pumps for space heating in rural households |
| 12.071 | Penetration of various energy forms into water heating in rural households |
| 12.072 | Efficiency of various fuels use, relative to that of electricity use, for water heating in rural households |
| 12.073 | Coefficient of performance of heat pumps for water heating in rural households |
| 12.074 | Approximate share of water heating demand in rural households that can be met with solar installations |
| 12.075 | Penetration of various energy forms into cooking in rural households |
| 12.076 | Efficiency of various fuels use, relative to that of electricity, for cooking in rural households |
| 12.077 | Approximate share of cooking demand in rural households that can be met with solar installations |
| 12.078 | Share of air conditioning demand of rural households that can be met with electricity |
| 12.079 | Coefficient of performance of electric air conditioning in rural households |
| 12.080 | Coefficient of performance of non-electric air conditioning in rural households |
| 12.081 | Share of service sector in the total active labor force |
| 12.082 | Average floor area per employee in the Service sector |
| 12.083 | Share of Service sector floor area requiring space heating |
| 12.084 | Share of Service sector floor area requiring space heating that is actually heated |
| 12.085 | Specific space heat requirements of Service sector floor area |
| 12.086 | Share of air-conditioned Service sector floor area |
| 12.087 | Specific cooling requirements in the Service sector |
| 12.088 | Energy intensity of motor fuel use per Services’ subsector |
| 12.089 | Energy intensity of electricity specific uses per Services’ subsector |
| 12.090 | Energy intensity of thermal uses (except space heating) per Services’ subsector |
| 12.091 | Penetration of various energy forms into space heating in Service sector |
| 12.092 | Penetration of various energy forms into other thermal uses in the Service sector |
| 12.093 | Efficiency of various fuels use, relative to that of electricity use, for thermal uses in Service sector |
| 12.094 | Coefficient of performance of heat pumps in space heating in Service sector |
| 12.095 | Share of low-rise buildings in the total Service sector floor area |
| 12.096 | Approximate share of thermal uses in the Service sector that can be met by solar installations |
| 12.097 | Share of air-conditioning that can be met with electricity |
| 12.098 | Coefficient of performance of electric air conditioning in Service sector |
| 12.099 | Coefficient of performance of non-electric air conditioning in Service sector |
| 13.009 | Energy per appliance |
| 13.013 | Tons-kilometers |
| 13.014 | Share of total ton-kilometers by mode |
| 13.020 | Energy per value-added by subsector |
| 14.001 | Population growth |
| 14.004 | Share of the population outside the community |
| 15.004 | Irrigation development |
| 15.005 | Mechanization |
| 15.008 | Industrialization infrastructure |
| 15.011 | Poverty |
| 15.014 | State policy |
| 15.022 | Mass-consuming view of nature |
| 16.007 | Measures and policies already promulgated |
| 16.012 | Implementation experiences |
| 17.003 | Average income |
| 17.005 | Environmental voting |
| 18.003 | Legal structure and status |
| 18.004 | Spending power |
| 18.005 | Control over income |
| 20.003 | Age of occupants |
| 20.005 | Dwelling type |
| 21.004 | Price development |
| 21.005 | Sales data |
| 23.001 | Attitude factors |
| 23.002 | Economic factors |
| 23.003 | Social factors (impact on agents’ attitude) |
| 24.010 | Average energy/value-added per subsector |
| 25.004 | Motorization rate |
| 25.005 | Job intensity |
| 26.006 | Different renewable energy sources penetration levels |
| 26.010 | Discount rate for investments |
| 26.013 | Socio-demographic and lifestyle trends |
| 26.015 | Political context in which policy instruments are imposed |
| 26.046 | Transaction costs |
| 26.047 | Stability and credibility in policy regime |
| 27.001 | Political will |
| 27.003 | Wealth |
| 27.005 | Population density |
| 27.051 | Final intensity |
| 27.052 | Primary intensity |
References
- Meeus, L.; Oliveira Fernandes, E.; Delarure, E.; Azevedo, I.; Leal, V.M.S.; Glachant, J.M. Smart Cities Initiative: How to Foster A Quick Transition towards Local Sustainable Energy Systems; THINK Project, EU 7th Framework Programme; European University Institute: Florence, Italy, 2011. [Google Scholar]
- Azevedo, I.; Leal, V.M.S. Methodologies for the evaluation of local climate change mitigation actions: A review. Renew. Sustain. Energy Rev. 2017, 79, 681–690. [Google Scholar] [CrossRef]
- Millard-Ball, A. Do city climate plans reduce emissions? J. Urban Econ. 2012, 71, 289–311. [Google Scholar] [CrossRef]
- Millard-Ball, A. The Limits to Planning: Causal Impacts of City Climate Action Plans. J. Plan. Educ. Res. 2012, 33, 5–19. [Google Scholar] [CrossRef]
- Azevedo, I.; Horta, I.; Leal, V.M.S. Analysis of the relationship between local climate change mitigation actions and greenhouse gas emissions-Empirical insights. Energy Policy 2017, 111, 204–2013. [Google Scholar] [CrossRef]
- Pullin, A.S.; Knight, T.M. Data credibility: A perspective from systematic reviews in environmental management. New Dir. Eval. 2009, 122, 65–74. [Google Scholar] [CrossRef]
- Auld, G.; Mallett, A.; Burlica, B.; Nolan-Poupart, F.; Slater, R. Evaluating the effects of policy innovations: Lessons from a systematic review of policies promoting low-carbon technology. Glob. Environ. Chang. 2014, 29, 444–458. [Google Scholar] [CrossRef]
- Boonekamp, P.G.M. Energy and emission monitoring for policy use-Trend analysis with reconstructed energy balances. Energy Policy 2004, 32, 969–988. [Google Scholar] [CrossRef]
- Boonekamp, P.G.M. Improved Methods to Evaluate Realised Energy Savings; Proefschrift Universiteit Utrecht: Utrecht, The Netherlands, 2005. [Google Scholar]
- Broto, V.C.; Bulkeley, H. A survey of urban climate change experiments in 100 cities. Glob. Environ. Chang. 2013, 23, 92–102. [Google Scholar] [CrossRef] [Green Version]
- Covenant of Mayors Office and Joint Research Centre of the European Commission. Reporting Guidelines on Sustainable Energy Action Plans; Publications Office of the European Union: Luxembourg, 2010.
- Corfee-Morlot, J.; Kamal-Chaoui, L.; Donovan, M.G.; Cochran, I.; Robert, A.; Teasdale, P.J. Cities, Climate Change and Multilevel Governance. OECD Environ. Work. Pap. 2009. [Google Scholar] [CrossRef]
- Farla, J.C.M.; Blok, K. The use of physical indicators for the monitoring of energy intensity development in the Netherlands, 1980–1995. Energy 2000, 25, 609–638. [Google Scholar] [CrossRef]
- Fortes, P.; Alvarenga, A.; Seixas, J.; Rodrigues, S. Long-term energy scenarios: Bridging the gap between socio-economic storylines and energy modeling. Technol. Forecast. Soc. Chang. 2015, 91, 161–178. [Google Scholar] [CrossRef]
- Fortes, P.; Pereira, R.; Pereira, A.M.; Seixas, J. Integrated technological-economic modelling platform for energy and climate policy analysis. Energy 2014, 73, 716–730. [Google Scholar] [CrossRef]
- Gustavsson, E.; Elander, I.; Lundmark, M. Multilevel governance, Networking cities, and the geography of climate-change mitigation: Two Swedish examples. Environ. Plan. C Gov. Policy 2009, 27, 59–74. [Google Scholar] [CrossRef]
- Gysen, J. The Modus Narrandi: A Methodology for Evaluating Effects of Environmental Policy. Evaluation 2006, 12, 95–118. [Google Scholar] [CrossRef]
- International Atomic Energy Agency (IAEA). Model for Analysis of Energy Demand (MAED-2)-User’s Manual. In Computer Manual Series; IAEA: Vienna, Austria, 2006. [Google Scholar]
- International Energy Agency (IEA). Energy Efficiency Indicators: Essentials for Policy Making. In Energy Efficiency Indicators; IEA: Paris, France, 2014. [Google Scholar]
- Jovanovic, M.; Afgan, N.; Bakic, V. An analytical method for the measurement of energy system sustainability in urban areas. Energy 2010, 35, 3909–3920. [Google Scholar] [CrossRef]
- Kasperson, J.X.; Kasperson, R.E.; Turner, B.L. Regions at Risk: Comparison of Threatened Environments; United Nations University Press: Tokyo, Japan, 1995. [Google Scholar]
- Lin, J.; Cao, B.; Cui, S.; Wang, W.; Bai, X. Evaluating the effectiveness of urban energy conservation and GHG mitigation measures: The case of Xiamen city, China. Energy Policy 2010, 38, 5123–5132. [Google Scholar] [CrossRef]
- Morlet, C.; Keirstead, J. A comparative analysis of urban energy governance in four European cities. Energy Policy 2013, 61, 852–863. [Google Scholar] [CrossRef]
- Murphy, L.; Meijer, F.; Visscher, H. A qualitative evaluation of policy instruments used to improve energy performance of existing private dwellings in the Netherlands. Energy Policy 2012, 45, 459–468. [Google Scholar] [CrossRef]
- Nässén, J. Determinants of greenhouse gas emissions from Swedish private consumption: Time-series and cross-sectional analyses. Energy 2014, 66, 98–106. [Google Scholar] [CrossRef]
- Neij, L.; Åstrand, K. Outcome indicators for the evaluation of energy policy instruments and technical change. Energy Policy 2006, 34, 2662–2676. [Google Scholar] [CrossRef]
- Praznik, M.; Butala, V.; Zbašnik Senegačnik, M. Simplified evaluation method for energy efficiency in single-family houses using key quality parameters. Energy Build. 2013, 67, 489–499. [Google Scholar] [CrossRef]
- Rai, V.; Robinson, S.A. Agent-based modeling of energy technology adoption: Empirical integration of social, behavioral, economic, and environmental factors. Environ. Model. Softw. 2015, 70, 163–177. [Google Scholar] [CrossRef] [Green Version]
- Schipper, L.; Unander, F.; Murtishaw, S.; Ting, M. Indicators of Energy Use and Carbon Emissions: Explaining the Energy Economy Link. Annu. Rev. Energy Environ. 2001, 26, 49–81. [Google Scholar] [CrossRef]
- Sobrino, N.; Monzon, A. The impact of the economic crisis and policy actions on GHG emissions from road transport in Spain. Energy Policy 2014, 74, 486–498. [Google Scholar] [CrossRef] [Green Version]
- Spyridaki, N.A.; Flamos, A. A paper trail of evaluation approaches to energy and climate policy interactions. Renew. Sustain. Energy Rev. 2014, 40, 1090–1107. [Google Scholar] [CrossRef]
- Tang, Z.; Brody, S.D.; Quinn, C.; Chang, L.; Wei, T. Moving from agenda to action: Evaluating local climate change action plans. J. Environ. Plan. Manag. 2010, 53, 41–62. [Google Scholar] [CrossRef] [Green Version]
- Wilbanks, T.J.; Kates, R.W. Global change in local places: How scale matters. Clim. Chang. 1999, 43, 601–628. [Google Scholar] [CrossRef]
Figure 1.
Schematic representation of the systematic literature review process.

Figure 2.
Framework of the sources of change and the observed changes in local GHG emissions.

Table 1.
Systematic literature review specifications.
| Objective | Identify and Characterize Factors of Change of Local Energy Systems |
|---|---|
| Documents Selection | |
| Search expressions | “Energy system characterization” |
| “Energy system modeling/modelling” | |
| “Energy system planning” | |
| “Energy system scenarios” | |
| “Energy policy evaluation” | |
| “Local climate change mitigation” | |
| Type of documents | Peer-reviewed articles |
| Reports and working papers from internationally reputed entities | |
| PhD theses | |
| Type of content | Factors that lead to changes in GHG emissions |
| Characterizing variables of those factors | |
| Information on the relation between factors of change and local GHG emissions |
Table 2.
Characterization of the documents used for the identification of the factors of change.
| Code | Study | Authors | Year | Topic/Theme | Doc. Type | Ref. |
|---|---|---|---|---|---|---|
| 1 | “Evaluating the effects of policy innovations: Lessons from a systematic review of policies promoting low-carbon technology” | Auld, G., Mallet, A., Burlica, B., Nolan-Poupart, F., Slater, R. | 2014 | Policy Evaluation | JP | [7] |
| 2 | “Energy and emission monitoring for policy use—Trend analysis with reconstructed energy balances” | Boonekamp, P.G.M. | 2004 | Policy Evaluation | JP | [8] |
| 3 | “Improved methods to evaluate realized energy savings” | Boonekamp, P.G.M. | 2005 | Policy Evaluation | PhD | [9] |
| 4 | “A survey of urban climate change experiments in 100 cities” | Broto, C.B., Bulkeley, H. | 2013 | Multilevel governance | JP | [10] |
| 5 | “Reporting Guidelines on Sustainable Energy Action Plan and Monitoring” | Covenant of Mayors (European Union) | 2010 | Policy Evaluation | PR | [11] |
| 6 | “Cities, Climate Change and Multilevel Governance” | Corfee-Morlot, J., Kamal-Chaoui, L., Robert, A., Teasdale, P.J. | 2009 | Multilevel governance | WP | [12] |
| 7 | “The use of physical indicators for the monitoring of energy intensity developments in the Netherlands, 1980–1995” | Farla, J.C.M., Blok, K. | 2000 | Energy use | JP | [13] |
| 8 | “Long-term energy scenarios: Bridging the gap between socio-economic storyline and energy modeling” | Fortes, P., Alvarenga, A., Seixas, J., Rodrigues, S. | 2015 | Energy planning | JP | [14] |
| 9 | “Integrated technological-economic modelling platform for energy and climate policy” | Fortes, P., Pereira, R., Pereira, A., Seixas J. | 2014 | Energy planning | JP | [15] |
| 10 | “Multilevel governance, networking cities, and the geography of climate-change mitigation: two Swedish examples” | Gustavsson, E., Elander, I., Lundmark, M. | 2009 | Multilevel governance | JP | [16] |
| 11 | “Evaluating the effectiveness of environmental policy: A analysis of conceptual and methodological issues” | Gysen, J, Bachus, K., Bruyninckx, H. | 2002 | Policy evaluation | CP | [17] |
| 12 | “Model for Analysis of Energy Demand (MAED-2)—Computer Manual Series N° 18” | International Atomic Energy Agency | 2006 | Energy use | TR | [18] |
| 13 | “Energy Efficiency Indicators: Essentials for Policy Making” | International Energy Agency | 2014 | Energy planning | PR | [19] |
| 14 | “An analytical method for the measurement of energy system sustainability in urban areas” | Jovanovic, M., Afgan, N., Bakic, V. | 2010 | Energy use | JP | [20] |
| 15 | “Regions at Risk: Comparisons of Threatened Environments” | Kasperson, J.X., Kasperson, R.E, Turner, B.L. | 1995 | Policy Evaluation | Bk | [21] |
| 16 | “Evaluating the effectiveness of urban energy conservation and GHG mitigation measures: The case of Xiamen city, China” | Lin, J., Cao, B., Cui, S., Wang, W., Bai, X. | 2010 | Policy evaluation | JP | [22] |
| 17 | “Do city climate plans reduce emissions?” | Millard-Ball, A. | 2012 | Policy evaluation | JP | [3] |
| 18 | “A comparative analysis of urban energy governance in four European cities” | Morlet, C., Keirstead, J. | 2013 | Multilevel governance | JP | [23] |
| 19 | “A qualitative evaluation of policy instruments used to improve energy performance of existing private dwellings in the Netherlands” | Murphy, L., Meijer, F., Visscher, H. | 2012 | Policy evaluation | JP | [24] |
| 20 | “Determinants of greenhouse gas emissions from Swedish private consumption: Time-series and cross-sectional analyses” | Nassen, J. | 2014 | Energy use | JP | [25] |
| 21 | “Outcome indicators for the evaluation of energy policy instruments and technical change” | Neij, L., Astrand, K. | 2006 | Policy evaluation | JP | [26] |
| 22 | “Simplified evaluation method for energy efficiency in single-family houses using key quality parameters” | Praznik, M., Butala, V., Senegacnik, M.Z. | 2013 | Energy use | JP | [27] |
| 23 | “Agent-based modeling of energy technology adoption: Empirical integration of social, behavioral, economic, and environmental factors” | Rai, V., Robinson, S.A. | 2015 | Energy planning | JP | [28] |
| 24 | “Indicators of Energy Use and Carbon Emissions: Explaining the Energy Economy Link” | Schipper, L., Unander, F., Murtishaw, S., Ting, M. | 2001 | Energy use | JP | [29] |
| 25 | “The impact of the economic crisis and policy actions on GHG emissions from road transport in Spain” | Sobrino, N., Monzon, A. | 2014 | Policy evaluation | JP | [30] |
| 26 | “A paper trail of evaluation approaches to energy and climate policy interactions” | Spyridaki, N.A., Flamos, A. | 2014 | Policy evaluation | JP | [31] |
| 27 | “Moving from agenda to action: evaluating local climate change action plans” | Tang, Z., Brody, S.D., Quinn, C., Chang, L., Wei, T. | 2010 | Policy evaluation | JP | [32] |
| 28 | “Global change in local places: How scale matters” | Wilbanks, T.J., Kates, R.W. | 1999 | Multilevel governance | JP | [33] |
Legend: JP, peer-reviewed journal article; WP, working paper; CP, conference paper; Bk, Book; PhD, PhD thesis; PR, policy report; TR, technical report.
Table 3.
Final list of variables and respective grouping into factors of change.
| Factor of Change | Variables Identified in the Literature Review | ||
|---|---|---|---|
| Statistical differences | 3.002 | Corrected statistics | |
| Local inhabitants’ characteristics | Educational level | 17.004 | Education |
| Cultural diversity | 15.021 | Ethnic/religious views | |
| Willingness to act | 18.006 | Civic involvement (voting patterns) | |
| 27.015 | Concept of climate change (awareness of) | ||
| 27.016 | Concept of GHG emissions (awareness of) | ||
| 27.017 | Effects and impact of CC (awareness of) | ||
| Local administration characteristics | Competences | 6.0005 | Local authority’s responsibilities and competences |
| Qualified personnel | 6.002 | Existence of a dedicated institution/agency to deal with CC mitigation actions/plans | |
| 6.003 | Local authority’s capacity and expertise on CC mitigation | ||
| Economic situation | 6.004 | Local authority’s ability to obtain funding | |
| Ratio between income and expenses | |||
| Climate variability | 3.003 | Climate (degree-days) | |
| Demographic evolution | Population growth/change | 15.002 | Natural growth |
| 15.003 | Migration | ||
| Migration to urban areas | 12.003 | Share of urban population | |
| Age pyramid | 14.003 | Share of potential labor force | |
| Social evolution | Household conditions | 14.002 | Persons per household |
| 24.002 | Floor area per capita | ||
| 24.004 | Heat per floor area | ||
| 13.005 | Appliances ownership per capita | ||
| 13.006 | DWH energy per capita | ||
| 13.007 | Cooking energy per capita | ||
| 13.008 | Lighting per floor area | ||
| Commuting needs and transportation habits | 13.010 | Pkm | |
| 12.023 | Inverse of car ownership ratio | ||
| 13.011 | Share of total pkm by mode | ||
| 27.009 | Average commuting time | ||
| Economic evolution | Overall local economy | 2.001 | GDP growth |
| Structure of local economy | 8.004 | GVA agriculture | |
| 8.005 | GVA services | ||
| 8.006 | GVA transports | ||
| 8.007 | GVA industry | ||
| 12.012 | Distribution of sectors GVA by subsectors | ||
| Economic situation of individuals | 17.002 | Employment | |
| 8.003 | Private consumption | ||
| Technology evolution | Market drivers/barriers | 26.022 | Technology market failures and other externalities related to electricity generation design |
| 9.006 | Technical and costs evolution | ||
| 9.007 | Availability and capacity limits (technology) | ||
| Technical evolution | 12.015 | Average efficiencies of fuels for thermal uses per sector | |
| 27.064 | Energy intensity | ||
| Technical evolution (Buildings) | 14.010 | Buildings insulation | |
| 24.005 | Intensity for different uses | ||
| 13.017 | Energy per value-added (services) | ||
| Technical evolution (Transports) | 13.012 | Energy per pkm by mode | |
| 13.015 | Energy per tkm by mode | ||
| Technical evolution (Agriculture) | 13.023 | Energy per value-added by subsector | |
| Electricity generation and other energy transformation processes | 3.010 | Cogeneration end-users | |
| 3.011 | Fuel-mix end-users (actual energy use) | ||
| 3.012 | Export (actual energy exports) | ||
| 3.013 | Structure e-sectors (reference use refineries/gas supply) | ||
| 3.014 | Cogeneration e-sectors | ||
| 3.015 | Efficiency e-sectors (actual conversion efficiencies) | ||
| 3.016 | Import (actual energy imports) | ||
| 3.017 | Fuel-mix e-sectors | ||
| State and international governance framework | Existing policies | 9.004 | Energy and environmental policies |
| 15.012 | International market | ||
| 15.013 | National market | ||
| Energy costs | 18.012 | Price of energy and relative share of any taxes or levies (energy costs) | |
| Synergies with local-level actions | 6.001 | Coherent multi-level policy framework (vertically and horizontally) | |
| 6.006 | Support from central governments to local policies | ||
| Actors involved | SEAP preparation | 5.015 | Decision body approving the plan |
| 5.003 | Coordination and organizational structures created/assigned | ||
| 5.004 | Staff capacity allocated | ||
| SEAP implementation | 10.001 | Actors involved in local CC mitigation | |
| 5.019 | Origin of the action (local or other) | ||
| 5.020 | Responsible body | ||
| Timeframe | 5.014 | Date of approval | |
| 5.021 | Implementation timeframe | ||
| Targets | 5.001 | Overall CO2 reduction target | |
| 5.002 | Vision | ||
| Current implementation status | 1.014 | State of activity | |
| 5.026 | Newest inventory year | ||
| 5.031 | Status implementation | ||
| 5.006 | Overall estimated budget for the SEAP implementation | ||
| Estimated impact | Base year inventory | 5.011 | Final energy consumption per sector and carrier |
| 5.012 | Energy supply sources | ||
| 5.013 | CO2 emissions per sector and carrier | ||
| BAU projections | 5.016 | BAU projections | |
| Overall estimated impact | 5.023 | Energy savings | |
| 5.024 | Renewable energy production | ||
| 5.025 | CO2 reduction | ||
| Mid-term inventory | 5.028 | Final energy consumption per sector and carrier | |
| 5.029 | Energy supply sources | ||
| 5.030 | CO2 emissions per sector and carrier | ||
| Mid-term estimated impact | 5.033 | Renewable energy production from actions implemented so far | |
| 5.034 | CO2 reduction from actions implemented so far | ||
| 5.009 | Description of the impact of instruments | ||
| Budget | Overall | 5.022 | Estimated implementation costs |
| Spent so far | 5.032 | Implementation cost spent so far | |
| Financing sources | 4.018 | Funding | |
| 5.007 | Foreseen financing sources for the implementation | ||
| Actions characterization | Area of intervention | 5.017 | Area of intervention |
| Technical measure | 4.021 | Action targeted sectors | |
| 16.008 | Measure/action | ||
| 16.009 | Intensity of measure (degree of implementation) | ||
| Instruments | 4.012 | Type of experiment | |
| 4.014 | Type of innovation | ||
| 1.017 | Presence of flexibility mechanisms | ||
| 19.008 | Policy theory associated with instruments applied | ||
| 5.018 | Policy instrument | ||
| Other process characteristics | 1.001 | Agenda setting process | |
| 27.046 | Establish implementation priorities for action | ||
| 5.008 | Monitoring process | ||
Table 4.
Factors of change associated with local context with corresponding indicators.
| Factor of Change | Characterizing (and Quantifiable) Indicator | Unit | |
|---|---|---|---|
| Local inhabitants’ characteristics | Education level | Distribution of local population per education level | Dimensionless (%) |
| Cultural diversity | Valid permits by reason per 1000 inhabitants | # permits/1000 inhab. | |
| Willingness to act | |||
| Awareness | Share of waste that is separated previous to collection (recycling) | Dimensionless (%) | |
| Civic involvement | Number of environmental nonprofits per 1000 inhabitants | # groups/1000 inhab. | |
| Local authority characteristics | Legal competences | Level of autonomy (High, Medium, Low) | Nominal variable |
| Qualified personnel | |||
| Dedicated institution/agency for CC mitigation | Y/N (or Number of people assigned to CC mitigation issues) | # people | |
| Previous experiences related with CC mitigation | Y/N | n.a. | |
| Economic situation | |||
| Ability to obtain funding | Global ranking of the municipalities’ financial situation | Dimensionless | |
| Relation between income and expenses | Ratio between income and expenses | Dimensionless | |
Table 5.
Factors of change associated with local socio-economic and cultural changes with corresponding indicators.
Table 5.
Factors of change associated with local socio-economic and cultural changes with corresponding indicators.
| Factor of Change | Characterizing (and Quantifiable) Indicator | Unit | |
|---|---|---|---|
| Climate variability | Heating Degree Days | HDD | |
| Cooling Degree Days | CDD | ||
| Demographic evolution | Population growth | Change of overall population | # inhabitants |
| Migration to urban areas | Share of rural population | Dimensionless (%) | |
| Age pyramid | Share of active population | Dimensionless (%) | |
| Social evolution | Household conditions | Persons per household | Person/household |
| Floor area per person | m2/cap | ||
| Commuting needs | Average commuting needs | km/person.day | |
| Transportation habits | Car ownership | cars/cap | |
| Economic evolution | Overall growth of local economy | Local GDP change | € |
| Structure of local economy | GVA per sector (or number of employees) | € | |
| Economic situation of households: | |||
| Employment | Unemployment rate | Dimensionless (%) | |
| Private consumption | Private Purchase Power | €/cap | |
Table 6.
Factors of change related to higher-level governance framework with corresponding indicators.
Table 6.
Factors of change related to higher-level governance framework with corresponding indicators.
| Factor of Change | Characterizing (and Quantifiable) Indicators | Unit | |
|---|---|---|---|
| Technology Evolution | Technical evolution | National average energy intensity per sector | kWh/€ |
| Market evolution: | |||
| Technology costs | Over cost of A++ appliances compared to B equivalent | € | |
| Market barriers | Energy efficiency gap | ||
| Energy supply sector: | |||
| Fuel-mix of electricity and heat generation | Share of renewable energy sources (RES) | Dimensionless (%) | |
| Efficiency of energy transformation sector | Overall efficiency and losses | Dimensionless (%) | |
| National and international energy-related policies | Existing policies | Public and private investments on environmental management and protection per economic activity (cumulative values) | € |
| Energy costs | Average energy cost for final consumer | €/kWh | |
| Coherence with local policies | Alignment between different scales objectives? | (Y/N) | |
| Support of local action | Initiatives to promote local action (Number) | # initiatives | |
Table 7.
Factors of change associated with local climate change mitigation actions with corresponding indicators.
Table 7.
Factors of change associated with local climate change mitigation actions with corresponding indicators.
| Factor of Change | Characterizing (and Quantifiable) Indicators | Unit | |
|---|---|---|---|
| Actors involvement | Action plan preparation | Groups of actors involved | Nominal variable |
| Action plan implementation | Groups of actors involved | Nominal variable | |
| Timeframe | Study | Base Year and Time Horizon | Year |
| Action plan implementation | Beginning and End of action plan implementation | Year | |
| Targets | Vision | Other goals besides GHG emissions reduction | (Y/N) |
| GHG emissions reduction | ton CO2 eq. | ||
| Current implementation status | Overall | Share of the overall plan already implemented | Dimensionless (%) |
| Per action | Share of the individual measure already implemented | Dimensionless (%) | |
| Estimated impact | Base year inventory | In terms of final energy and GHG emissions reduction (measured) | GWh/a |
| ton CO2 eq./a | |||
| BAU projections | In terms of final energy and GHG emissions reduction (predicted) | GWh/a | |
| ton CO2 eq./a | |||
| Latest inventory | In terms of final energy and GHG emissions reduction (measured) | GWh/a | |
| ton CO2 eq./a | |||
| Budget | Overall | € | |
| Spent so far | € | ||
| Financing sources | Entity(s) responsible | Entities financing local actions (per category) | Nominal variable |
| Share of overall investment costs | Fraction of overall investment that is financed by each entity | Dimensionless (%) | |
| Actions characterization | Area of intervention | Sector and subsector targeted | |
| Technical measure: | |||
| Measure | Building retrofit, modal shift in transports, led street lights, etc. | Nominal variable | |
| Level of implementation | Share of the sector/subsector impacted by the action | Dimensionless (%) | |
| Estimated impact | In terms of final energy and GHG emissions reduction | GWh/a | |
| ton CO2 eq./a | |||
| Policy instrument: | |||
| Type | Regulation, incentive, education, etc. | Nominal Variable | |
| Level of support | Share of financing provided by the instrument | Dimensionless (%) | |
| Stakeholders involvement | Nominal variable | ||
© 2020 by the authors. Licensee MDPI, Basel, Switzerland. This article is an open access article distributed under the terms and conditions of the Creative Commons Attribution (CC BY) license (http://creativecommons.org/licenses/by/4.0/).
Share and Cite
MDPI and ACS Style
Azevedo, I.; Leal, V. Factors That Contribute to Changes in Local or Municipal GHG Emissions: A Framework Derived from a Systematic Literature Review. Energies 2020, 13, 3205. https://0-doi-org.brum.beds.ac.uk/10.3390/en13123205
AMA Style
Azevedo I, Leal V. Factors That Contribute to Changes in Local or Municipal GHG Emissions: A Framework Derived from a Systematic Literature Review. Energies. 2020; 13(12):3205. https://0-doi-org.brum.beds.ac.uk/10.3390/en13123205
Chicago/Turabian StyleAzevedo, Isabel, and Vítor Leal. 2020. "Factors That Contribute to Changes in Local or Municipal GHG Emissions: A Framework Derived from a Systematic Literature Review" Energies 13, no. 12: 3205. https://0-doi-org.brum.beds.ac.uk/10.3390/en13123205
Note that from the first issue of 2016, this journal uses article numbers instead of page numbers. See further details here.