A Comprehensive Review on Energy Storage Systems: Types, Comparison, Current Scenario, Applications, Barriers, and Potential Solutions, Policies, and Future Prospects

 ,
,  ,
,  ,
,  and
and 
Abstract
:1. Introduction
2. Evolution of Energy Storage Systems
3. Classification of Energy Storage Systems
3.1. Mechanical Energy Storage
3.1.1. Pumped Hydro Storage (PHS)
- Specific weight of the fluid [lb/ft3; N/m3]
- = Flow rate [ft3/s; m3/s]
- = Change in head [ft; m]
3.1.2. Compressed Air Energy Storage (CAES)
Advanced Adiabatic Compressed Air Energy Storage (AA-CAES)
Liquid Air Energy Storage (LAES)
Supercritical Compressed Air Energy Storage (SC-CAES).
3.1.3. Flywheel Energy Storage (FES)
3.2. Thermal Energy Storage
3.2.1. Low-Temperature Thermal Energy Storage
3.2.2. High Temperature Thermal Energy Storage
3.3. Electrostatic and Magnetic Energy Storage
3.3.1. Electrostatic Energy Storage
Electric Double Layer Capacitor (EDLC)
3.3.2. Supermagnetic Energy Storage
- I.
- The superconducting magnet, which is kept in a vacuum and is thermally insulated using a Dewar.
- II.
- The cryogenic refrigeration system to maintain the temperature of the superconducting coil below the critical temperature.
- III.
- The power conditioning system, which consists of different power electronic devices such as transistors, capacitors, inductors, etc., and its function is to regulate the electrical energy exchange between the grid and the SMES system.
- IV.
- The control system, whose function is to monitor the different parameters of the system, such as current, pressure, temperature, strain, etc., and tuning the operation of the cryogenic system.
3.4. Electrochemical Energy Storage
3.4.1. Lead Acid Batteries
Flooded Lead Acid Batteries
Sealed Lead Acid Batteries
Absorbed Glass Matte (AGM) Batteries
Gel Cell Batteries
3.4.2. Lithium Metal Batteries
3.4.3. Lithium Ion Batteries
- At anode:
- At cathode:
- Overall chemical reaction:
3.4.4. Lithium Polymer Batteries
3.4.5. Sodium Beta Batteries
Sodium Sulphur Batteries
Sodium Metal Halide Batteries
- Positive Electrode:
- Negative Electrode:
- Net Cell Reaction:
3.4.6. Metal Air Batteries
- Anode:
- Cathode:
- Anode:
- Cathode:
3.4.7. Nickel-Based Batteries
Nickel Cadmium Batteries
Nickel Metal Hydride Batteries
Nickel Hydrogen Batteries
Nickel Iron Batteries
- Cathode:
- Anode:
- Overall reaction:
Nickel Zinc Batteries
3.4.8. Flow Batteries
Redox Flow Batteries
Vanadium Redox Flow Battery
- Anode:
- Cathode:
- Overall:
Polysulphide Bromide Battery
- Reaction at anode:
- Reaction at cathode:
- Overall reaction:
Hybrid Flow Batteries
Zinc Bromine Batteries
- Anode:
- Cathode:
- Overall:
Zinc Cerium Batteries
Redox Flow Batteries with Solid Electroactive Materials
Flowing Carbon as Electrochemical Reaction Electrodes
Flowing Solid Active Materials with Flowing Carbon Conducting Network
Flowing Active Material Particles Colliding on Current Collectors without Carbon
Targeted Redox Mediators as the Power Carriers with Static Solid Active Materials Providing Energy Storage
3.4.9. Electrochemical Capacitors
Pseudocapacitor
Hybrid Supercapacitor
3.5. Chemical Energy Storage
3.5.1. Fuel Cell
Proton Exchange Membrane Fuel Cell (PEMFC)
Direct Formic Acid Fuel Cell (DFAFC)
Direct Ethanol Fuel Cell (DEFC)
Alkaline Fuel Cell (AFC)
Phosphoric Acid Fuel Cell (PAFC)
Direct Methanol Fuel Cell (DMFC)
Molten Carbonate Fuel Cell (MCFC)
Solid Oxide Fuel Cell (SOFC)
Other Fuel Cells
Biologically and Micro-Organism Inspired Fuel Cell
- Acetate:
- Glucose:
- Glycerol:
- Domestic Wastewater:
- Oxygen: ;
Regenerative Fuel Cell
3.5.2. Solar Fuels
Solar Hydrogen
Solar Hydrocarbon
Solar Metal
Solar Chemical Heat Pipe
3.5.3. Biofuels
3.5.4. Aluminum Energy Storage
3.6. Hybrid Energy Storage System
4. Comparison among the Energy Storage Systems
5. Current Scenario of Energy Storage Systems
6. Applications of Energy Storage Systems
7. Business Models of Energy Storage Systems
8. Environmental Impacts of Energy Storage Systems
9. Energy Storage Policies and Standards
10. Barriers and Potential Solutions
11. Future Prospects of Energy Storage
12. Outcome of this Study
- i.
- A brief introduction to energy storage systems is provided, which reassures the necessity of ESSs to tackle the problem of intermittency of RESs, whose penetration into the utility grid is of vital importance in today’s world due to the depletion of fossil fuels and the deteriorating condition of our planet.
- ii.
- The chronological evolution of the several types of ESSs are described to reflect the gradual progress of this emerging technology.
- iii.
- Energy can be stored in numerous forms. More than 45 types of storage systems are elaborately discussed here, including their detailed concept, related diagrams, equations, etc.
- iv.
- All the different types of energy storage systems are compared on the basis of 20 technical parameters. The comparison among ESSs is a major subject of analysis before the practical deployment of an ESS.
- v.
- At present, ESSs are flourishing in leaps and bounds, as more countries are trying to install increased capacities of ES facility. Some of the most prominent ES projects around the world have been neatly tabulated in this paper along with their specifications.
- vi.
- The multidimensional applications of ESSs are dictated with the required specifications. Furthermore, an insight has been provided regarding the suitability of a particular type of ESS based on the particular application.
- vii.
- The business models of ESSs are discussed in depth, because the success of an ESS not only depends on its widespread deployment, but also on proper economic practice and conducting profitability study. The business model framework is illustrated too.
- viii.
- The environmental impacts of ESSs are narrated, with reflections on how ESSs are helping the environment, and also on their side-effects regarding disposal.
- ix.
- The policies and existing standards regarding ESSs prevailing around the world are tabulated in this paper. These policies help to establish ESSs as a viable technology.
- x.
- Several barriers impede the growth of ESSs. These barriers, along with their potential solutions, are tabulated. In addition, the policies undertaken by different regulatory organizations to overcome these barriers are listed.
13. Conclusions
Author Contributions
Funding
Acknowledgments
Conflicts of Interest
References
- Global Energy and CO2 Status Report 2018; Energy Demand; International Energy Agency (IEA): Paris, France, 2019; p. 29.
- GLOBE-Net Global Energy Demand Rose by 2.3% in 2018, Its Fastest Pace in the Last Decade—GLOBE-Net. Available online: https://globe-net.com/global-energy-demand-rose-by-2-3-in-2018-its-fastest-pace-in-the-last-decade/ (accessed on 5 February 2020).
- Nadeem, F.; Hussain, S.M.S.; Tiwari, P.K.; Goswami, A.K.; Ustun, T.S. Comparative Review of Energy Storage Systems, Their Roles, and Impacts on Future Power Systems. IEEE Access 2019, 7, 4555–4585. [Google Scholar] [CrossRef]
- UN Environment and International Energy Agency. Towards a zero-emission, efficient, and resilient buildings and construction sector. Global Status Report 2017, 2017, 1–48. [Google Scholar]
- Hossain, E.; Murtaugh, D.; Mody, J.; Faruque, H.M.R.; Haque Sunny, M.S.; Mohammad, N. A Comprehensive Review on Second-Life Batteries: Current State, Manufacturing Considerations, Applications, Impacts, Barriers & Potential Solutions, Business Strategies, and Policies. IEEE Access 2019, 7, 73215–73252. [Google Scholar]
- Chen, H.; Cong, T.N.; Yang, W.; Tan, C.; Li, Y.; Ding, Y. Progress in electrical energy storage system: A critical review. Prog. Nat. Sci. 2009, 19, 291–312. [Google Scholar] [CrossRef]
- Poullikkas, A. A comparative overview of large-scale battery systems for electricity storage. Renew. Sustain. Energy Rev. 2013, 27, 778–788. [Google Scholar] [CrossRef]
- Whittingham, M.S. History, Evolution, and Future Status of Energy Storage. Proc. IEEE 2012, 100, 1518–1534. [Google Scholar] [CrossRef]
- The History and Development of Batteries. Available online: https://phys.org/news/2015-04-history-batteries.html (accessed on 23 March 2020).
- History of Biofuels—BioFuel Information. Available online: http://biofuel.org.uk/history-of-biofuels.html (accessed on 23 March 2020).
- Fuel Cell History—Fuel Cell Today. Available online: http://www.fuelcelltoday.com/history (accessed on 24 March 2020).
- Lead-Based Batteries Information—Battery University. Available online: https://batteryuniversity.com/learn/ article/lead_based_batteries (accessed on 19 June 2020).
- Hydropower, Explained. Available online: https://www.nationalgeographic.com/environment/global-warming/hydropower/ (accessed on 19 June 2020).
- History of Flywheel Energy Storage Systems | Gerotor AG; Gerotor GmbH Akt. Energiemanagement. Available online: http://gerotor.tech/history-of-flywheel-energy-storage-systems/ (accessed on 6 February 2020).
- A Brief History of Flow Batteries. News Energy Storage Batter. Climate Change Environment. 2017. Available online: https://www.upsbatterycenter.com/blog/flow-batteries-history/ (accessed on 24 March 2020).
- Nickel-Based Batteries Information—Battery University. Available online: https://batteryuniversity.com/learn/article/nickel_based_batteries (accessed on 6 December 2019).
- Omar, N.; Firouz, Y.; Abdel Monem, M.; Samba, A.; Gualous, H.; Coosemans, T.C.; Van Den Bossche, P.; Van Mierlo, J. Analysis of Nickel-Based Battery Technologies for Hybrid and Electric Vehicles. In Reference Module in Chemistry, Molecular Sciences and Chemical Engineering; Elsevier: Amsterdam, The Netherlands, 2014. [Google Scholar]
- Nickel Iron Battery Information. Available online: http://www.nickel-iron-battery.com/ (accessed on 13 March 2020).
- Sparacino, A.R.; Reed, G.F.; Kerestes, R.J.; Grainger, B.M.; Smith, Z.T. Survey of battery energy storage systems and modeling techniques. In Proceedings of the 2012 IEEE Power and Energy Society General Meeting, San Diego, CA, USA, 22–26 July 2012; pp. 1–8. [Google Scholar]
- Hartenbach, A.; Bayer, M.; Dustmann, C.-H. The Sodium Metal Halide (ZEBRA) Battery. In Molten Salts Chemistry; Elsevier: Amsterdam, The Netherlands, 2013; pp. 439–450. ISBN 978-0-12-398538-5. [Google Scholar]
- Hassenzahl, W.V. Superconducting magnetic energy storage. Proc. IEEE 1983, 71, 1089–1098. [Google Scholar] [CrossRef] [Green Version]
- O’Donnell, M.; Smithrick, J. Nickel Hydrogen Batteries—An Overview; NASA Lewis Research Center: Cleveland, OH, USA, 1995; p. 13.
- Supercapacitor Information—Battery University. Available online: https://batteryuniversity.com/learn/ article/whats_the_role_of_the_supercapacitor (accessed on 19 June 2020).
- Jimbo Compressed Air Energy Storage. Available online: https://www.thegreenage.co.uk/tech/ compressed-air-energy-storage/ (accessed on 19 June 2020).
- DNK. Complete Guide for Lithium Polymer(Lipo) Battery: History, Charging, Safety, Storage and Care. DNK Lithium Ion Battery Pack Manufacturer and Supplier. 2019. Available online: https://www.dnkpower.com/lithium-polymer-battery-guide/ (accessed on 24 March 2020).
- Luo, X.; Wang, J.; Dooner, M.; Clarke, J. Overview of current development in electrical energy storage technologies and the application potential in power system operation. Appl. Energy 2015, 137, 511–536. [Google Scholar] [CrossRef] [Green Version]
- Breeze, P. Power System Energy Storage Technologies. In Power Generation Technologies; Elsevier: Amsterdam, The Netherlands, 2019; pp. 219–249. ISBN 978-0-08-102631-1. [Google Scholar]
- International Energy Agency. Tracking Clean Energy Progress 2017. 2017. Available online: https://www.ourenergypolicy.org/wp-content/uploads/2017/05/TrackingCleanEnergyProgress2017.pdf (accessed on 30 November 2019).
- U.S. Department of Energy Office of Electricity Delivery and Energy Reliability. Energy Storage Program Planning Document. 2011. Available online: https://www.energy.gov/sites/prod/files/oeprod/DocumentsandMedia/OE_Energy_Storage_Program_Plan_Feburary_2011v3.pdf (accessed on 30 November 2019).
- Antal, B.A. Pumped Storage Hydropower: A Technical Review. Boulder: Department of Civil Engineering University of Colorado Denver,. 2014. Available online: https://www.ucdenver.edu/faculty-staff/dmays/3414/Documents/Antal-MS-2014.pdf (accessed on 30 November 2019).
- Safaei, H.; Aziz, M.J. Thermodynamic Analysis of Three Compressed Air Energy Storage Systems: Conventional, Adiabatic, and Hydrogen-Fueled. Energies 2017, 10, 1020. [Google Scholar] [CrossRef] [Green Version]
- Martinez, M.; Molina, M.G.; Frack, F.; Mercado, P.E. Dynamic Modeling, Simulation and Control of Hybrid Energy Storage System Based on Compressed Air and Supercapacitors. IEEE Lat. Am. Trans. 2013, 11, 466–472. [Google Scholar] [CrossRef]
- Jannelli, E.; Minutillo, M.; Lubrano Lavadera, A.; Falcucci, G. A small-scale CAES (compressed air energy storage) system for stand-alone renewable energy power plant for a radio base station: A sizing-design methodology. Energy 2014, 78, 313–322. [Google Scholar] [CrossRef]
- Madlener, R.; Latz, J. Centralized and Integrated Decentralized Compressed Air Energy Storage for Enhanced Grid Integration of Wind Power; Social Science Research Network: Rochester, NY, USA, 2010. [Google Scholar]
- Kaldemeyer, C.; Boysen, C.; Tuschy, I. Compressed Air Energy Storage in the German Energy System—Status Quo & Perspectives. Energy Procedia 2016, 99, 298–313. [Google Scholar]
- Wang, J.; Lu, K.; Ma, L.; Wang, J.; Dooner, M.; Miao, S.; Li, J.; Wang, D. Overview of Compressed Air Energy Storage and Technology Development. Energies 2017, 10, 991. [Google Scholar] [CrossRef] [Green Version]
- Kalaiselvam, S.; Parameshwaran, R. Energy Storage. In Thermal Energy Storage Technologies for Sustainability; Elsevier: Amsterdam, The Netherlands, 2014; pp. 21–56. ISBN 978-0-12-417291-3. [Google Scholar]
- Guo, H.; Xu, Y.; Chen, H.; Zhou, X. Thermodynamic characteristics of a novel supercritical compressed air energy storage system. Energy Convers. Manag. 2016, 115, 167–177. [Google Scholar] [CrossRef]
- Vafakhah, B.; Masiala, M.; Salmon, J.; Knight, A. Emulation of flywheel energy storage systems with a PMDC machine. In Proceedings of the 2008 18th International Conference on Electrical Machines, Vilamoura, Portugal, 6–9 September 2008; pp. 1–6. [Google Scholar]
- Liu, H.; Jiang, J. Flywheel energy storage—An upswing technology for energy sustainability. Energy Build. 2007, 39, 599–604. [Google Scholar] [CrossRef]
- Hebner, R.; Beno, J.; Walls, A. Flywheel batteries come around again. IEEE Spectr. 2002, 39, 46–51. [Google Scholar] [CrossRef] [Green Version]
- Amiryar, M.; Pullen, K. A Review of Flywheel Energy Storage System Technologies and Their Applications. Appl. Sci. 2017, 7, 286. [Google Scholar] [CrossRef] [Green Version]
- Sebastián, R.; Peña Alzola, R. Flywheel energy storage systems: Review and simulation for an isolated wind power system. Renew. Sustain. Energy Rev. 2012, 16, 6803–6813. [Google Scholar] [CrossRef]
- Emadi, A.; Nasiri, A.; Bekiarov, S.B. Uninterruptible Power Supplies and Active Filters, 1st ed.; Power Electronics and Applications Series; CRC Press: Boca Raton, FL, USA, 2004; ISBN 978-0-8493-3035-3. [Google Scholar]
- Brown, D.R.; Chvala, W.D. Flywheel Energy Storage: An Alternative to Batteries for UPS Systems. Energy Eng. 2005, 102, 7–26. [Google Scholar] [CrossRef]
- Bakay, L.; Dubois, M.; Viarouge, P.; Ruel, J. Losses in an optimized 8-pole radial AMB for Long Term Flywheel Energy Storage. In Proceedings of the 2009 International Conference on Electrical Machines and Systems, Tokyo, Japan, 15–18 November 2009; pp. 1–6. [Google Scholar]
- Parfomak, P.W. Energy Storage for Power Grids and Electric Transportation: A Technology Assessment; CRS Report for Congress, Congressional Research Service: Washington, DC, USA, March 2012; p. 146. [Google Scholar]
- Peña-Alzola, R.; Sebastián, R.; Quesada, J.; Colmenar, A. Review of flywheel based energy storage systems. In Proceedings of the 2011 International Conference on Power Engineering, Energy and Electrical Drives, Malaga, Spain, 10–11 May 2011; pp. 1–6. [Google Scholar]
- Sarbu, I.; Sebarchievici, C. A Comprehensive Review of Thermal Energy Storage. Sustainability 2018, 10, 191. [Google Scholar] [CrossRef] [Green Version]
- Supercapacitors: Past, Present, and Future. Power Electronics. 16 March 2018. Available online: https://www.powerelectronics.com/technologies/alternative-energy/article/21864122/supercapacitors-past-present-and-future (accessed on 5 February 2020).
- Grama, A.; Grama, L.; Petreus, D.; Rusu, C. Supercapacitor modelling using experimental measurements. In Proceedings of the 2009 International Symposium on Signals, Circuits and Systems, Iasi, Romania, 9–10 July 2019; IEEE: Iasi, Romania, 2009; pp. 1–4. [Google Scholar]
- Dougal, R.A.; Gao, L.; Liu, S. Ultracapacitor model with automatic order selection and capacity scaling for dynamic system simulation. J. Power Sources 2004, 126, 250–257. [Google Scholar] [CrossRef]
- Miller, J.M.; Nebrigic, D.; Everett, M. Ultracapacitor distributed model equivalent circuit for power electronic circuit simulation. In Ansoft Leading Insights Workshop; PA, USA, 2006; Volume 19, Available online: https://www.google.com/url?sa=t&rct=j&q=&esrc=s&source=web&cd=&ved=2ahUKEwiG4-vO99DqAhWZPXAKHftdBqYQFjAAegQIARAB&url=https%3A%2F%2Fcourseware.zcu.cz%2FCoursewarePortlets2%2FDownloadDokumentu%3Fid%3D69439&usg=AOvVaw2s9KZwM_elP11vc1WK1vGq (accessed on 5 February 2020).
- Kousksou, T.; Bruel, P.; Jamil, A.; El Rhafiki, T.; Zeraouli, Y. Energy storage: Applications and challenges. Sol. Energy Mater. Sol. Cells 2014, 120, 59–80. [Google Scholar] [CrossRef]
- Zhou, Z.; Benbouzid, M.; Frédéric Charpentier, J.; Scuiller, F.; Tang, T. A Review of Energy Storage Technologies for Marine Current Energy Systems. Renew. Sustain. Energy Rev. 2013, 18, 390–400. [Google Scholar] [CrossRef] [Green Version]
- Chen, W.; Ådnanses, A.K.; Hansen, J.F.; Lindtjørn, J.O.; Tang, T. Super-capacitors based hybrid converter in marine electric propulsion system. In Proceedings of the XIX International Conference on Electrical Machines—ICEM 2010, Rome, Italy, 6–8 September 2010; pp. 1–6. [Google Scholar]
- Cultura, A.B.; Salameh, Z.M. Modeling, Evaluation and Simulation of a Supercapacitor Module for Energy Storage Application. In Proceedings of the International Conference on Computer Information Systems and Industrial Applications, Bangkok, Thailand, 28–29 June 2015; Atlantis Press: Bangkok, Thailand, 2015. [Google Scholar]
- Guidi, G.; Undeland, T.M.; Hori, Y. An Interface Converter with Reduced Volt-Ampere Ratings for Battery-Supercapacitor Mixed Systems. IEEJ Trans. Ind. Appl. 2008, 128, 418–423. [Google Scholar] [CrossRef] [Green Version]
- Muzaffar, A.; Ahamed, M.B.; Deshmukh, K.; Thirumalai, J. A review on recent advances in hybrid supercapacitors: Design, fabrication and applications. Renew. Sustain. Energy Rev. 2019, 101, 123–145. [Google Scholar] [CrossRef]
- Philippe, B.; Pittet, S.; Rufer, A. Series Connection of Supercapacitors, with an Active Device for Equalizing the Voltages; PCIM2000 Power Conversion and Intelligent Motion: Nürnberg, Germany, 2000. [Google Scholar]
- Chapman, D.L. A contribution to the theory of electrocapillarity. Lond. Edinb. Dublin Philos. Mag. J. Sci. 2010, 25, 475–481. [Google Scholar] [CrossRef] [Green Version]
- Zimmermann, A.W.; Yang, Y.; Young, D.E.A. Review of the State of the Art Superconducting Magnetic Energy Storage (SMES) in Renewable/Distributed Energy Systems; CPE 610 Mini Project Final Report. EPSRC Centre for Doctoral Training, UK, 2017. Available online: https://energystorage-cdt.group.shef.ac.uk/outputs/cohort-3/Zimmermann+Mini+Project+Final+Report.pdf (accessed on 5 February 2020).
- Abdullah, A.Z.; Ahmed, S.; Monira, N.J. An overview of superconducting magnetic energy storage (SMES) and its applications. In Proceedings of the International Conference on Nanotechnology and Condensed Matter Physics, International Conference on Nanotechnology and Condensed Matter Physics 2018 (ICNCMP 2018), Dhaka, Bangladesh, 11–12 January 2018. [Google Scholar]
- Marchionini, B.G.; Yamada, Y.; Martini, L.; Ohsaki, H. High-Temperature Superconductivity: A Roadmap for Electric Power Sector Applications, 2015–2030. IEEE Trans. Appl. Supercond. 2017, 27, 0500907. [Google Scholar] [CrossRef]
- Kumar, N. Superconducting Magnetic Energy Storage (SMES) System. Technical Report. p. 5. Available online: https://www.researchgate.net/profile/Nishant_Kumar28/publication/261204920_Superconducting_Magnetic_Energy_Storage_SMES_System/links/55a12e7d08aea815dffbfbf0/Superconducting-Magnetic-Energy-Storage-SMES-System.pdf (accessed on 5 February 2020).
- Krivik, P.; Baca, P. Electrochemical Energy Storage, Energy Storage—Technologies and Applications, Ahmed Faheem Zobaa, IntechOpen. 23 January 2013. Available online: https://www.intechopen.com/books/energy-storage-technologies-and-applications/electrochemical_energy_storage (accessed on 5 February 2020). [CrossRef] [Green Version]
- Divya, K.C.; Østergaard, J. Battery energy storage technology for power systems—An overview. Electr. Power Syst. Res. 2009, 79, 511–520. [Google Scholar] [CrossRef]
- Cho, J.; Jeong, S.; Kim, Y. Commercial and research battery technologies for electrical energy storage applications. Prog. Energy Combust. Sci. 2015, 48, 84–101. [Google Scholar] [CrossRef]
- Boi, M.; Salimbeni, A.; Damiano, A. A Thévenin circuit modelling approach for sodium metal halides batteries. In Proceedings of the IECON 2017—43rd Annual Conference of the IEEE Industrial Electronics Society, Beijing, China, 29 October–1 November 2017; IEEE: Beijing, China, 2017; pp. 7611–7616. [Google Scholar]
- Lach, J.; Wróbel, K.; Wróbel, J.; Podsadni, P.; Czerwiński, A. Applications of carbon in lead-acid batteries: A review. J. Solid State Electrochem. 2019, 23, 693–705. [Google Scholar] [CrossRef] [Green Version]
- May, G.J. Lead batteries for utility energy storage: A review. J. Energy Storage 2018, 15, 145–157. [Google Scholar] [CrossRef]
- Study Finds Nearly 100 Percent Recycling Rate for Lead Batteries. Study Finds Nearly 100 Percent Recycling Rate for Lead Batteries. Available online: https://www.recyclingtoday.com/article/battery-council-international-lead-battery-recycling/ (accessed on 3 December 2019).
- Lead Acid Batteries | Pulsetech Products Corporation. Available online: https://www.pulsetech.net/support/lead-acid-batteries.html/ (accessed on 3 December 2019).
- Pratik, R.; Varun, V.; Pronay, C. Design and Analysis of Maintenance Free Lead Acid Battery System Used in UPS. 2018. Available online: https://www.researchgate.net/publication/327321203_Design_and_Analysis_of_Maintenance_Free_Lead_Acid_Battery_System_Used_in_UPS (accessed on 5 February 2020). [CrossRef]
- Hannan, M.A.; Hoque, M.M.; Mohamed, A.; Ayob, A. Review of energy storage systems for electric vehicle applications: Issues and challenges. Renew. Sustain. Energy Rev. 2017, 69, 771–789. [Google Scholar] [CrossRef]
- Model-based Control Approaches for Optimal Integration of a Hybrid Wind-diesel Power System in a Microgrid. In Proceedings of the 2nd International Conference on Smart Grids and Green IT Systems, 9–10 May 2013; SciTePress—Science and and Technology Publications: Aachen, Germany, 2013; pp. 12–21.
- The Differences between AGM, GEL and FLOODED Batteries. Battery Guys. Available online: https://batteryguys.com/pages/the-differences-between-agm-gel-and-flooded-batteries (accessed on 5 December 2019).
- Burlin, W. Lead-Acid Battery Comparison: Flooded vs Sealed & AGM vs Gel Batteries. Wholesale Sol. Blog. 20 December 2018. Available online: https://www.wholesalesolar.com/blog/lead-acid-battery-comparison/ (accessed on 5 December 2019).
- Lead Acid Battery Types | Lead Acid Battery Introduction Mr Positive. Available online: https://www.mrpositive.co.nz/buying/knowledge-base/lead-acid-battery-types/ (accessed on 5 December 2019).
- Best RV Deep Cycle Battery 2019—Best RV Battery Guide EVER. Green Living Blog. 20 December 2017. Available online: https://mozaw.com/best-rv-deep-cycle-battery/ (accessed on 5 December 2019).
- The Nobel Prize in Chemistry 2019. Available online: https://www.nobelprize.org/prizes/chemistry/2019/popular-information/ (accessed on 8 July 2020).
- Pioneers of Innovation: The Battery that Changed the World. Pioneers of Innovation: The Battery that Changed the World. Energy Factor. 10 October 2019. Available online: https://energyfactor.exxonmobil.com/science-technology/battery-changed-world/ (accessed on 8 July 2020).
- Reddy, M.V.; Mauger, A.; Julien, C.M.; Paolella, A.; Zaghib, K. Brief History of Early Lithium-Battery Development. Materials 2020, 13, 1884. [Google Scholar] [CrossRef] [PubMed] [Green Version]
- P. 02 J. 2020 | 16:00 GMT. The Return of the Lithium-Metal Battery—IEEE Spectrum. IEEE Spectrum: Technology, Engineering, and Science News. Available online: https://0-spectrum-ieee-org.brum.beds.ac.uk/energy/the-smarter-grid/the-return-of-the-lithiummetal-battery (accessed on 8 July 2020).
- Grossman, D. Lithium Metal Could Soon Replace Lithium Ion in Batteries. Popular Mechanics. 29 August 2019. Available online: https://www.popularmechanics.com/cars/hybrid-electric/a28859683/lithium-metal-replace-lithium-ion-batteries/ (accessed on 8 July 2020).
- New Electrode Design May Lead to More Powerful Batteries. MIT News. Available online: http://news.mit.edu/2020/solid-batteries-lithium-metal-electrode-0203 (accessed on 8 July 2020).
- Li, S.; Jiang, M.; Xie, Y.; Xu, H.; Jia, J.; Li, J. Developing High-Performance Lithium Metal Anode in Liquid Electrolytes: Challenges and Progress. Adv. Mater. 2018, 30, 1706375. [Google Scholar] [CrossRef] [PubMed]
- Hwang, J.-Y.; Park, S.-J.; Yoon, C.S.; Sun, Y.-K. Customizing a Li–metal battery that survives practical operating conditions for electric vehicle applications. Energy Environ. Sci. 2019, 12, 2174–2184. [Google Scholar] [CrossRef] [Green Version]
- Tang, W.; Yin, X.; Kang, S.; Chen, Z.; Tian, B.; Teo, S.L.; Wang, X.; Chi, X.; Loh, K.P.; Lee, H.-W.; et al. Lithium Silicide Surface Enrichment: A Solution to Lithium Metal Battery. Adv. Mater. 2018, 30, 1801745. [Google Scholar] [CrossRef]
- Yang, Q.; Li, C. Li metal batteries and solid state batteries benefiting from halogen-based strategies. Energy Storage Mater. 2018, 14, 100–117. [Google Scholar] [CrossRef]
- Chen, L.; Fan, X.; Ji, X.; Chen, J.; Hou, S.; Wang, C. High-Energy Li Metal Battery with Lithiated Host. Joule 2019, 3, 732–744. [Google Scholar] [CrossRef] [Green Version]
- Mu, D.; Jiang, J.; Zhang, C. Online Semiparametric Identification of Lithium-Ion Batteries Using the Wavelet-Based Partially Linear Battery Model. Energies 2013, 6, 2583–2604. [Google Scholar] [CrossRef] [Green Version]
- Koohi-Kamali, S. Emergence of energy storage technologies as the solution for reliable operation of smart power systems—A review. Renew. Sustain. Energy Rev. 2013, 25, 135–365. [Google Scholar] [CrossRef]
- Chung, S.-Y.; Bloking, J.T.; Chiang, Y.-M. Electronically conductive phospho-olivines as lithium storage electrodes. Nat. Mater. 2002, 1, 123–128. [Google Scholar] [CrossRef] [PubMed]
- Okou, R.; Sebitosi, A.B.; Pillay, P. Flywheel rotor manufacture for rural energy storage in sub-Saharan Africa. Energy 2011, 36, 6138–6145. [Google Scholar] [CrossRef]
- Barnes, F.S. Large Energy Storage Systems Handbook, 1st ed.; CRC Press: Boca Raton, FL, USA; ISBN 978-1-4200-8601-0.
- Types of Lithium-Ion Batteries—Battery University. Available online: https://batteryuniversity.com/index.php/learn/article/types_of_lithium_ion (accessed on 5 December 2019).
- Power, F. Lithium-Ion Battery Technology. Available online: https://www.fluxpower.com/lithium-ion-battery-technology (accessed on 6 July 2020).
- Jaffe, S. The Lithium Ion Battery Market. In Proceedings of the ARPA E RANGE Conference, Cape Canaveral, FL, USA, 28–29 January 2014; p. 18. [Google Scholar]
- Advantages & Limitations of the Lithium-Ion Battery—Battery University. Available online: https://batteryuniversity.com/learn/archive/is_lithium_ion_the_ideal_battery/ (accessed on 7 February 2020).
- Esfahanian, M.; Mahmoodian, A.; Amiri, M.; Tehrani, M.M.; Nehzati, H.; Hejabi, M.; Manteghi, A. Large Lithium Polymer Battery Modeling for the Simulation of Hybrid Electric Vehicles Using the Equivalent Circuit Method. IJAE 2013, 3, 564–576. [Google Scholar]
- Fattal, J.; Dib Nabil Karami, P.B. Review on different charging techniques of a lithium polymer battery. In Proceedings of the 2015 Third International Conference on Technological Advances in Electrical, Electronics and Computer Engineering (TAEECE), Beirut, Lebanon, 29 April–1 May 2015; IEEE: Beirut, Lebanon, 2015; pp. 33–38. [Google Scholar]
- What Is Lipo Battery Pack Construction. GensTattu Blog. Available online: https://www.genstattu.com/blog/what-is-lipo-battery-pack-construction/ (accessed on 7 February 2020).
- Yang, B.; Makarov, Y.; Desteese, J.; Viswanathan, V.; Nyeng, P.; McManus, B.; Pease, J. On the use of energy storage technologies for regulation services in electric power systems with significant penetration of wind energy. In Proceedings of the 2008 5th International Conference on the European Electricity Market, Lisboa, Portugal, 28–30 May 2008; IEEE: Lisboa, Portugal, 2008; pp. 1–6. [Google Scholar]
- Wen, Z. Study on Energy Storage Technology of Sodium Sulfur Battery and it’s Application in Power System. In Proceedings of the 2006 International Conference on Power System Technology, Chongqing, China, 22–26 October 2006; IEEE: Chongqing, China, 2006; pp. 1–4. [Google Scholar]
- Reed, G.F.; Philip, P.A.; Barchowsky, A.; Lippert, C.J.; Sparacino, A.R. Sample survey of smart grid approaches and technology gap analysis. In Proceedings of the 2010 IEEE PES Innovative Smart Grid Technologies Conference Europe (ISGT Europe), Gothenburg, Sweden, 11–20 October 2010; IEEE: Gothenburg, Sweden, 2010; pp. 1–10. [Google Scholar]
- NGK Insulators Sodium Sulfur Batteries for Large Scale Grid Energy Storage. Available online: http://energystoragenews.com/NGK%20Insulators%20Sodium%20Sulfur%20Batteries%20for%20Large%20Scale%20Grid%20Energy%20Storage.html (accessed on 5 December 2019).
- Specs | NAS Energy Storage System: Sodium Sulfur Battery. Available online: https://www.ngk.co.jp/nas/specs/ (accessed on 5 December 2019).
- Hussien, Z.F.; Cheung, L.W.; Siam, M.F.M.; Ismail, A.B. Modeling of Sodium Sulfur Battery for Power System Applications. ELEKTRIKA 2007, 9, 66–72. [Google Scholar]
- Rijssenbeek, J.; Wiegman, H.; Hall, D.; Chuah, C.; Balasubramanian, G.; Brady, C. Sodium-metal halide batteries in diesel-battery hybrid telecom applications. In Proceedings of the 2011 IEEE 33rd International Telecommunications Energy Conference (INTELEC), Amsterdam, The Netherlands, 9–13 October 2011; IEEE: Amsterdam, The Netherlands, 2011; pp. 1–4. [Google Scholar]
- Dustmann, C.-H. Advances in ZEBRA batteries. J. Power Sources 2004, 127, 85–92. [Google Scholar] [CrossRef]
- O’sullivan, T.M.; Bingham, C.M.; Clark, R.E. Zebra battery technologies for all electric smart car. In International Symposium on Power Electronics, Electrical Drives, Automation and Motion, 2006. SPEEDAM 2006; IEEE: Taormina, Italy, 2006; p. 243. [Google Scholar]
- David, T. Current Status of Health and Safety Issues of Sodium/Metal Chloride (ZEBRA) Batteries; No. NREL/TP-460-25553; National Renewable Energy Lab.: Golden, CO, USA, 1998. [Google Scholar]
- Zhang, H.; Chow, M.Y. Comprehensive dynamic battery modeling for PHEV applications. In Proceedings of the IEEE PES General Meeting, Detroit, MI, USA, 24–29 July 2010; pp. 1–6. [Google Scholar]
- Clark, S.; Latz, A.; Horstmann, B. A Review of Model-Based Design Tools for Metal-Air Batteries. Batteries 2018, 4, 5. [Google Scholar] [CrossRef] [Green Version]
- Li, Y.; Lu, J. Metal-Air Batteries: Future Electrochemical Energy Storage of Choice? ACS Energy Lett. 2017, 2, 1370–1377. [Google Scholar] [CrossRef]
- Li, Y.; Zhang, X.; Li, H.-B.; Yoo, H.D.; Chi, X.; An, Q.; Liu, J.; Yu, M.; Wang, W.; Yao, Y. Mixed-phase mullite electrocatalyst for pH-neutral oxygen reduction in magnesium-air batteries. Nano Energy 2016, 27, 8–16. [Google Scholar] [CrossRef] [Green Version]
- Li, C.-S.; Sun, Y.; Gebert, F.; Chou, S.-L. Current Progress on Rechargeable Magnesium-Air Battery. Adv. Energy Mater. 2017, 7, 1700869. [Google Scholar] [CrossRef]
- Chen, L.D.; Nørskov, J.K.; Luntz, A.C. Theoretical Limits to the Anode Potential in Aqueous Mg–Air Batteries. J. Phys. Chem. C 2015, 119, 19660–19667. [Google Scholar] [CrossRef]
- Vardar, G.; Sleightholme, A.E.S.; Naruse, J.; Hiramatsu, H.; Siegel, D.J.; Monroe, C.W. Electrochemistry of Magnesium Electrolytes in Ionic Liquids for Secondary Batteries. ACS Appl. Mater. Interfaces 2014, 6, 18033–18039. [Google Scholar] [CrossRef] [PubMed]
- Fu, G.; Chen, Y.; Cui, Z.; Li, Y.; Zhou, W.; Xin, S.; Tang, Y.; Goodenough, J.B. A novel hydrogel-derived bifunctional oxygen electrocatalyst for rechargeable air cathodes. Nano Lett. 2016, 16, 6516–6522. [Google Scholar] [CrossRef] [PubMed]
- Mokhtar, M.; Talib, M.Z.M.; Majlan, E.H.; Tasirin, S.M.; Ramli, W.M.F.W.; Daud, W.R.W.; Sahari, J. Recent developments in materials for aluminum–air batteries: A review. J. Ind. Eng. Chem. 2015, 32, 1–20. [Google Scholar] [CrossRef]
- Zhang, Z.; Zuo, C.; Liu, Z.; Yu, Y.; Zuo, Y.; Song, Y. All-solid-state Al–air batteries with polymer alkaline gel electrolyte. J. Power Sources 2014, 251, 470–475. [Google Scholar] [CrossRef]
- Kim, J.; Park, H.; Lee, B.; Seong, W.M.; Lim, H.-D.; Bae, Y.; Kim, H.; Kim, W.K.; Ryu, K.H.; Kang, K. Dissolution and ionization of sodium superoxide in sodium–oxygen batteries. Nat. Commun. 2016, 7, 10670. [Google Scholar] [CrossRef]
- Adelhelm, P.; Hartmann, P.; Bender, C.L.; Busche, M.; Eufinger, C.; Janek, J. From lithium to sodium: Cell chemistry of room temperature sodium–air and sodium–sulfur batteries. Beilstein J. Nanotechnol. 2015, 6, 1016–1055. [Google Scholar] [CrossRef]
- Durmus, Y.E.; Aslanbas, Ö.; Kayser, S.; Tempel, H.; Hausen, F.; de Haart, L.G.J.; Granwehr, J.; Ein-Eli, Y.; Eichel, R.-A.; Kungl, H. Long run discharge, performance and efficiency of primary Silicon–air cells with alkaline electrolyte. Electrochim. Acta 2017, 225, 215–224. [Google Scholar] [CrossRef]
- Cohn, G.; Ein-Eli, Y. Study and development of non-aqueous silicon-air battery. J. Power Sources 2010, 195, 4963–4970. [Google Scholar] [CrossRef]
- Gilligan, G.E.; Qu, D. Zinc-air and other types of metal-air batteries. In Advances in Batteries for Medium and Large-Scale Energy Storage; Elsevier: Amsterdam, The Netherlands, 2015; pp. 441–461. ISBN 978-1-78242-013-2. [Google Scholar]
- Holze, R. The Kinetics of Oxygen Reduction at Porous Teflon-Bonded Fuel Cell Electrodes. J. Electrochem. Soc. 1984, 131, 2298. [Google Scholar] [CrossRef]
- Ma, Z.; Pei, P.; Wang, K.; Wang, X.; Xu, H.; Liu, Y.; Peng, G. Degradation characteristics of air cathode in zinc air fuel cells. J. Power Sources 2015, 274, 56–64. [Google Scholar] [CrossRef]
- Huang, Z.; Du, G. Nickel-based batteries for medium- and large-scale energy storage. In Advances in Batteries for Medium and Large-Scale Energy Storage; Elsevier: Amsterdam, The Netherlands, 2015; pp. 73–90. ISBN 978-1-78242-013-2. [Google Scholar]
- What Are Nickel Based Batteries—BatteryGuy.com Knowledge Base. Available online: https://batteryguy.com/kb/knowledge-base/what-are-nickel-based-batteries/ (accessed on 6 December 2019).
- Dell, R.M.; Rand, D.A.J. Understanding Batteries; Royal Society of Chemistry: London, UK, 2001; ISBN 978-0-85404-605-8. [Google Scholar] [CrossRef]
- Bruce, P.G. Energy storage beyond the horizon: Rechargeable lithium batteries. Solid State Ion. 2008, 179, 752–760. [Google Scholar] [CrossRef]
- Wakihara, M. Recent developments in lithium ion batteries. Mater. Sci. Eng. R Rep. 2001, 33, 109–134. [Google Scholar] [CrossRef]
- Connolly, D.; Lund, H.; Mathiesen, B.V.; Leahy, M. The first step towards a 100% renewable energy-system for Ireland. Appl. Energy 2011, 88, 502–507. [Google Scholar] [CrossRef]
- Norian, K.H. Equivalent circuit components of nickel–cadmium battery at different states of charge. J. Power Sources 2011, 196, 5205–5208. [Google Scholar] [CrossRef]
- Nickel Metal Hydride Handbook and Application Manual. Available online: www.energizer.com (accessed on 6 December 2019).
- Tarabay, J.; Karami, N. Nickel Metal Hydride battery: Structure, chemical reaction, and circuit model. In Proceedings of the 2015 Third International Conference on Technological Advances in Electrical, Electronics and Computer Engineering (TAEECE), Beirut, Lebanon, 29 April–1 May 2015; pp. 22–26. [Google Scholar]
- Ghossein, N.E.; Salameh, J.P.; Karami, N.; Hassan, M.E.; Najjar, M.B. Survey on electrical modeling methods applied on different battery types. In Proceedings of the 2015 Third International Conference on Technological Advances in Electrical, Electronics and Computer Engineering (TAEECE), Beirut, Lebanon, 29 April–1 May 2015; pp. 39–44. [Google Scholar]
- Zimmerman, A. Nickel-Hydrogen Batteries: Principles and Practice; American Institute of Aeronautics and Astronautics, Inc.: Washington, DC, USA, 2009; ISBN 978-1-884989-20-9. [Google Scholar]
- Chen, W.; Jin, Y.; Zhao, J.; Liu, N.; Cui, Y. Nickel-hydrogen batteries for large-scale energy storage. Proc. Natl. Acad. Sci. USA 2018, 115, 11694–11699. [Google Scholar] [CrossRef] [PubMed] [Green Version]
- Molecular Expressions: Electricity and Magnetism: Nickel-hydrogen Terrestrial Battery. Available online: https://micro.magnet.fsu.edu/electromag/electricity/batteries/nickelhydrogen.html (accessed on 6 December 2019).
- BU-210b: How does the Flow Battery Work?—Battery University. Available online: https://batteryuniversity.com/learn/article/bu_210b_flow_battery (accessed on 7 February 2020).
- Leung, P.; Li, X.; Ponce de León, C.; Berlouis, L.; Low, C.T.J.; Walsh, F.C. Progress in redox flow batteries, remaining challenges and their applications in energy storage. RSC Adv. 2012, 2, 10125. [Google Scholar] [CrossRef]
- Guarnieri, M.; Mattavelli, P.; Petrone, G.; Spagnuolo, G. Vanadium Redox Flow Batteries: Potentials and Challenges of an Emerging Storage Technology. IEEE Ind. Electron. Mag. 2016, 10, 20–31. [Google Scholar] [CrossRef] [Green Version]
- Nguyen, T.; Savinell, R.F. Flow Batterie. Electrochem. Soc. Interface 2010, 19, 54–56. [Google Scholar] [CrossRef]
- Devic, A.C. SusChem Battery Energy Storage. White Paper 2018. Available online: suschem.org (accessed on 7 February 2019).
- Mohamed, M.R.; Ahmad, H.; Seman, M.N.A.; Razali, S.; Najib, M.S. Electrical circuit model of a vanadium redox flow battery using extended Kalman filter. J. Power Sources 2013, 239, 284–293. [Google Scholar] [CrossRef]
- Weber, A.Z.; Mench, M.M.; Meyers, J.P.; Ross, P.N.; Gostick, J.T.; Liu, Q. Redox flow batteries: A review. J. Appl. Electrochem. 2011, 41, 1137–1164. [Google Scholar] [CrossRef] [Green Version]
- Pan, F.; Wang, Q. Redox Species of Redox Flow Batteries: A Review. Molecules 2015, 20, 20499–20517. [Google Scholar] [CrossRef] [PubMed]
- Wang, G.; Pou, J.; Agelidis, V.G. Reconfigurable battery energy storage system for utility-scale applications. In Proceedings of the IECON 2015—41st Annual Conference of the IEEE Industrial Electronics Society, Yokohama, Japan, 9–12 November 2015; pp. 004086–004091. [Google Scholar]
- Koo, B.; Lee, D.; Yi, J.; Shin, C.; Kim, D.; Choi, E.; Kang, T. Modeling the Performance of a Zinc/Bromine Flow Battery. Energies 2019, 12, 1159. [Google Scholar] [CrossRef] [Green Version]
- Byrne, R.; MacArtain, P. Energy performance of an operating 50 kWh zinc-bromide flow battery system. In Proceedings of the 2015 IEEE International Conference on Engineering, Technology and Innovation/ International Technology Management Conference (ICE/ITMC), Belfast, UK, 22–24 June 2015; pp. 1–6. [Google Scholar]
- Zhang, J.; Jiang, G.; Xu, P.; Ghorbani Kashkooli, A.; Mousavi, M.; Yu, A.; Chen, Z. An all-aqueous redox flow battery with unprecedented energy density. Energy Environ. Sci. 2018, 11, 2010–2015. [Google Scholar] [CrossRef]
- Butler, P.C.; Eidler, P.A.; Grimes, P.G.; Klassen, S.E.; Miles, R.C. Zinc/bromine batteries. In Handbook of Batteries; McGraw-Hill: Columbus, OH, USA, 2001; p. 37-01. [Google Scholar]
- Solid Electrode Battery Technology | Energy Storage Assocation. Available online: https://energystorage.org/why-energy-storage/technologies/solid-electrode-batteries/ (accessed on 7 February 2020).
- Bryans, D.; McMillan, B.G.; Spicer, M.; Wark, A.; Berlouis, L. Complexing Additives to Reduce the Immiscible Phase Formed in the Hybrid ZnBr 2 Flow Battery. J. Electrochem. Soc. 2017, 164, A3342–A3348. [Google Scholar] [CrossRef] [Green Version]
- Yu, X.; Manthiram, A. A Zinc-Cerium Cell for Energy Storage Using a Sodium-Ion Exchange Membrane. Adv. Sustain. Syst. 2017, 1, 1700082. [Google Scholar] [CrossRef]
- Xie, Z.; Liu, Q.; Chang, Z.; Zhang, X. The developments and challenges of cerium half-cell in zinc–cerium redox flow battery for energy storage. Electrochim. Acta 2013, 90, 695–704. [Google Scholar] [CrossRef]
- Qi, Z.; Koenig, G.M. Review Article: Flow battery systems with solid electroactive materials. J. Vac. Sci. Technol. B Nanotechnol. Microelectron. Mater. Process. Meas. Phenom. 2017, 35, 040801. [Google Scholar] [CrossRef] [Green Version]
- Petek, T.J.; Hoyt, N.C.; Savinell, R.F.; Wainright, J.S. Slurry electrodes for iron plating in an all-iron flow battery. J. Power Sources 2015, 294, 620–626. [Google Scholar] [CrossRef]
- Mubeen, S.; Jun, Y.; Lee, J.; McFarland, E.W. Solid Suspension Flow Batteries Using Earth Abundant Materials. ACS Appl. Mater. Interfaces 2016, 8, 1759–1765. [Google Scholar] [CrossRef]
- Ruggeri, I.; Arbizzani, C.; Soavi, F. A novel concept of Semi-solid, Li Redox Flow Air (O2) Battery: A breakthrough towards high energy and power batteries. Electrochim. Acta 2016, 206, 291–300. [Google Scholar] [CrossRef]
- Dong, K.; Wang, S.; Yu, J. A lithium/polysulfide semi-solid rechargeable flow battery with high output performance. RSC Adv. 2014, 4, 47517–47520. [Google Scholar] [CrossRef]
- Ding, Y.; Zhao, Y.; Yu, G. A Membrane-Free Ferrocene-Based High-Rate Semiliquid Battery. Nano Lett. 2015, 15, 4108–4113. [Google Scholar] [CrossRef] [PubMed]
- Yang, Y.; Zheng, G.; Cui, Y. A membrane-free lithium/polysulfide semi-liquid battery for large-scale energy storage. Energy Environ. Sci. 2013, 6, 1552–1558. [Google Scholar] [CrossRef]
- Fan, F.Y.; Woodford, W.H.; Li, Z.; Baram, N.; Smith, K.C.; Helal, A.; McKinley, G.H.; Carter, W.C.; Chiang, Y.-M. Polysulfide Flow Batteries Enabled by Percolating Nanoscale Conductor Networks. Nano Lett. 2014, 14, 2210–2218. [Google Scholar] [CrossRef]
- Duduta, M.; Ho, B.; Wood, V.C.; Limthongkul, P.; Brunini, V.E.; Carter, W.C.; Chiang, Y.-M. Semi-Solid Lithium Rechargeable Flow Battery. Adv. Energy Mater. 2011, 1, 511–516. [Google Scholar] [CrossRef]
- Zhao, Y.; Si, S.; Liao, C. A single flow zinc//polyaniline suspension rechargeable battery. J. Power Sources 2013, 241, 449–453. [Google Scholar] [CrossRef]
- Zhao, Y.; Si, B.S.; Wang, Z.L.; Tang, A.P.; Caoa, H. The Electrochemical Society Electrochemical Behavior of Polyaniline Microparticle Suspension as Flowing Anode for Rechargeable Lead Dioxide Flow Ba. Electrochem. Soc. 2014, 161, 3. [Google Scholar] [CrossRef]
- Zhao, Y.; Si, S.; Wang, L.; Liao, C.; Tang, P.; Cao, H. Electrochemical study on polypyrrole microparticle suspension as flowing anode for manganese dioxide rechargeable flow battery. J. Power Sources 2014, 248, 962–968. [Google Scholar] [CrossRef]
- Wu, S.; Zhao, Y.; Li, D.; Xia, Y.; Si, S. An asymmetric Zn//Ag doped polyaniline microparticle suspension flow battery with high discharge capacity. J. Power Sources 2015, 275, 305–311. [Google Scholar] [CrossRef]
- Montoto, E.C.; Nagarjuna, G.; Hui, J.; Burgess, M.; Sekerak, N.M.; Hernández-Burgos, K.; Wei, T.-S.; Kneer, M.; Grolman, J.; Cheng, K.J.; et al. Redox Active Colloids as Discrete Energy Storage Carriers. J. Am. Chem. Soc. 2016, 138, 13230–13237. [Google Scholar] [CrossRef] [PubMed]
- Wang, Q.; Zakeeruddin, S.M.; Wang, D.; Exnar, I.; Grätzel, M. Redox Targeting of Insulating Electrode Materials: A New Approach to High-Energy-Density Batteries. Angew. Chem. Int. Ed. 2006, 45, 8197–8200. [Google Scholar] [CrossRef] [PubMed]
- Jia, C.; Pan, F.; Zhu, Y.G.; Huang, Q.; Lu, L.; Wang, Q. High–energy density nonaqueous all redox flow lithium battery enabled with a polymeric membrane. Sci. Adv. 2015, 1, e1500886. [Google Scholar] [CrossRef] [Green Version]
- Huang, Q.; Li, H.; Grätzel, M.; Wang, Q. Reversible chemical delithiation/lithiation of LiFePO4: Towards a redox flow lithium-ion battery. Phys. Chem. Chem. Phys. 2013, 15, 1793–1797. [Google Scholar] [CrossRef] [PubMed]
- Pan, F.; Yang, J.; Huang, Q.; Wang, X.; Huang, H.; Wang, Q. Redox Targeting of Anatase TiO2 for Redox Flow Lithium-Ion Batteries. Adv. Energy Mater. 2014, 4, 1400567. [Google Scholar] [CrossRef]
- Zhao, Y.; Zheng, M.; Cao, J.; Ke, X.; Liu, J.; Chen, Y.; Tao, J. Easy synthesis of ordered meso/macroporous carbon monolith for use as electrode in electrochemical capacitors. Mater. Lett. 2008, 62, 548–551. [Google Scholar] [CrossRef]
- Fang, Y.; Liu, J.; Yu, D.J.; Wicksted, J.P.; Kalkan, K.; Topal, C.O.; Flanders, B.N.; Wu, J.; Li, J. Self-supported supercapacitor membranes: Polypyrrole-coated carbon nanotube networks enabled by pulsed electrodeposition. J. Power Sources 2010, 195, 674–679. [Google Scholar] [CrossRef]
- Babeł, K.; Jurewicz, K. KOH activated lignin based nanostructured carbon exhibiting high hydrogen electrosorption. Carbon 2008, 46, 1948–1956. [Google Scholar] [CrossRef]
- Conway, B.E.; Tilak, B.V. Interfacial processes involving electrocatalytic evolution and oxidation of H2, and the role of chemisorbed H. Electrochim. Acta 2002, 47, 3571–3594. [Google Scholar] [CrossRef]
- Lota, G.; Fic, K.; Frackowiak, E. Carbon nanotubes and their composites in electrochemical applications. Energy Environ. Sci. 2011, 4, 1592. [Google Scholar] [CrossRef]
- Béguin, F.; Kierzek, K.; Friebe, M.; Jankowska, A.; Machnikowski, J.; Jurewicz, K.; Frackowiak, E. Effect of various porous nanotextures on the reversible electrochemical sorption of hydrogen in activated carbons. Electrochim. Acta 2006, 51, 2161–2167. [Google Scholar] [CrossRef]
- Alguail, A.A. Battery Type Hybrid Supercapacitor Based on Conducting Polymers. Ph. D. Thesis, Faculty of Technology and Metallurgy, University of Belgrade, Beograd, Serbia, 2018. Available online: http://uvidok.rcub.bg.ac.rs/bitstream/handle/123456789/2341/Doktorat.pdf?sequence=1 (accessed on 14 January 2020).
- Machida, K.; Suematsu, S.; Ishimoto, S.; Tamamitsu, K. High-Voltage Asymmetric Electrochemical Capacitor Based on Polyfluorene Nanocomposite and Activated Carbon. J. Electrochem. Soc. 2008, 155, A970. [Google Scholar] [CrossRef]
- Kötz, R.; Carlen, M. Principles and applications of electrochemical capacitors. Electrochim. Acta 2000, 45, 2483–2498. [Google Scholar] [CrossRef]
- Halper, M.S.; Ellenbogen, J.C. Supercapacitors: A Brief Overview; The MITRE Corporation: McLean, VA, USA, 2006; pp. 1–34. [Google Scholar]
- Inoue, H.; Morimoto, T.; Nohara, S. Electrochemical Characterization of a Hybrid Capacitor with Zn and Activated Carbon Electrodes. Electrochem. Solid-State Lett. 2007, 10, A261. [Google Scholar] [CrossRef]
- Kirubakaran, A.; Jain, S.; Nema, R.K. A review on fuel cell technologies and power electronic interface. Renew. Sustain. Energy Rev. 2009, 13, 2430–2440. [Google Scholar] [CrossRef]
- Boudghene Stambouli, A.; Traversa, E. Fuel cells, an alternative to standard sources of energy. Renew. Sustain. Energy Rev. 2002, 6, 295–304. [Google Scholar] [CrossRef]
- Peng, F.Z. Editorial Special Issue on Distributed Power Generation. IEEE Trans. Power Electron. 2004, 19, 1157–1158. [Google Scholar] [CrossRef]
- Meng, J. A distributed power generation communication system. In Proceedings of the CCECE 2003—Canadian Conference on Electrical and Computer Engineering. Toward a Caring and Humane Technology (Cat. No.03CH37436), Montreal, QC, Canada, 4–7 May 2003; Volume 1, pp. 483–486. [Google Scholar]
- Park, C.-M.; Kim, J.-H.; Kim, H.; Sohn, H.-J. Li-alloy based anode materials for Li secondary batteries. Chem. Soc. Rev. 2010, 39, 3115–3141. [Google Scholar] [CrossRef] [PubMed]
- Engineered Nanomaterials for Energy Applications. Handbook of Nanomaterials for Industrial Applications; Elsevier: Amsterdam, The Netherlands, 2018; pp. 751–767. ISBN 978-0-12-813351-4. [Google Scholar]
- Akhairi, M.A.F.; Kamarudin, S.K. Catalysts in direct ethanol fuel cell (DEFC): An overview. Int. J. Hydrogen Energy 2016, 41, 4214–4228. [Google Scholar] [CrossRef]
- Uhm, S.; Lee, J.K.; Chung, S.T.; Lee, J. Effect of anode diffusion media on direct formic acid fuel cells. J. Ind. Eng. Chem. 2008, 14, 493–498. [Google Scholar] [CrossRef]
- Cui, J.; Jing, B.; Xu, X.; Wang, L.; Cheng, F.; Li, S.; Wen, Z.; Ji, S.; Sun, J. Performance of niobium nitride-modified AISI316L stainless steel as bipolar plates for direct formic acid fuel cells. Int. J. Hydrogen Energy 2017, 42, 11830–11837. [Google Scholar] [CrossRef]
- Zhu, Y.; Ha, S.Y.; Masel, R.I. High power density direct formic acid fuel cells. J. Power Sources 2004, 130, 8–14. [Google Scholar] [CrossRef]
- Hong, P.; Liao, S.; Zeng, J.; Huang, X. Design, fabrication and performance evaluation of a miniature air breathing direct formic acid fuel cell based on printed circuit board technology. J. Power Sources 2010, 195, 7332–7337. [Google Scholar] [CrossRef]
- Rice, C.; Ha, S.; Masel, R.I.; Waszczuk, P.; Wieckowski, A.; Barnard, T. Direct formic acid fuel cells. J. Power Sources 2002, 111, 83–89. [Google Scholar] [CrossRef]
- Ha, S.; Larsen, R.; Masel, R.I. Performance characterization of Pd/C nanocatalyst for direct formic acid fuel cells. J. Power Sources 2005, 144, 28–34. [Google Scholar] [CrossRef]
- Aslam, N.M.; Masdar, M.S.; Kamarudin, S.K.; Daud, W.R.W. Overview on Direct Formic Acid Fuel Cells (DFAFCs) as an Energy Sources. APCBEE Procedia 2012, 3, 33–39. [Google Scholar] [CrossRef] [Green Version]
- Hong, P.; Zhong, Y.; Liao, S.; Zeng, J.; Lu, X.; Chen, W. A 4-cell miniature direct formic acid fuel cell stack with independent fuel reservoir: Design and performance investigation. J. Power Sources 2011, 196, 5913–5917. [Google Scholar] [CrossRef]
- Heidrich, E.S.; Curtis, T.P.; Dolfing, J. Determination of the Internal Chemical Energy of Wastewater. Environ. Sci. Technol. 2011, 45, 827–832. [Google Scholar] [CrossRef]
- Oguz Koroglu, E.; Civelek Yoruklu, H.; Demir, A.; Ozkaya, B. Scale-Up and Commercialization Issues of the MFCs. In Microbial Electrochemical Technology; Elsevier: Amsterdam, The Netherlands, 2019; pp. 565–583. ISBN 978-0-444-64052-9. [Google Scholar]
- Reis, A.; Mert, S.O. Performance assessment of a direct formic acid fuel cell system through exergy analysis. Int. J. Hydrogen Energy 2015, 40, 12776–12783. [Google Scholar] [CrossRef]
- Kamarudin, M.Z.F.; Kamarudin, S.K.; Masdar, M.S.; Daud, W.R.W. Review: Direct ethanol fuel cells. Int. J. Hydrogen Energy 2013, 38, 9438–9453. [Google Scholar] [CrossRef]
- Salameh, Z. Energy Storage. In Renewable Energy System Design; Elsevier: Amsterdam, The Netherlands, 2014; pp. 201–298. ISBN 978-0-12-374991-8. [Google Scholar]
- Farooque, M.; Maru, H.C. Fuel cells-the clean and efficient power generators. Proc. IEEE 2001, 89, 1819–1829. [Google Scholar] [CrossRef]
- Fuel Cell Handbook, 6th ed.; DIANE Publishing: Darby, PA, USA, 2000; ISBN 978-1-4289-1759-0.
- Benz, J.B.; Ortiz, B.; Roth, W.; Sauer, D.U.; Steinhüser, A. Fuel cells in photovoltaic hybrid systems for stand-alone power supplies. In 2nd European PV-Hybrid and Mini-Grid Conference; OTTI Energie Kolleg: Kassel, Germany, 2003; pp. 232–239. [Google Scholar]
- Sun, M.; Zhai, L.-F.; Li, W.-W.; Yu, H.-Q. Harvest and utilization of chemical energy in wastes by microbial fuel cells. Chem. Soc. Rev. 2016, 45, 2847–2870. [Google Scholar] [CrossRef] [PubMed]
- Hong, K.B.; Chang, S.; Gadd, G.M. Challenges in microbial fuel cell development and operation. Appl. Microbiol. Biotechnol. 2007, 76, 485. [Google Scholar]
- Heidrich, E.S.; Dolfing, J.; Scott, K.; Edwards, S.R.; Jones, C.; Curtis, T.P. Production of hydrogen from domestic wastewater in a pilot-scale microbial electrolysis cell. Appl. Microbiol. Biotechnol. 2013, 97, 6979–6989. [Google Scholar] [CrossRef]
- Khaled, F.; Ondel, O.; Allard, B. Optimal Energy Harvesting from Serially Connected Microbial Fuel Cells. IEEE Trans. Ind. Electron. 2015, 62, 3508–3515. [Google Scholar] [CrossRef]
- Kreysa, G.; Ota, K.; Savinell, R.F. (Eds.) Encyclopedia of Applied Electrochemistry; Springer: New York, NY, USA, 2014; ISBN 978-1-4419-6995-8. [Google Scholar]
- Tuller, H.L. Solar to fuels conversion technologies: A perspective. Mater. Renew. Sustain. Energy 2017, 6, 3. [Google Scholar] [CrossRef] [PubMed] [Green Version]
- Steinfeld, A.; Kuhn, P.; Reller, A.; Palumbo, R.; Murray, J.; Tamaura, Y. Solar-Processed Metals as Clean Energy Carriers and Water-Splitters. Int. J. Hydrogen Energy 1998, 23, 767–774. [Google Scholar] [CrossRef]
- Steinfeld, A. Solar hydrogen production via a two-step water-splitting thermochemical cycle based on Zn/ZnO redox reactions. Int. J. Hydrogen Energy 2002, 27, 611–619. [Google Scholar] [CrossRef]
- Steinfeld, A. Solar thermochemical production of hydrogen—A review. Sol. Energy 2005, 78, 603–615. [Google Scholar] [CrossRef]
- Steinfeld, A.; Palumbo, R. Solar Thermochemical Process Technology. In Encyclopedia of Physical Science and Technology; Elsevier: Amsterdam, The Netherlands, 2003; pp. 237–256. ISBN 978-0-12-227410-7. [Google Scholar]
- Solar Refinery Turns Light and Air into Liquid Fuel. Available online: https://www.goodnet.org/articles/solar-refinery-turns-light-air-into-liquid-fuel (accessed on 14 February 2020).
- Schunk, L.O.; Haeberling, P.; Wepf, S.; Wuillemin, D.; Meier, A.; Steinfeld, A. A Receiver-Reactor for the Solar Thermal Dissociation of Zinc Oxide. J. Sol. Energy Eng. 2008, 130, 021009. [Google Scholar] [CrossRef]
- Levy, M.; Levitan, R.; Rosin, H.; Rubin, R. Solar energy storage via a closed-loop chemical heat pipe. Sol. Energy 1993, 50, 179–189. [Google Scholar] [CrossRef]
- Luzzi, A. Endothermic Reactors for an Ammonia Based Thermo- Chemical Solar Energy Storage and Transport System. Sol. Energy 1996, 56, 361–371. [Google Scholar]
- Demirbas, A. Biofuels sources, biofuel policy, biofuel economy and global biofuel projections. Energy Convers. Manag. 2008, 49, 2106–2116. [Google Scholar] [CrossRef]
- Top five countries for biofuel production across the globe. NS Energy. 15 November 2019. Available online: https://www.nsenergybusiness.com/features/top-biofuel-production-countries/ (accessed on 14 January 2020).
- Global Bioenergy Statistics 2019; World Bioenergy Association: Stockholm, Sweden, 2019; Available online: https://worldbioenergy.org/uploads/191129%20WBA%20GBS%202019_LQ.pdf (accessed on 15 November 2019).
- Haller, M.Y.; Carbonell, D.; Dudita, M.; Zenhäusern, D.; Häberle, A. Seasonal energy storage in aluminium for 100 percent solar heat and electricity supply. Energy Convers. Manag. X 2020, 5, 100017. [Google Scholar] [CrossRef]
- Hybrid energy storage: Are combined solutions gaining ground? Energy Storage Forum. 12 March 2018. Available online: https://energystorageforum.com/news/energy-storage/hybrid-energy-storage-combined-solutions-gaining-ground (accessed on 4 February 2019).
- Bocklisch, T. Hybrid Energy Storage Systems for Renewable Energy Applications. Energy Procedia 2015, 73, 103–111. [Google Scholar] [CrossRef] [Green Version]
- Serpi, A.; Porru, M.; Damiano, A. A Novel Highly Integrated Hybrid Energy Storage System for Electric Propulsion and Smart Grid Applications, Advancements in Energy Storage Technologies, Xiangping Chen and Wenping Cao; IntechOpen: London, UK, 2 May 2018. [Google Scholar] [CrossRef] [Green Version]
- Etxeberria, A.; Vechiu, I.; Camblong, H.; Vinassa, J.M.; Camblong, H. Hybrid Energy Storage Systems for renewable Energy Sources Integration in microgrids: A review. In Proceedings of the 2010 Conference Proceedings IPEC, Singapore, 27–29 October 2010; pp. 532–537. [Google Scholar]
- Castillo, A.; Gayme, D.F. Grid-scale energy storage applications in renewable energy integration: A survey. Energy Convers. Manag. 2014, 87, 885–894. [Google Scholar] [CrossRef]
- Global Energy Storage Markets will Grow 13-Fold from 2018 to 2024 to Reach 158 Gigawatt-Hours and $71 Billion in Investment, Wood Mackenzie Power & Renewables Reports | Greentech Media. Available online: https://www.greentechmedia.com/articles/read/global-energy-storage-to-hit-158-gigawatt-hours-by-2024-with-u-s-and-china/ (accessed on 6 February 2020).
- Energy Storage Exchange. Available online: https://energystorageexchange.org/projects (accessed on 14 February 2020).
- Daud, M.Z.; Mohamed, A.; Hannan, M.A. A review of the integration of Energy Storage Systems (ESS) for utility grid support. Przegląd Elektrotechniczny 2012, 88, 185–191. [Google Scholar]
- Michael, N.; Chiruvolu, M.; Daniel, C. Available compressed air energy storage (CAES) plant concepts. Energy 2010, 4100, 81. [Google Scholar]
- Arseneaux, J. 20 MW Flywheel Energy Storage Plant; Beacon Power: New York, NY, USA, 2014. [Google Scholar]
- IEA. Technology Roadmap—Energy Storage. IEA: Paris, France, 2014. Available online: https://www.iea.org/reports/technology-roadmap-energy-storage (accessed on 5 February 2020).
- Zhuang, X.; Huang, R.; Liang, C.; Rabczuk, T. A Coupled Thermo-Hydro-Mechanical Model of Jointed Hard Rock for Compressed Air Energy Storage. Math. Probl. Eng. 2014, 2014, 179169. [Google Scholar] [CrossRef]
- Sodium Sulfur Battery in Abu Dhabi Is World’s Largest Storage Device | CleanTechnica. Available online: https://cleantechnica.com/2019/02/03/sodium-sulfur-battery-in-abu-dhabi-is-worlds-largest-storage-device/ (accessed on 14 February 2020).
- IRENA. Innovation landscape brief: Utility-scale batteries. International Renewable Energy Agency: Abu Dhabi, 2019. Available online: https://www.irena.org/-/media/Files/IRENA/Agency/Publication/2019/Sep/IRENA_Utility-scale-batteries_2019.pdf (accessed on 5 February 2020).
- EA: Home. Available online: https://www.ea.tuwien.ac.at/home/ (accessed on 19 February 2020).
- Hydrostor. Available online: https://www.hydrostor.ca/ (accessed on 14 February 2020).
- Hyundai Building 150 MW Energy Storage Battery in South Korea. Available online: http://www.digitaljournal.com/business/hyundai-building-150-mw-energy-storage-battery-in-south-korea/article/509427 (accessed on 14 February 2020).
- Hyundai Building the Latest “World’s Largest Battery System” with 150 MW System in South Korea | CleanTechnica. Available online: https://cleantechnica.com/2018/12/04/hyundai-building-the-latest-worlds-largest-battery-system-with-150-mw-system-in-korea/ (accessed on 14 February 2020).
- Kokam Kokam’s 56 Megawatt Energy Storage Project Features World’s Largest Lithium NMC Energy Storage System for Frequency Regulation. Available online: https://www.prnewswire.com/news-releases/kokams-56-megawatt-energy-storage-project-features-worlds-largest-lithium-nmc-energy-storage-system-for-frequency-regulation-300229219.html (accessed on 14 February 2020).
- ESS (Energy Storage System)—Reference | Samsung SDI Available online:. Available online: https://www.samsungsdi.com/ess/energy-storage-system-reference.html (accessed on 14 February 2020).
- Baumgarte, F.; Glenk, G.; Rieger, A. Business Models and Profitability of Energy Storage. SSRN Electron. J. 2019. [Google Scholar] [CrossRef]
- Electrical Energy Storage: White Paper; Technical Report 2011; International Electrotechnical Commission (IEC): Geneva, Switzerland, 2011.
- Japan Looks at Recycling Vehicle Batteries for Renewable Power | OilPrice.com. Available online: https://oilprice.com/Alternative-Energy/Renewable-Energy/Japan-Looks-at-Recycling-Vehicle-Batteries-for-Renewable-Power.html (accessed on 14 March 2020).
- Abbey, C.; Joos, G. Supercapacitor Energy Storage for Wind Energy Applications. IEEE Trans. Ind. Appl. 2007, 43, 769–776. [Google Scholar] [CrossRef]
- Seo, H.R.; Kim, A.R.; Park, M.; Yu, I.K. Power quality enhancement of renewable energy source power network using SMES system. Phys. C Supercond. Its Appl. 2011, 471, 1409–1412. [Google Scholar] [CrossRef]
- Shigematsu, T.; Kumamoto, T.; Deguchi, H.; Hara, T. Applications of a vanadium redox-flow battery to maintain power quality. In Proceedings of the IEEE/PES Transmission and Distribution Conference and Exhibition, Yokohama, Japan, 6–10 October 2002; Volume 2, pp. 1065–1070. [Google Scholar]
- Katsuhiro, O.; Kawai, J.; Otsuka, S.; Wada, T.; Imano, H. Development of pump-turbine for seawater pumped storage power plant. In Waterpower’99: Hydro’s Future: Technology, Markets, and Policy; American Society of Civil Engineers: Las Vegas, NV, USA, 1999; pp. 1–6. [Google Scholar]
- Samir, S.; Williams, R.H. Compressed air energy storage: Theory, resources, and applications for wind power. Princeton Environ. Inst. Report 2008, 8, 81. [Google Scholar]
- Díaz-González, F.; Sumper, A.; Gomis-Bellmunt, O.; Bianchi, F.D. Energy management of flywheel-based energy storage device for wind power smoothing. Appl. Energy 2013, 110, 207–219. [Google Scholar] [CrossRef]
- Nakken, T.; Strand, L.R.; Frantzen, E.; Rohden, R.; Eide, P.O. The Utsira wind-hydrogen system–operational experience. In Proceedings of the European Wind Energy Conference, Athens, Greece, 27 February–2 March 2006; pp. 1–9. [Google Scholar]
- Hamajima, T.; Amata, H.; Iwasaki, T.; Atomura, N.; Tsuda, M.; Miyagi, D.; Shintomi, T.; Makida, Y.; Takao, T.; Munakata, K.; et al. Application of SMES and Fuel Cell System Combined with Liquid Hydrogen Vehicle Station to Renewable Energy Control. IEEE Trans. Appl. Supercond. 2012, 22, 5701704-5701704. [Google Scholar] [CrossRef]
- Barin, A.; Neves Canha, L.; Magnago, K.; da Rosa Abaide, A. Fuzzy Multi-Sets and Multi-Rules: Analysis of Hybrid Systems Concerning Renewable Sources with Conventional and Flow Batteries. In Proceedings of the 2009 15th International Conference on Intelligent System Applications to Power Systems, Curitiba, Brazil, 8–12 November 2009; pp. 1–6. [Google Scholar]
- Yekini Suberu, M.; Wazir Mustafa, M.; Bashir, N. Energy storage systems for renewable energy power sector integration and mitigation of intermittency. Renew. Sustain. Energy Rev. 2014, 35, 499–514. [Google Scholar] [CrossRef]
- Díaz-González, F.; Sumper, A.; Gomis-Bellmunt, O.; Villafáfila-Robles, R. A review of energy storage technologies for wind power applications. Renew. Sustain. Energy Rev. 2012, 16, 2154–2171. [Google Scholar] [CrossRef]
- Madlener, R.; Latz, J. Economics of centralized and decentralized compressed air energy storage for enhanced grid integration of wind power. Appl. Energy 2013, 101, 299–309. [Google Scholar] [CrossRef]
- Texas Mega-Battery Aims to Green up the Grid | New Scientist. Available online: https://www.newscientist.com/article/mg21729026-000-texas-mega-battery-aims-to-green-up-the-grid/ (accessed on 14 March 2020).
- Ribeiro, E.; Cardoso, A.J.M.; Boccaletti, C. Fuel cell-supercapacitor system for telecommunications. In Proceedings of the 5th IET International Conference on Power Electronics, Machines and Drives (PEMD 2010), Brighton, UK, 19–21 April 2010; p. 8. [Google Scholar]
- Kyriakopoulos, A.; O’Sullivan, D.; Hayes, J.G.; Griffiths, J.; Egan, M.G. Kinetic Energy Storage for High Reliability Power Supply Back-up. In Proceedings of the APEC 07—Twenty-Second Annual IEEE Applied Power Electronics Conference and Exposition, Brighton, UK, 19–21 April 2007; pp. 1158–1163. [Google Scholar]
- Schoenung, S.M. Characteristics and Technologies for Long- vs. Short-Term Energy Storage: A Study by the DOE Energy Storage Systems Program; Sandia National Labs: Albuquerque, NM, USA; Livermore, CA, USA, 2001. [Google Scholar]
- Horner, R.E.; Proud, N.J. The key factors in the design and construction of advanced flywheel energy storage systems and their application to improve telecommunication power back-up. In Proceedings of the Intelec’96—International Telecommunications Energy Conference, Boston, MA, USA, 6–10 October 1996; pp. 668–675. [Google Scholar]
- Krishnan, K.J.; Kalam, A.; Zayegh, A. H2 optimisation and fuel cell as a back-up power for telecommunication sites. In Proceedings of the 2013 International Conference on Circuits, Power and Computing Technologies (ICCPCT), Nagercoil, India, 20–21 March 2013; pp. 1274–1277. [Google Scholar]
- Li, S.; Tomsovic, K.; Hiyama, T. Load following functions using distributed energy resources. In Proceedings of the 2000 Power Engineering Society Summer Meeting (Cat. No.00CH37134), Seattle, WA, USA, 16–20 July 2000; Volume 3, pp. 1756–1761. [Google Scholar]
- Hida, Y.; Yokoyama, R.; Shimizukawa, J.; Iba, K.; Tanaka, K.; Seki, T. Load following operation of NAS battery by setting statistic margins to avoid risks. In Proceedings of the IEEE PES General Meeting, Minneapolis, MN, USA, 25–29 July 2010; pp. 1–5. [Google Scholar]
- Nyamdash, B.; Denny, E.; O’Malley, M. The viability of balancing wind generation with large scale energy storage. Energy Policy 2010, 38, 7200–7208. [Google Scholar] [CrossRef]
- Rudolf, V.; Papastergiou, K.D. Financial analysis of utility scale photovoltaic plants with battery energy storage. Energy Policy 2013, 63, 139–146. [Google Scholar] [CrossRef]
- Purvins, A.; Sumner, M. Optimal management of stationary lithium-ion battery system in electricity distribution grids. J. Power Sources 2013, 242, 742–755. [Google Scholar] [CrossRef]
- Lobato, E.; Sigrist, L.; Rouco, L. Use of energy storage systems for peak shaving in the Spanish Canary Islands. In Proceedings of the 2013 IEEE Power Energy Society General Meeting, Vancouver, BC, Canada; 21–25 2013; pp. 1–5. [Google Scholar]
- Oudalov, A.; Cherkaoui, R.; Beguin, A. Sizing and Optimal Operation of Battery Energy Storage System for Peak Shaving Application. In Proceedings of the 2007 IEEE Lausanne Power Tech, Lausanne, Switzerland, 1–5 July 2007; pp. 621–625. [Google Scholar]
- Large Energy Storage Systems Handbook (The CRC Press Series in Mechanical and Aerospace Engineering)—PDF Free Download. Available online: https://epdf.pub/large-energy-storage-systems-handbook-the-crc-press-series-in-mechanical-and-aer.html (accessed on 15 March 2020).
- Gleason, W. Fuel Cell Technician’s Guide; Cengage Learning: Boston, MA, USA, 2012; ISBN 978-1-285-41499-7. [Google Scholar]
- Kerestes, R.J.; Reed, G.F.; Sparacino, A.R. Economic analysis of grid level energy storage for the application of load leveling. In Proceedings of the 2012 IEEE Power and Energy Society General Meeting, San Diego, CA, USA, 22–26 July 2012; pp. 1–9. [Google Scholar]
- Kloess, M.; Zach, K. Bulk electricity storage technologies for load-leveling operation—An economic assessment for the Austrian and German power market. Int. J. Electr. Power Energy Syst. 2014, 59, 111–122. [Google Scholar] [CrossRef]
- Converse, A.O. Seasonal Energy Storage in a Renewable Energy System. Proc. IEEE 2012, 100, 401–409. [Google Scholar] [CrossRef]
- Wang, W.; Ge, B.; Bi, D.; Qin, M.; Liu, W. Energy storage based LVRT and stabilizing power control for direct-drive wind power system. In Proceedings of the 2010 International Conference on Power System Technology, Hangzhou, China, 24–28 October 2010; pp. 1–6. [Google Scholar]
- Rogers, J.D.; Schermer, R.I.; Miller, B.L.; Hauer, J.F. 30-MJ superconducting magnetic energy storage system for electric utility transmission stabilization. Proc. IEEE 1983, 71, 1099–1107. [Google Scholar] [CrossRef]
- Irie, F.; Takeo, M.; Sato, S.; Katahira, O.; Fukui, F.; Okada, H.; Ezaki, T.; Ogawa, K.; Koba, H.; Takamatsu, M.; et al. A field experiment on power line stabilization by a SMES system. IEEE Trans. Magn. 1992, 28, 426–429. [Google Scholar] [CrossRef]
- Zhao, H.; Wu, Q.; Hu, S.; Xu, H.; Rasmussen, C.N. Review of energy storage system for wind power integration support. Appl. Energy 2015, 137, 545–553. [Google Scholar] [CrossRef]
- Celli, G.; Pilo, F.; Soma, G.G.; Dal Canto, D.; Pasca, E.; Quadrelli, A. Benefit assessment of energy storage for distribution network voltage regulation. In Proceedings of the CIRED 2012 Workshop: Integration of Renewables into the Distribution Grid, Lisbon, Portugal, 29–30 May 2012; pp. 1–4. [Google Scholar]
- Wheeler, N. Voltage regulation application of a kinetic energy storage system. In Proceedings of the Second International Conference on Power Electronics, Machines and Drives (PEMD 2004), Edinburgh, UK, 31 March–2 April 2004; Volume 2, pp. 605–608. [Google Scholar]
- Quesada, J.; Sebastián, R.; Castro, M.; Sainz, J.A. Control of inverters in a low voltage microgrid with distributed battery energy storage. Part I: Primary control. Electr. Power Syst. Res. 2014, 114, 126–135. [Google Scholar] [CrossRef]
- Zhu, J.; Qiu, M.; Wei, B.; Zhang, H.; Lai, X.; Yuan, W. Design, dynamic simulation and construction of a hybrid HTS SMES (high-temperature superconducting magnetic energy storage systems) for Chinese power grid. Energy 2013, 51, 184–192. [Google Scholar] [CrossRef] [Green Version]
- Ni, B.; Sourkounis, C. Control strategies for energy storage to smooth power fluctuations of wind parks. In Proceedings of the Melecon 2010—2010 15th IEEE Mediterranean Electrotechnical Conference, Valletta, Malta, 26–28 April 2010; pp. 973–978. [Google Scholar]
- Voice, E. Energy Storage: Added Stability for Electrical Grids. Available online: https://www.politico.eu/article/energy-storage-added-stability-for-electrical-grids/ (accessed on 16 March 2020).
- Kazempour, S.J.; Hosseinpour, M.; Moghaddam, M.P. Self-scheduling of a joint hydro and pumped-storage plants in energy, spinning reserve and regulation markets. In Proceedings of the 2009 IEEE Power Energy Society General Meeting, Calgary, AB, Canada, 26–30 July 2009; pp. 1–8. [Google Scholar]
- Dursun, B.; Alboyaci, B. The contribution of wind-hydro pumped storage systems in meeting Turkey’s electric energy demand. Renew. Sustain. Energy Rev. 2010, 14, 1979–1988. [Google Scholar] [CrossRef]
- Welcome Dailyenergyreport.com—BlueHost.com. Available online: http://www.dailyenergyreport.com/ business-case-3-for-advanced-energy-storagespinning-reserve/ (accessed on 16 March 2020).
- Habibi, M.S. Model for impact of storage on spinning reserve requirements and distributed generation. In Proceedings of the 33rd Southeastern Symposium on System Theory (Cat. No.01EX460), Athens, OH, USA, 20 March 2001; pp. 161–165. [Google Scholar]
- Torreglosa, J.P.; García, P.; Fernández, L.M.; Jurado, F. Predictive Control for the Energy Management of a Fuel-Cell–Battery–Supercapacitor Tramway. IEEE Trans. Ind. Inform. 2014, 10, 276–285. [Google Scholar] [CrossRef]
- Thounthong, P.; Chunkag, V.; Sethakul, P.; Davat, B.; Hinaje, M. Comparative Study of Fuel-Cell Vehicle Hybridization with Battery or Supercapacitor Storage Device. IEEE Trans. Veh. Technol. 2009, 58, 3892–3904. [Google Scholar] [CrossRef]
- Steiner, M.; Klohr, M.; Pagiela, S. Energy storage system with ultracaps on board of railway vehicles. In Proceedings of the 2007 European Conference on Power Electronics and Applications, Aalborg, Denmark, 2–5 September 2007; pp. 1–10. [Google Scholar]
- Lukic, S.M.; Cao, J.; Bansal, R.C.; Rodriguez, F.; Emadi, A. Energy Storage Systems for Automotive Applications. IEEE Trans. Ind. Electron. 2008, 55, 2258–2267. [Google Scholar] [CrossRef]
- The Future Role for Energy Storage in the UK Main Report 2011; ERP Technology Report; The Energy Research Partnership (ERP: Birmingham, UK, June 2011; Available online: https://erpuk.org/wp-content/uploads/2014/10/52990-ERP-Energy-Storage-Report-v3.pdf (accessed on 5 February 2020).
- Hadjipaschalis, I.; Poullikkas, A.; Efthimiou, V. Overview of current and future energy storage technologies for electric power applications. Renew. Sustain. Energy Rev. 2009, 13, 1513–1522. [Google Scholar] [CrossRef]
- Zhou, L.; Qi, Z.P. Modeling and control of a flywheel energy storage system for uninterruptible power supply. In Proceedings of the 2009 International Conference on Sustainable Power Generation and Supply, Nanjing, China, 6–7 April 2009; pp. 1–6. [Google Scholar]
- Racine, M.S.; Parham, J.D.; Rashid, M.H. An overview of uninterruptible power supplies. In Proceedings of the 37th Annual North American Power Symposium, Ames, IA, USA, 25 October 2005; pp. 159–164. [Google Scholar]
- Lahyani, A.; Venet, P.; Guermazi, A.; Troudi, A. Battery/Supercapacitors Combination in Uninterruptible Power Supply (UPS). IEEE Trans. Power Electron. 2013, 28, 1509–1522. [Google Scholar] [CrossRef]
- Eyer, J.M.; Butler, P.C.; Iannucci, J.J., Jr. Estimating Electricity Storage Power Rating and Discharge Duration for Utility Transmission and Distribution Deferral: A Study for the DOE Energy Storage Program; No. SAND2005-7069; Sandia National Laboratories: USA, 2005. Available online: https://prod-ng.sandia.gov/techlib-noauth/access-control.cgi/2005/057069.pdf (accessed on 5 February 2020).
- Heymans, C.; Walker, S.B.; Young, S.B.; Fowler, M. Economic analysis of second use electric vehicle batteries for residential energy storage and load-levelling. Energy Policy 2014, 71, 22–30. [Google Scholar] [CrossRef]
- The Future Value of Storage in the UK with Generator Intermittency. 2004. Available online: https://webarchive.nationalarchives.gov.uk/20100919182205/http://www.ensg.gov.uk/assets/dgdti00040.pdf (accessed on 14 March 2020).
- Black, M.; Strbac, G. Value of Bulk Energy Storage for Managing Wind Power Fluctuations. IEEE Trans. Energy Convers. 2007, 22, 197–205. [Google Scholar] [CrossRef]
- Winfield, M.; Shokrzadeh, S.; Jones, A. Energy policy regime change and advanced energy storage: A comparative analysis. Energy Policy 2018, 115, 572–583. [Google Scholar] [CrossRef]
- Massa, L.; Tucci, C.L.; Afuah, A. A Critical Assessment of Business Model Research. Acad. Manag. Ann. 2017, 11, 73–104. [Google Scholar] [CrossRef]
- Zucker, A.; Hinchliffe, T.; Spisto, A. Assessing Storage Value in Electricity Markets: A Literature Review; Publications Office of the European Union, 2013. Available online: https://op.europa.eu:443/en/publication-detail/-/publication/03a334eb-5ab2-4b07-9d06-edf88cb83fc4/language-en (accessed on 5 March 2020).
- Richter, M. Business model innovation for sustainable energy: German utilities and renewable energy. Energy Policy 2013, 62, 1226–1237. [Google Scholar] [CrossRef] [Green Version]
- Akhil, A.A.; Huff, G.; Currier, A.B.; Kaun, B.C.; Rastler, D.M.; Chen, S.B.; Cotter, A.L.; Bradshaw, D.T.; Gauntlett, W.D. DOE/EPRI 2013 Electricity Storage Handbook in Collaboration with NRECA; Sandia National Laboratories: Albuquerque, NM, USA, 2013. [Google Scholar]
- US EPA. Electricity Storage. Available online: https://www.epa.gov/energy/electricity-storage (accessed on 9 February 2020).
- Five Benefits of Energy Storage: The Holy Grail of Energy. Available online: https://www.facilitiesnet.com/energyefficiency/article/Five-Benefits-of-Energy-Storage-The-Holy-Grail-of-Energy--16907 (accessed on 9 February 2020).
- FERC Issues Order No. 755: Frequency Regulation Compensation in the Organized Wholesale Power Markets | Insights | Jones Day. Available online: https://www.jonesday.com/en/insights/2011/10/ferc-issues-order-no-755-frequency-regulation-compensation-in-the-organized-wholesale-power-markets (accessed on 15 February 2020).
- Electricity Regulation in the USA—Lexology. Available online: https://www.lexology.com/library/detail.aspx?g=6decf3ec-4cf8-4930-8a8a-d1a69ac8ba18 (accessed on 15 February 2020).
- FERC: Industries—Order No. 784. Available online: https://www.ferc.gov/industries/electric/gen-info/mbr/important-orders/OrderNo784.asp (accessed on 15 February 2020).
- FERC Rules on Order No. 841 Compliance Filings | Stoel Rives—Renewable + Law—JDSupra. Available online: https://www.jdsupra.com/legalnews/ferc-rules-on-order-no-841-compliance-30198/ (accessed on 15 February 2020).
- Ranchod, S.M. California Enacts Landmark Energy Storage Law; Paul Hashtings Stay Current: San Francisco, CA, USA, November 2010; Available online: https://www.paulhastings.com/docs/default-source/PDFs/1753.pdf (accessed on 5 February 2020).
- Fact Sheet: Energy Storage (2019) | White Papers | EESI. Available online: https://www.eesi.org/papers/view/energy-storage-2019#4 (accessed on 15 February 2020).
- New York’s Energy Storage Incentive Could Spur Deployment of 1.8GWh | Greentech Media. Available online: https://www.greentechmedia.com/articles/read/new-yorks-new-energy-storage-incentive-could-spur-deployment-of-1-8-gw/ (accessed on 15 February 2020).
- Massachusetts Passes “Minibus” Clean Energy Bill | Law and the Environment. Available online: https://www.lawandenvironment.com/2018/08/01/massachusetts-passes-minibus-clean-energy-bill/ (accessed on 15 February 2020).
- Massachusetts H 4857—Increases State Clean Energy Requirements—Massachusetts Key Vote—The Voter’s Self Defense System—Vote Smart. Available online: https://votesmart.org/bill/25271/64321 #.XkgC4SgzbIV (accessed on 15 February 2020).
- Oregon Utility Regulators Issue Guidelines, Requirements for Energy Storage | American Public Power Association. Available online: https://www.publicpower.org/periodical/article/oregon-utility-regulators-issue-guidelines-requirements-energy-storage/ (accessed on 15 February 2020).
- Oregon Enacts Energy Storage Legislation | Stay Informed | K&L Gates. Available online: http://www.klgates.com/oregon-enacts-energy-storage-legislation-06-24-2015/ (accessed on 15 February 2020).
- Enrolled House Bill 2193 (HB 2193-B). 78th OREGON LEGISLATIVE ASSEMBLY—2015 Regular Session. 2015. Available online: https://olis.leg.state.or.us/liz/2015R1/Downloads/MeasureDocument/HB2193 (accessed on 15 February 2020).
- HRS. Available online: https://www.capitol.hawaii.gov/hrscurrent/Vol05_Ch0261-0319/HRS0269/HRS_0269-0096.htm (accessed on 15 February 2020).
- Hawaii Utilities Seek More Renewables, Storage and Now Grid Services too—pv Magazine International. Available online: https://www.pv-magazine.com/2019/04/11/hawaii-utilities-seek-more-renewables-storage-and-now-grid-services-too/ (accessed on 15 February 2020).
- Hawaiian Electric Targets Nearly 1.4 GWh Storage, 135 MW Solar Equivalent in Latest Solicitation | Utility Dive. Available online: https://www.utilitydive.com/news/hawaiian-electric-targets-nearly-14-gwh-storage-135-mw-solar-equivalent-i/552490/ (accessed on 15 February 2020).
- New Jersey Passes wide-Ranging Energy Legislation on Solar, Batteries and Nuclear Power—pv Magazine USA. Available online: https://pv-magazine-usa.com/2018/04/13/new-jersey-passes-wide-ranging-energy-legislation-on-solar-batteries-and-nuclear-power/ (accessed on 15 February 2020).
- New Jersey Lawmakers Pass Clean Energy Bills to Spur State’s Renewable Economy | SEIA. Available online: https://www.seia.org/news/new-jersey-lawmakers-pass-clean-energy-bills-spur-states-renewable-economy (accessed on 15 February 2020).
- Maryland Passes Energy Storage Pilot Program to Determine Future Regulatory Framework | Utility Dive. Available online: https://www.utilitydive.com/news/maryland-passes-energy-storage-pilot-program-to-determine-future-regulatory/551769/ (accessed on 15 February 2020).
- Directive (EU) 2019/944 of the European Parliament and of the Council of 5 June 2019 on Common Rules for the Internal Market for Electricity and Amending Directive 2012/27/EU (recast) (Text with EEA Relevance). Available online: http://www.legislation.gov.uk/eudr/2019/944/introduction (accessed on 15 February 2020).
- Regulatory Progress for Energy Storage in Europe | Global Law Firm | Norton Rose Fulbright. Available online: https://www.nortonrosefulbright.com/en/knowledge/publications/8b5285f4/regulatory-progress-for-energy-storage-in-europe (accessed on 15 February 2020).
- Energy Storage in Germany—What You Should Know | Global Law Firm | Norton Rose Fulbright. Available online: https://www.nortonrosefulbright.com/en/knowledge/publications/1d322179/energy-storage-in-germany---what-you-should-know (accessed on 15 February 2020).
- Renewable Energy Sources Act (EEG 2017). 2016. Available online: https://www.bmwi.de/Redaktion/DE/Downloads/E/eeg-2017-gesetz-en.pdf?__blob=publicationFile&v=8 (accessed on 5 February 2020).
- Dhruv, B.; Currier, A.; Hernandez, J.; Ma, O.; Kirby, B. Market and Policy Barriers to Energy Storage Deployment; No. SAND-2013-7606; Sandia National Lab.(SNL-NM): Albuquerque, NM, USA, 2013. [Google Scholar]
- Patel, S. IEA World Energy Outlook: Solar Capacity Surges Past Coal and Gas by 2040. POWER Magazine. 14 November 2019. Available online: https://www.powermag.com/iea-world-energy-outlook-solar-capacity-surges-past-coal-and-gas-by-2040/ (accessed on 12 February 2020).
- Bloomberg NEF. 31 July 2019. Available online: https://about.bnef.com/blog/energy-storage-investments-boom-battery-costs-halve-next-decade/ (accessed on 12 February 2020).


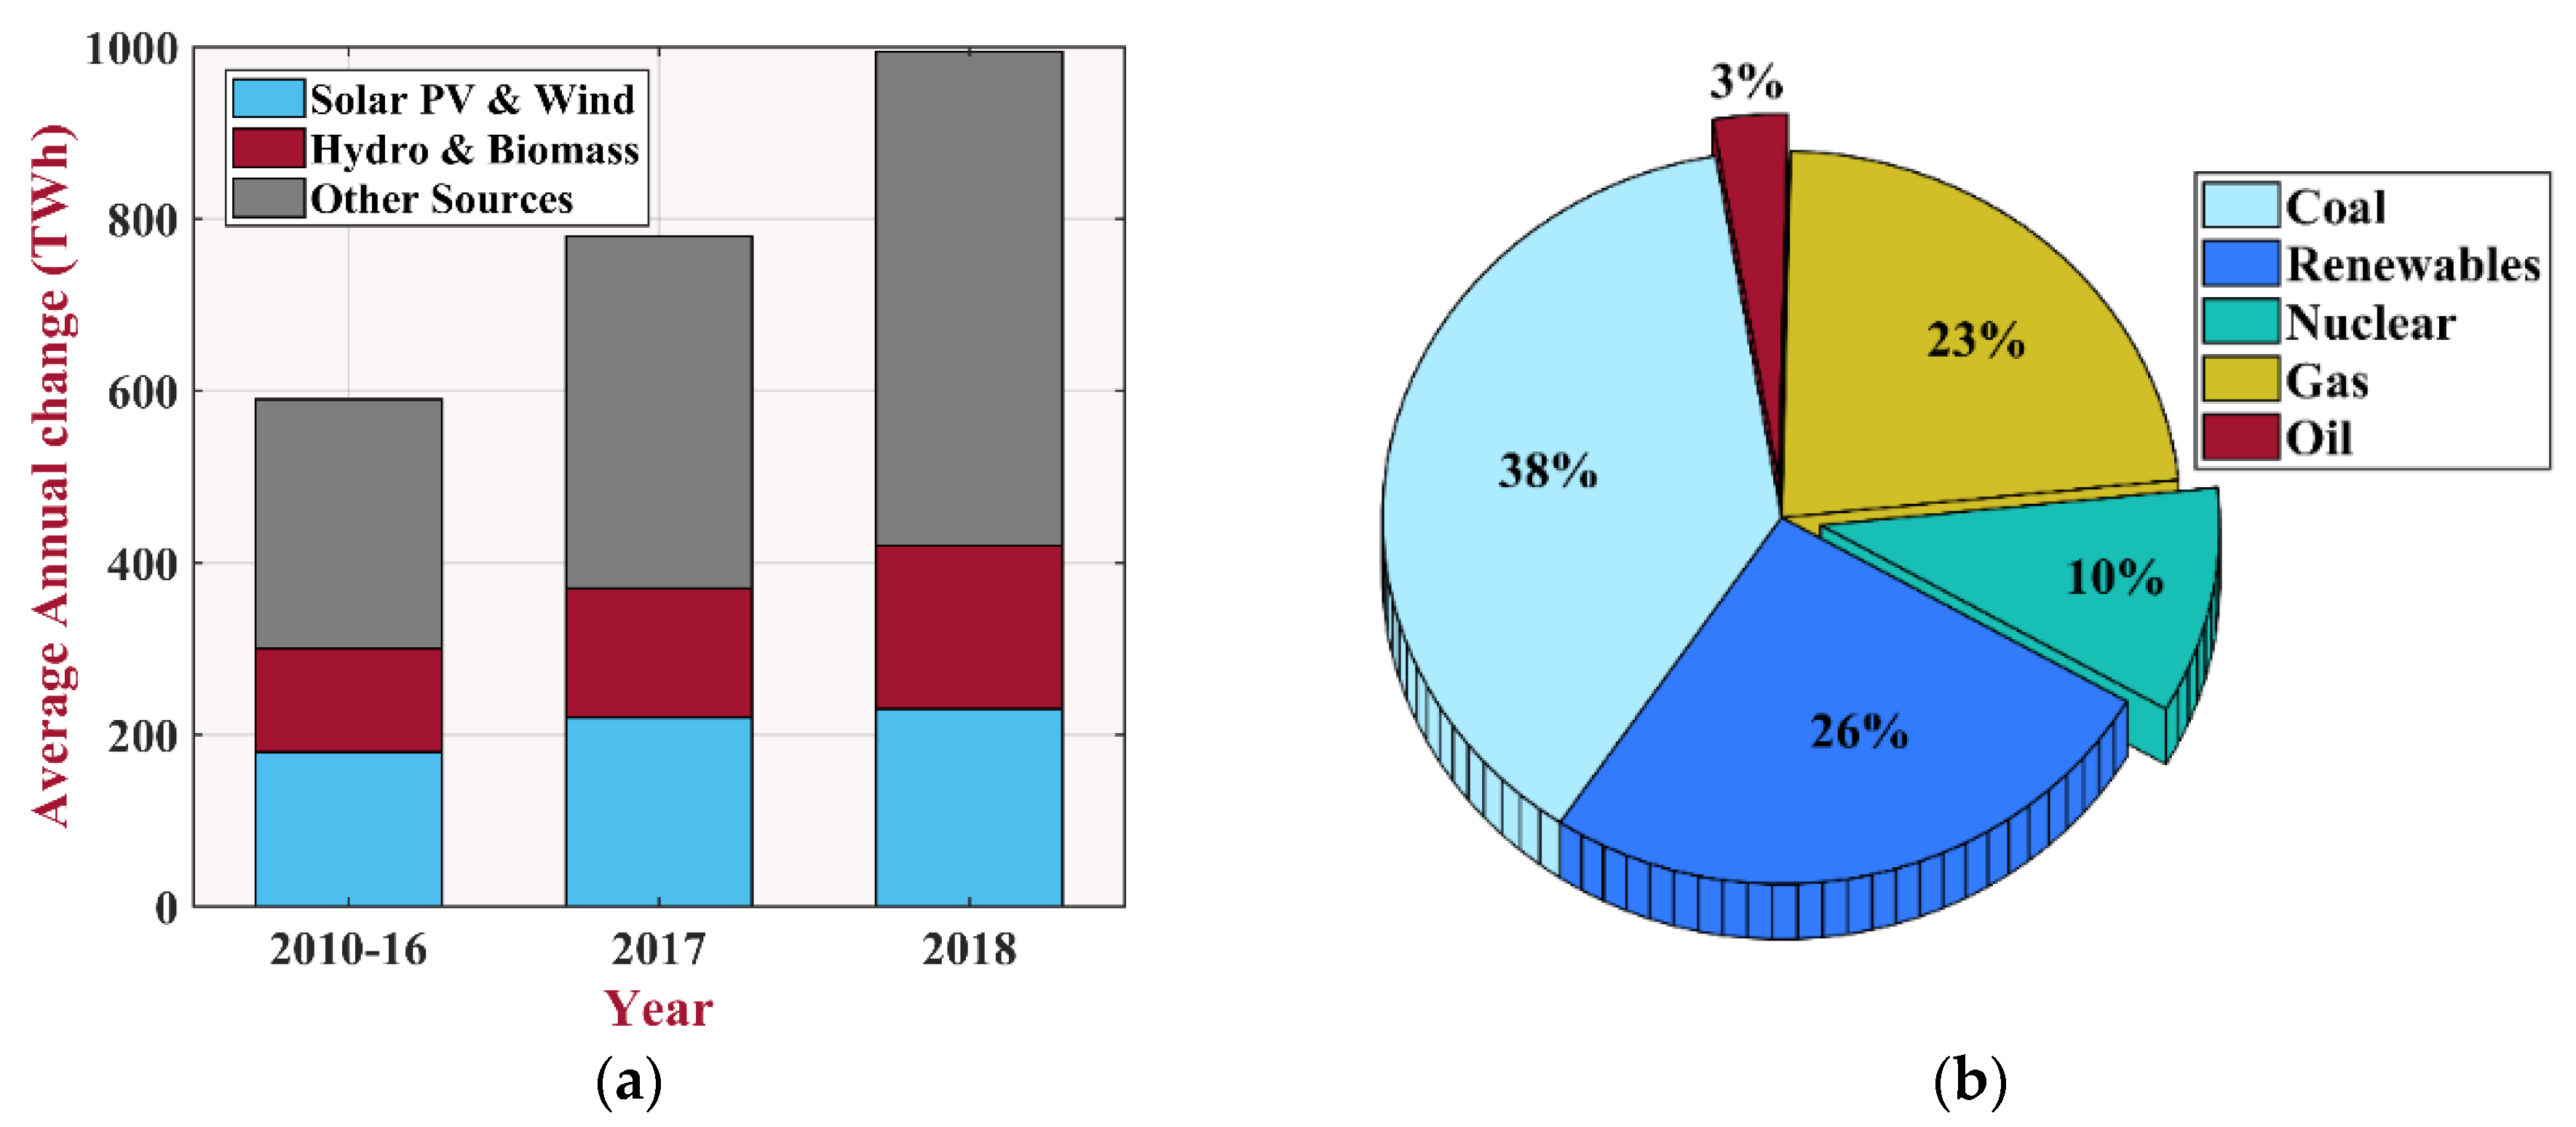
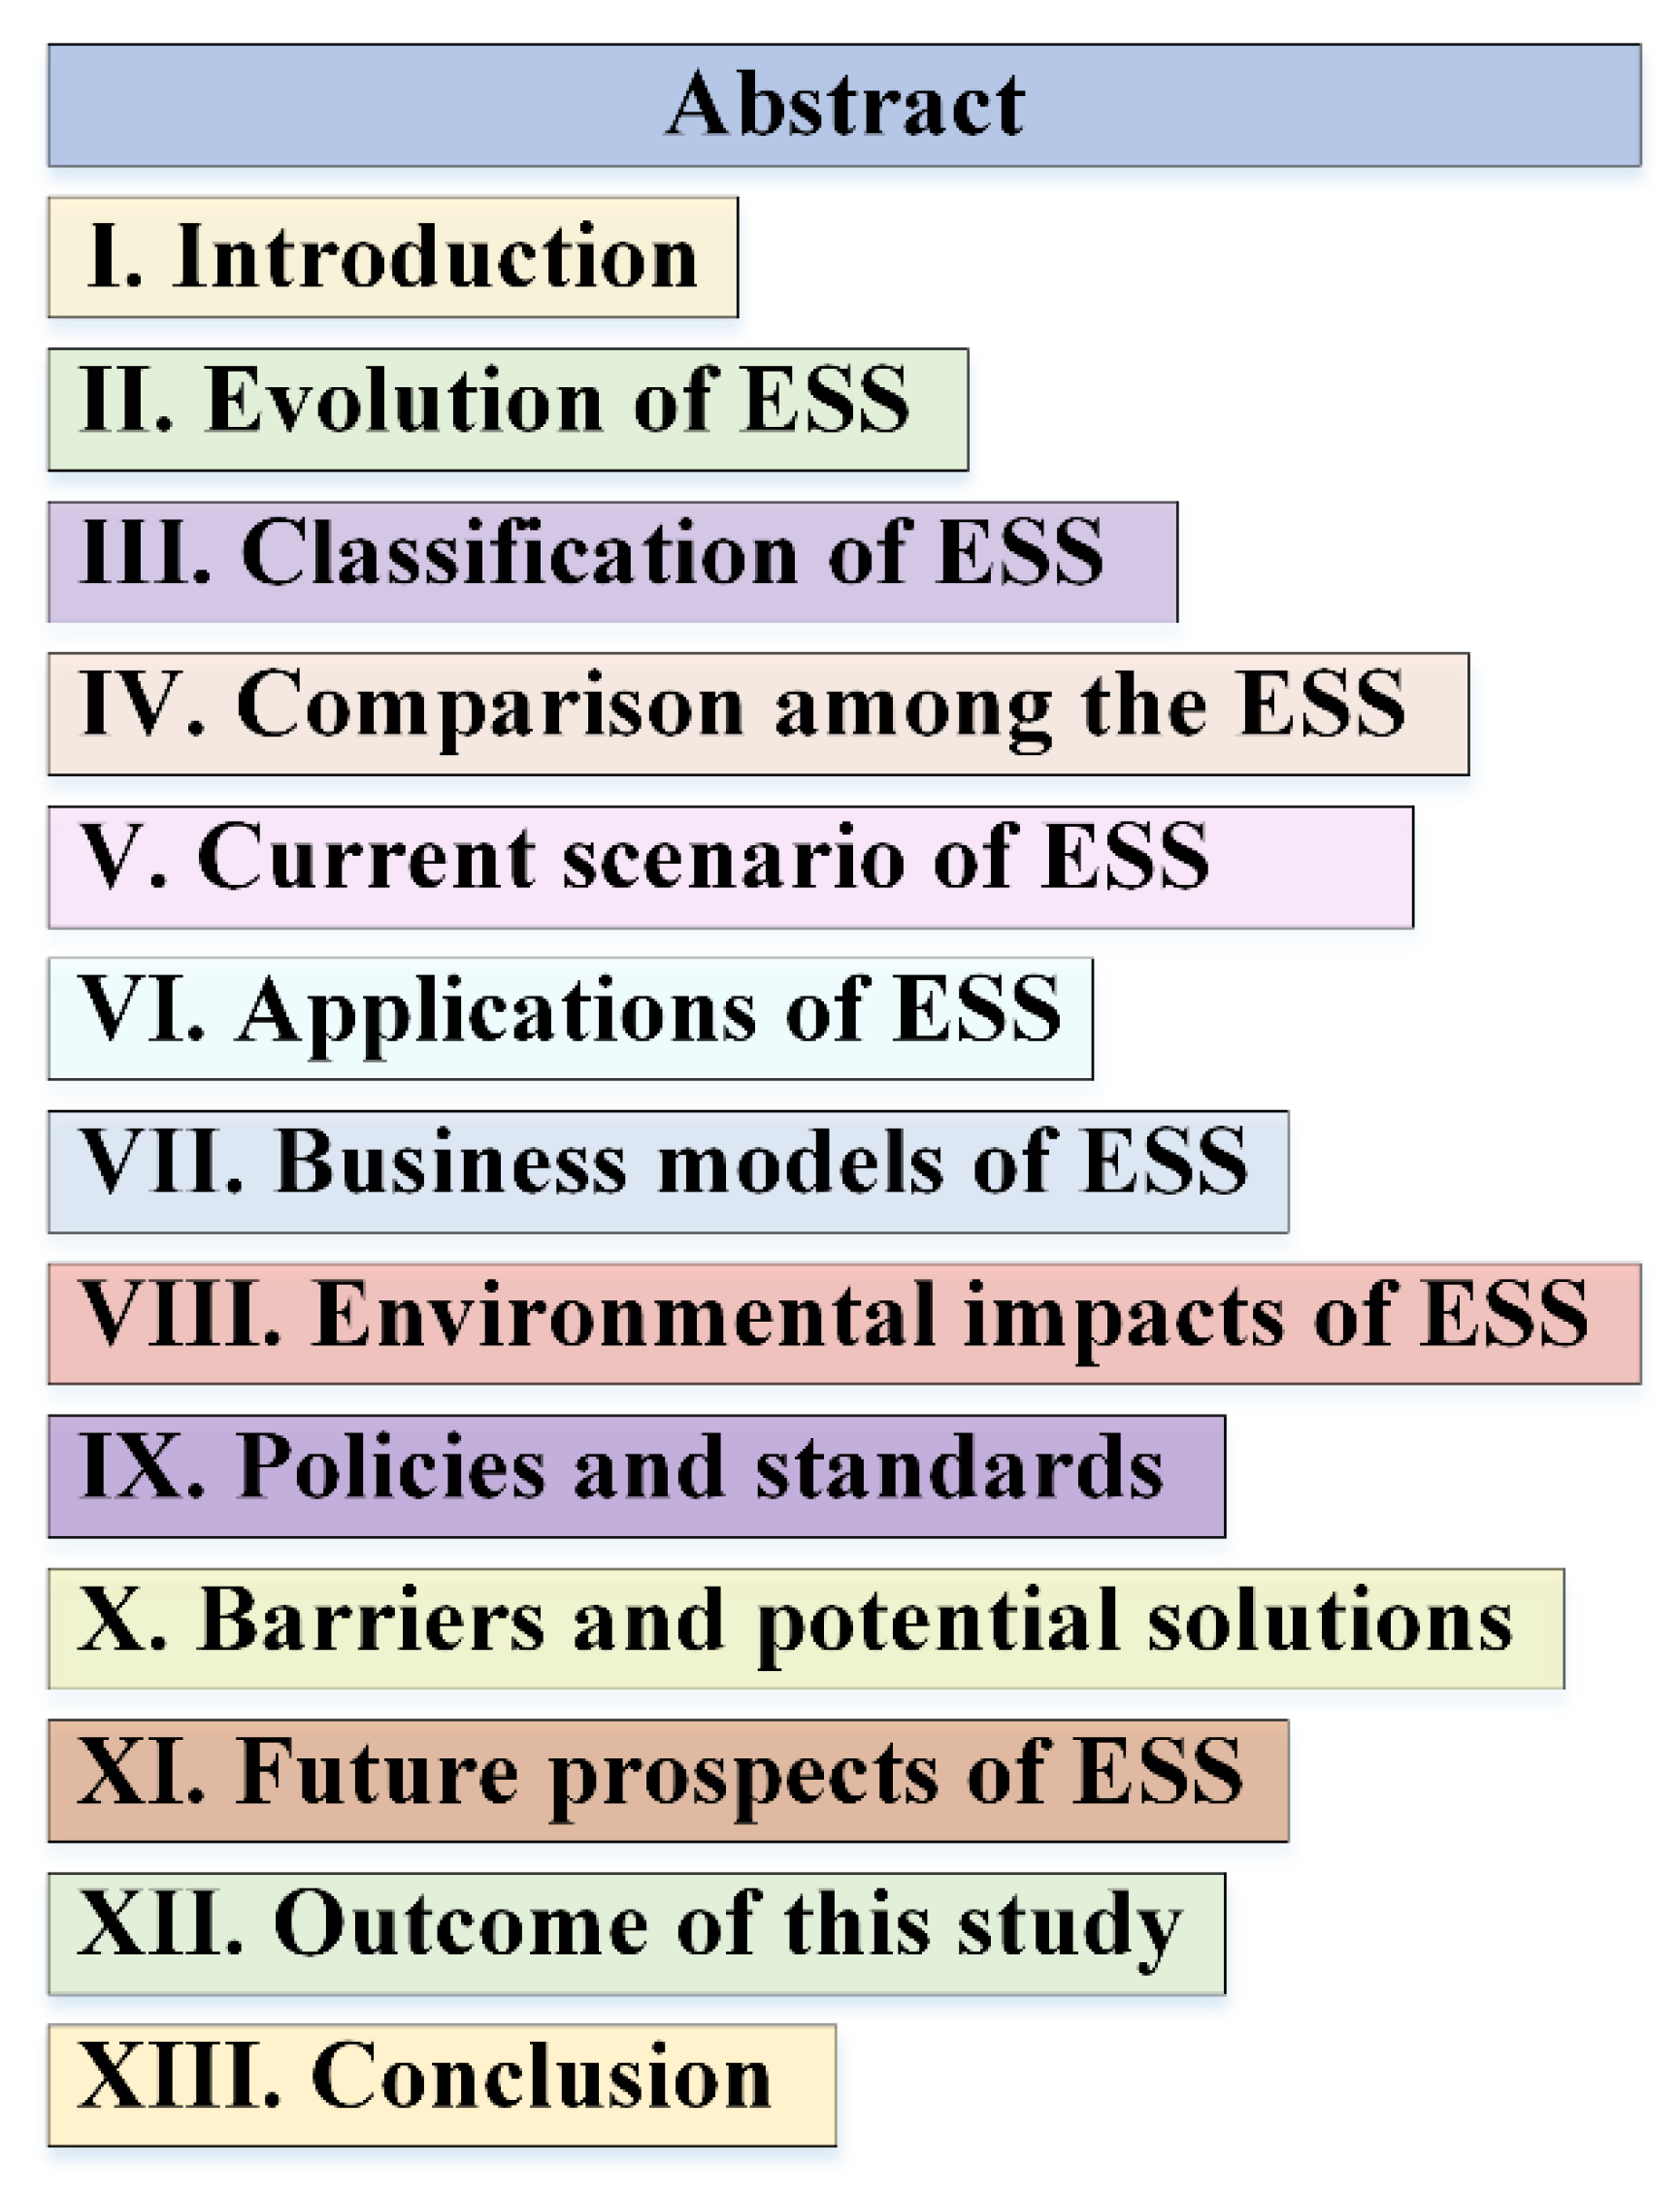
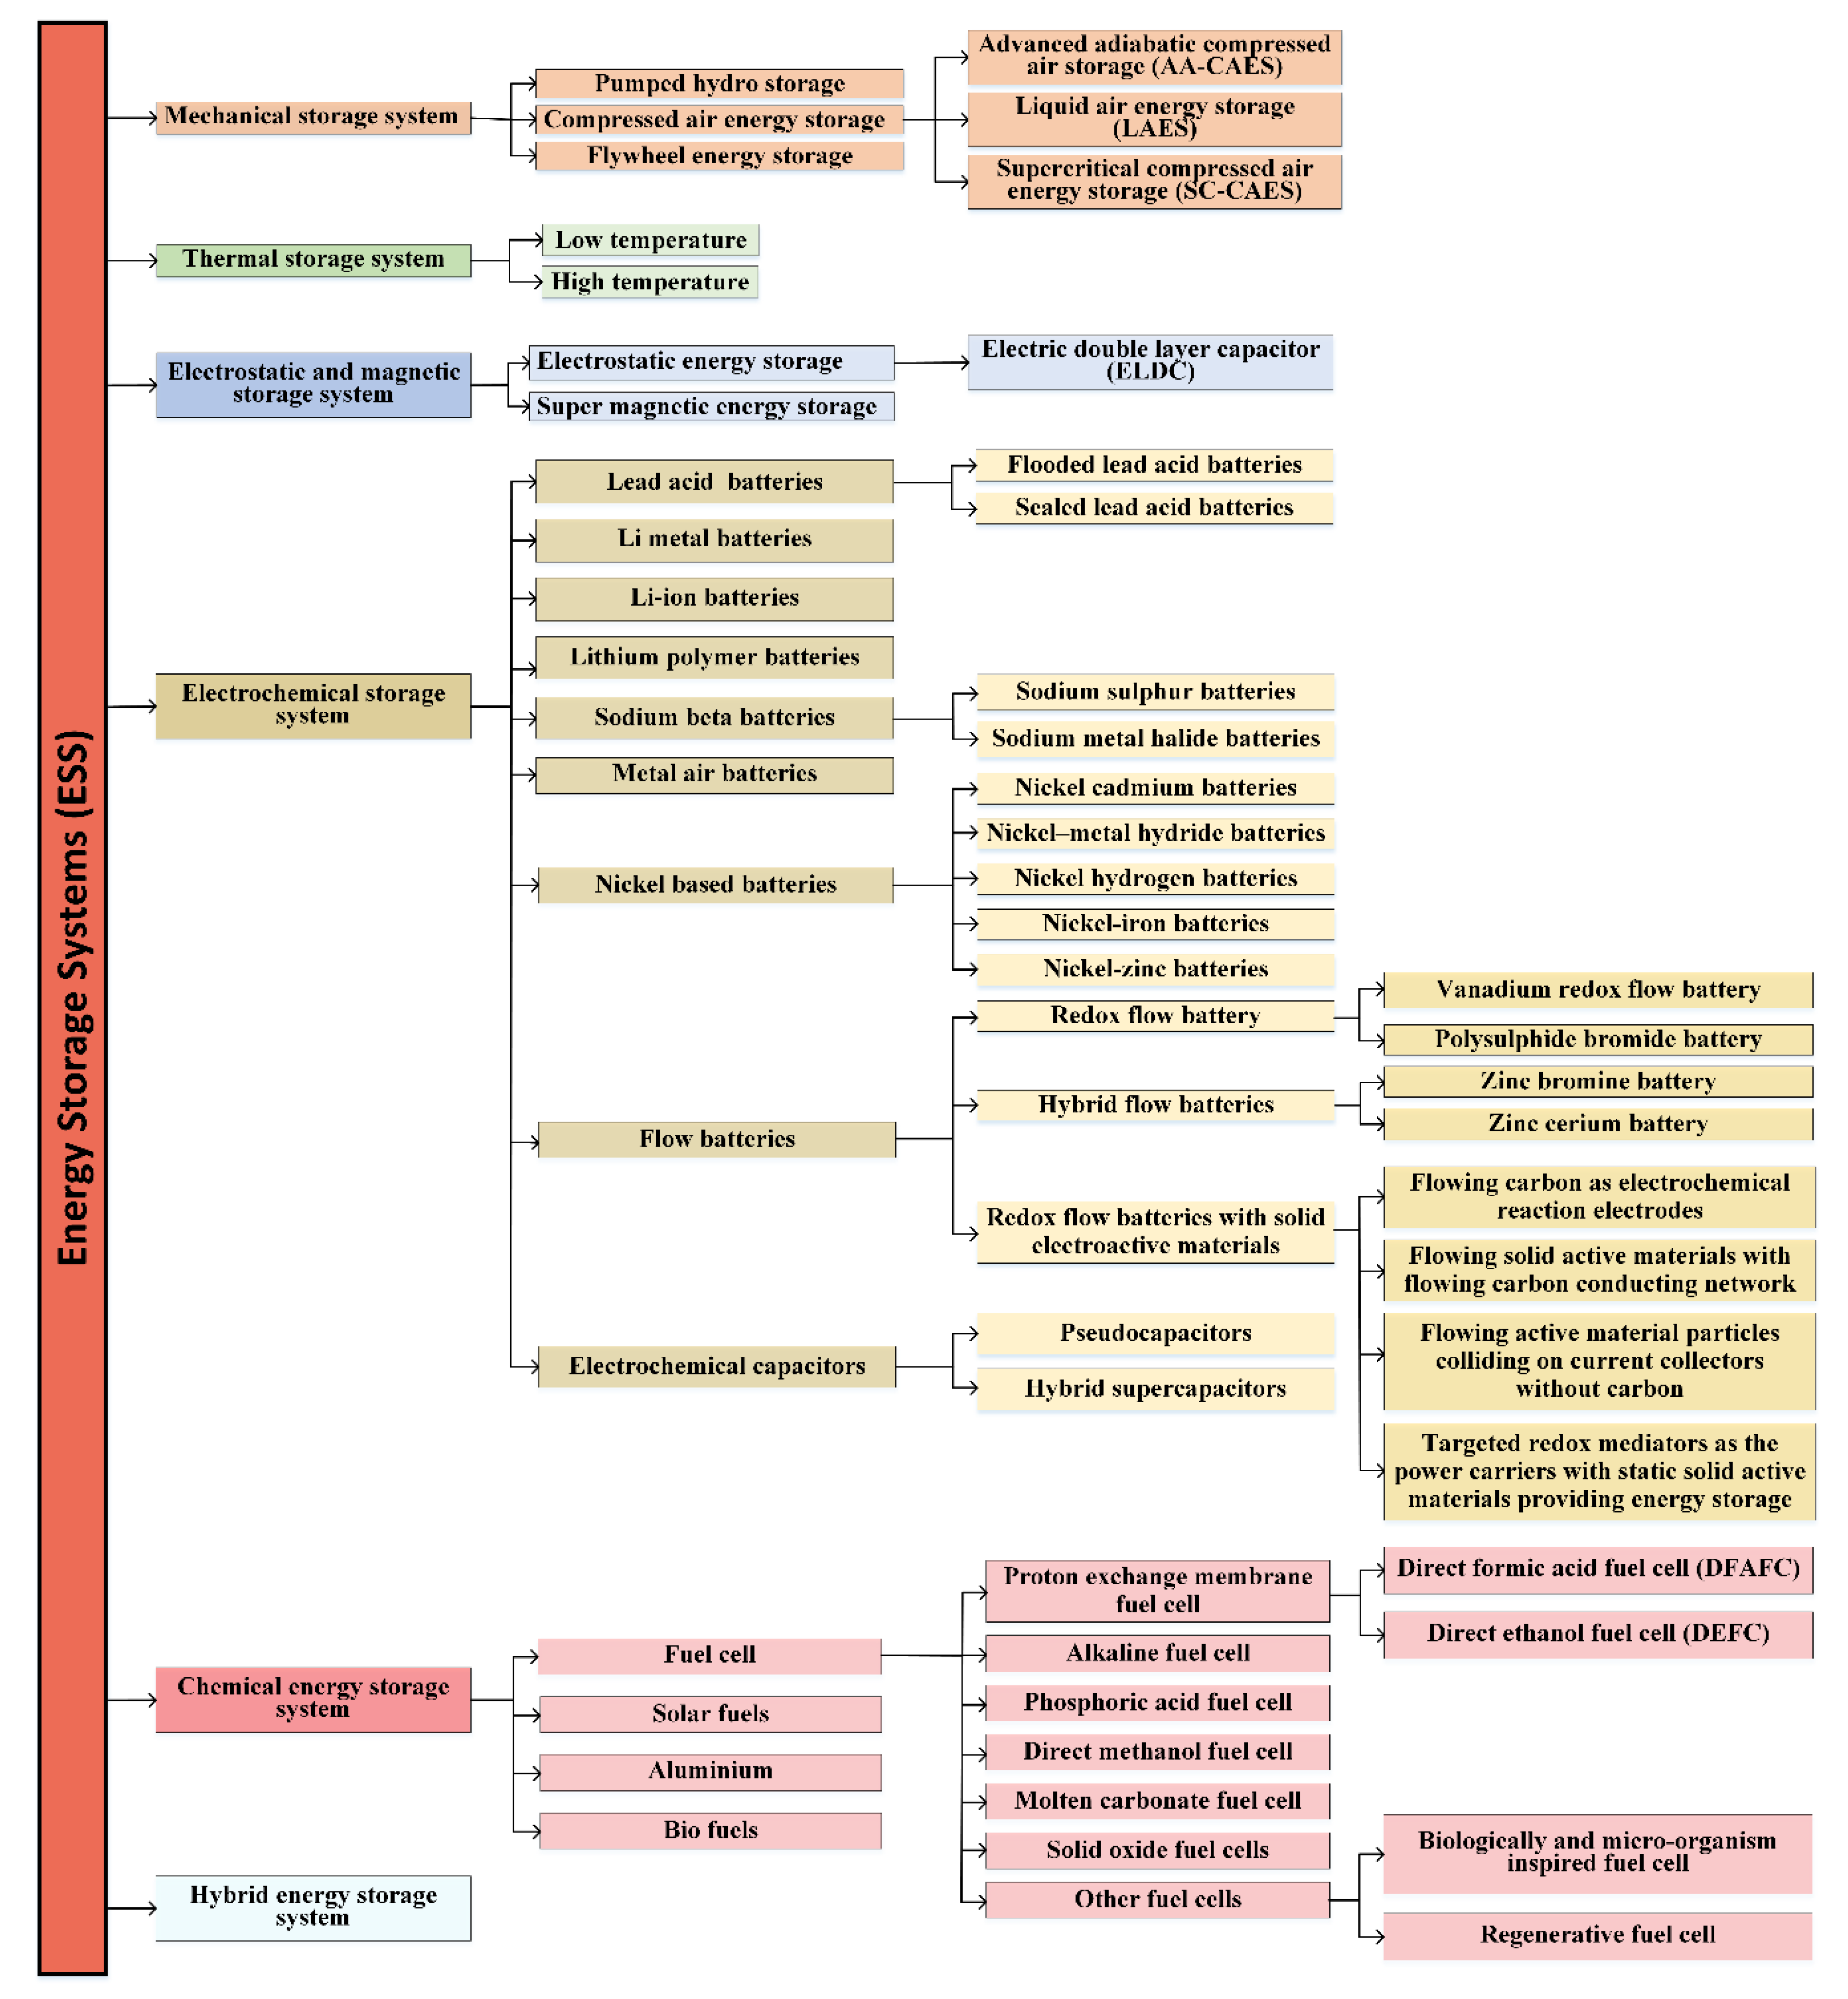
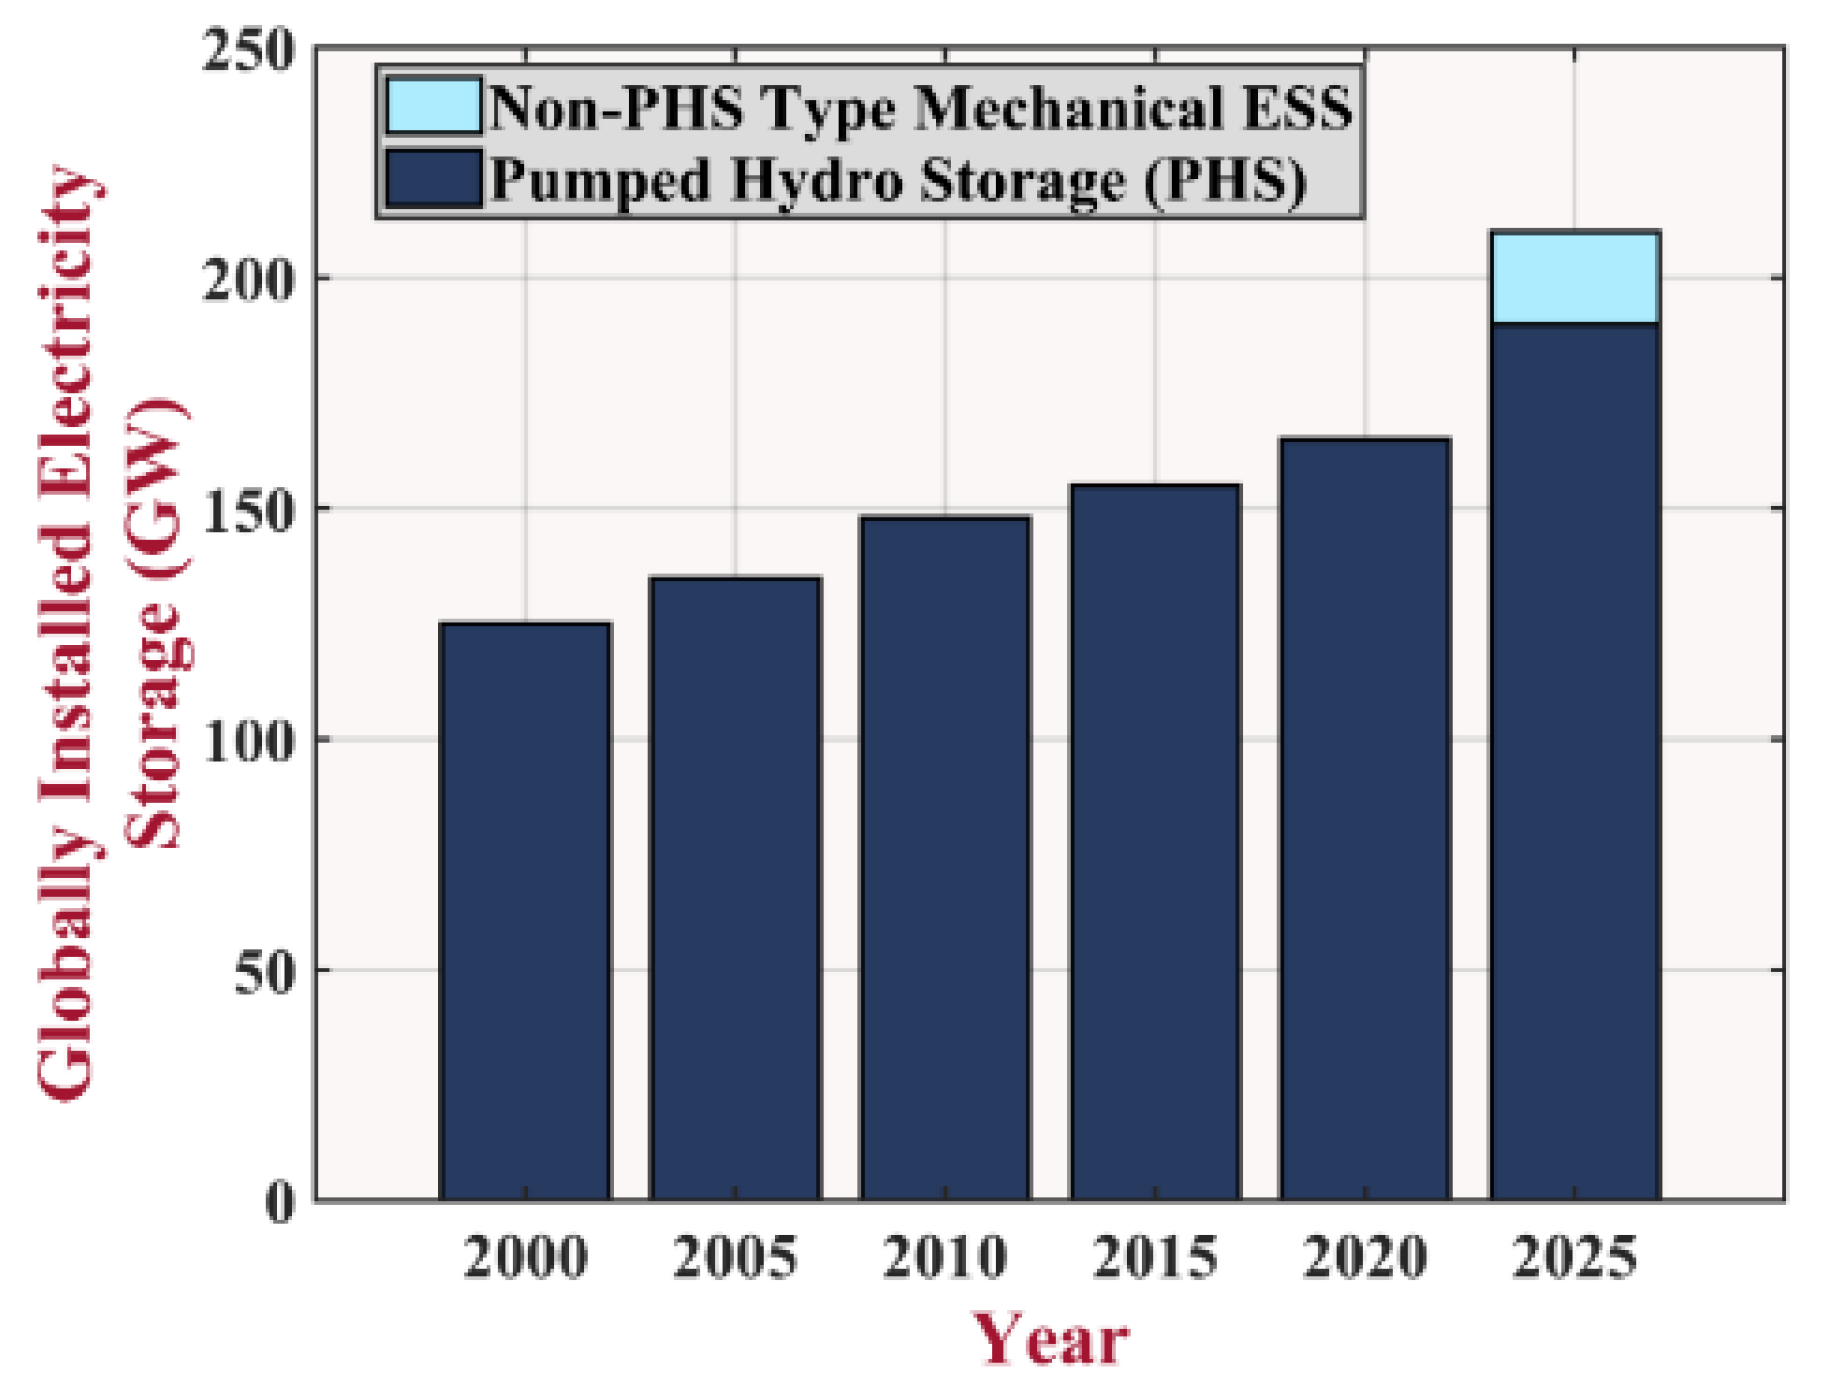
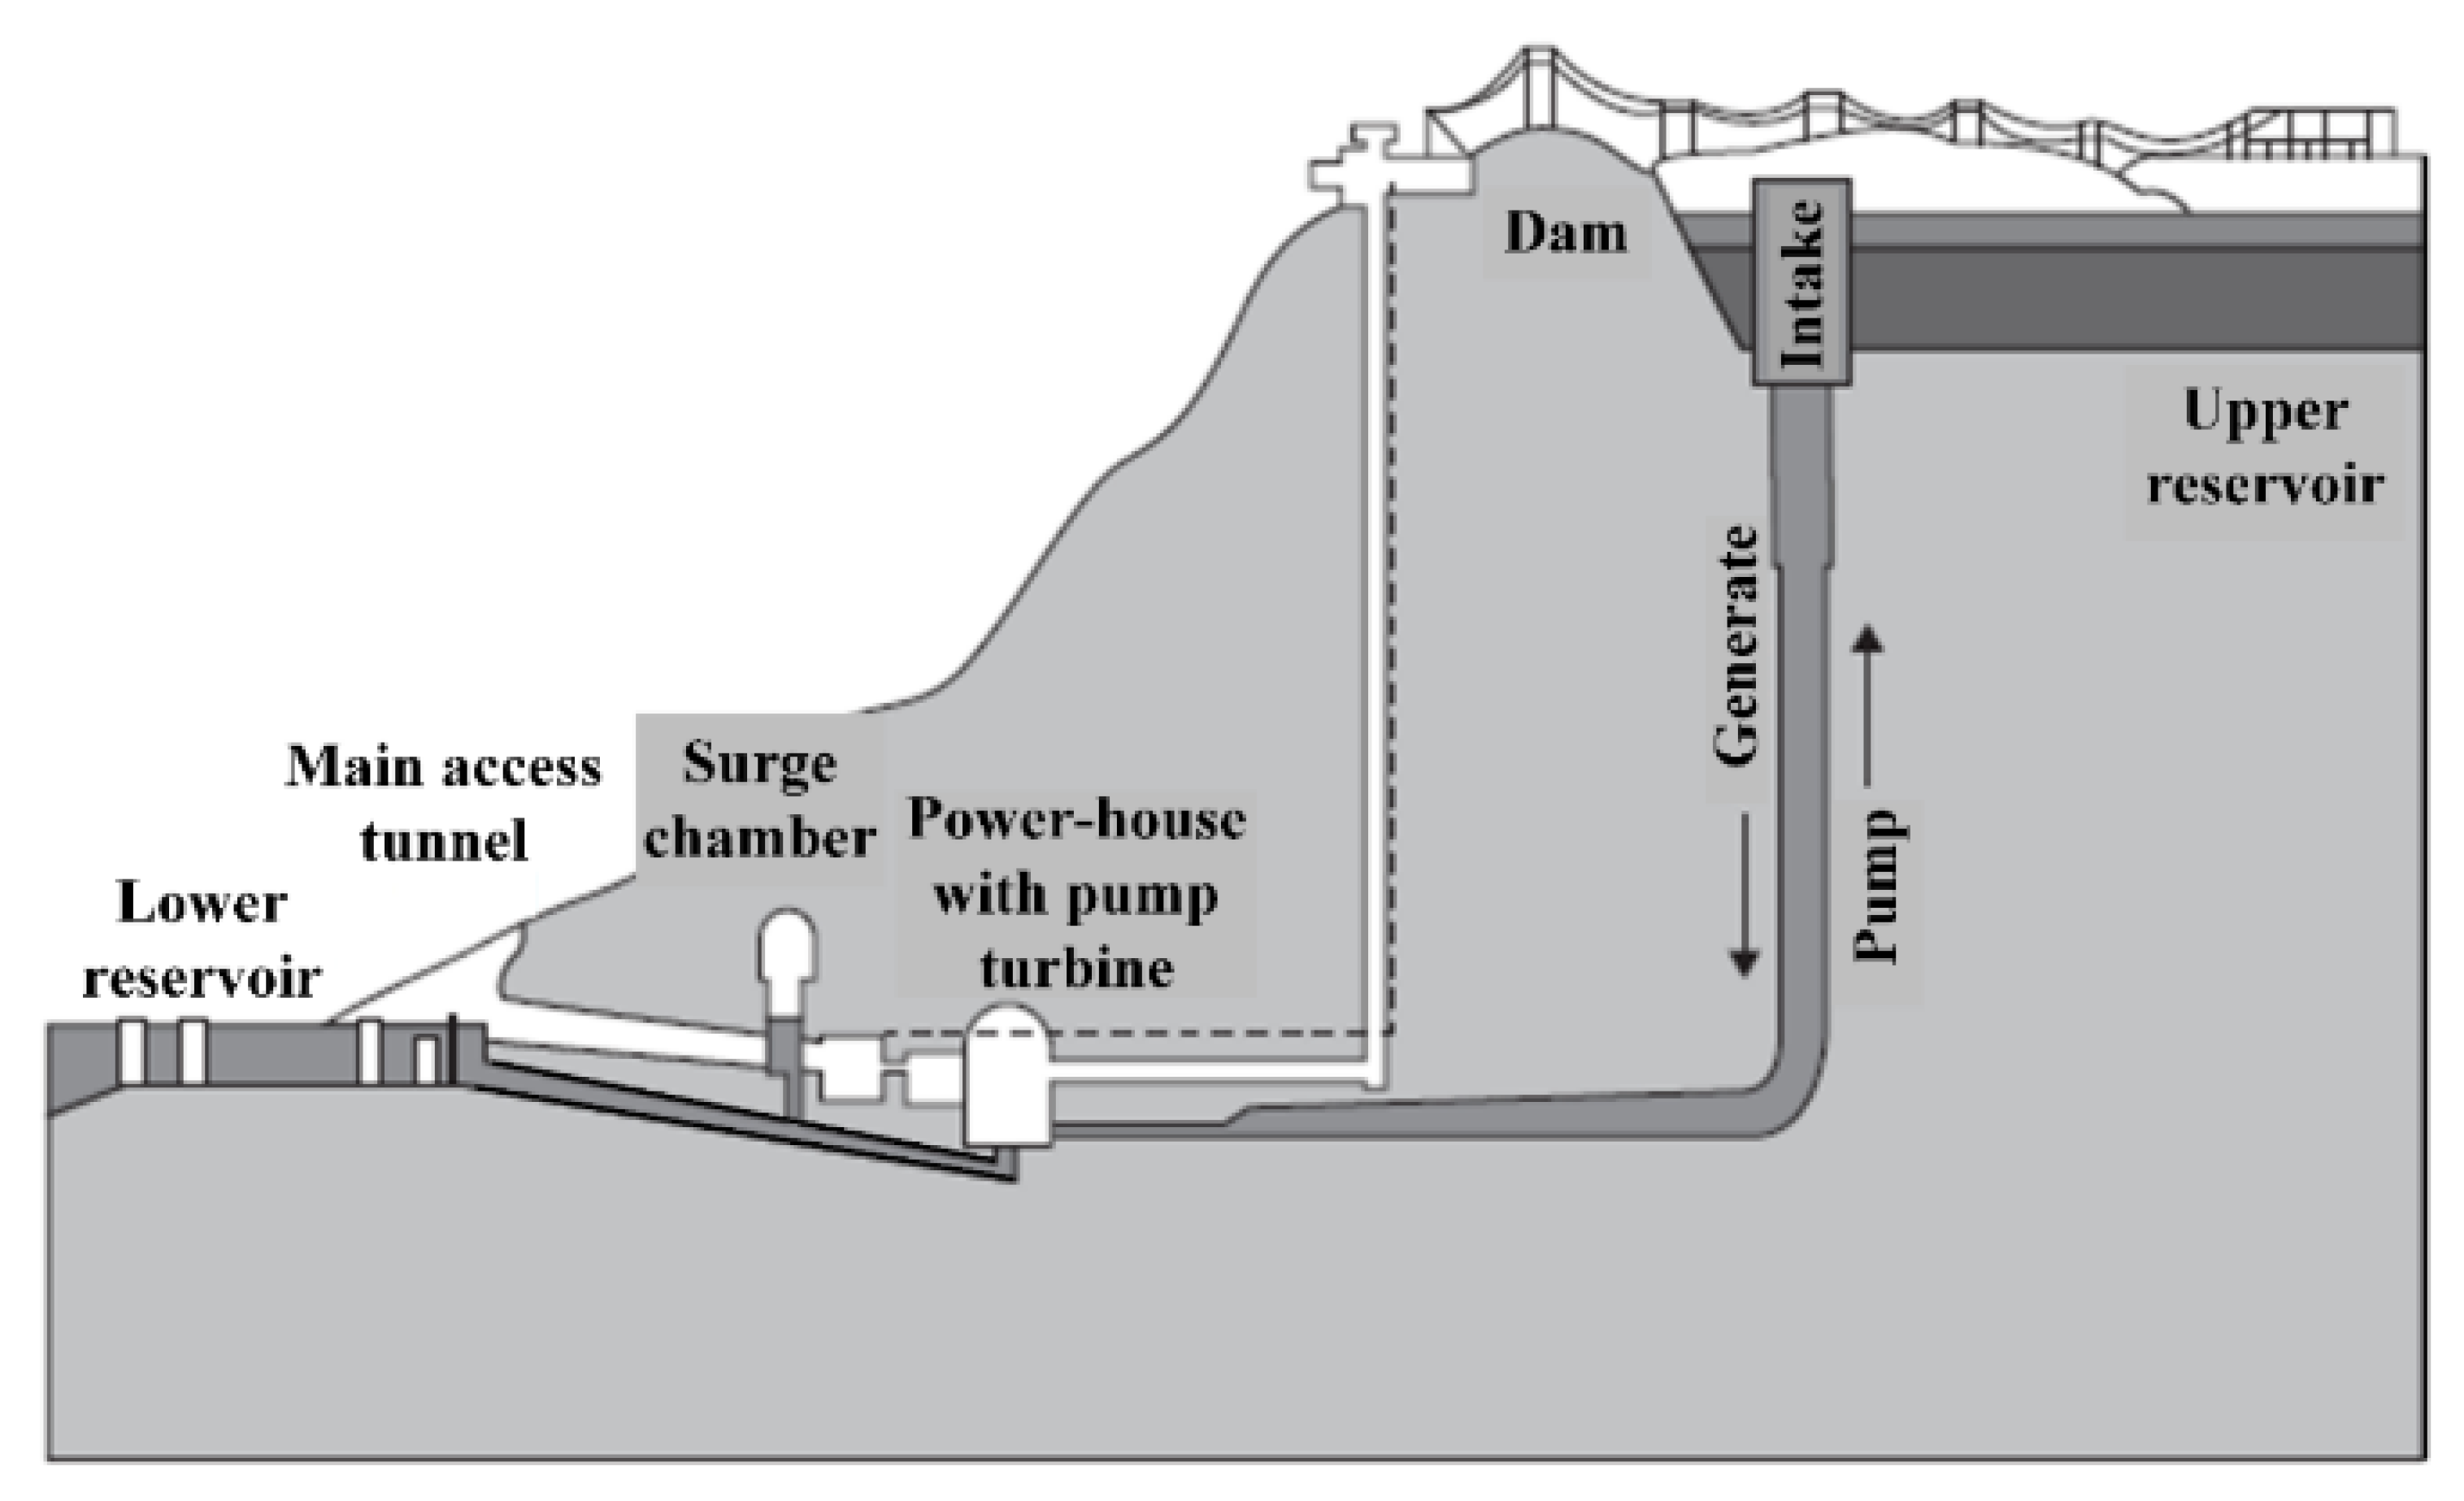
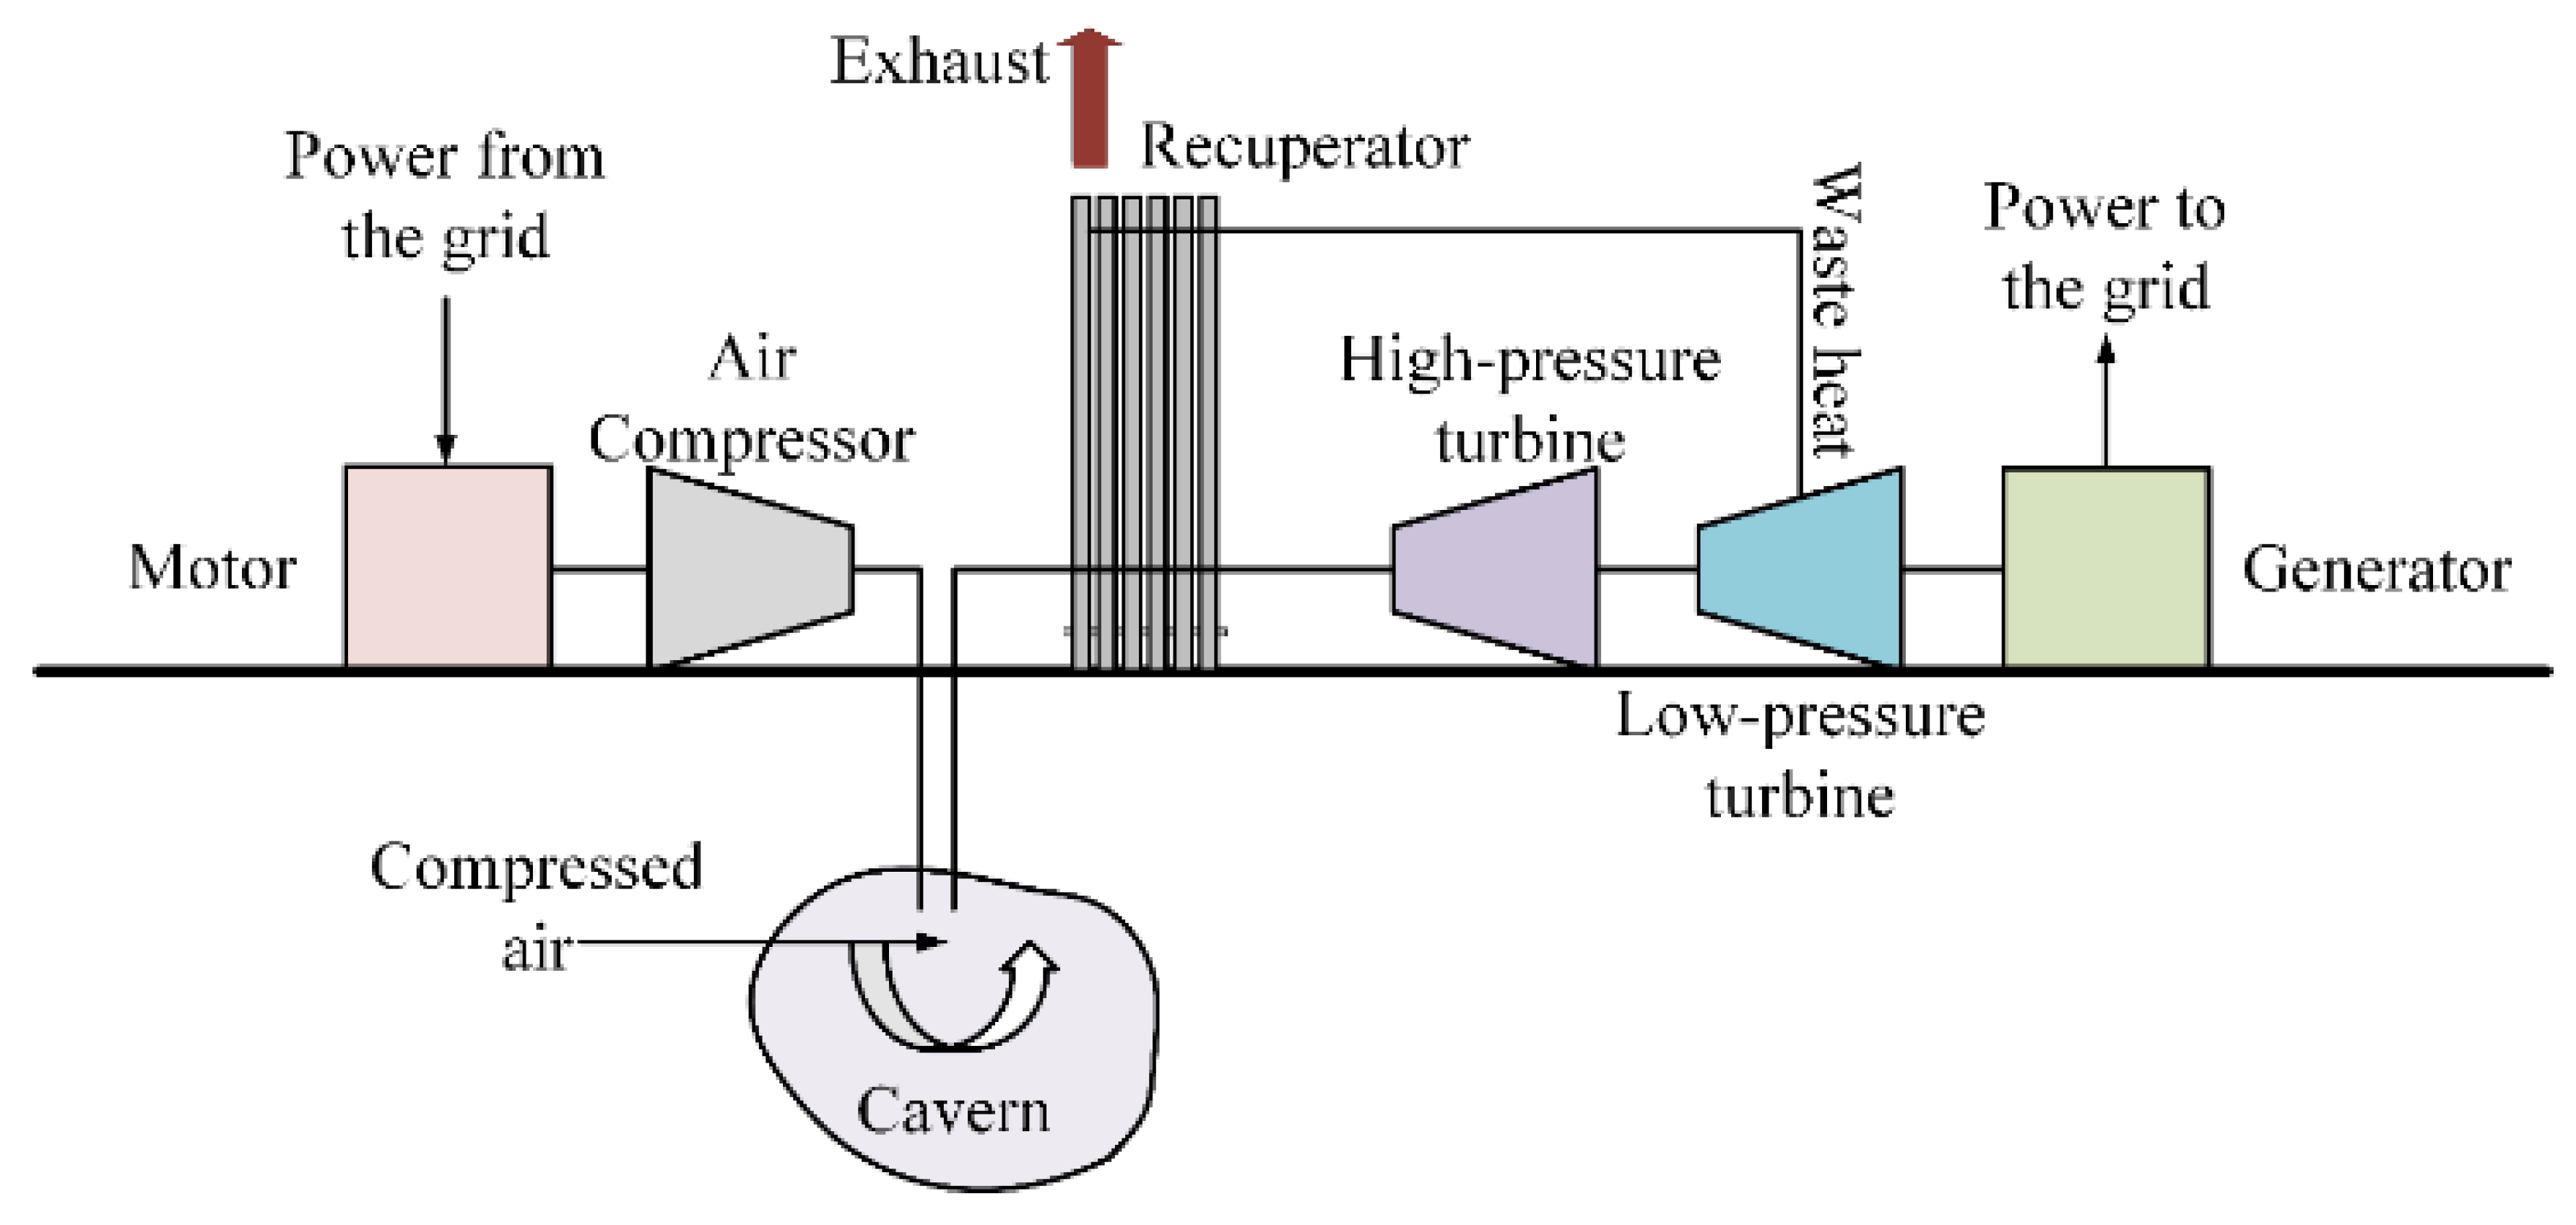
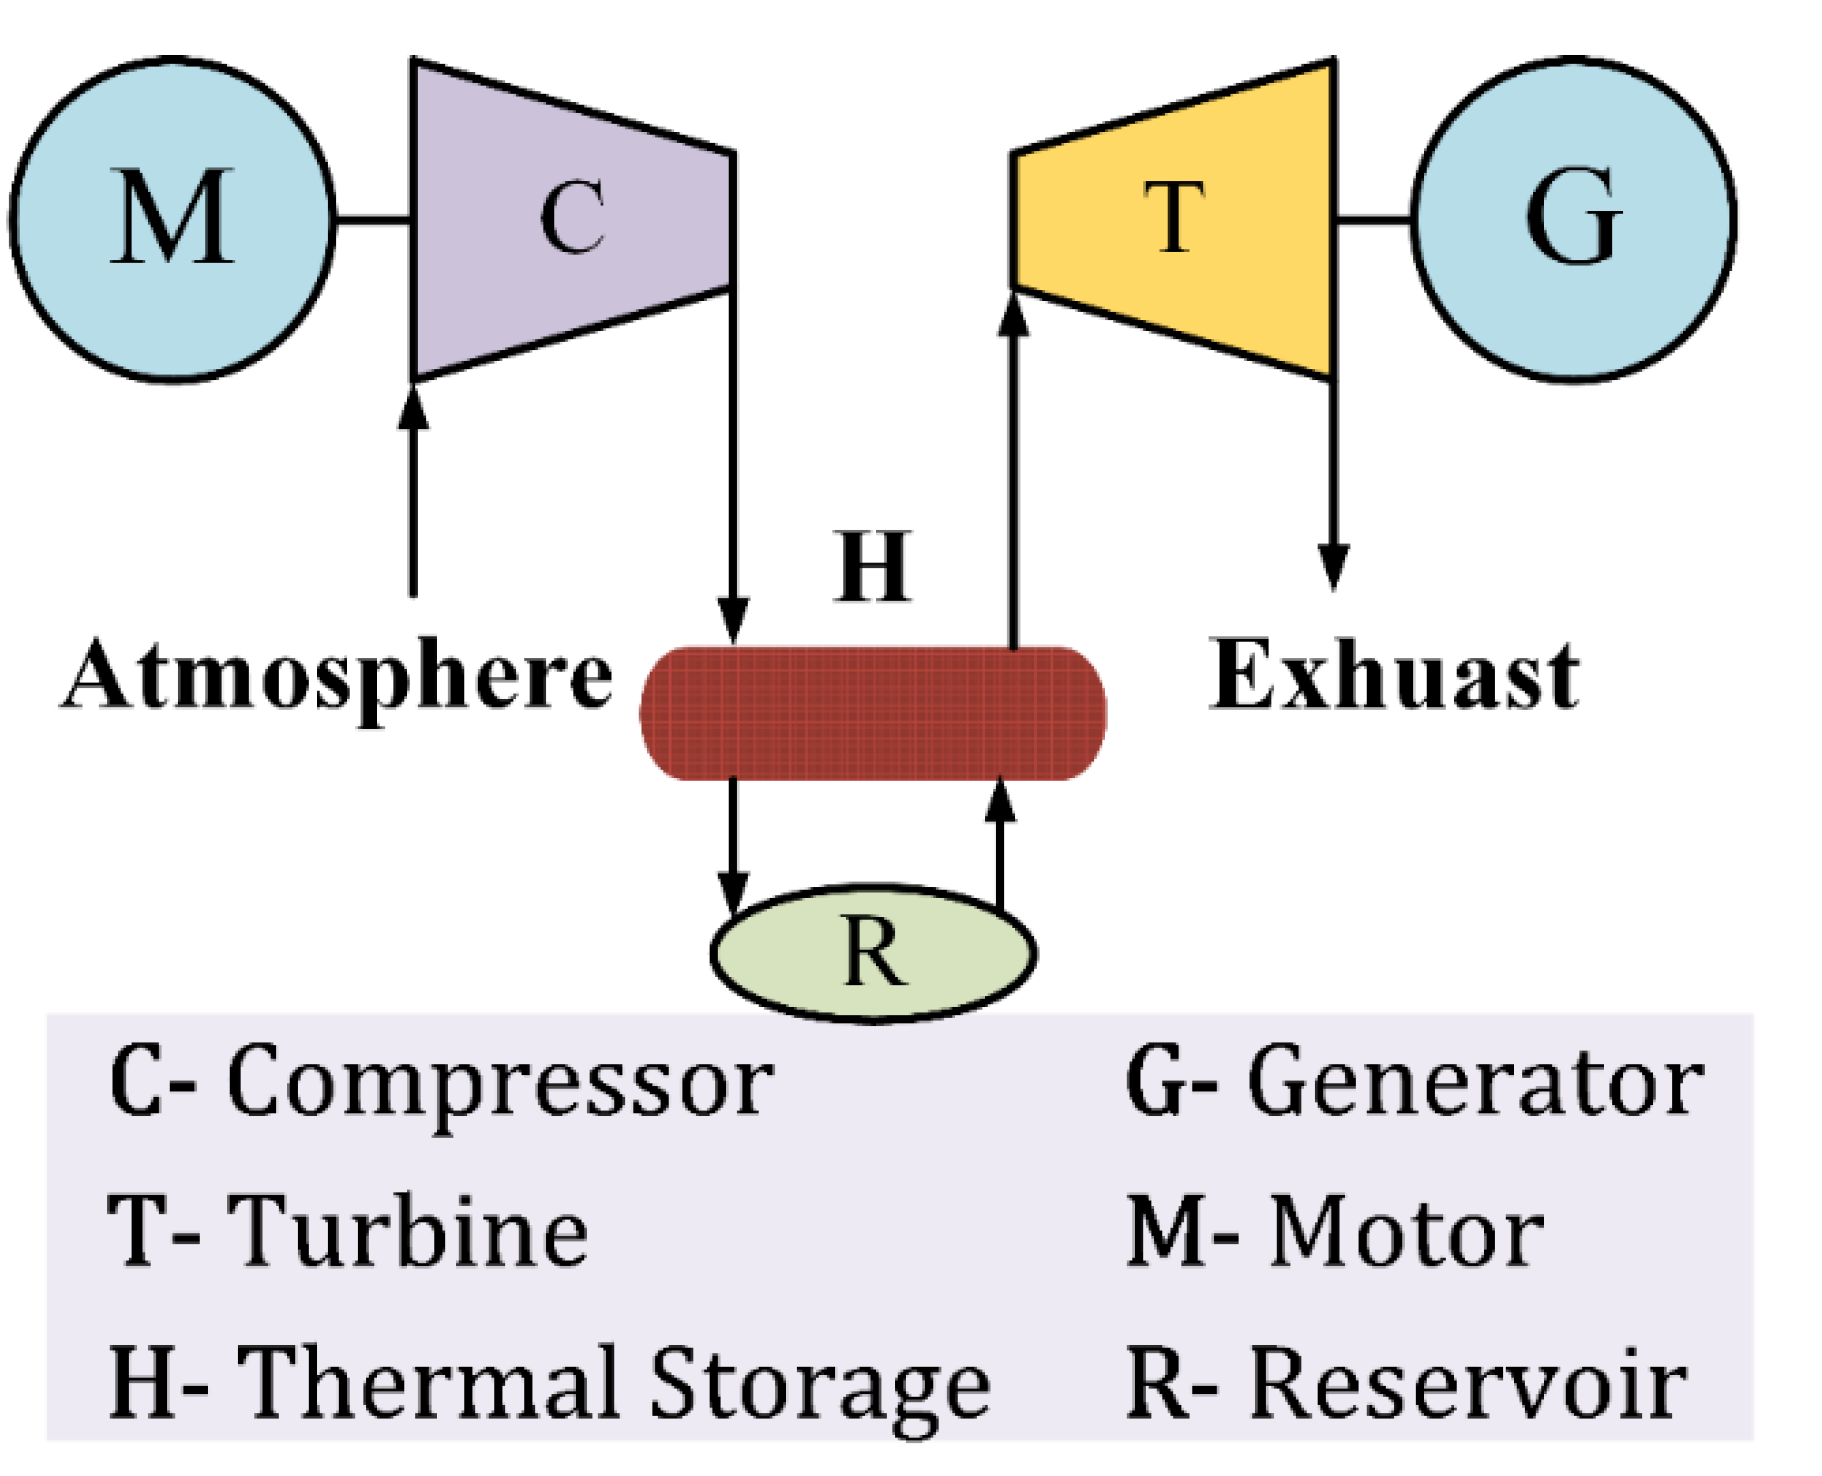
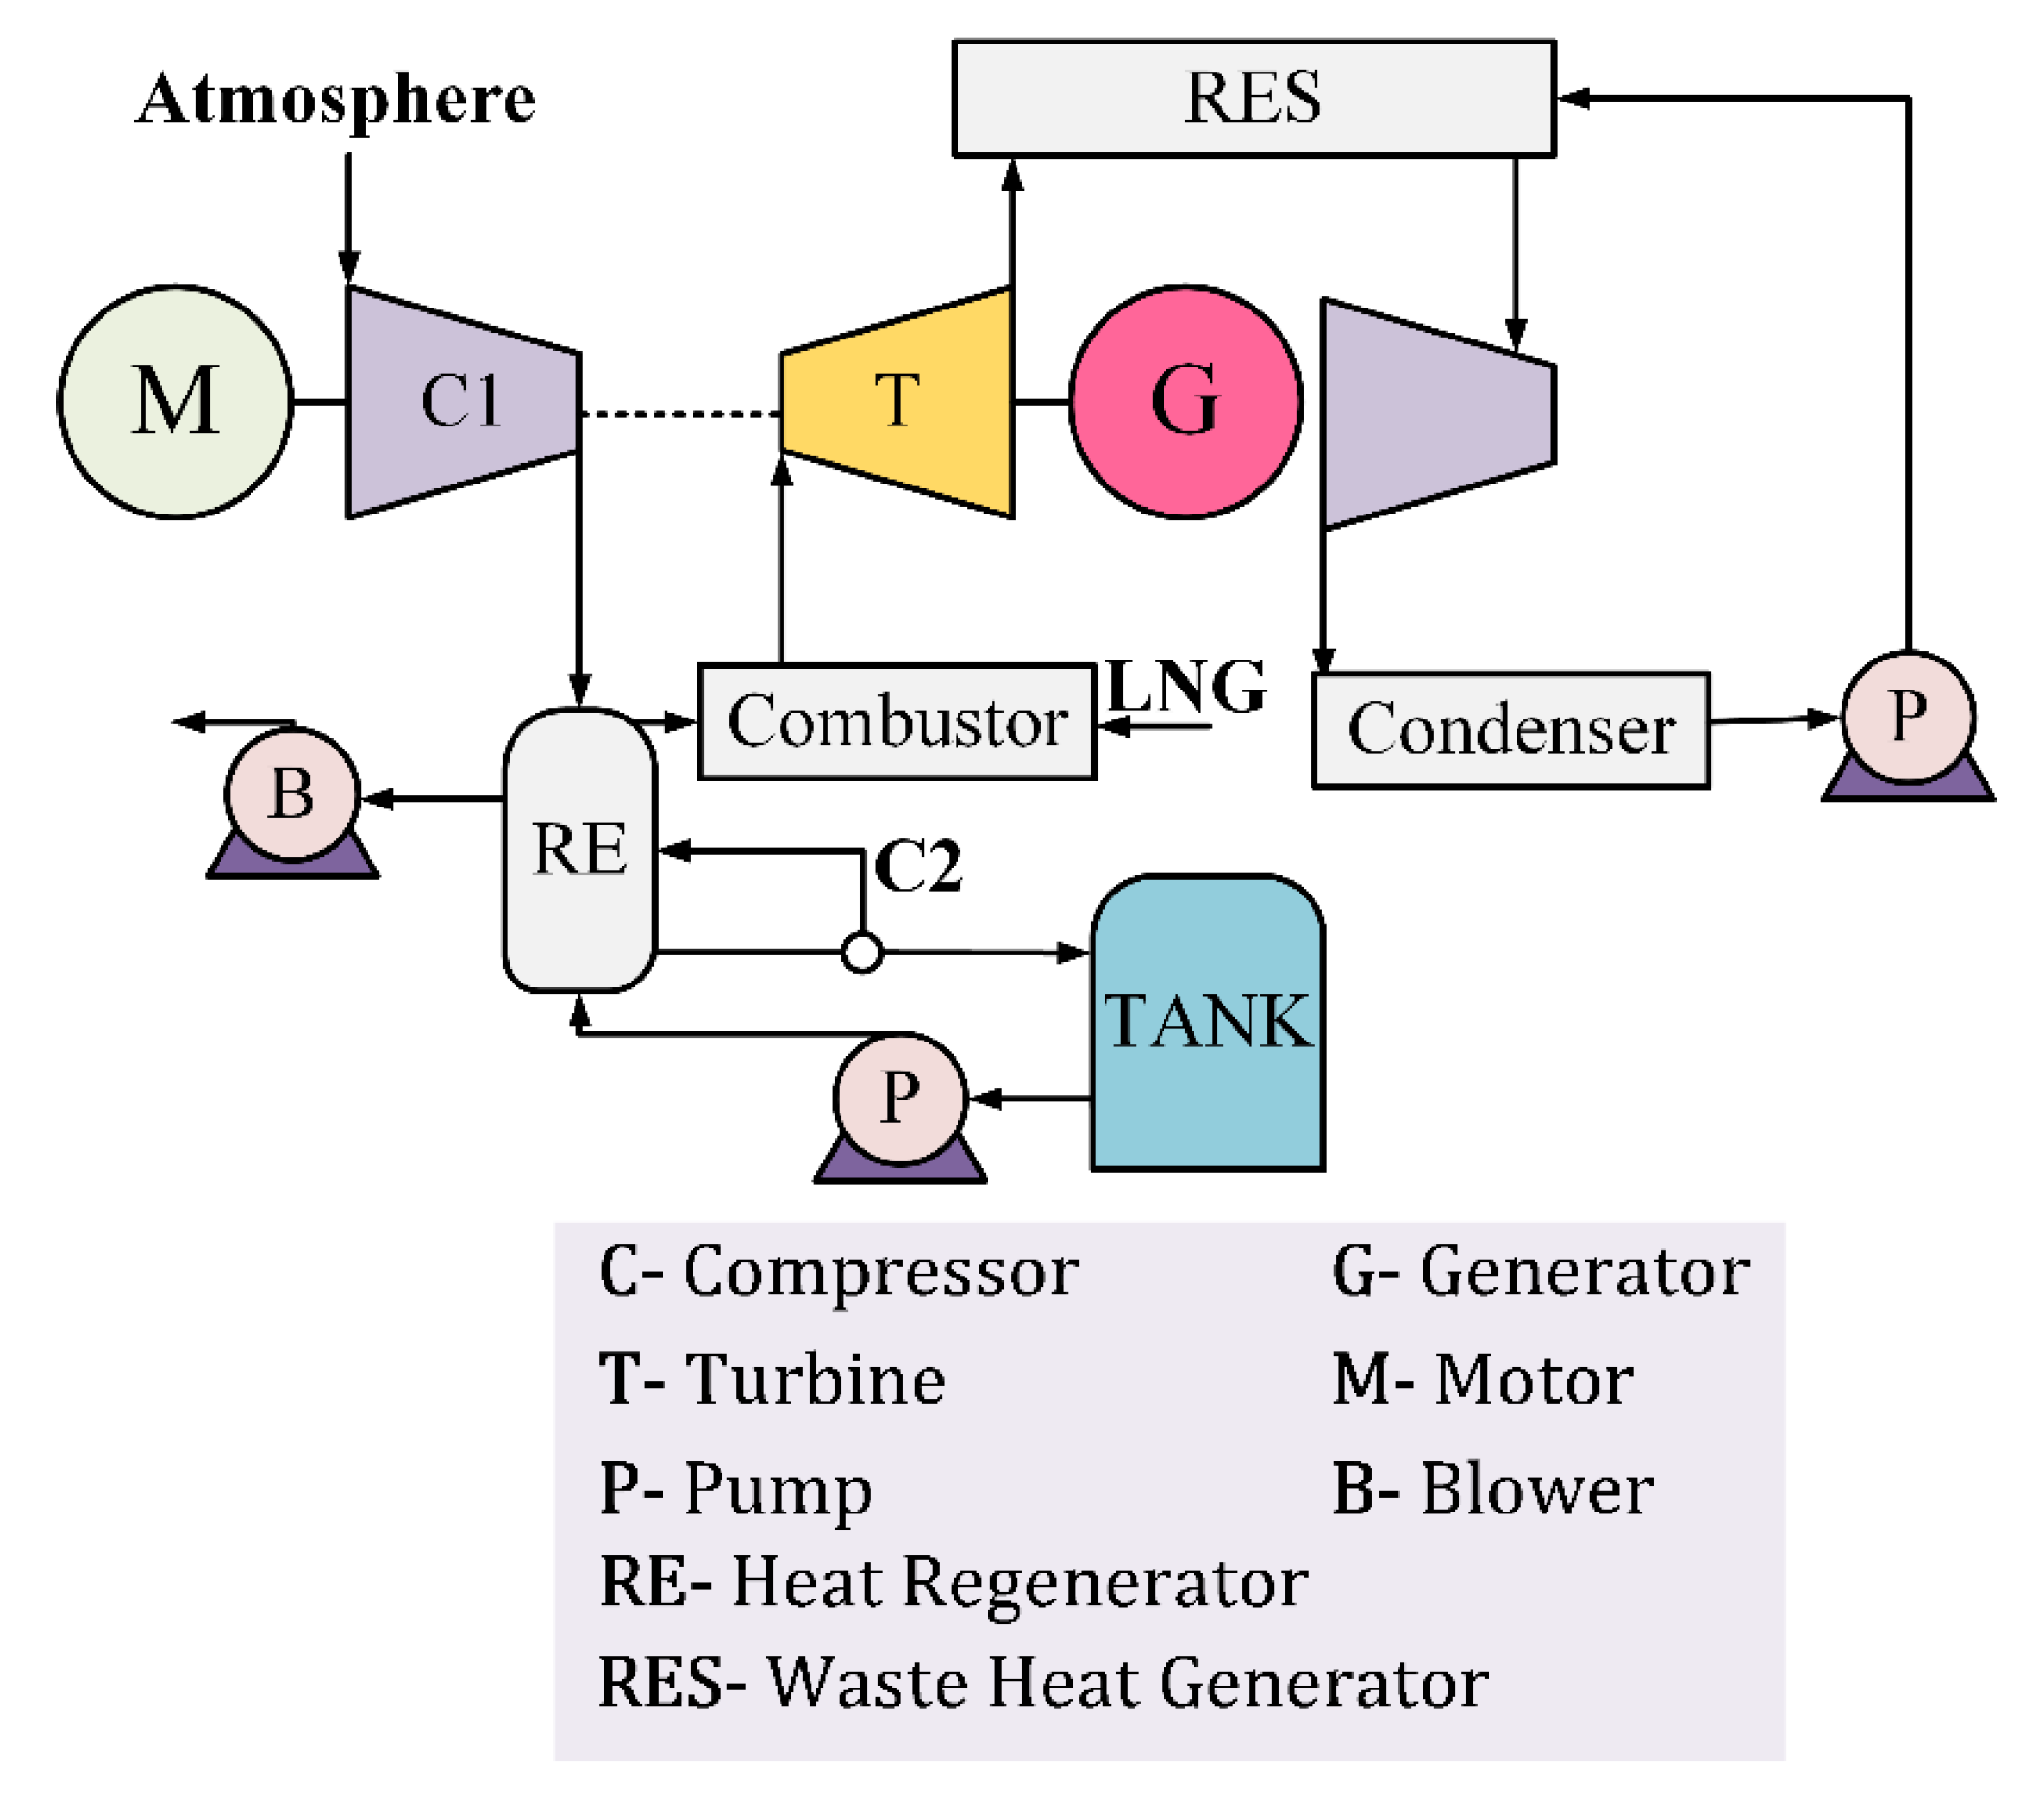
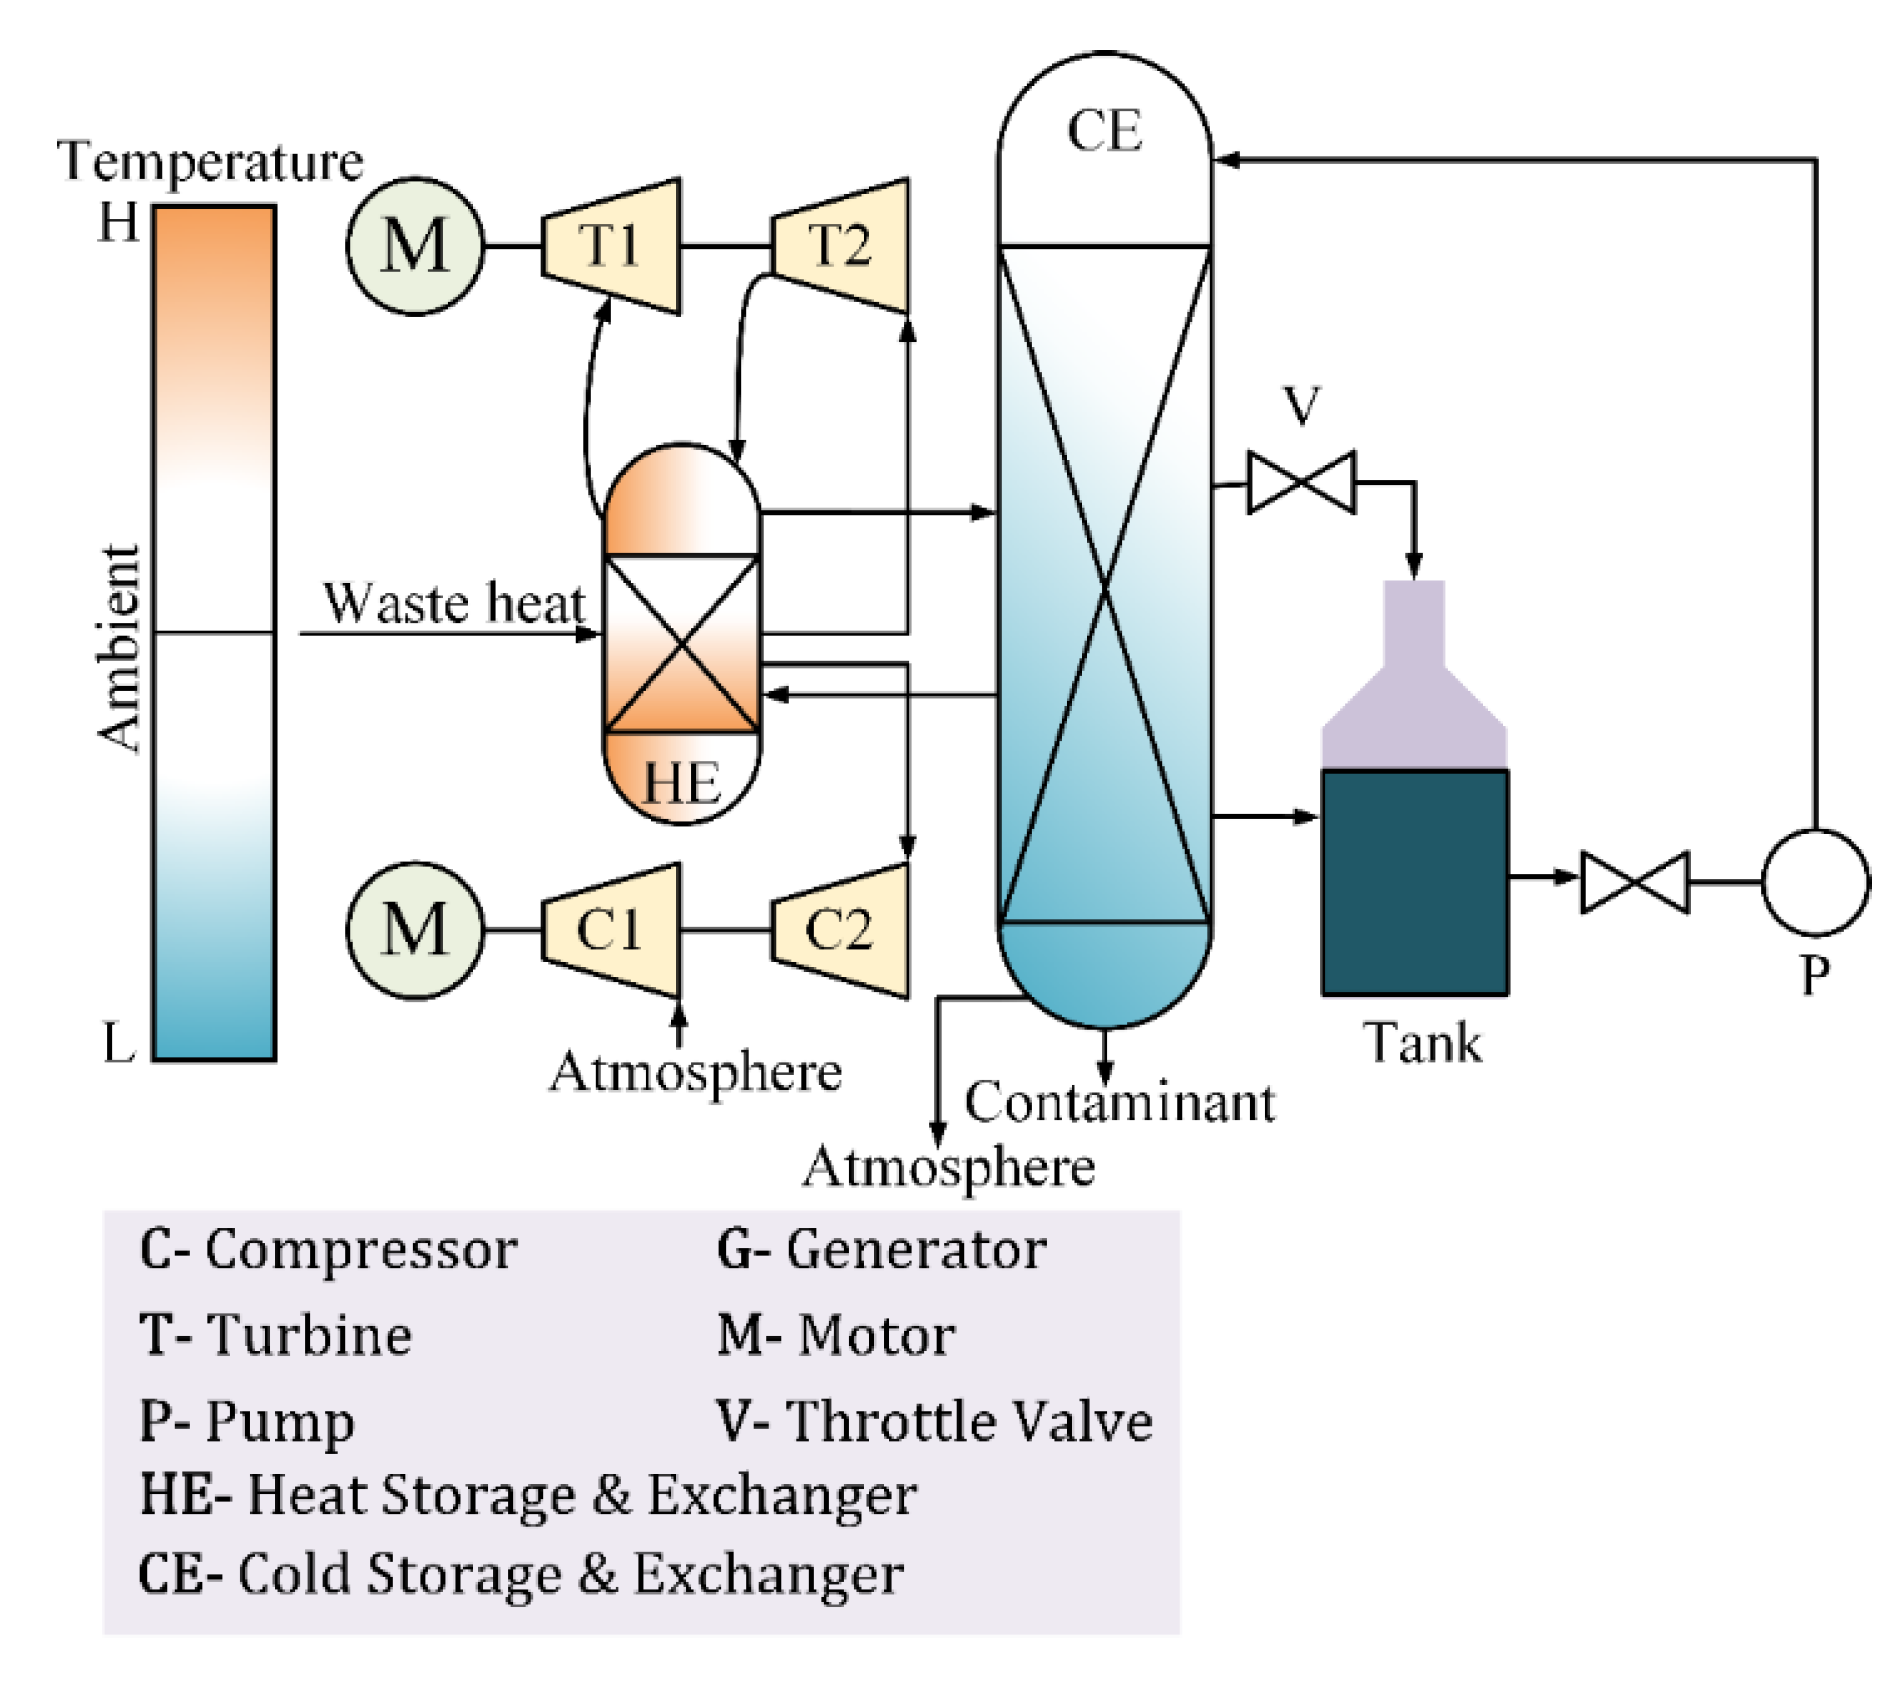
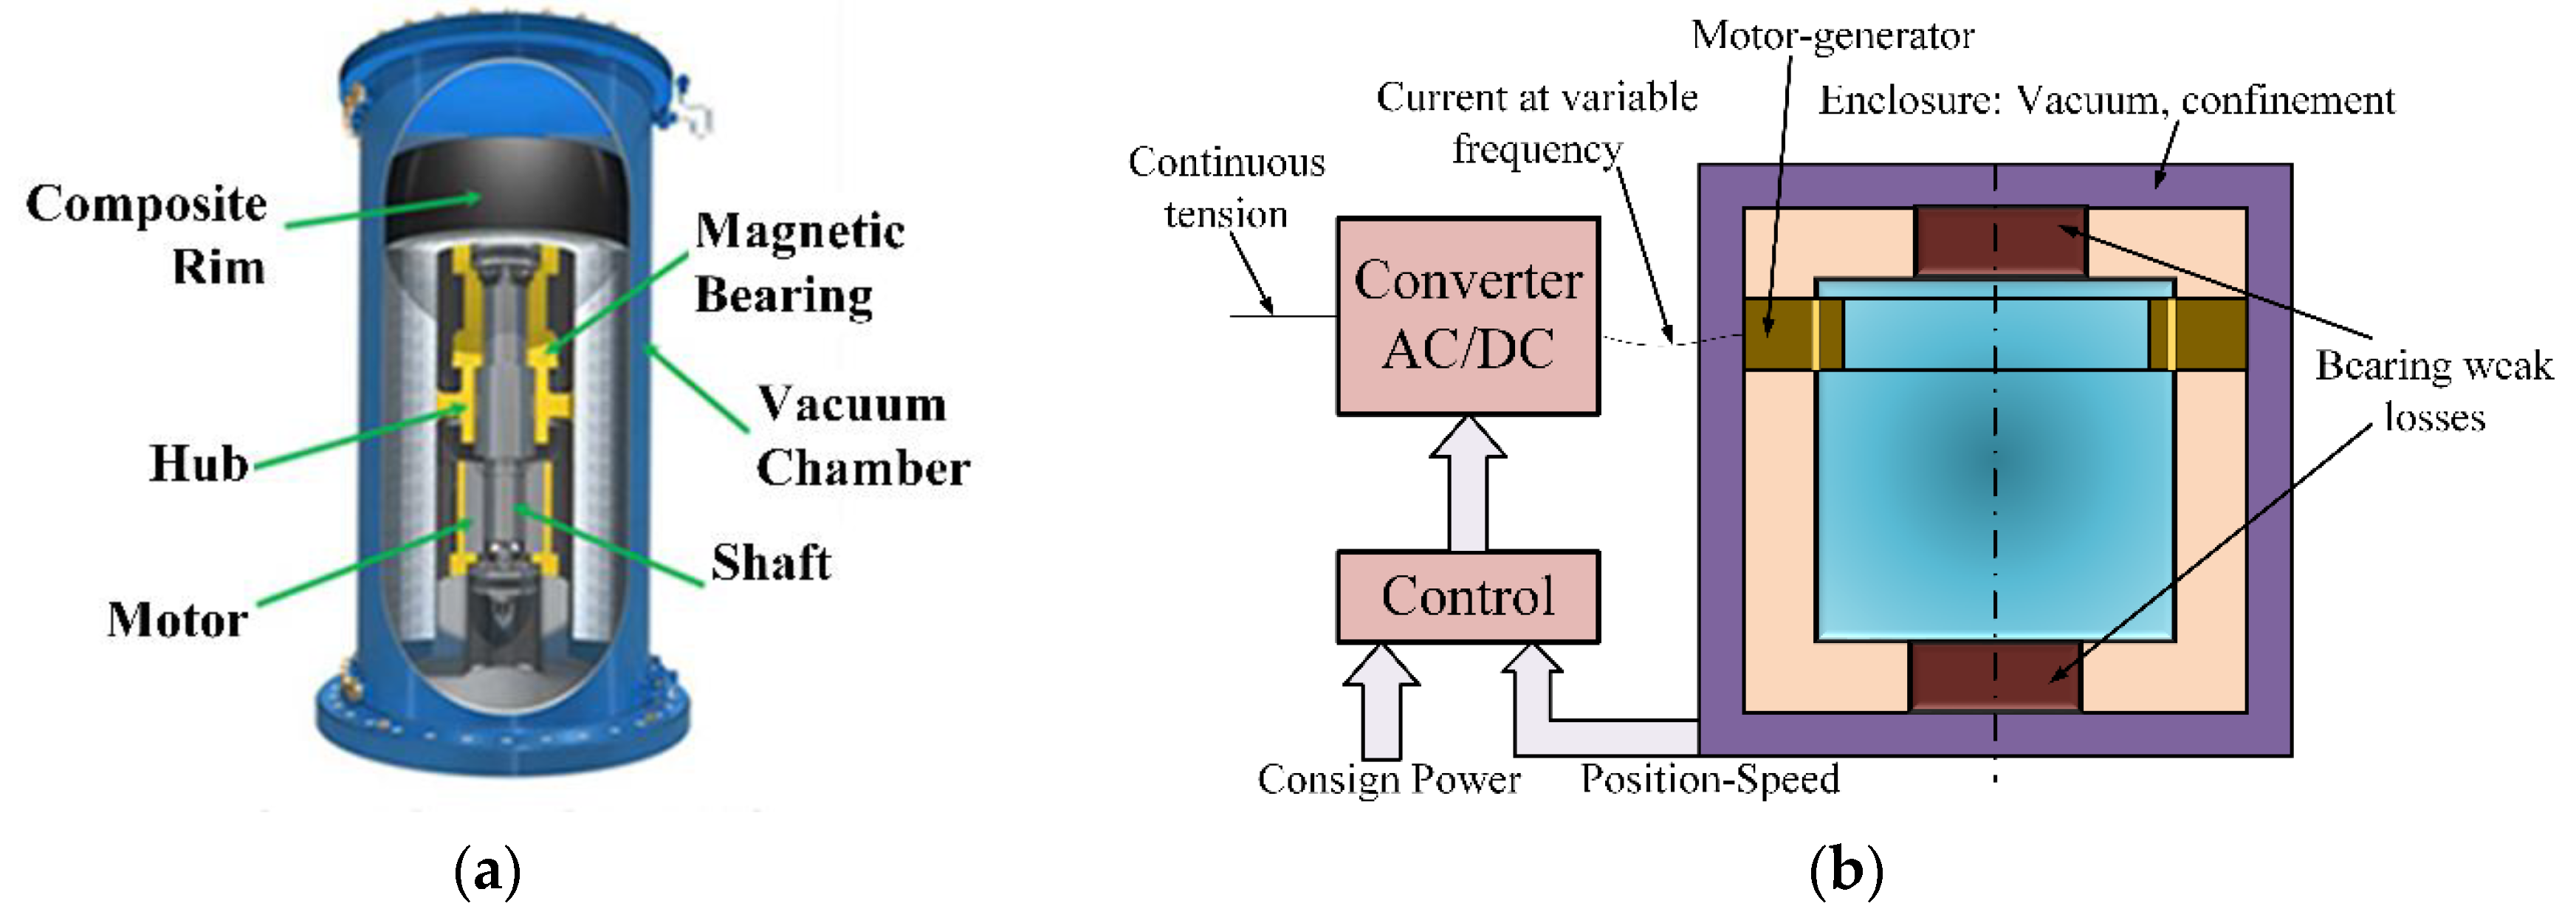
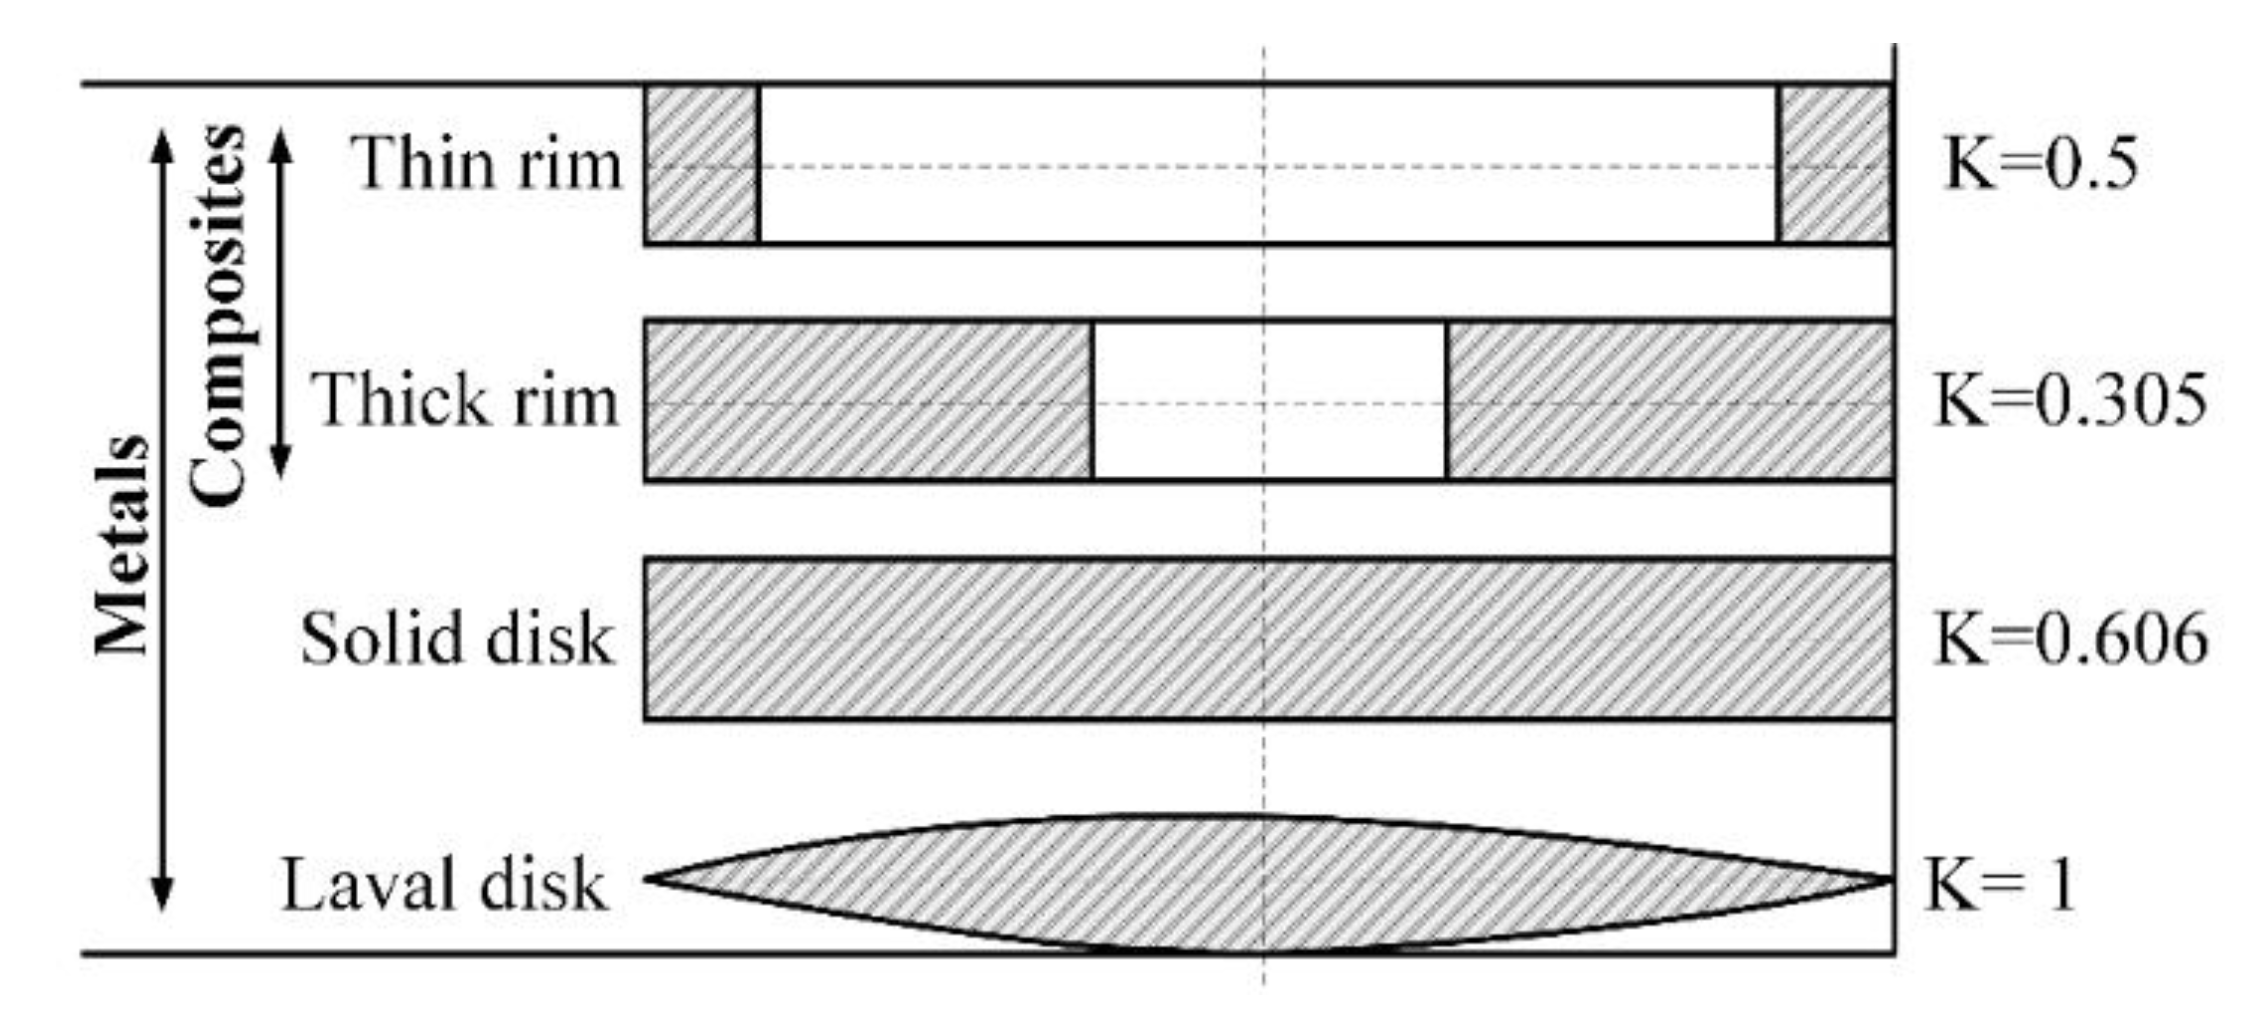
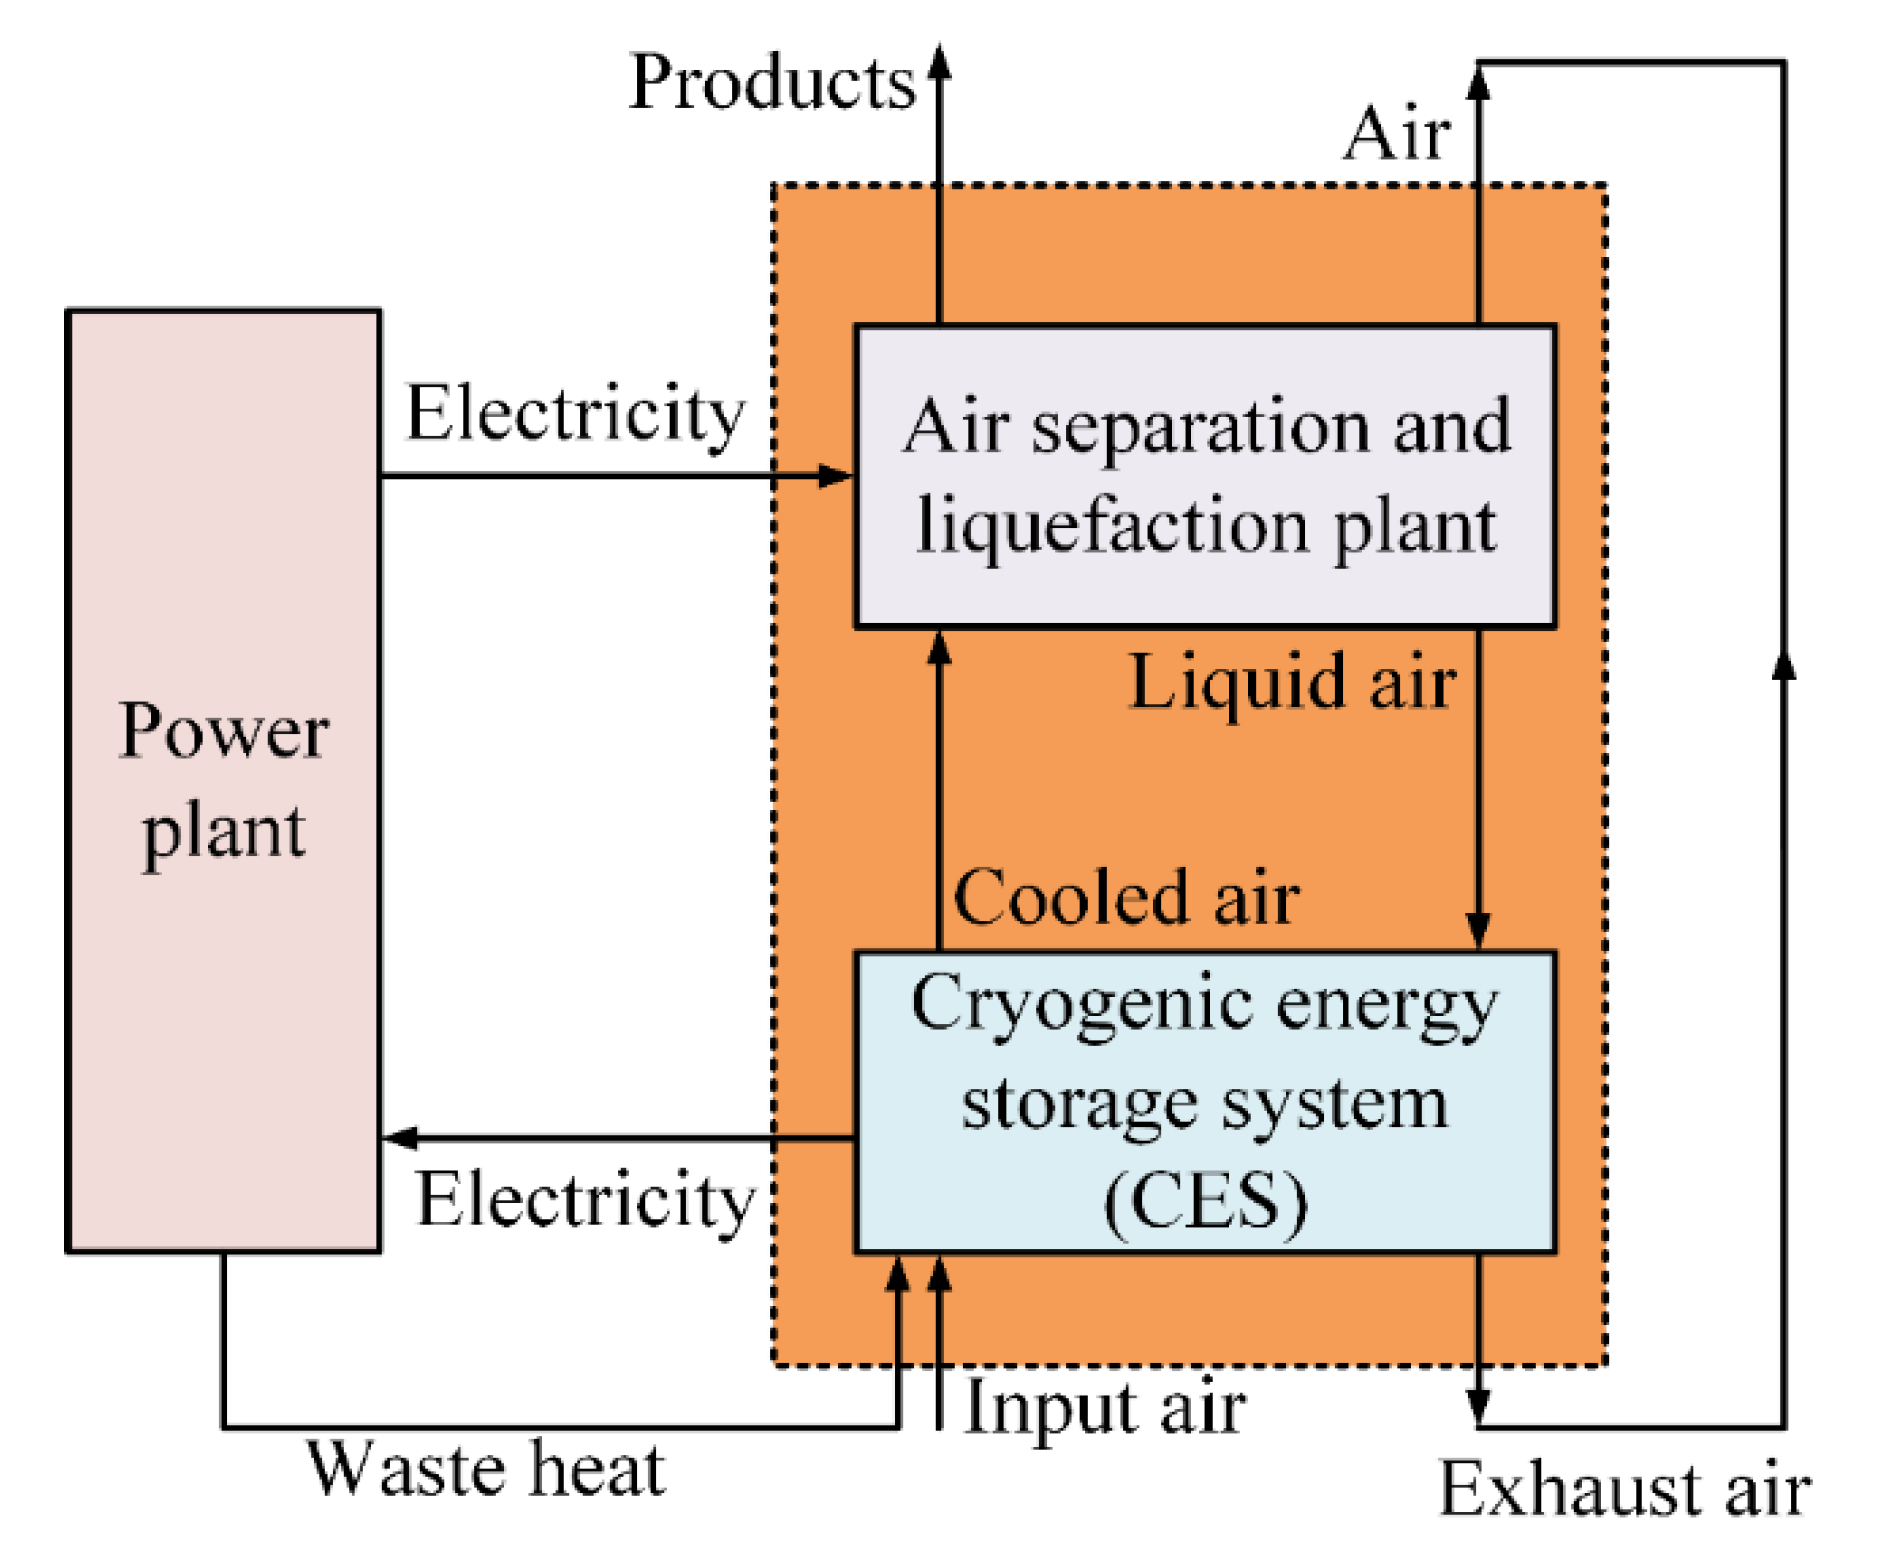
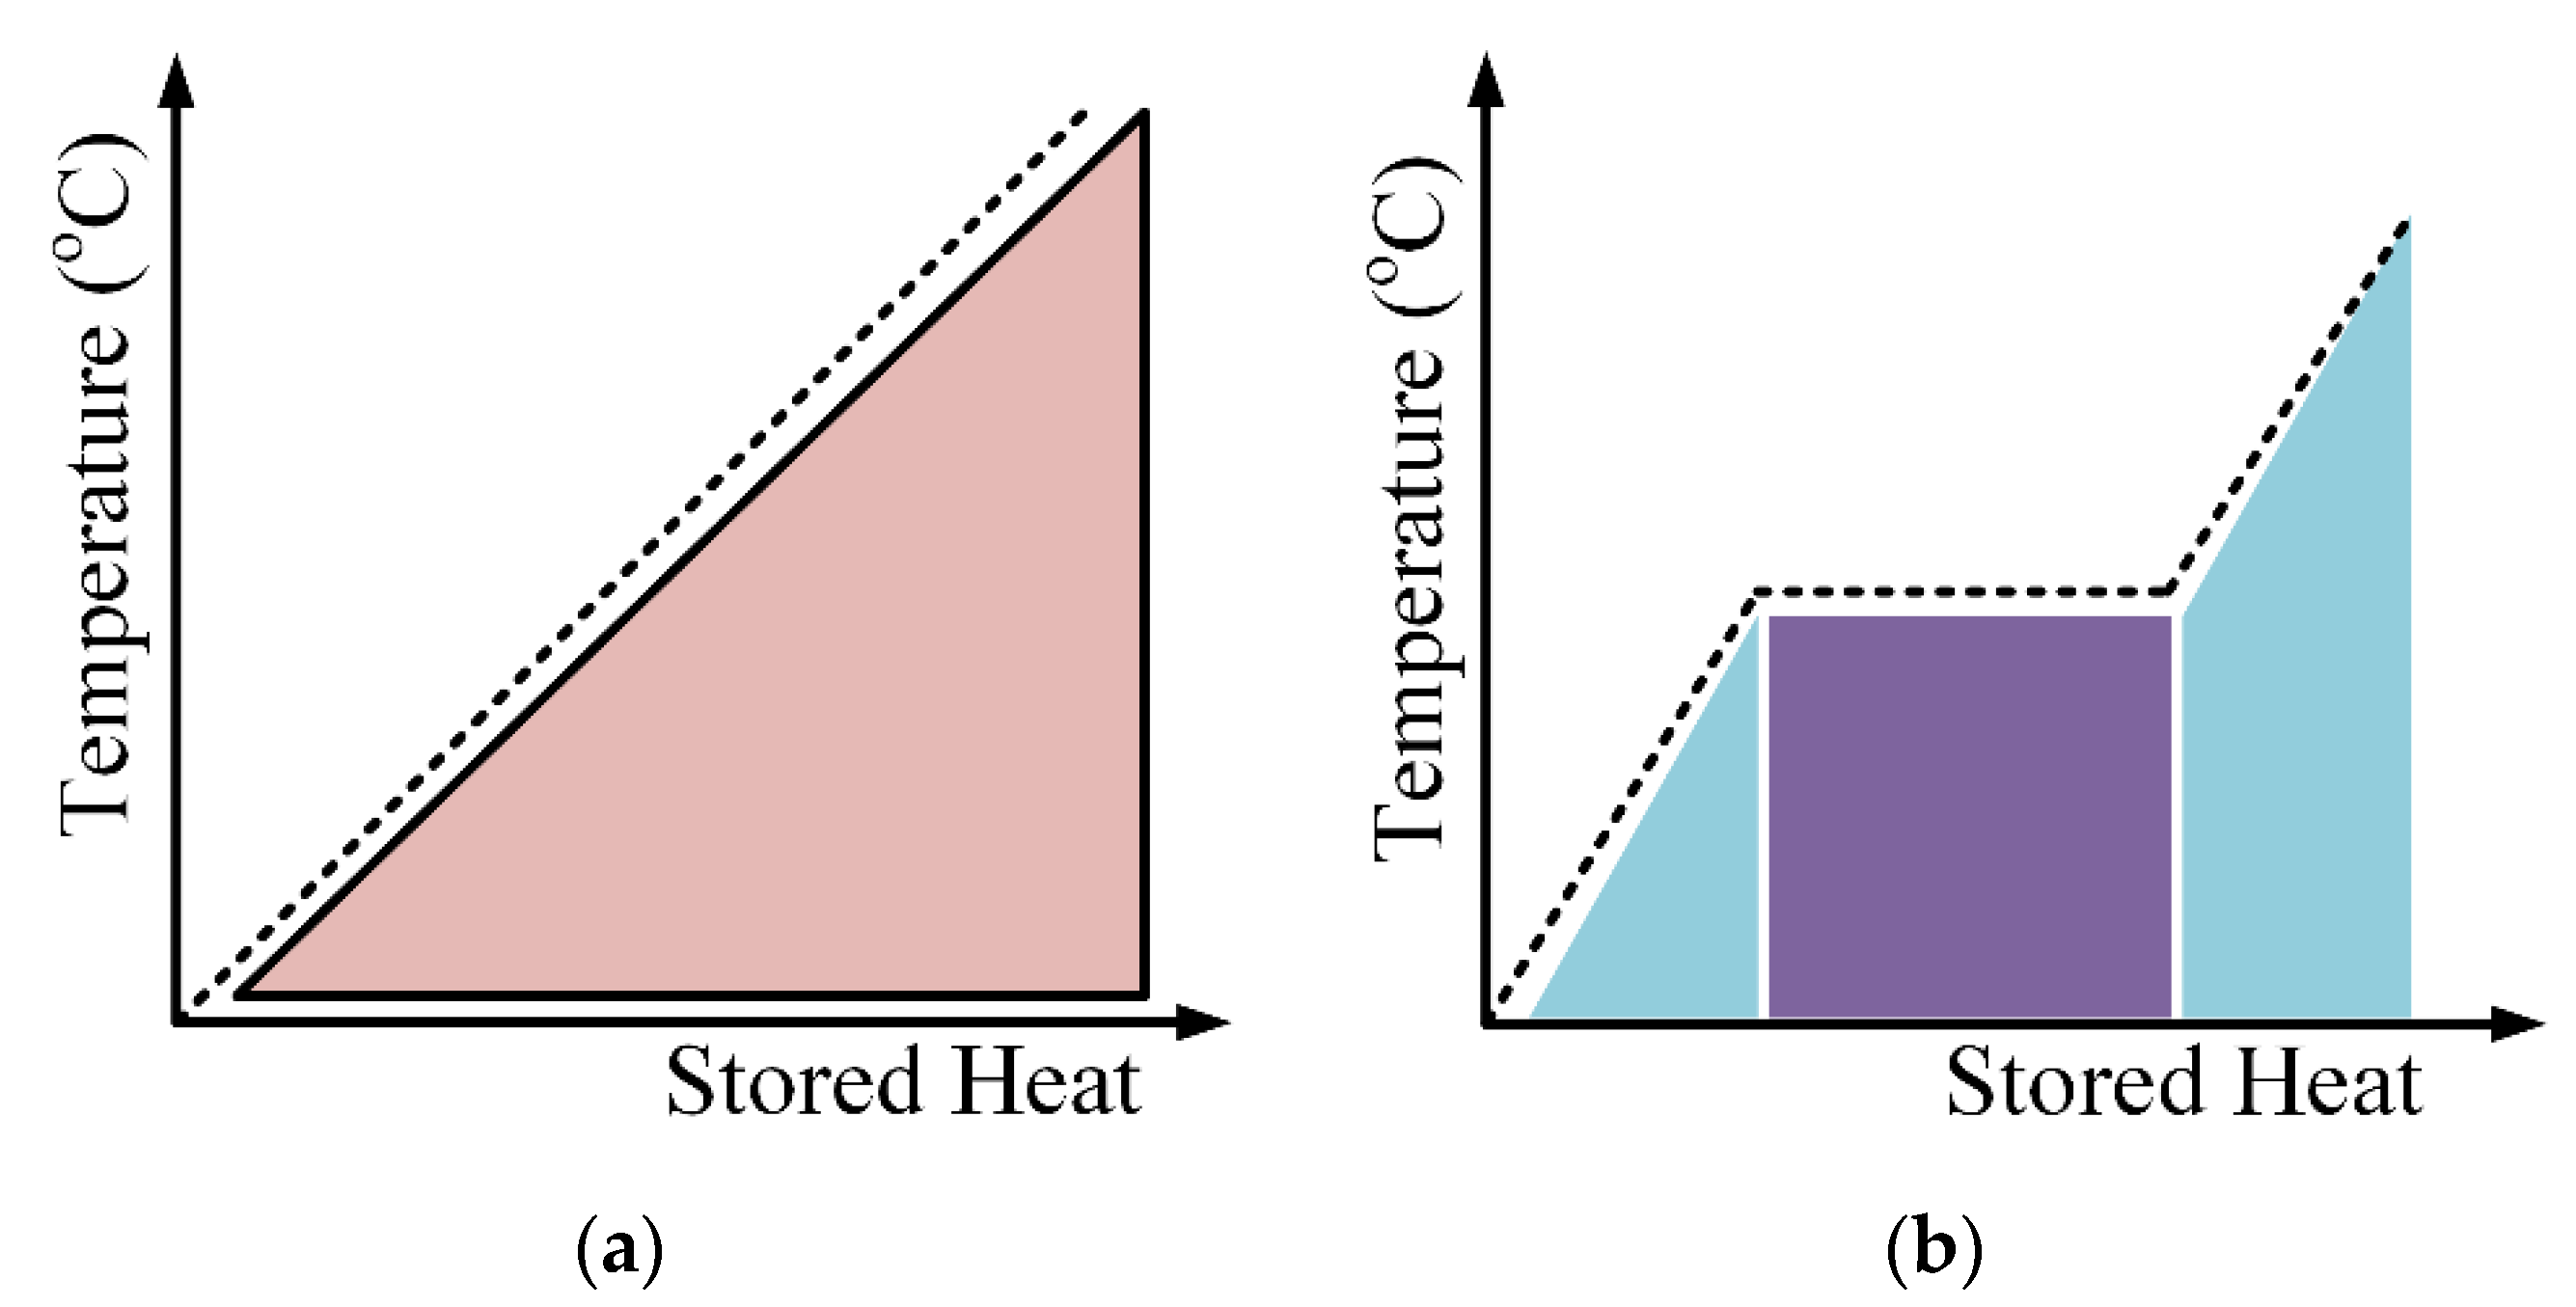
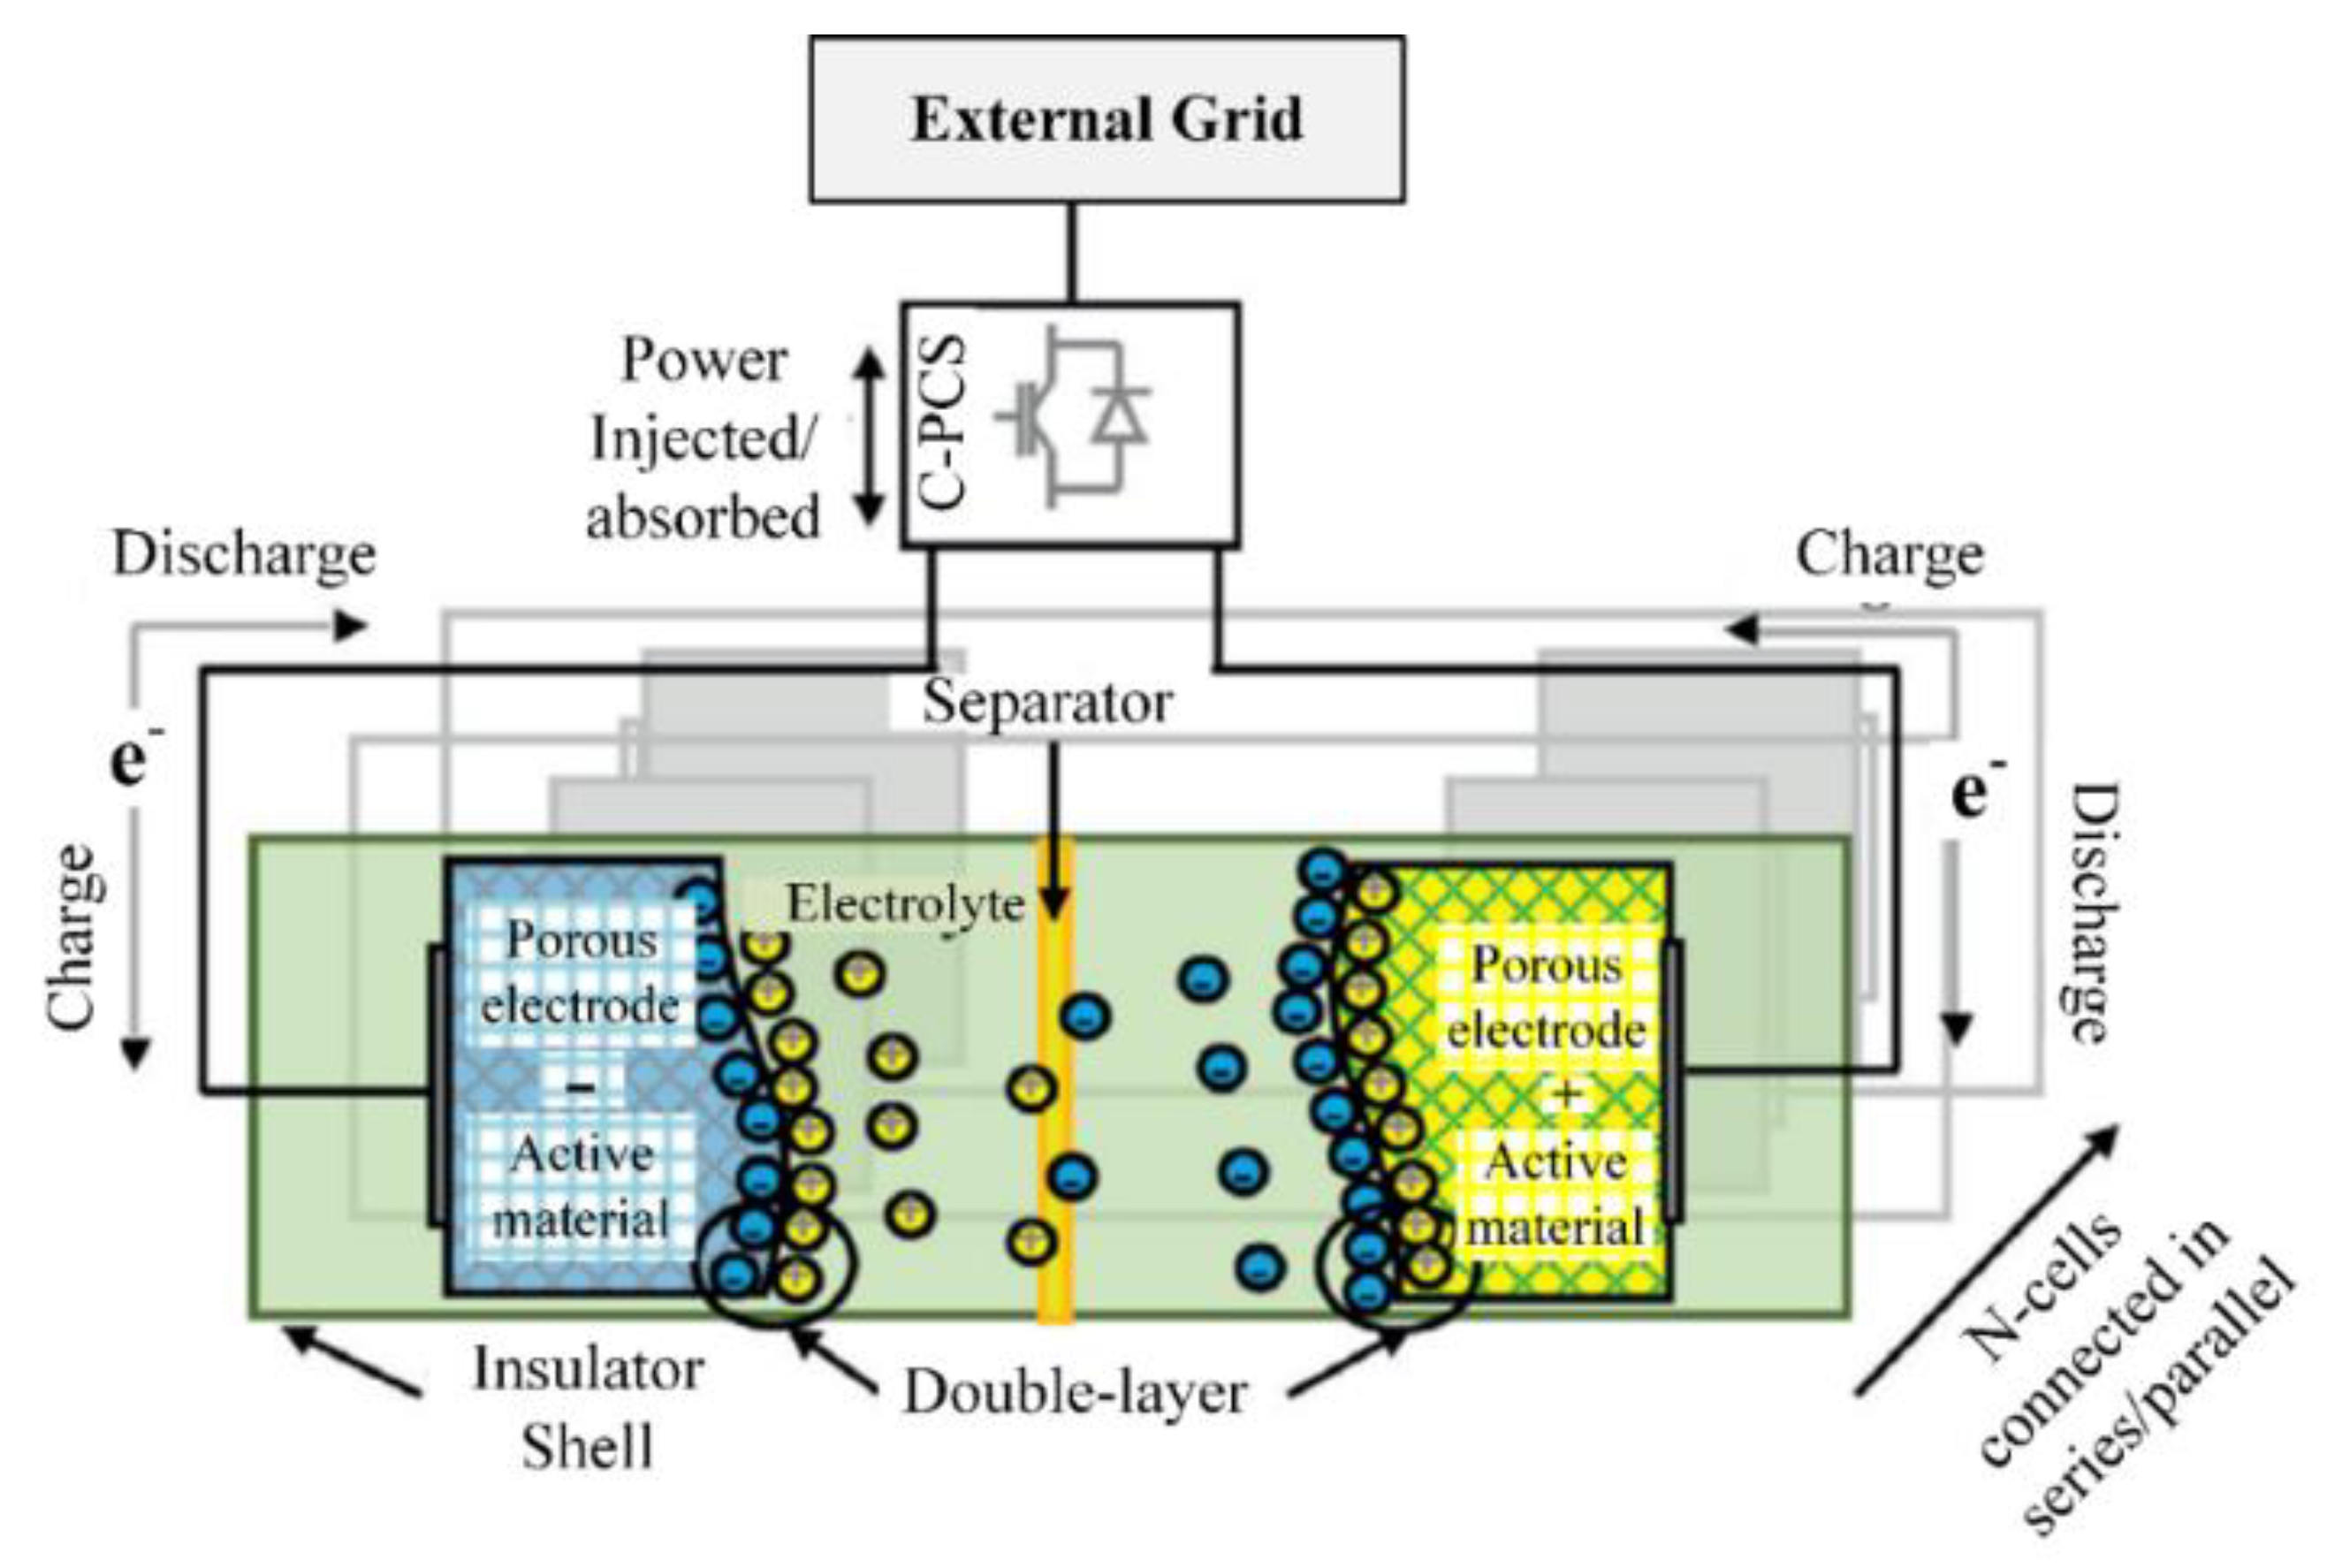
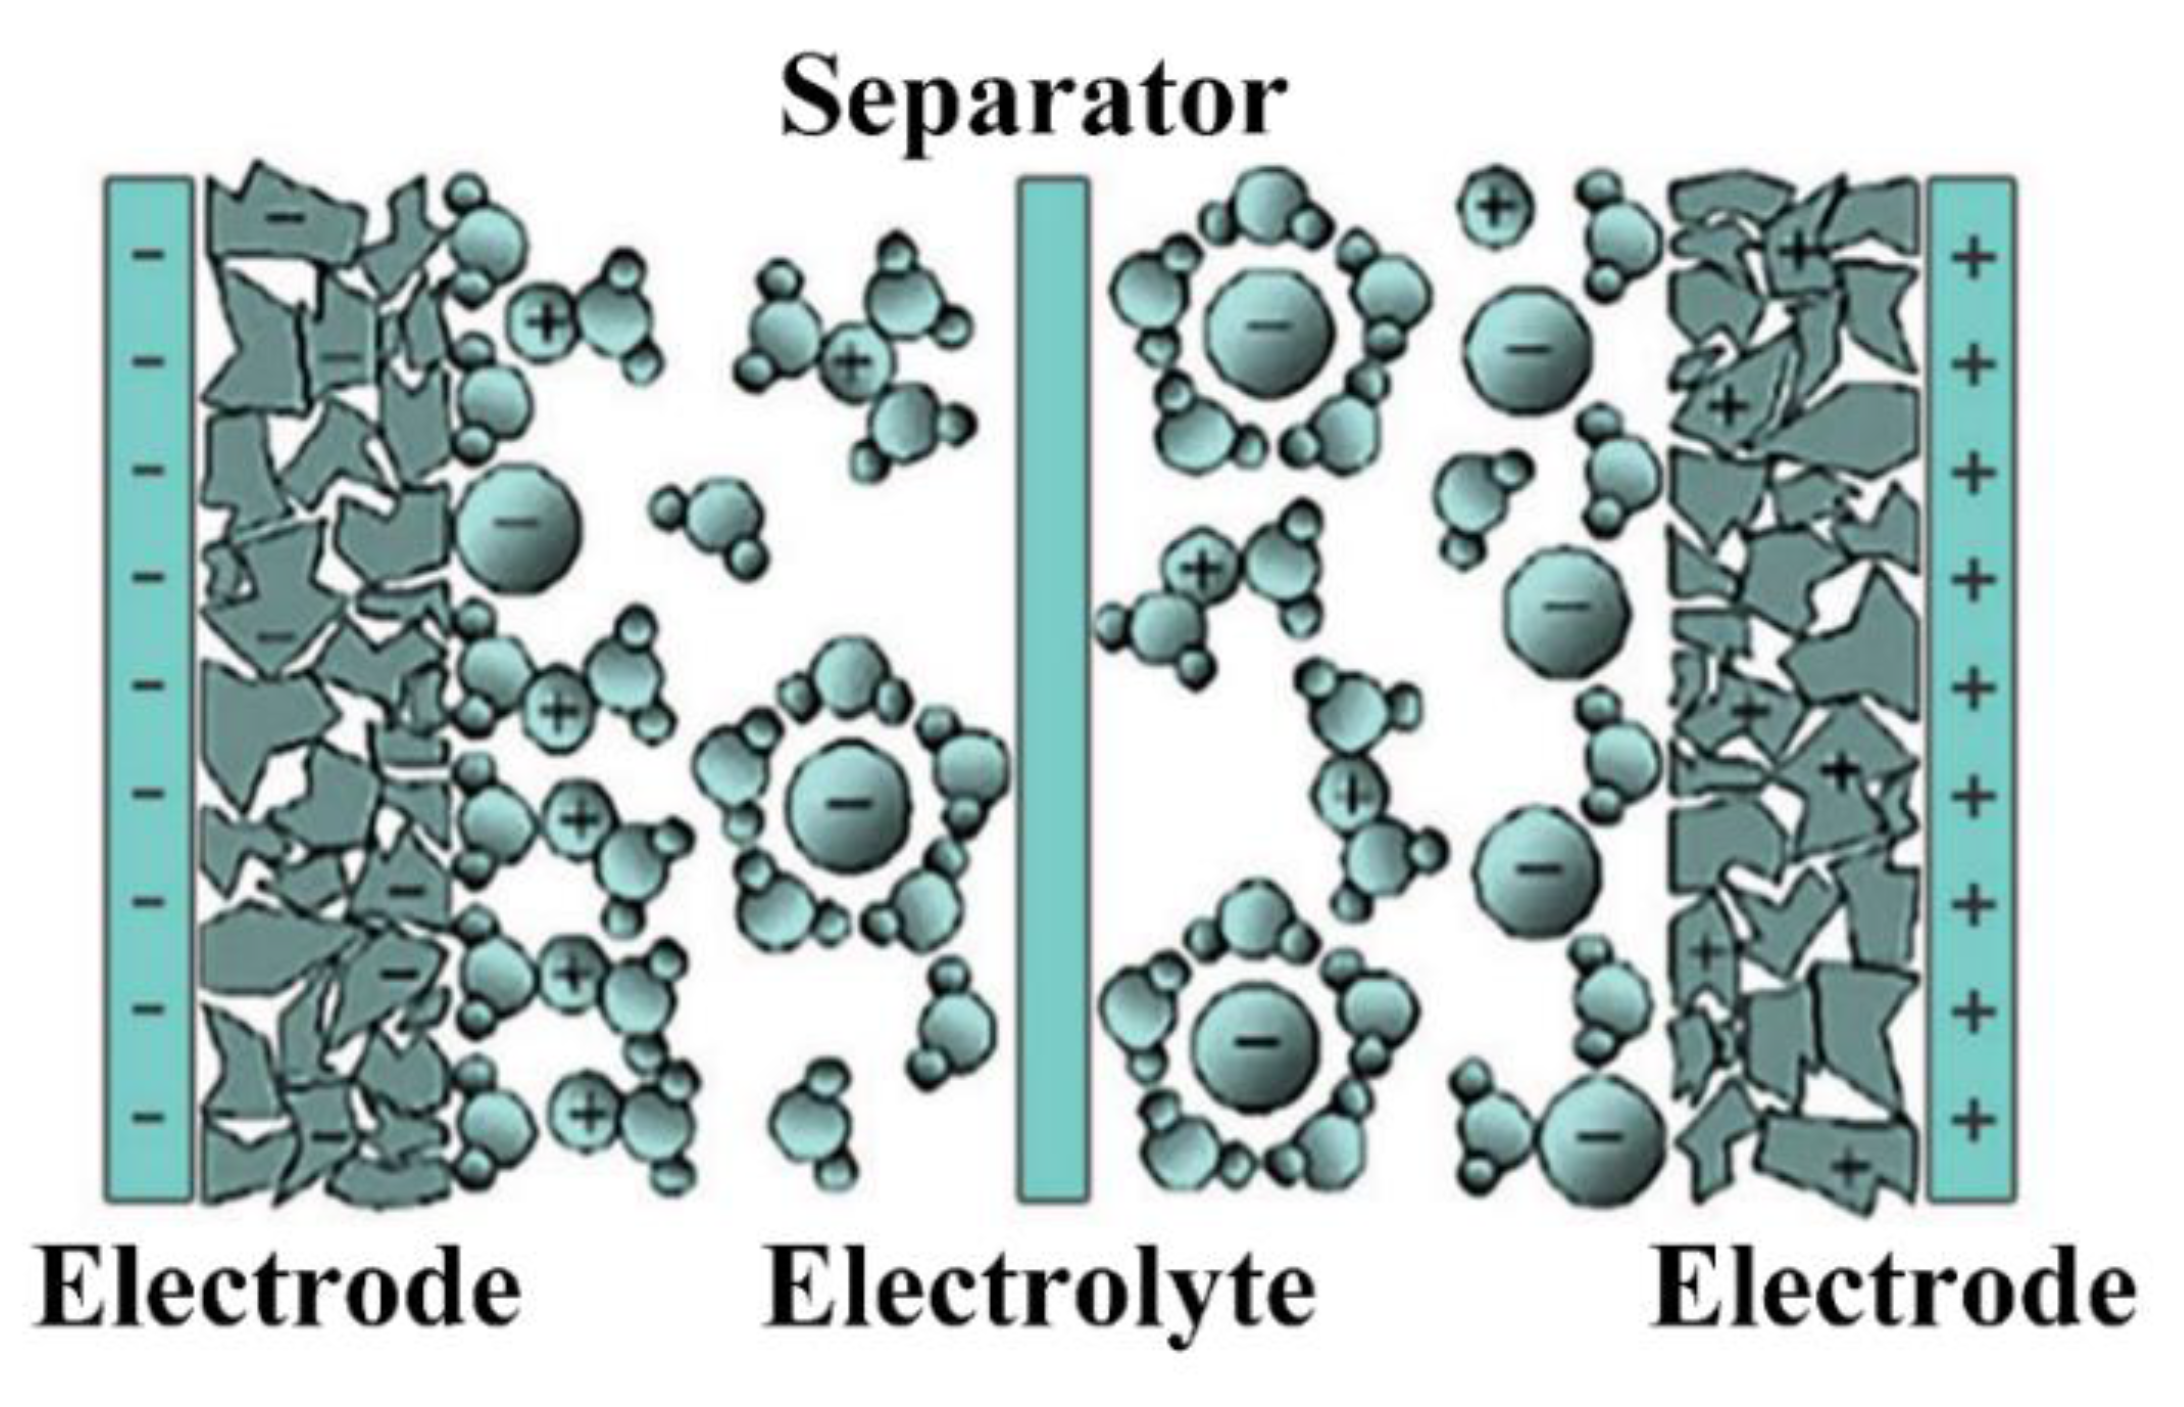
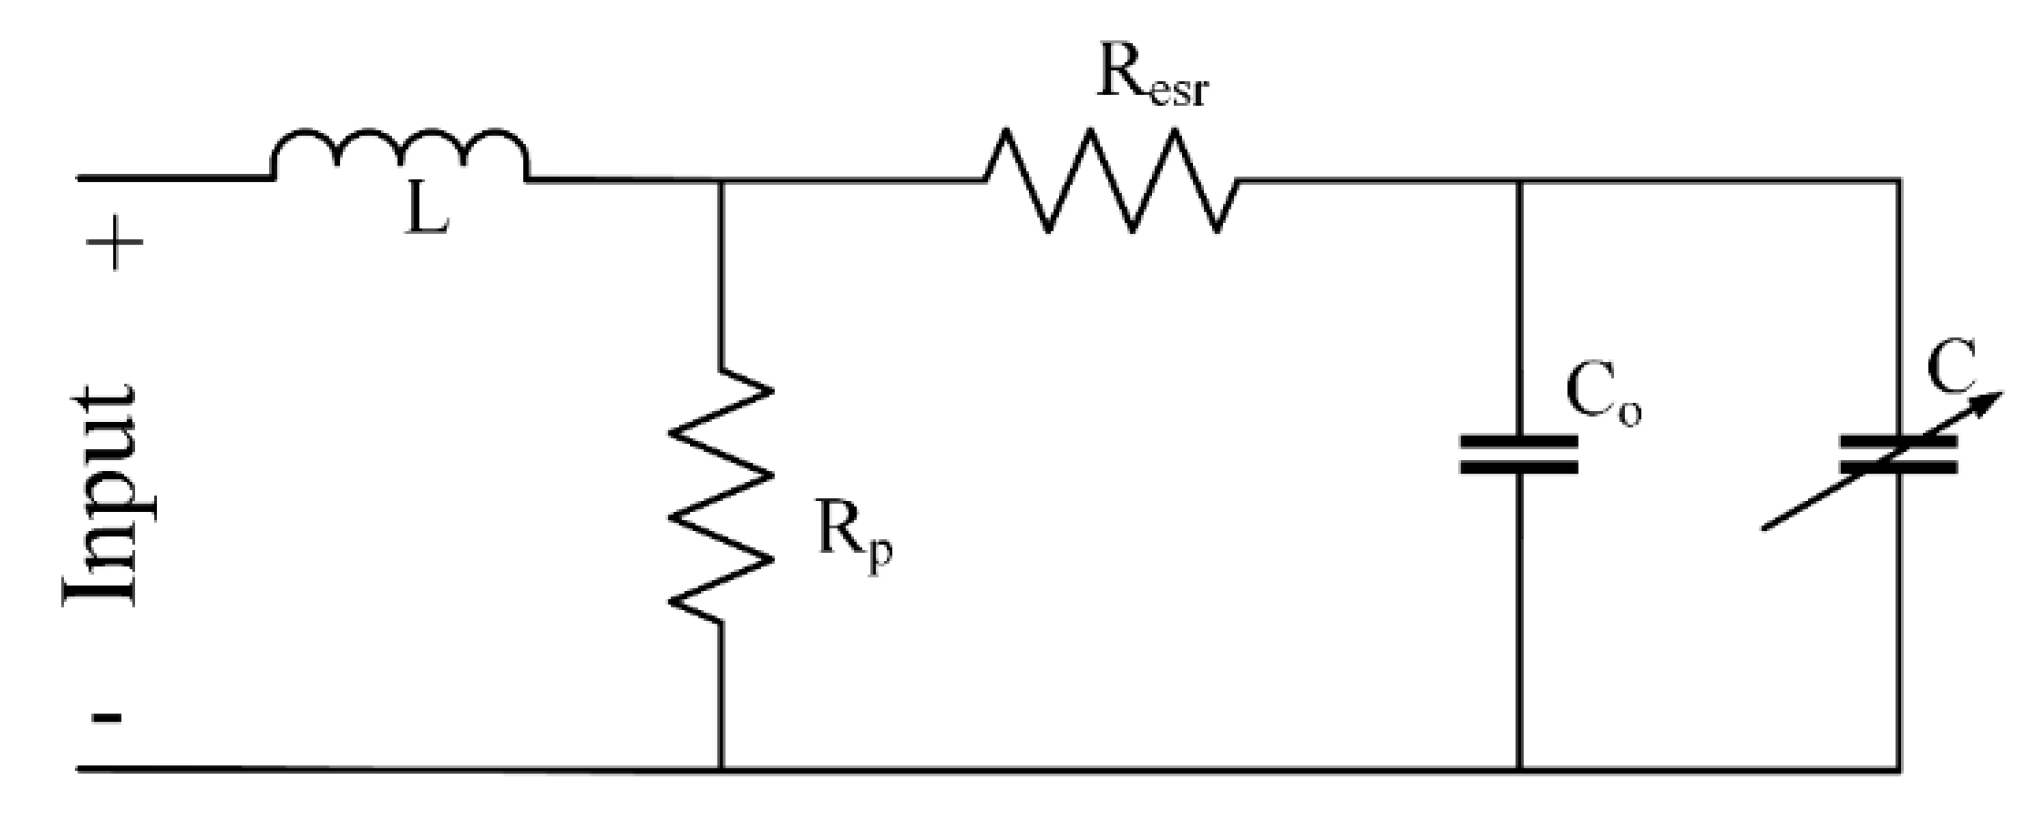
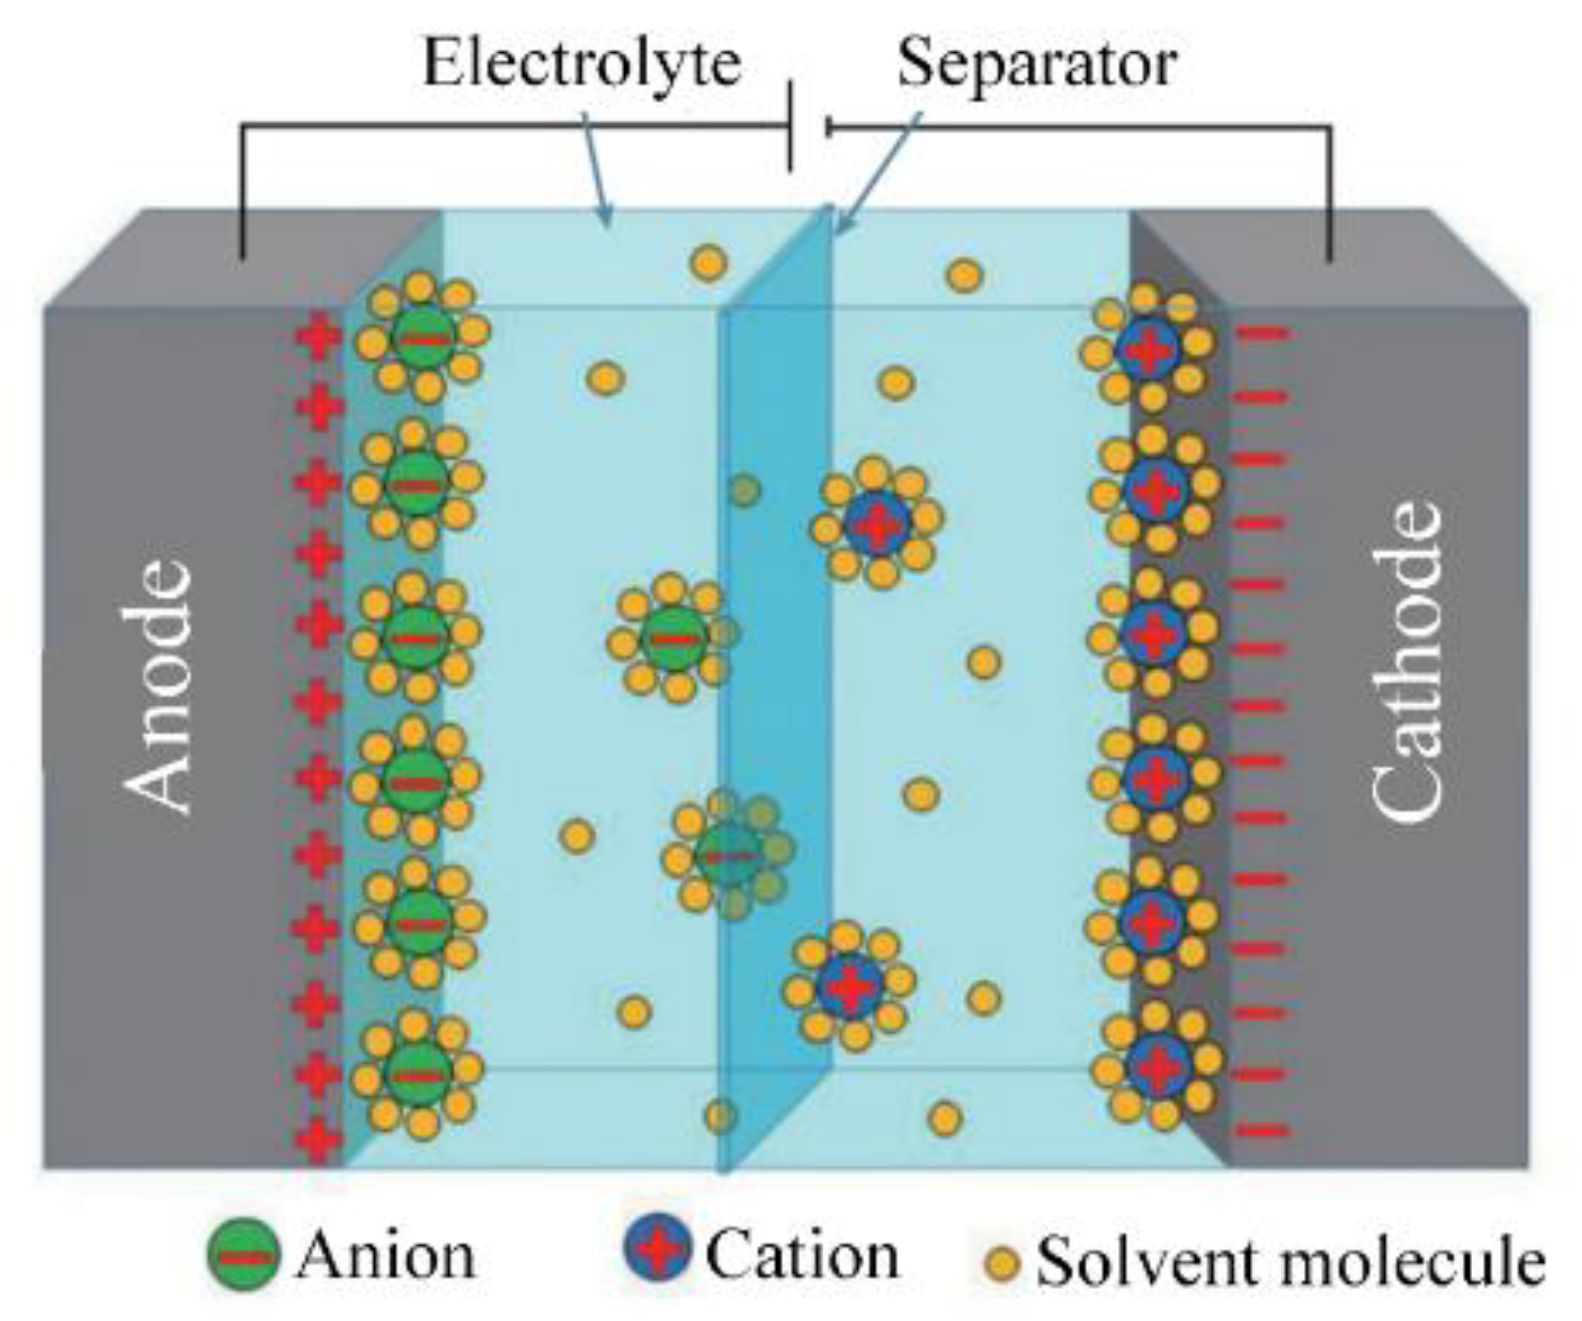
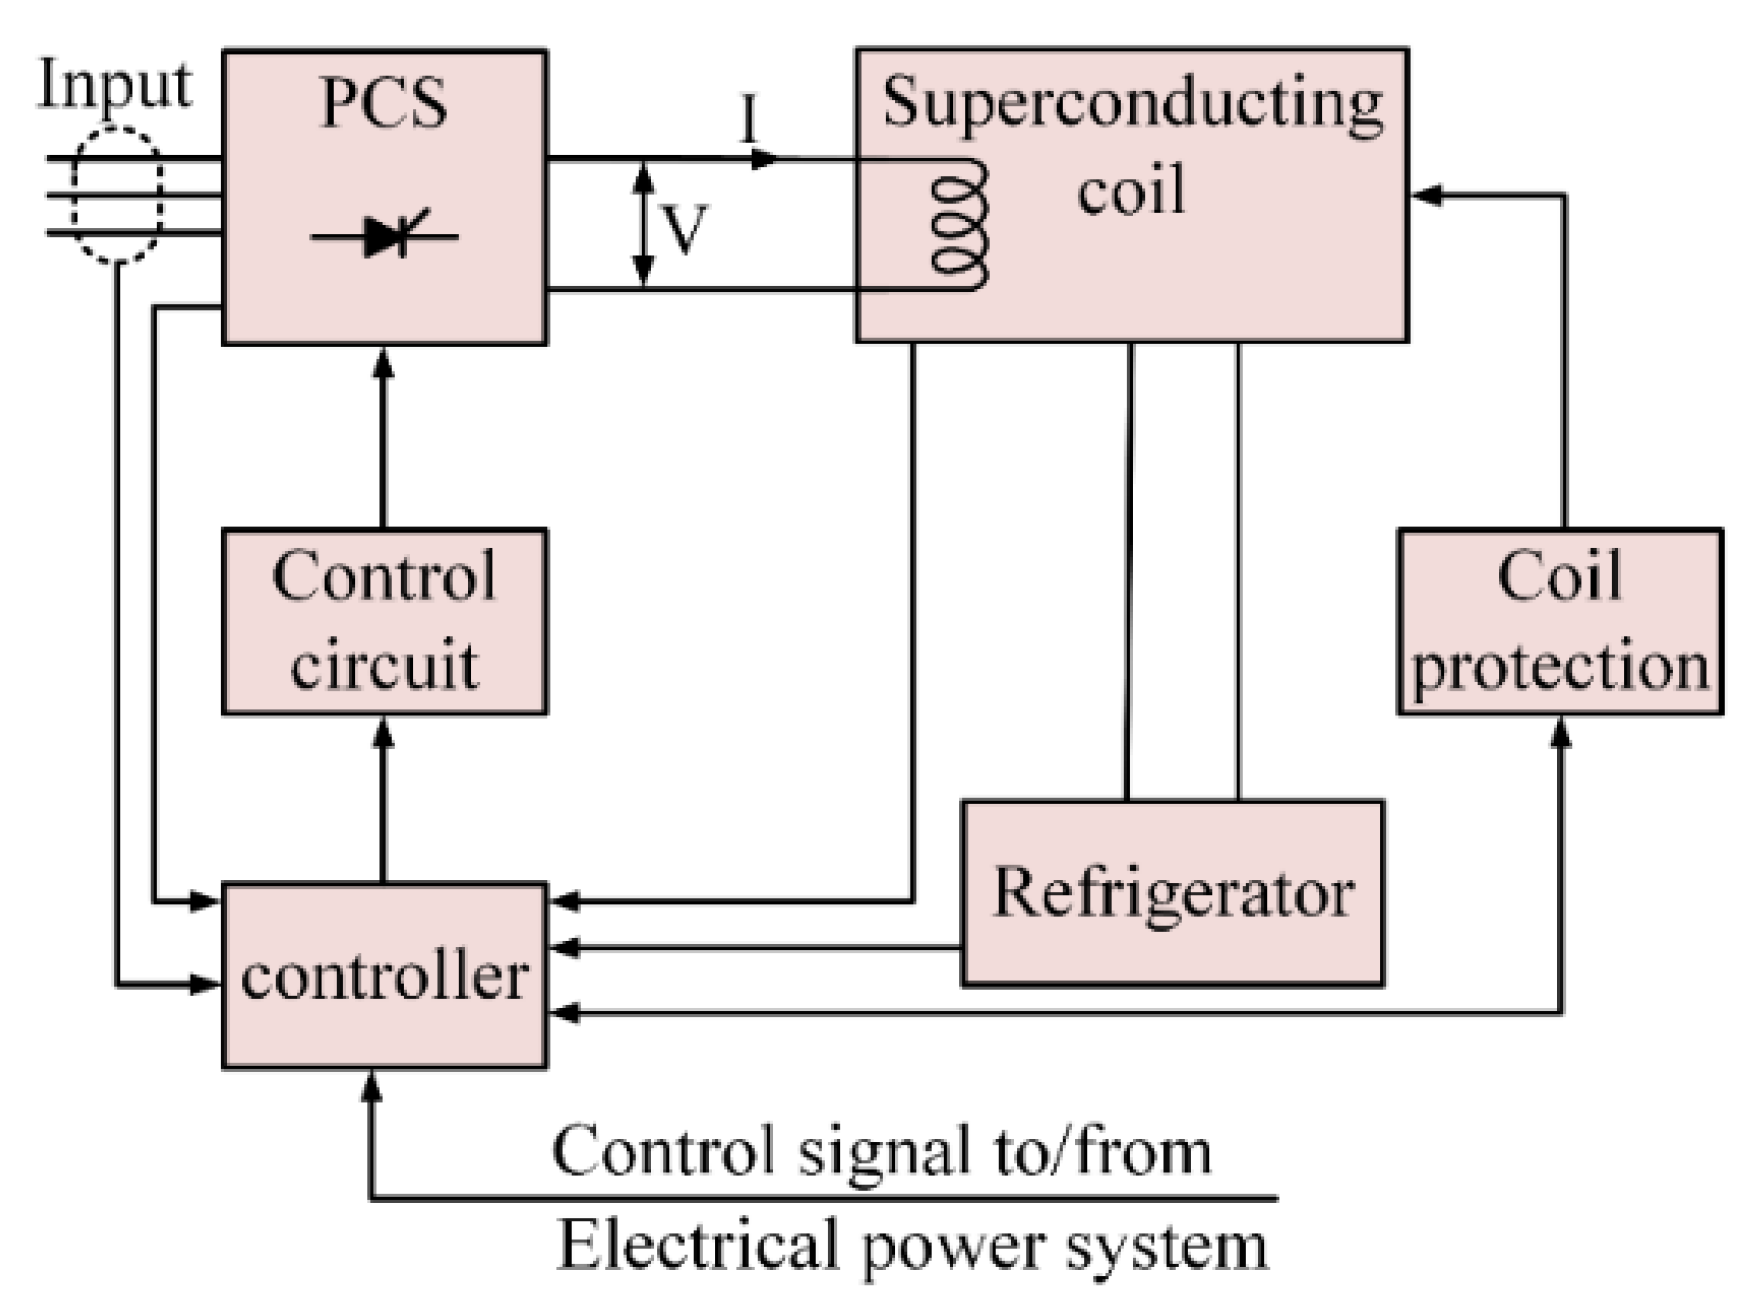
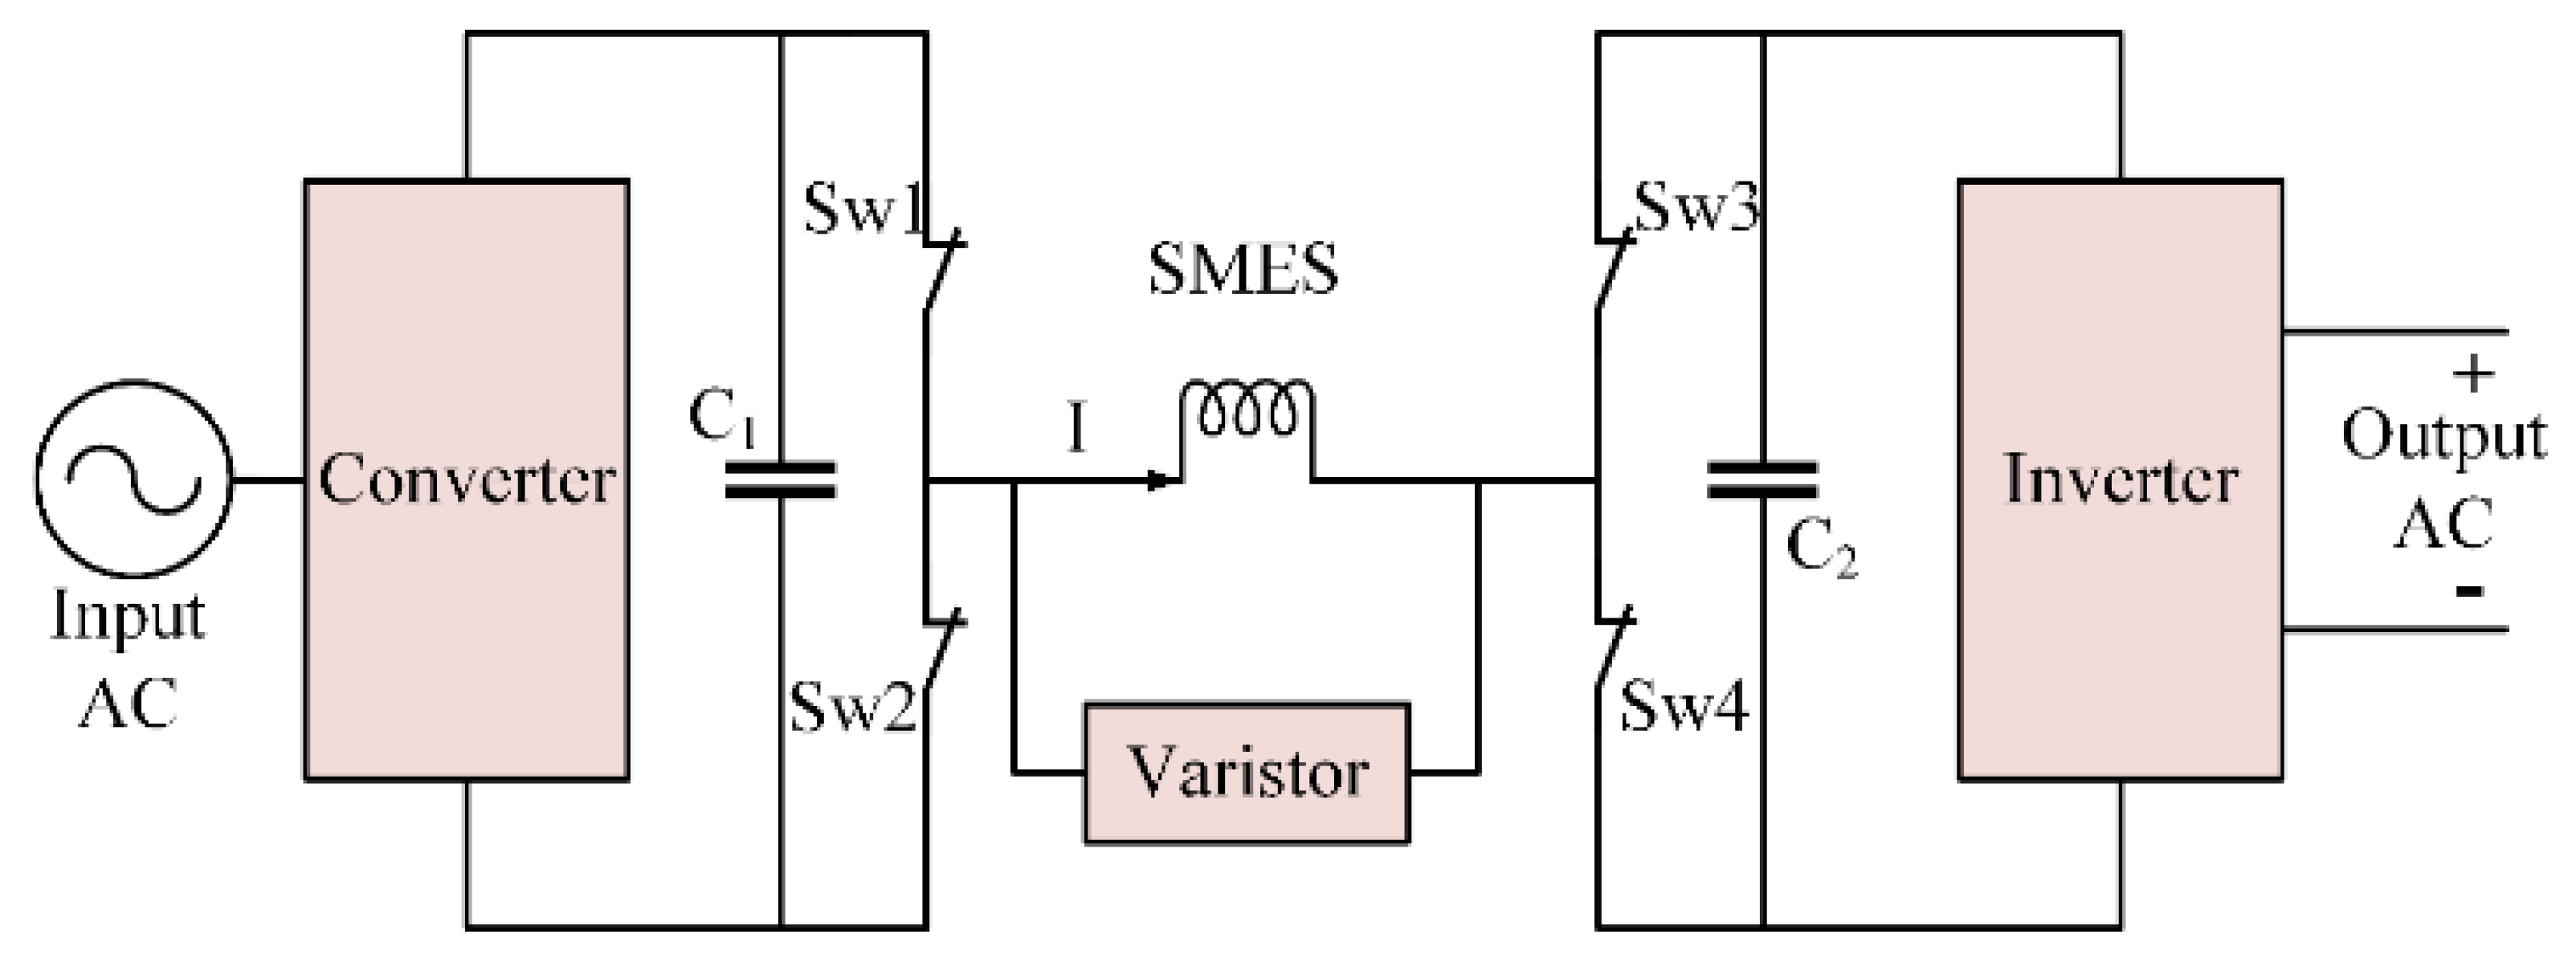
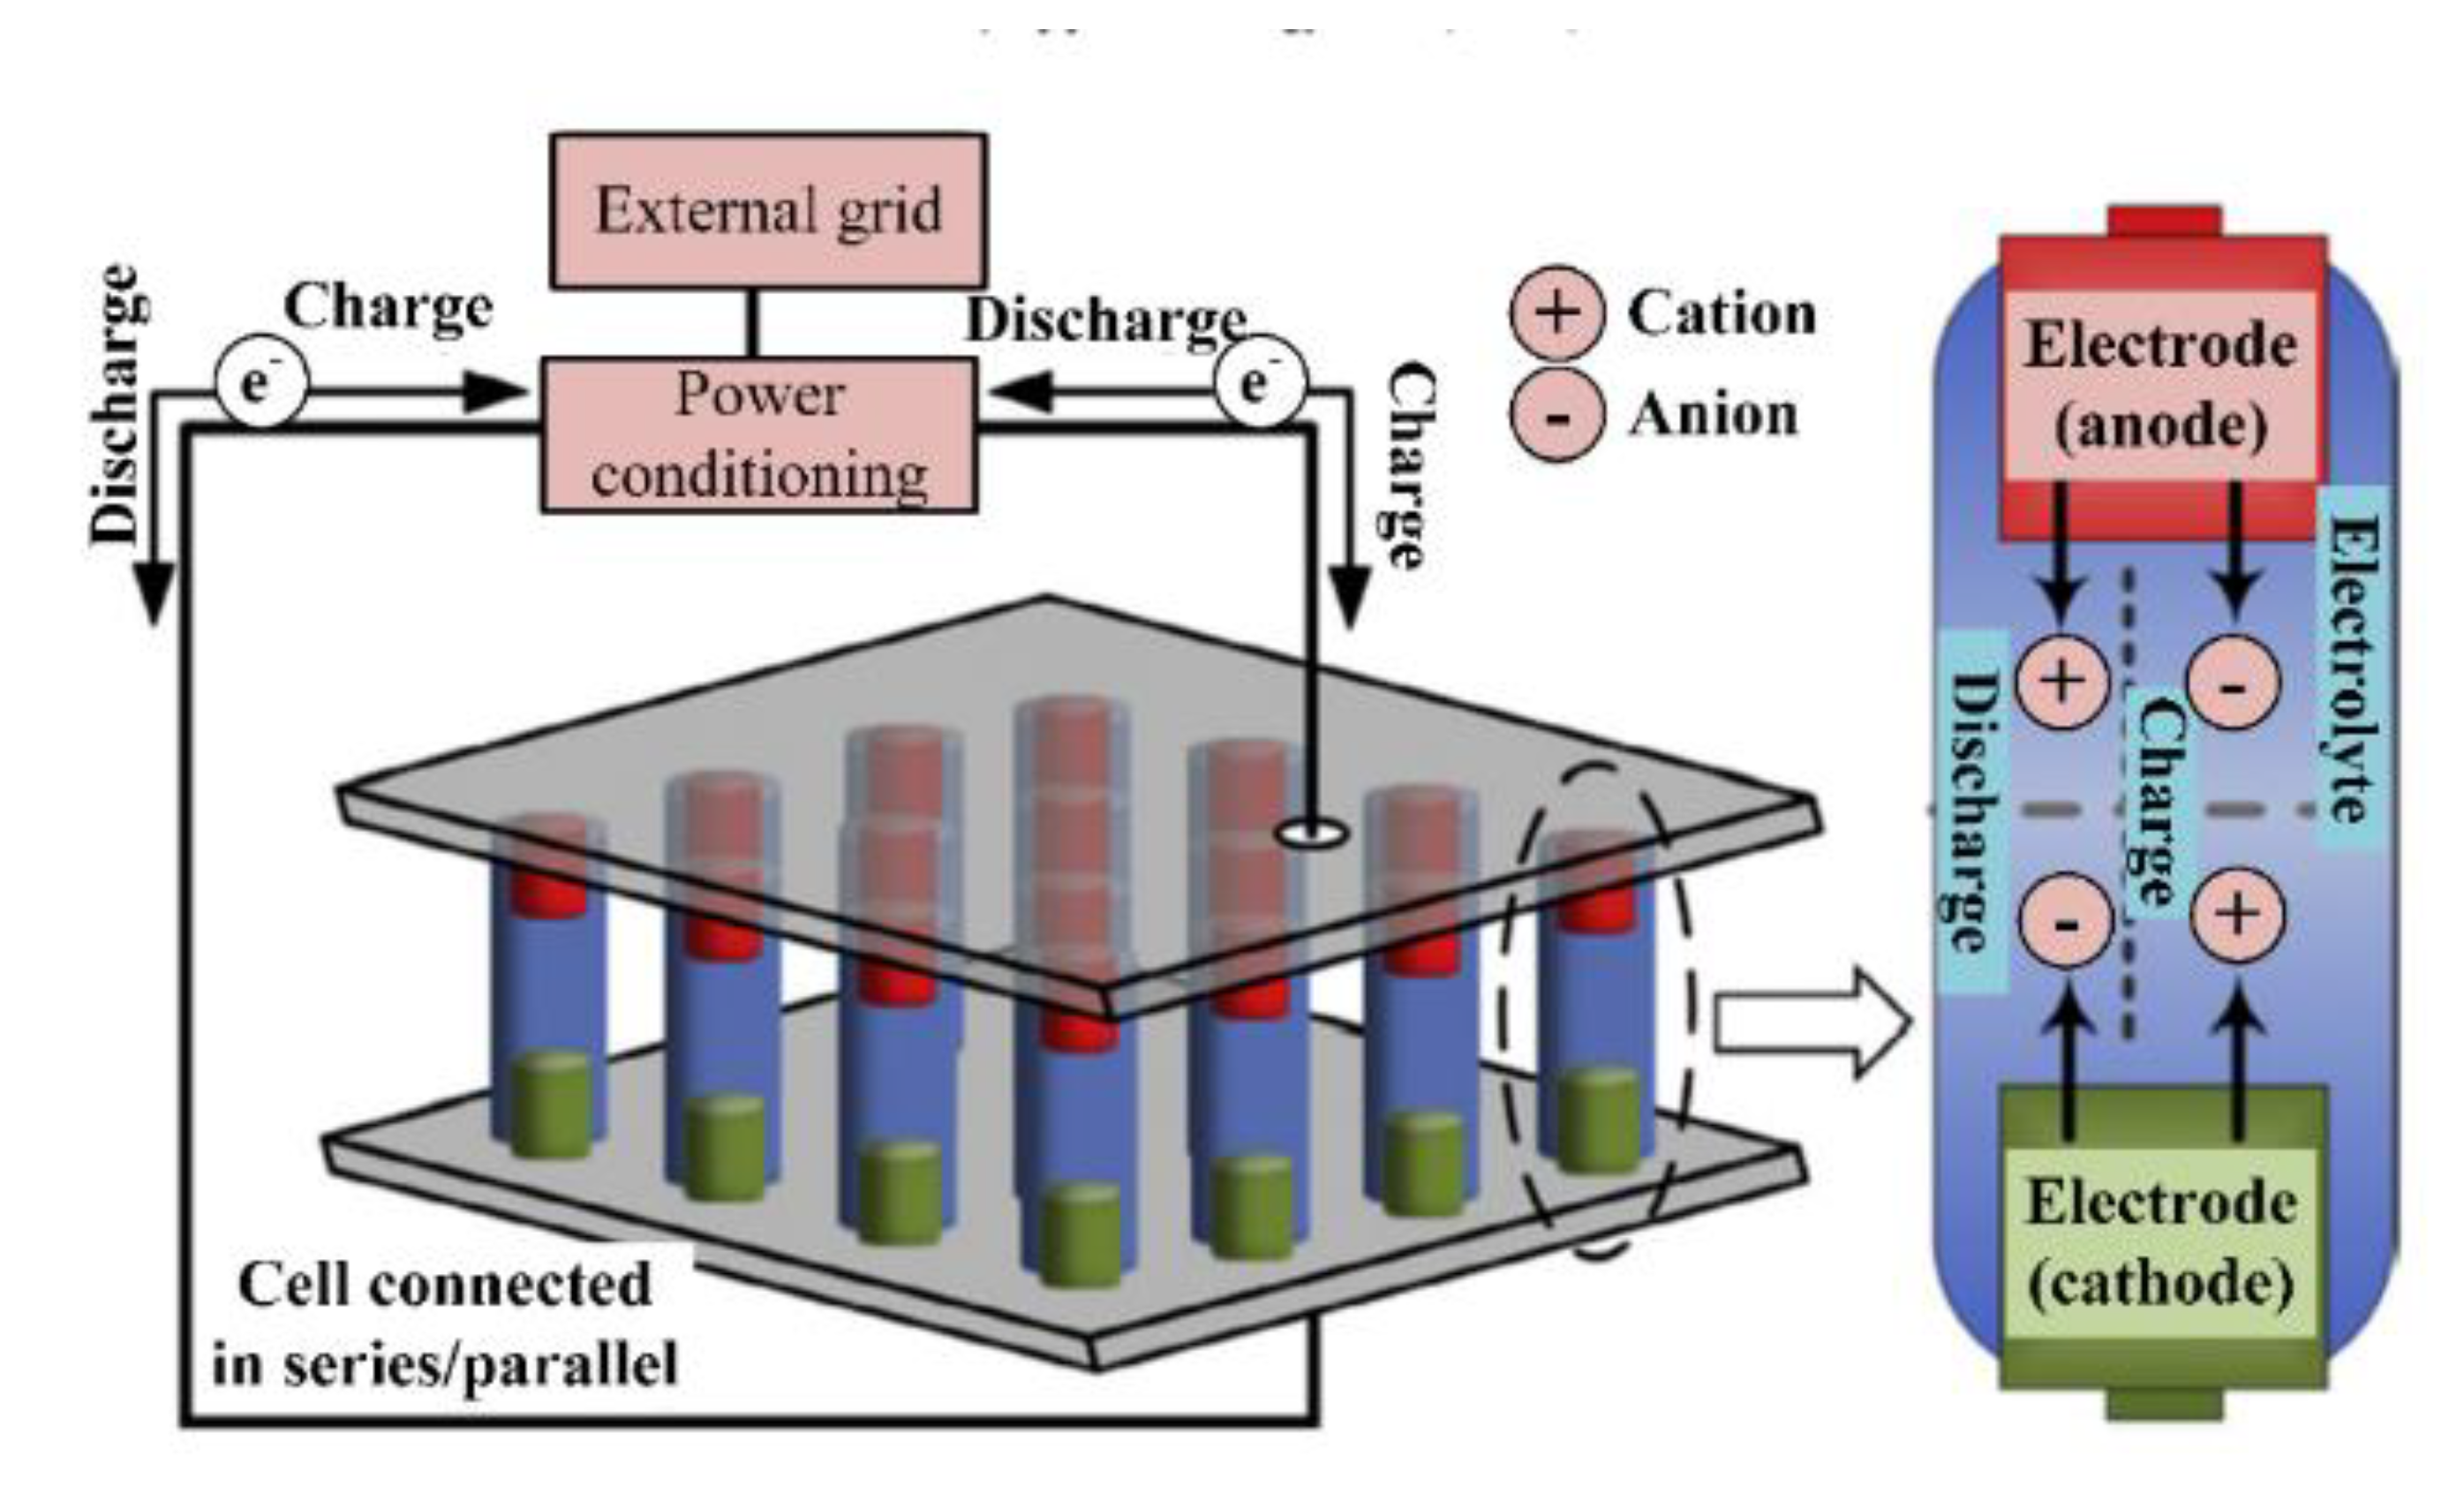
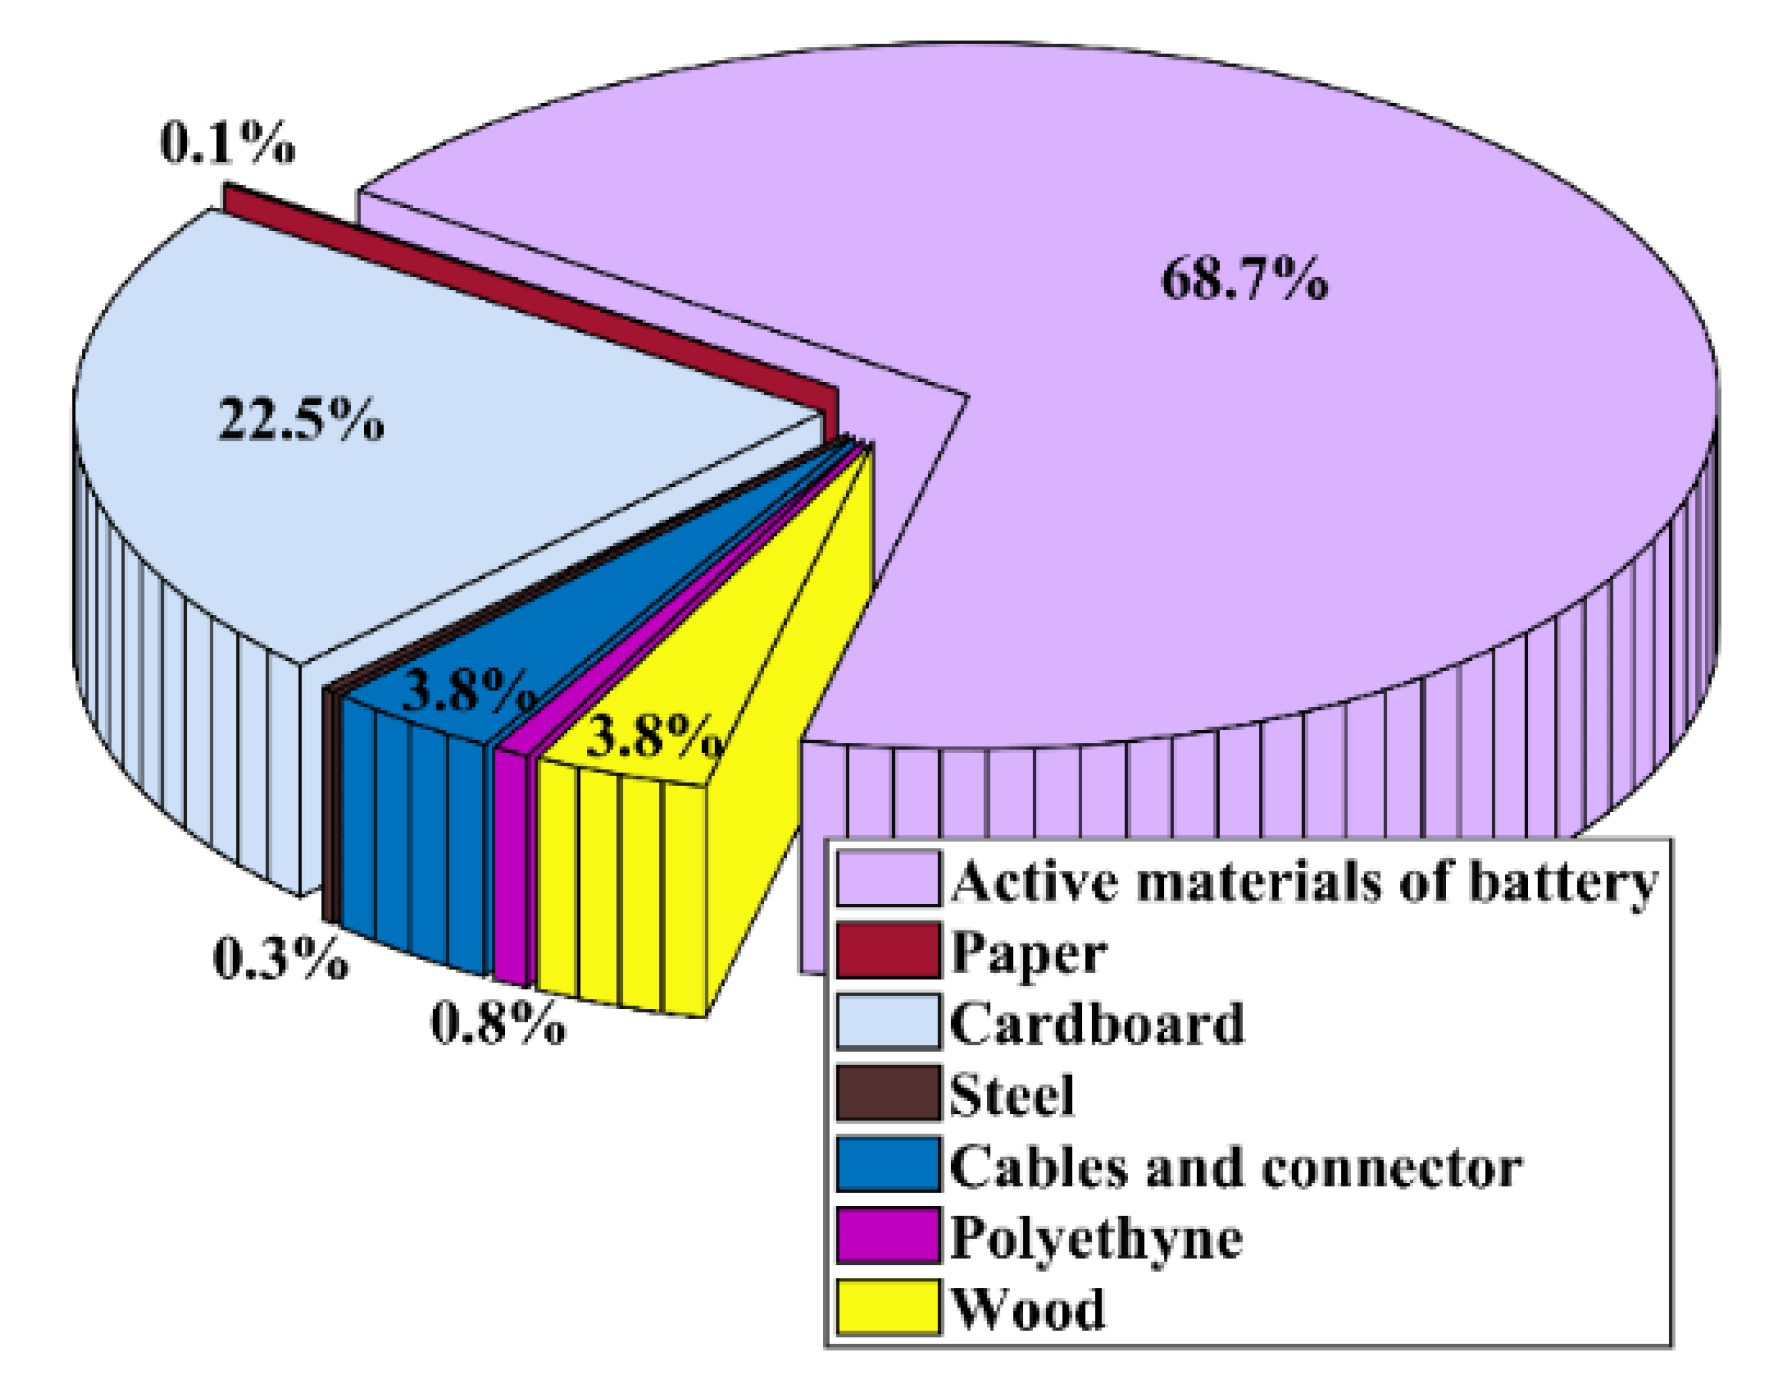
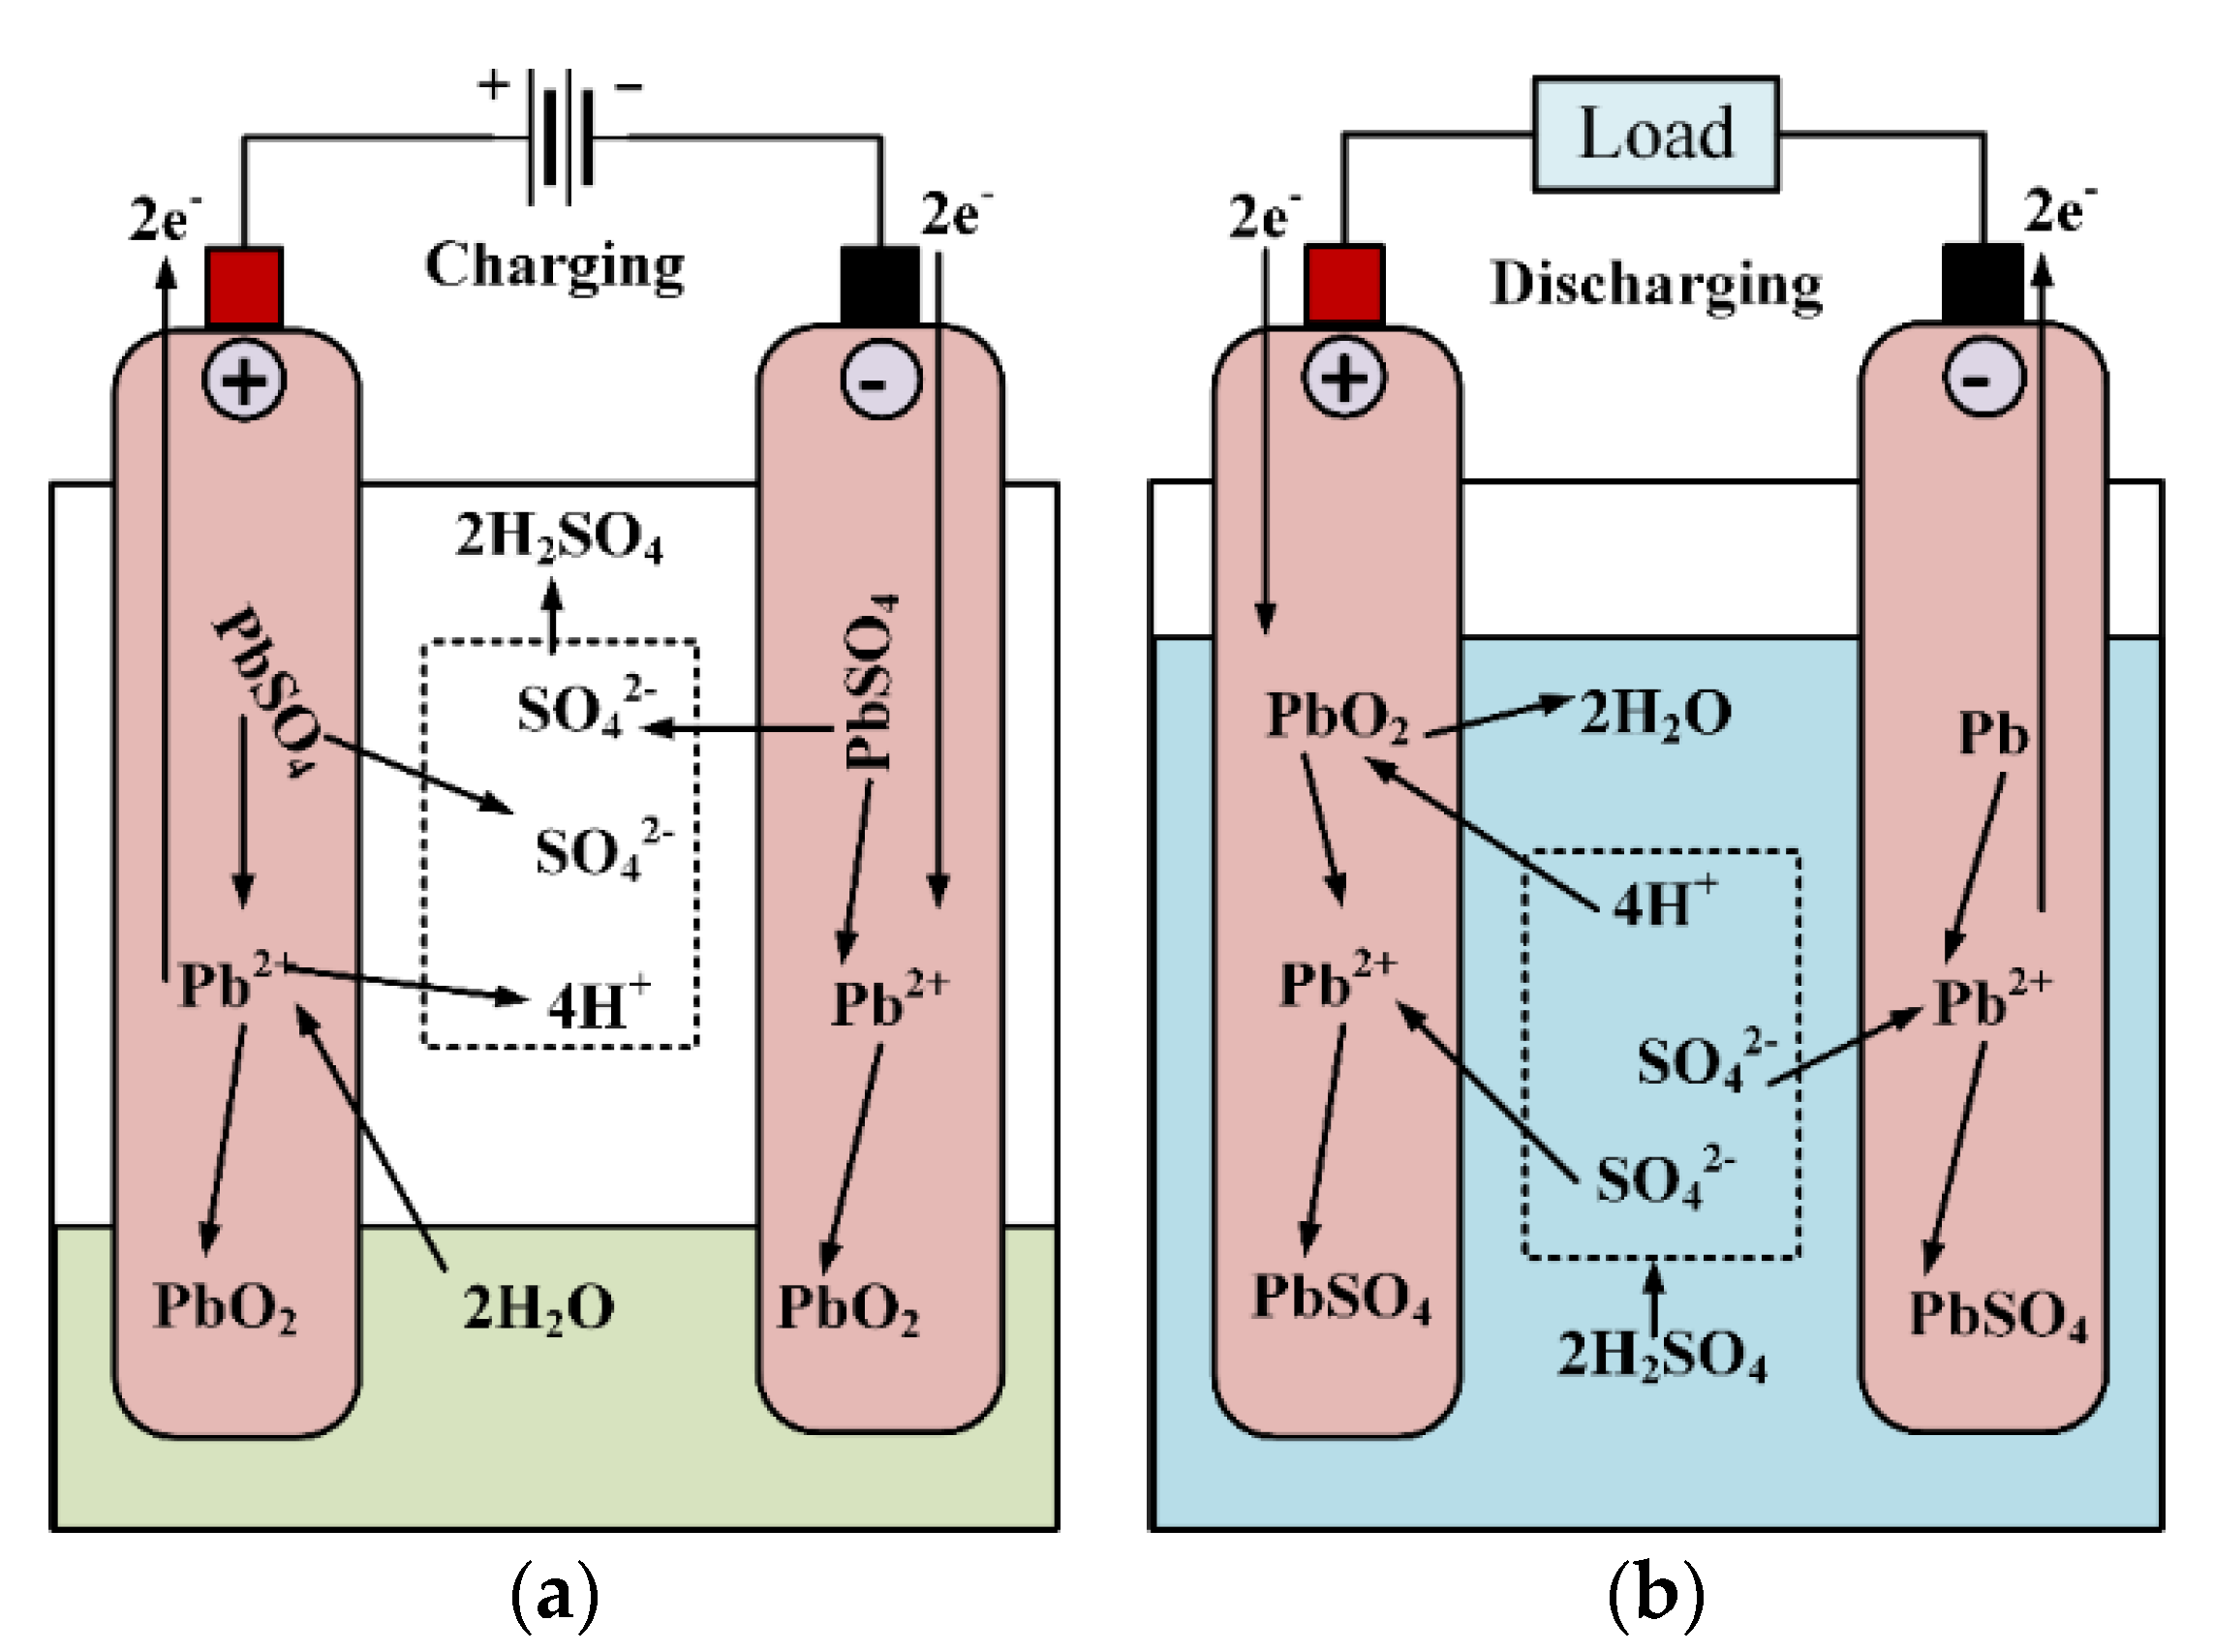
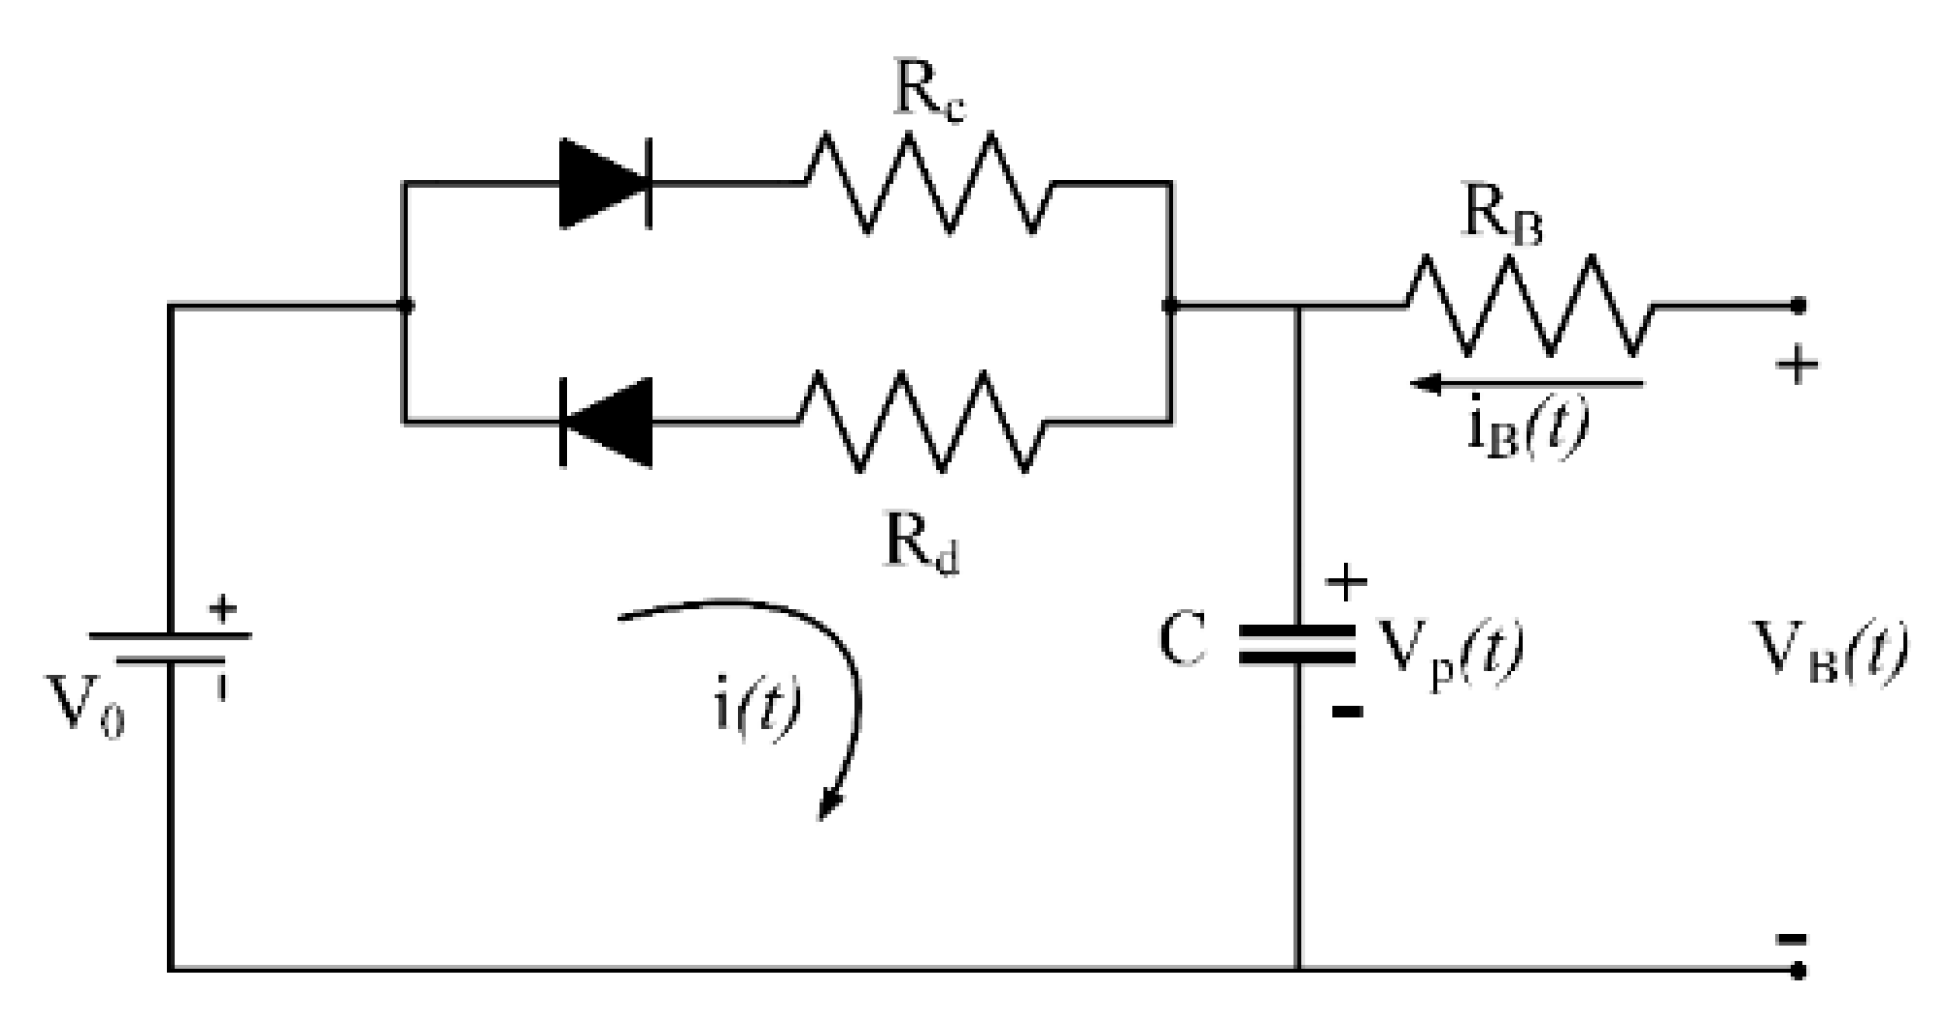
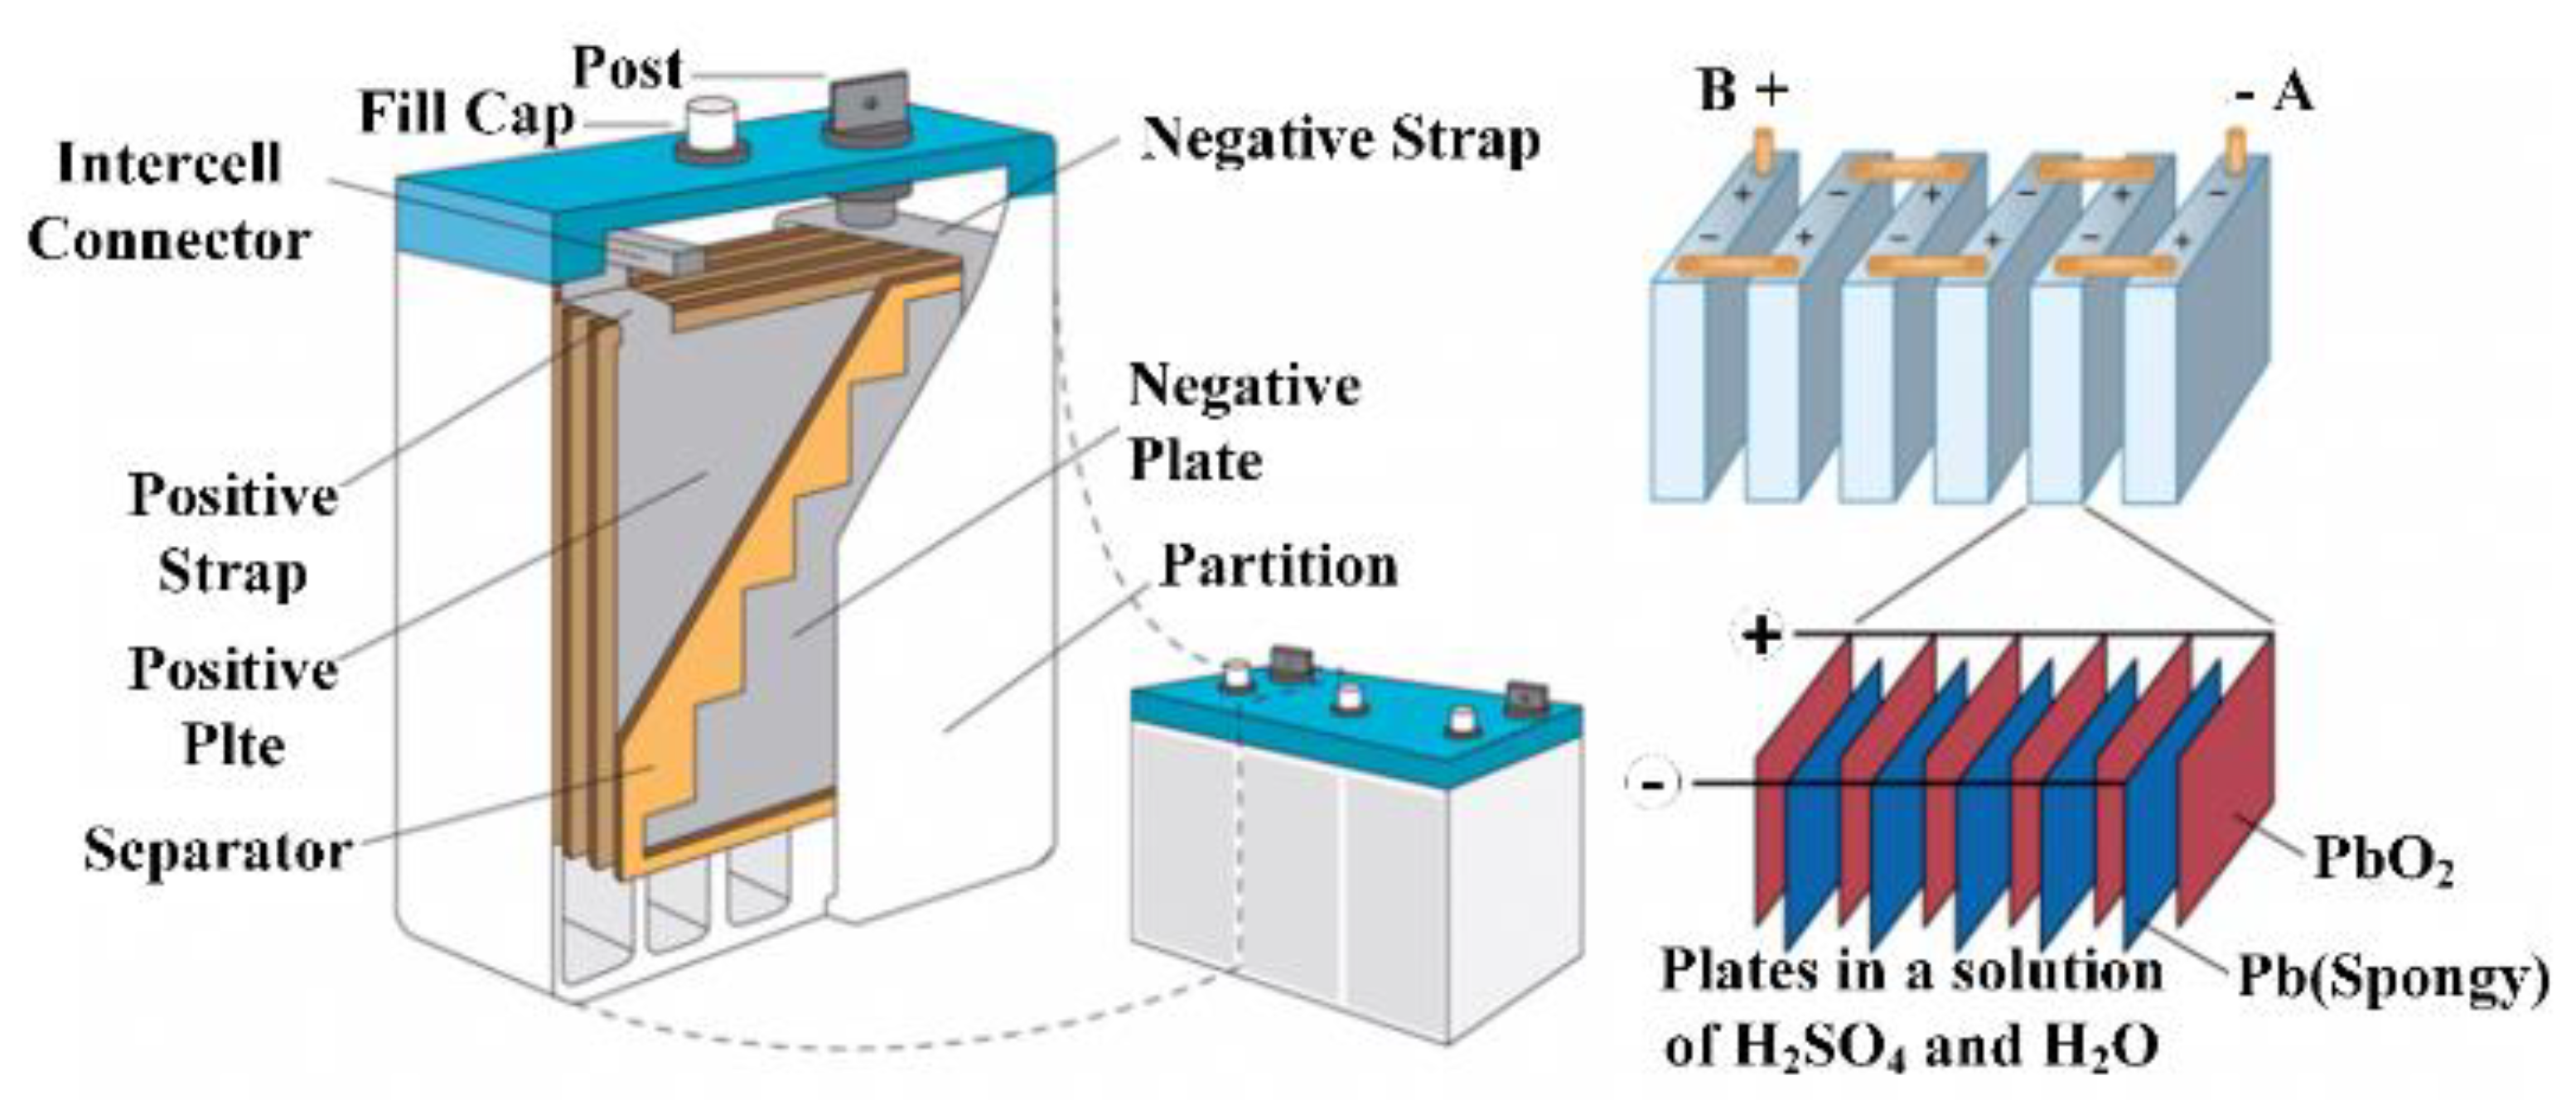
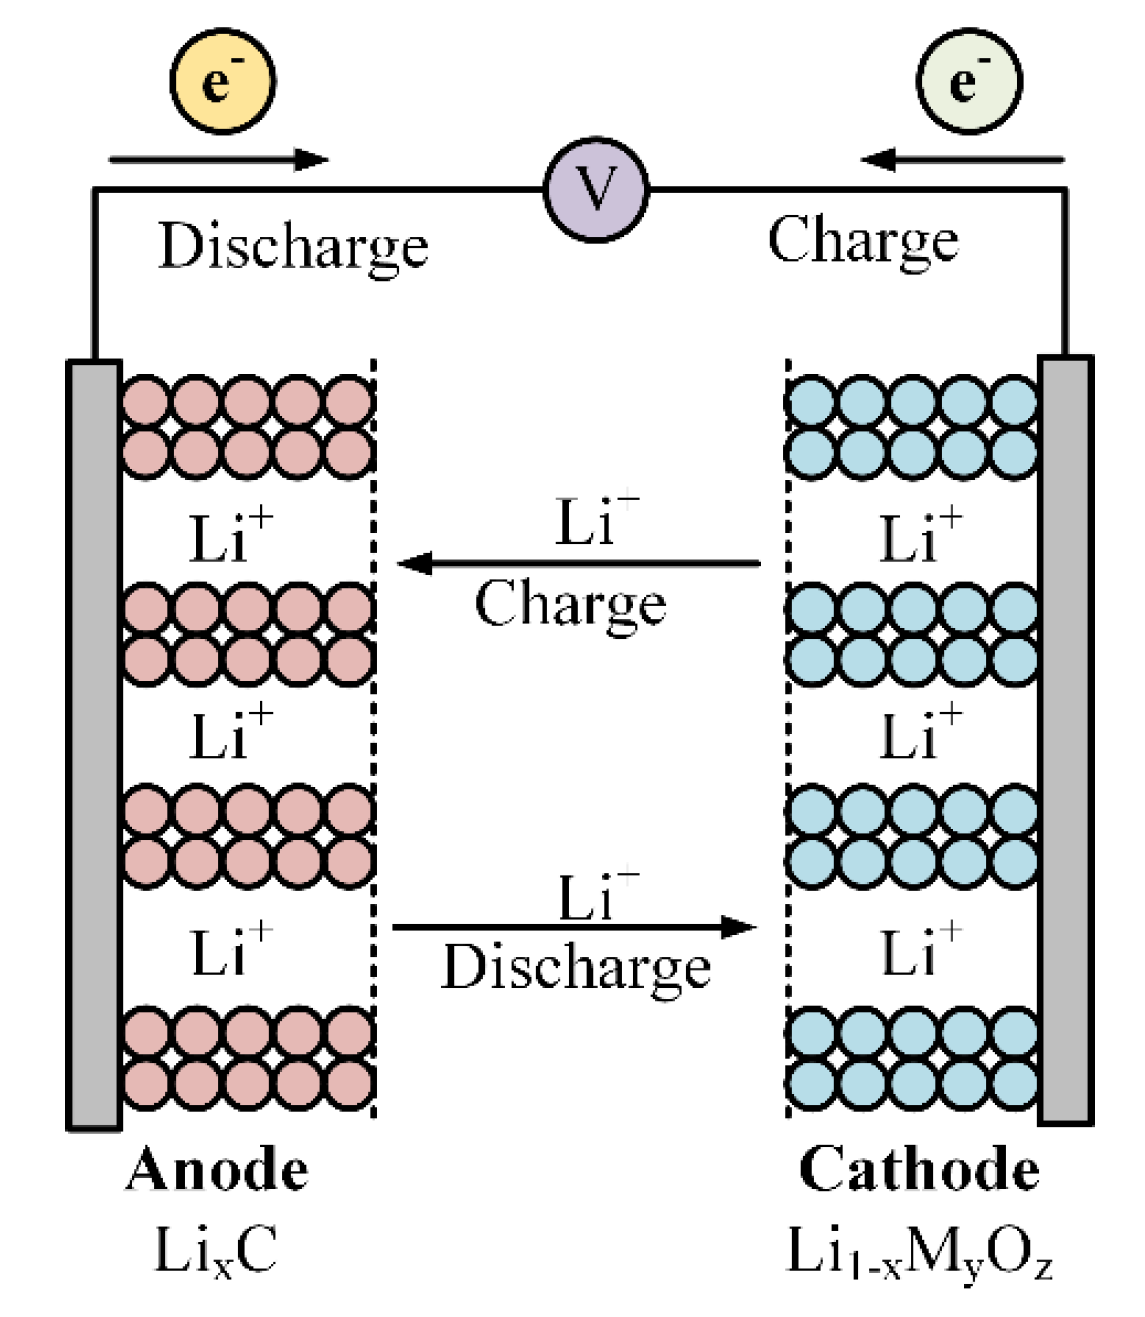
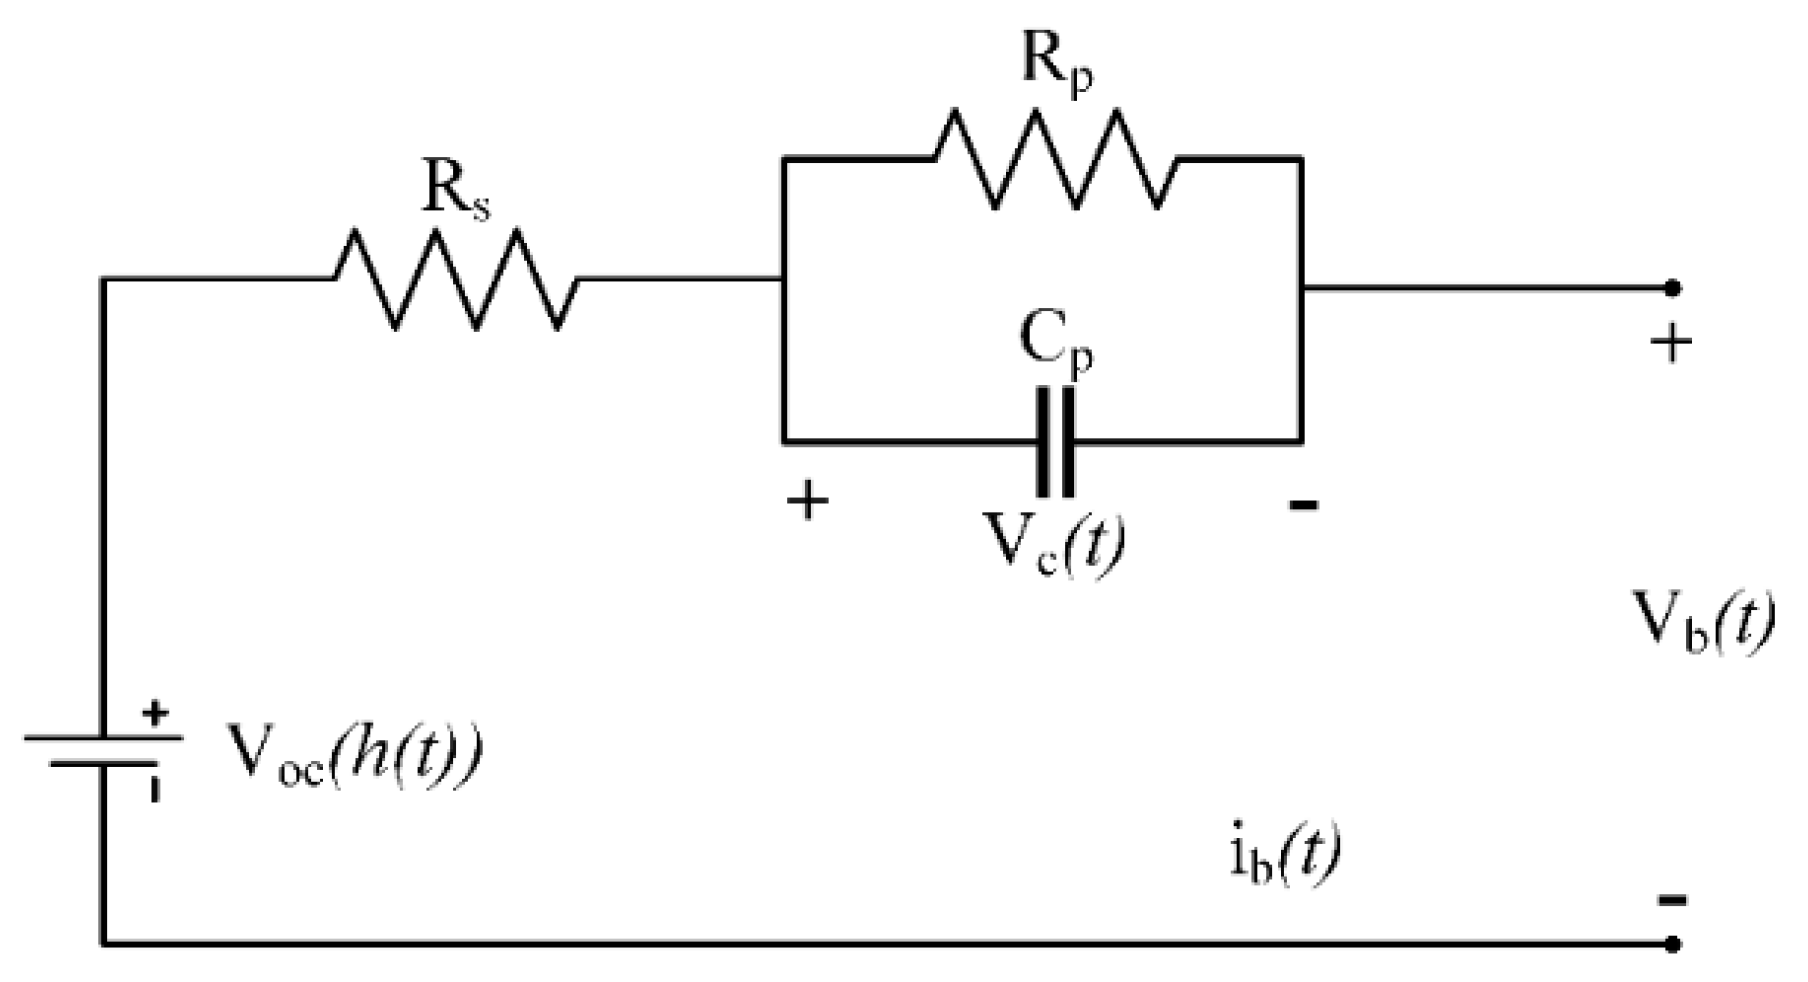
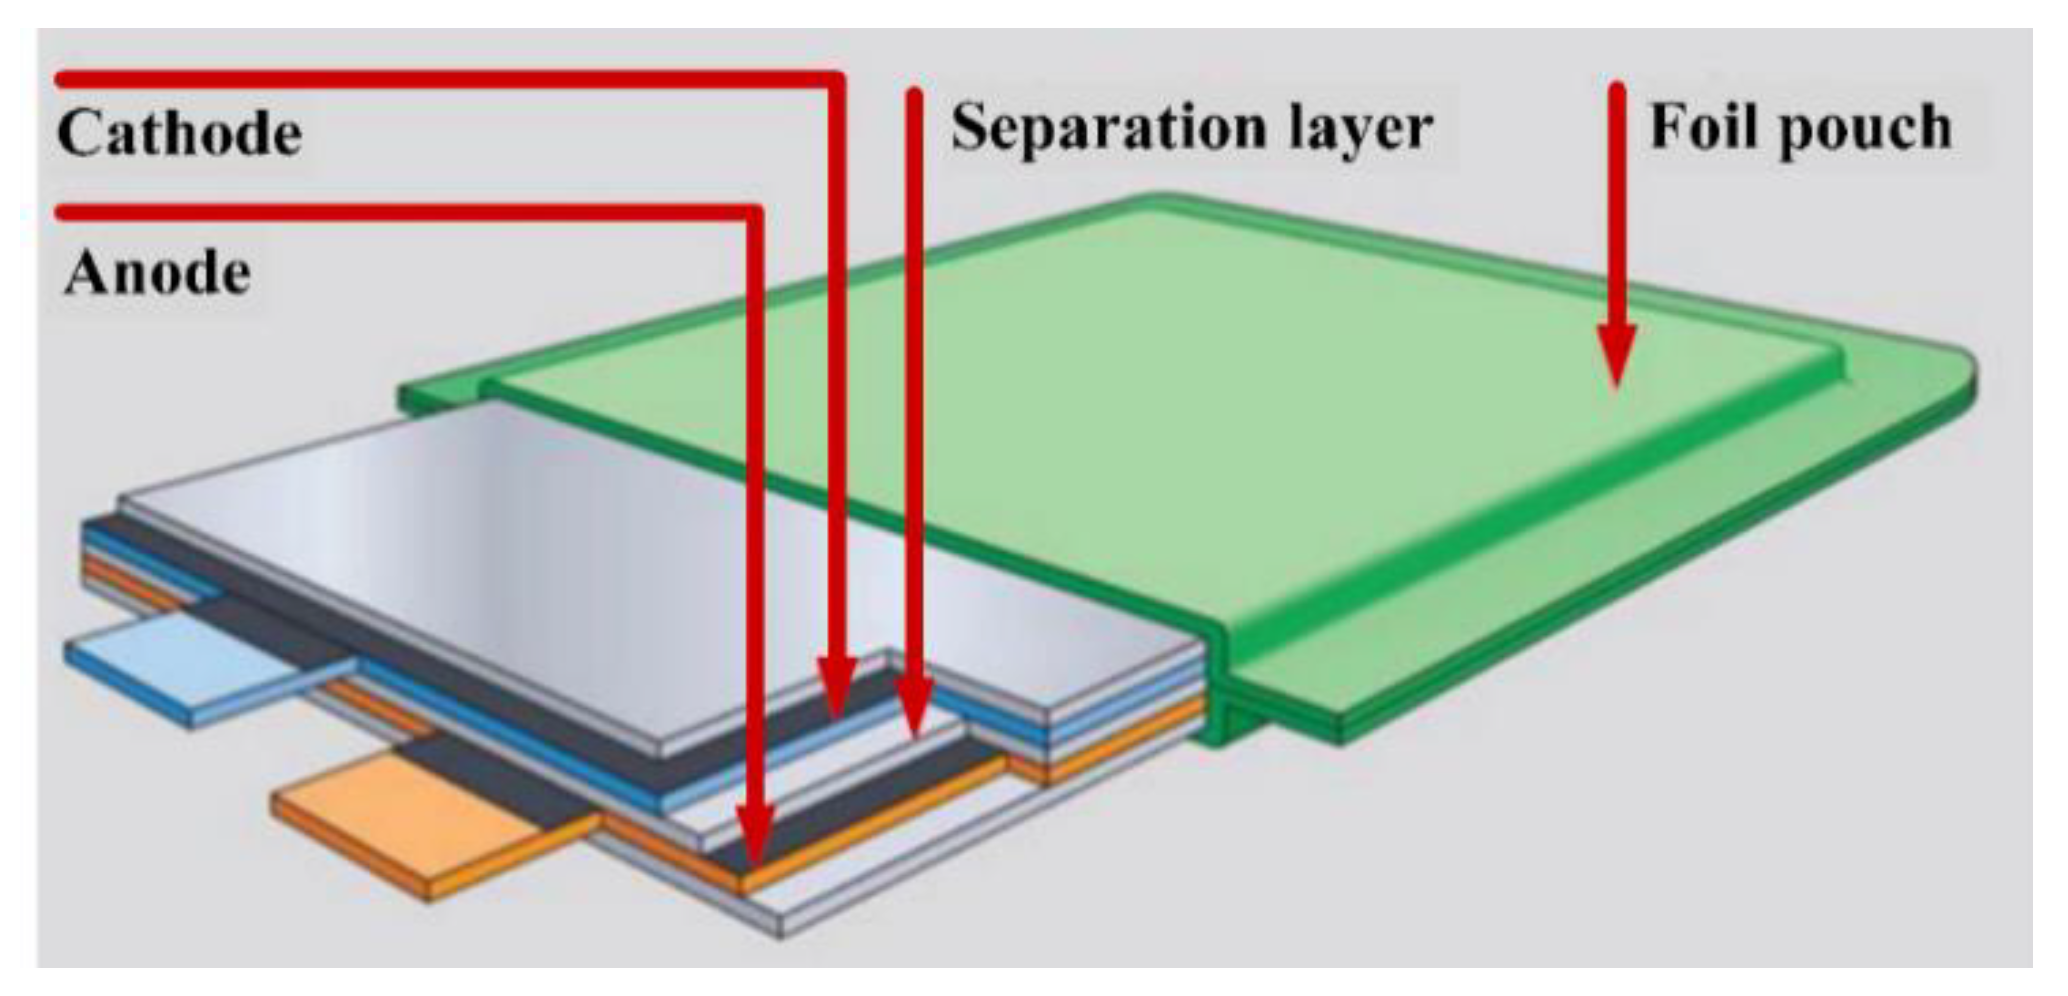
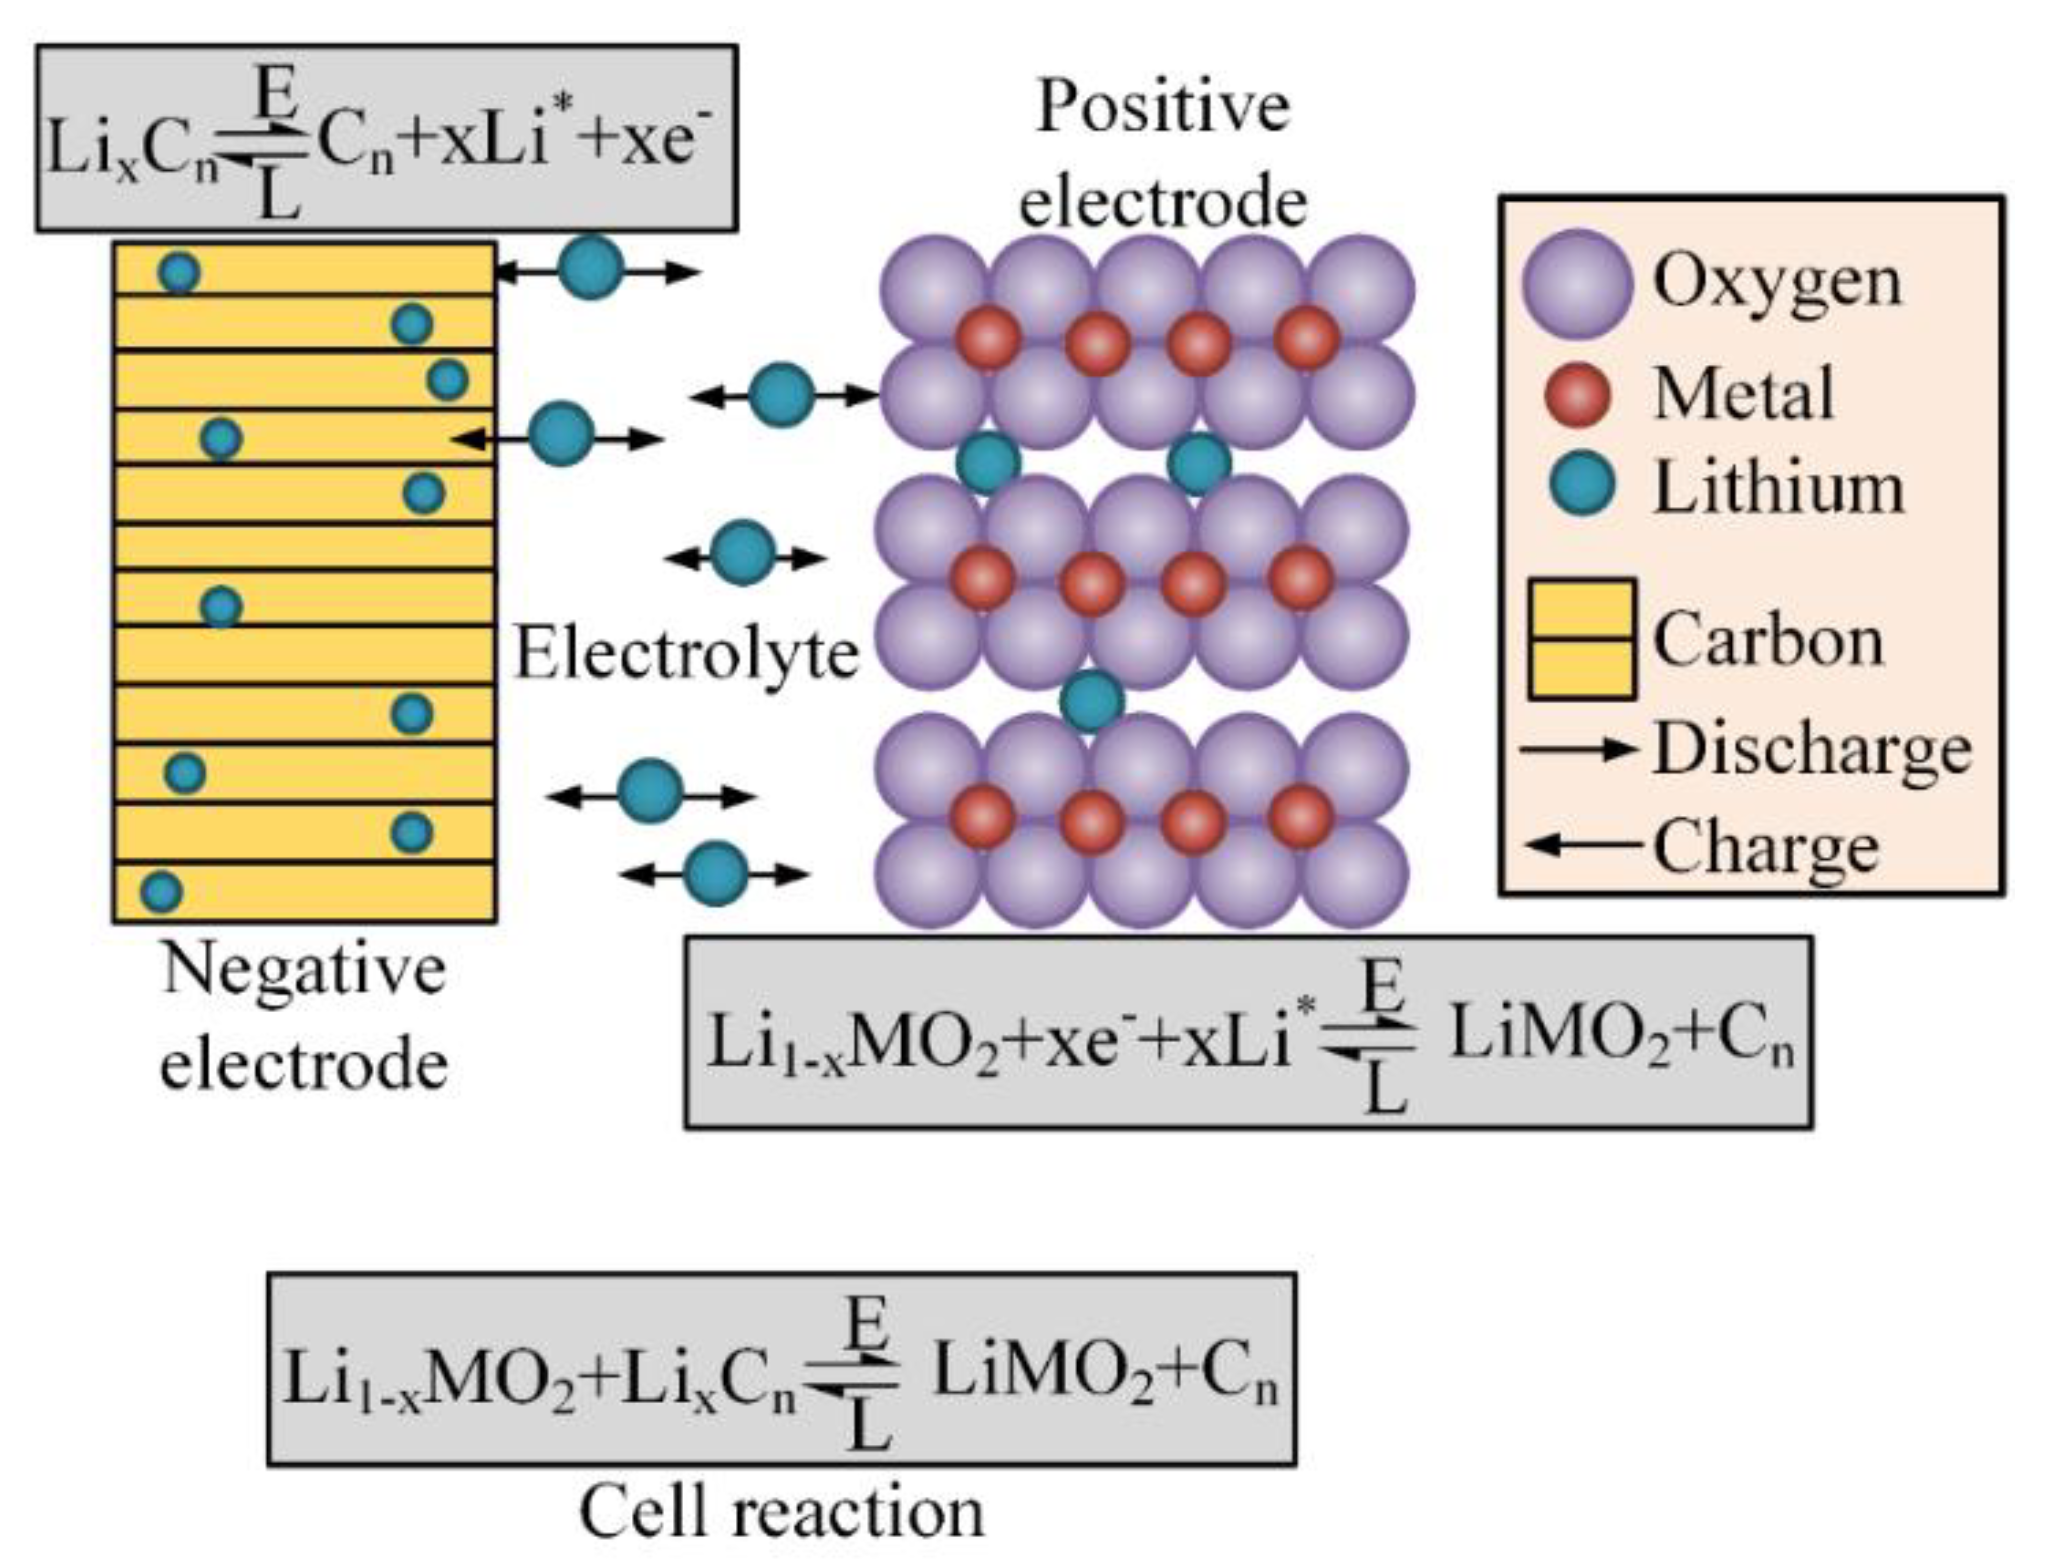
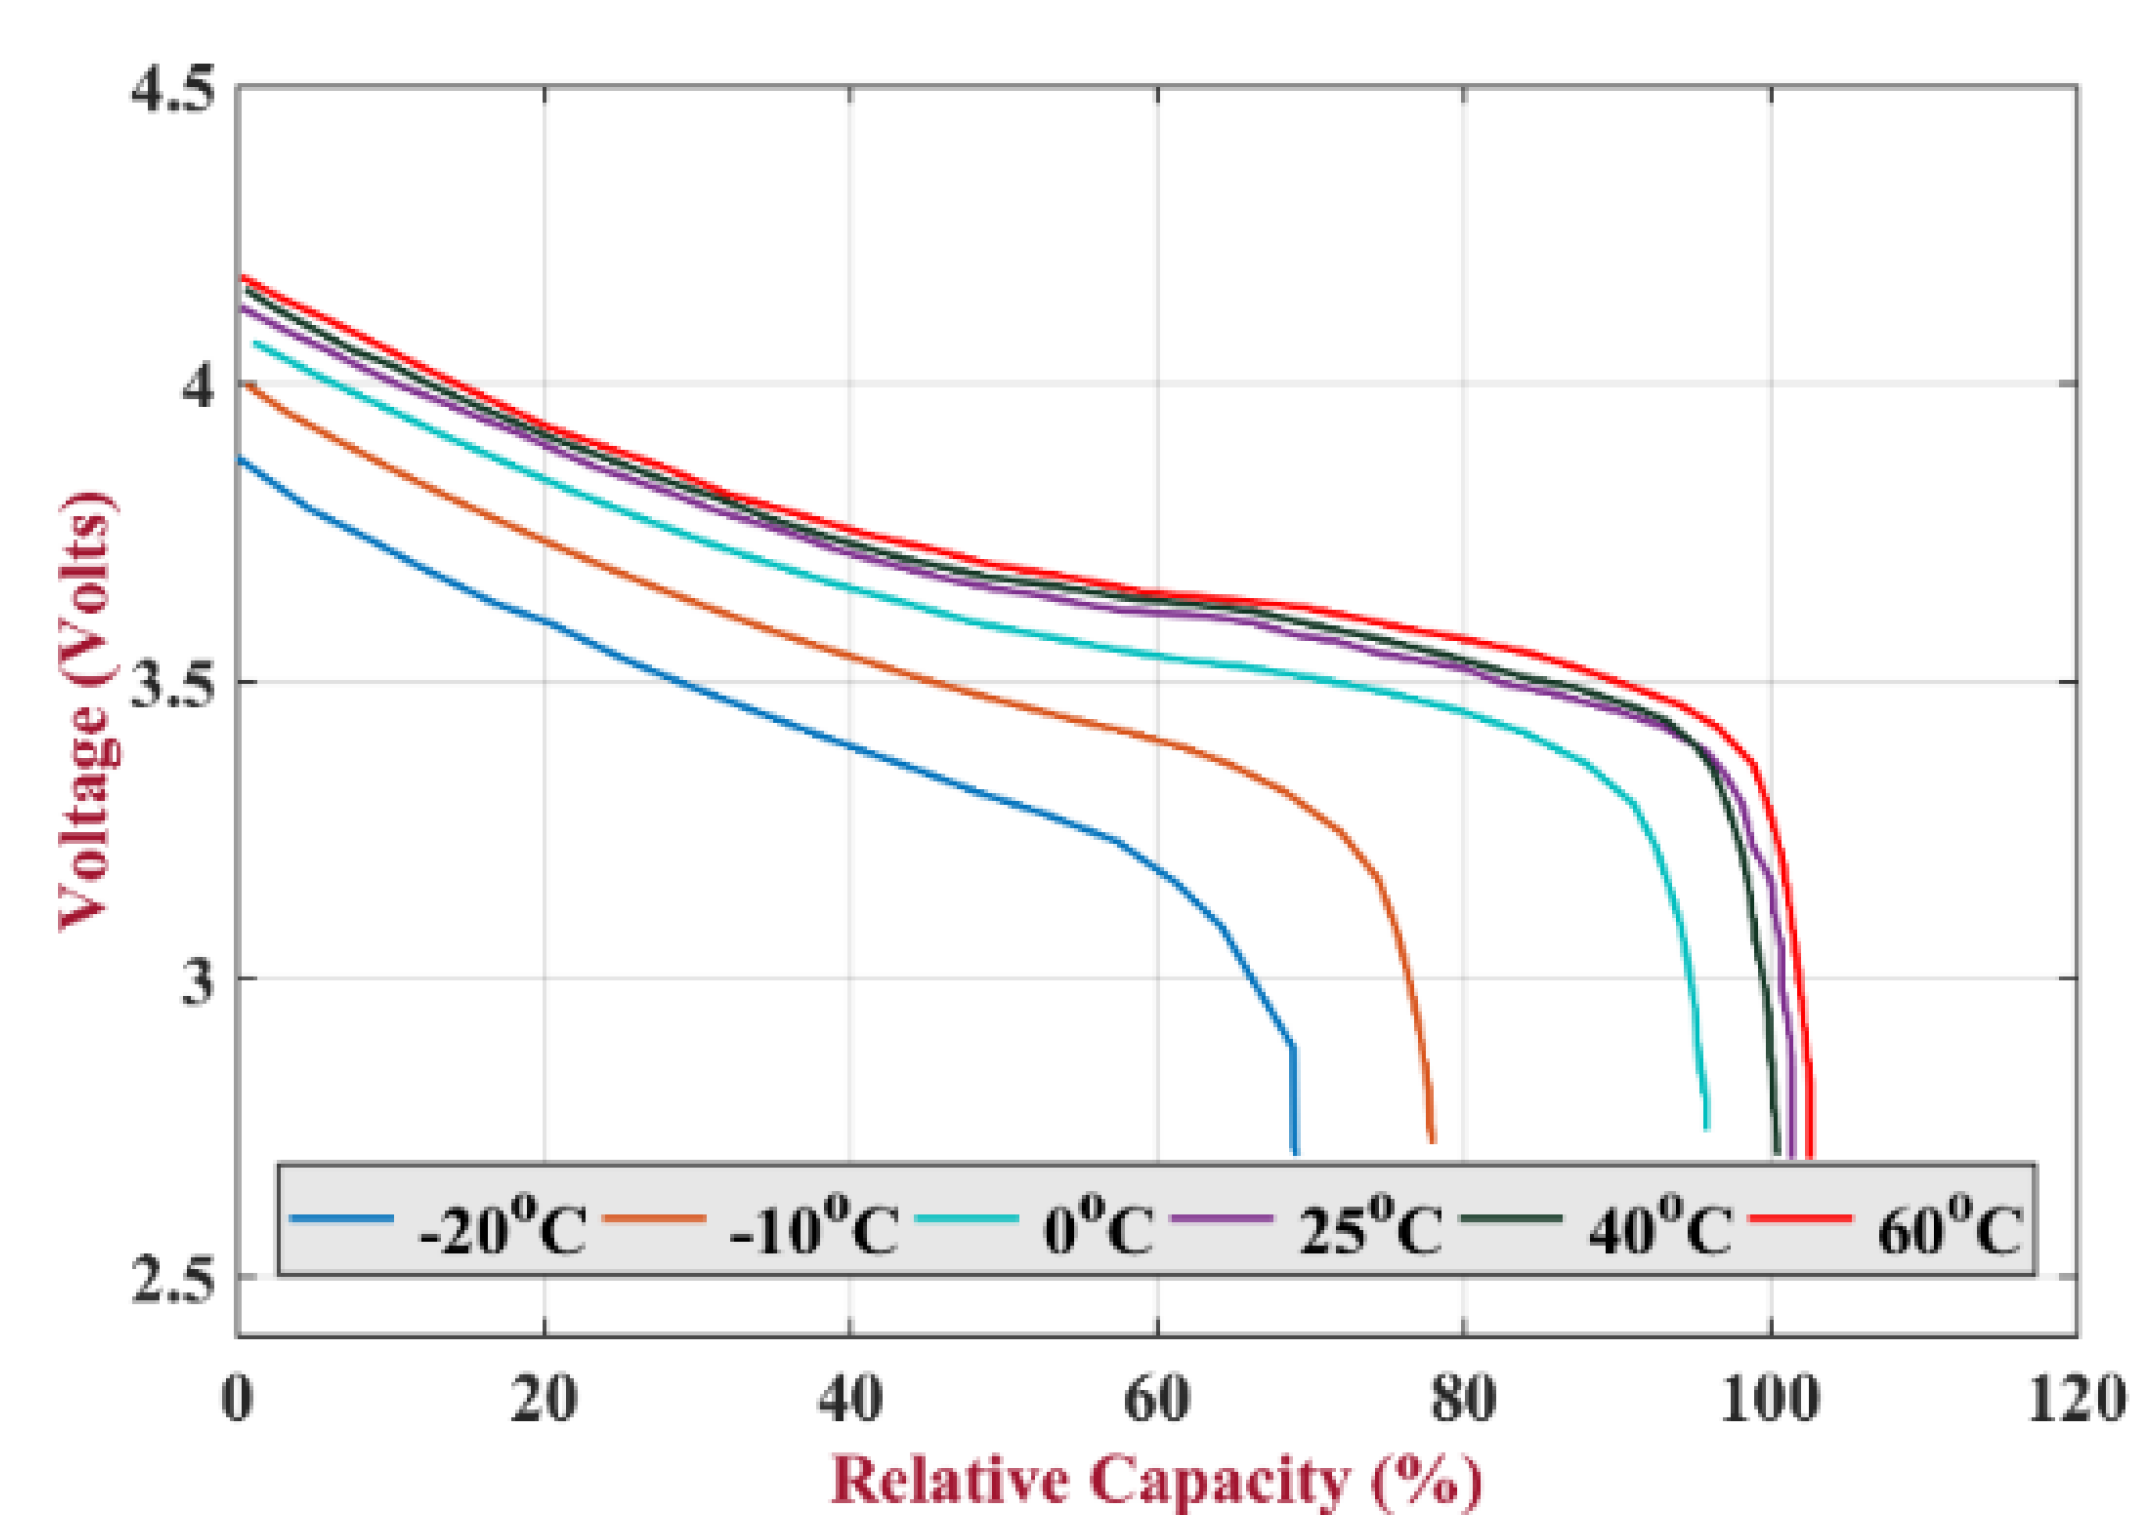
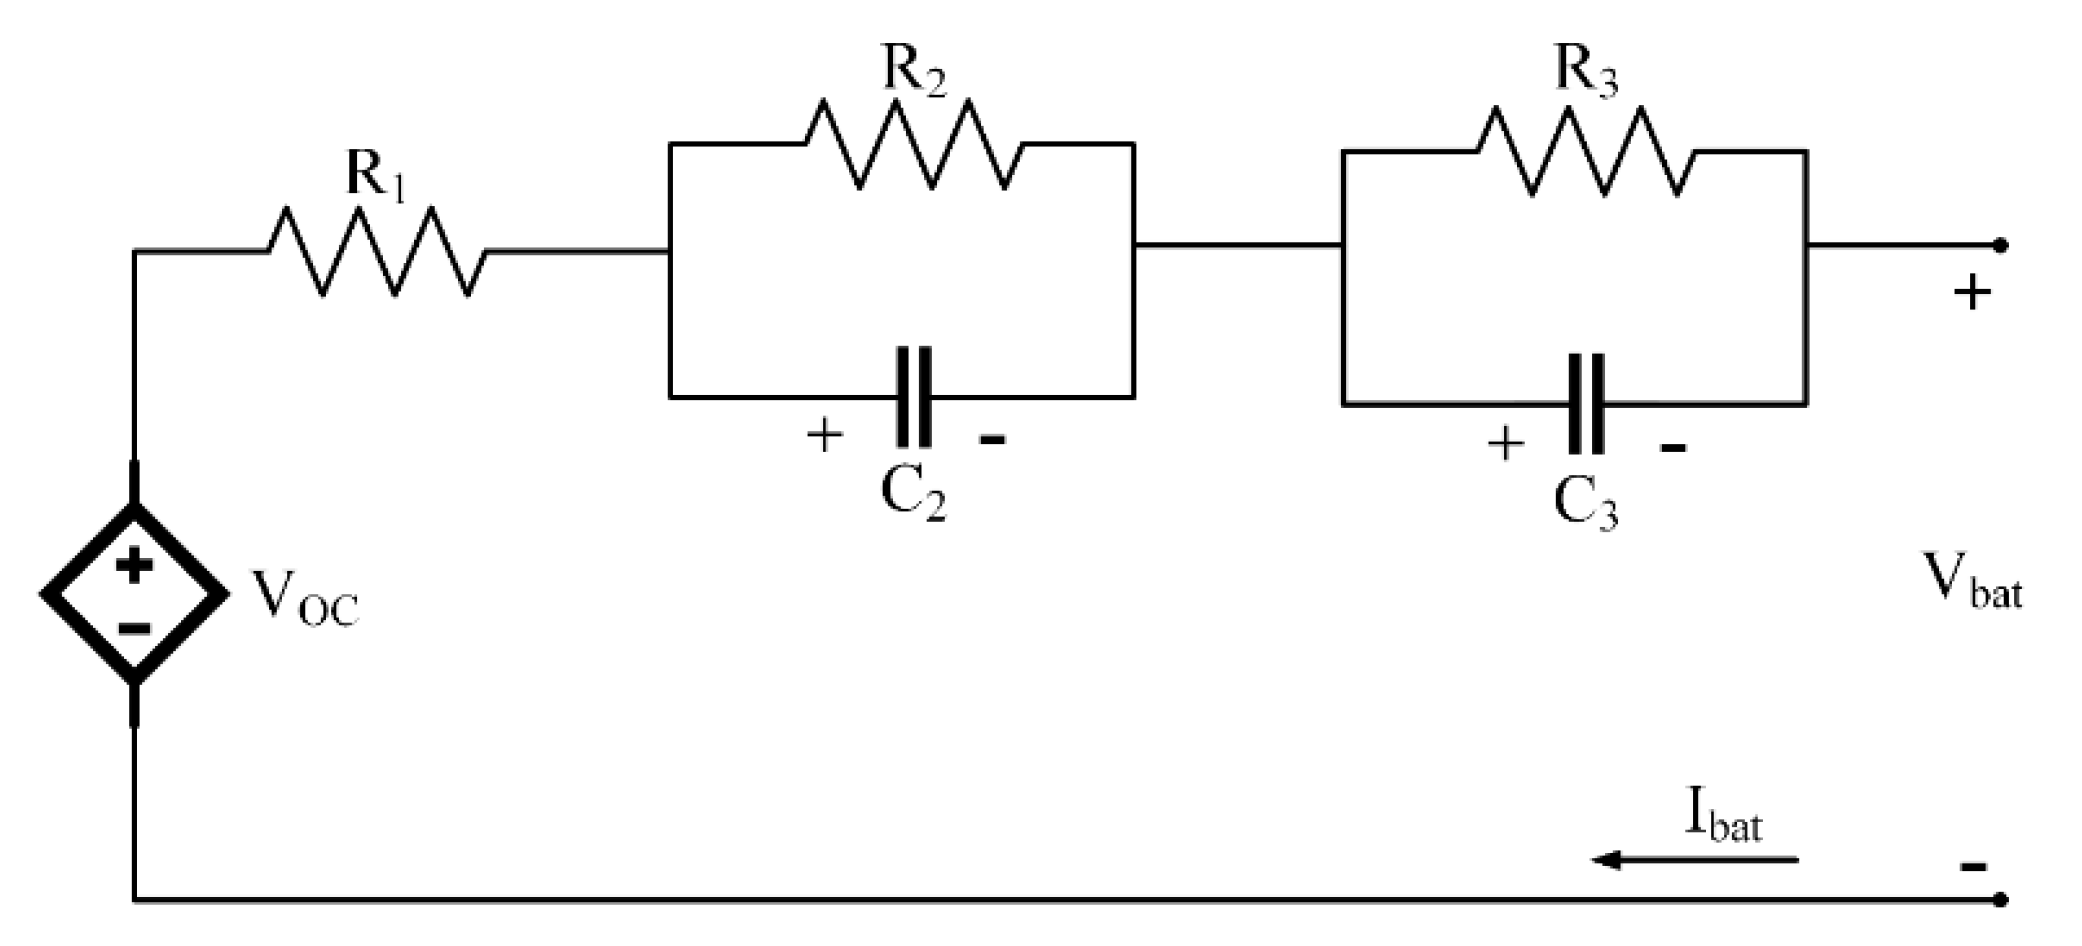
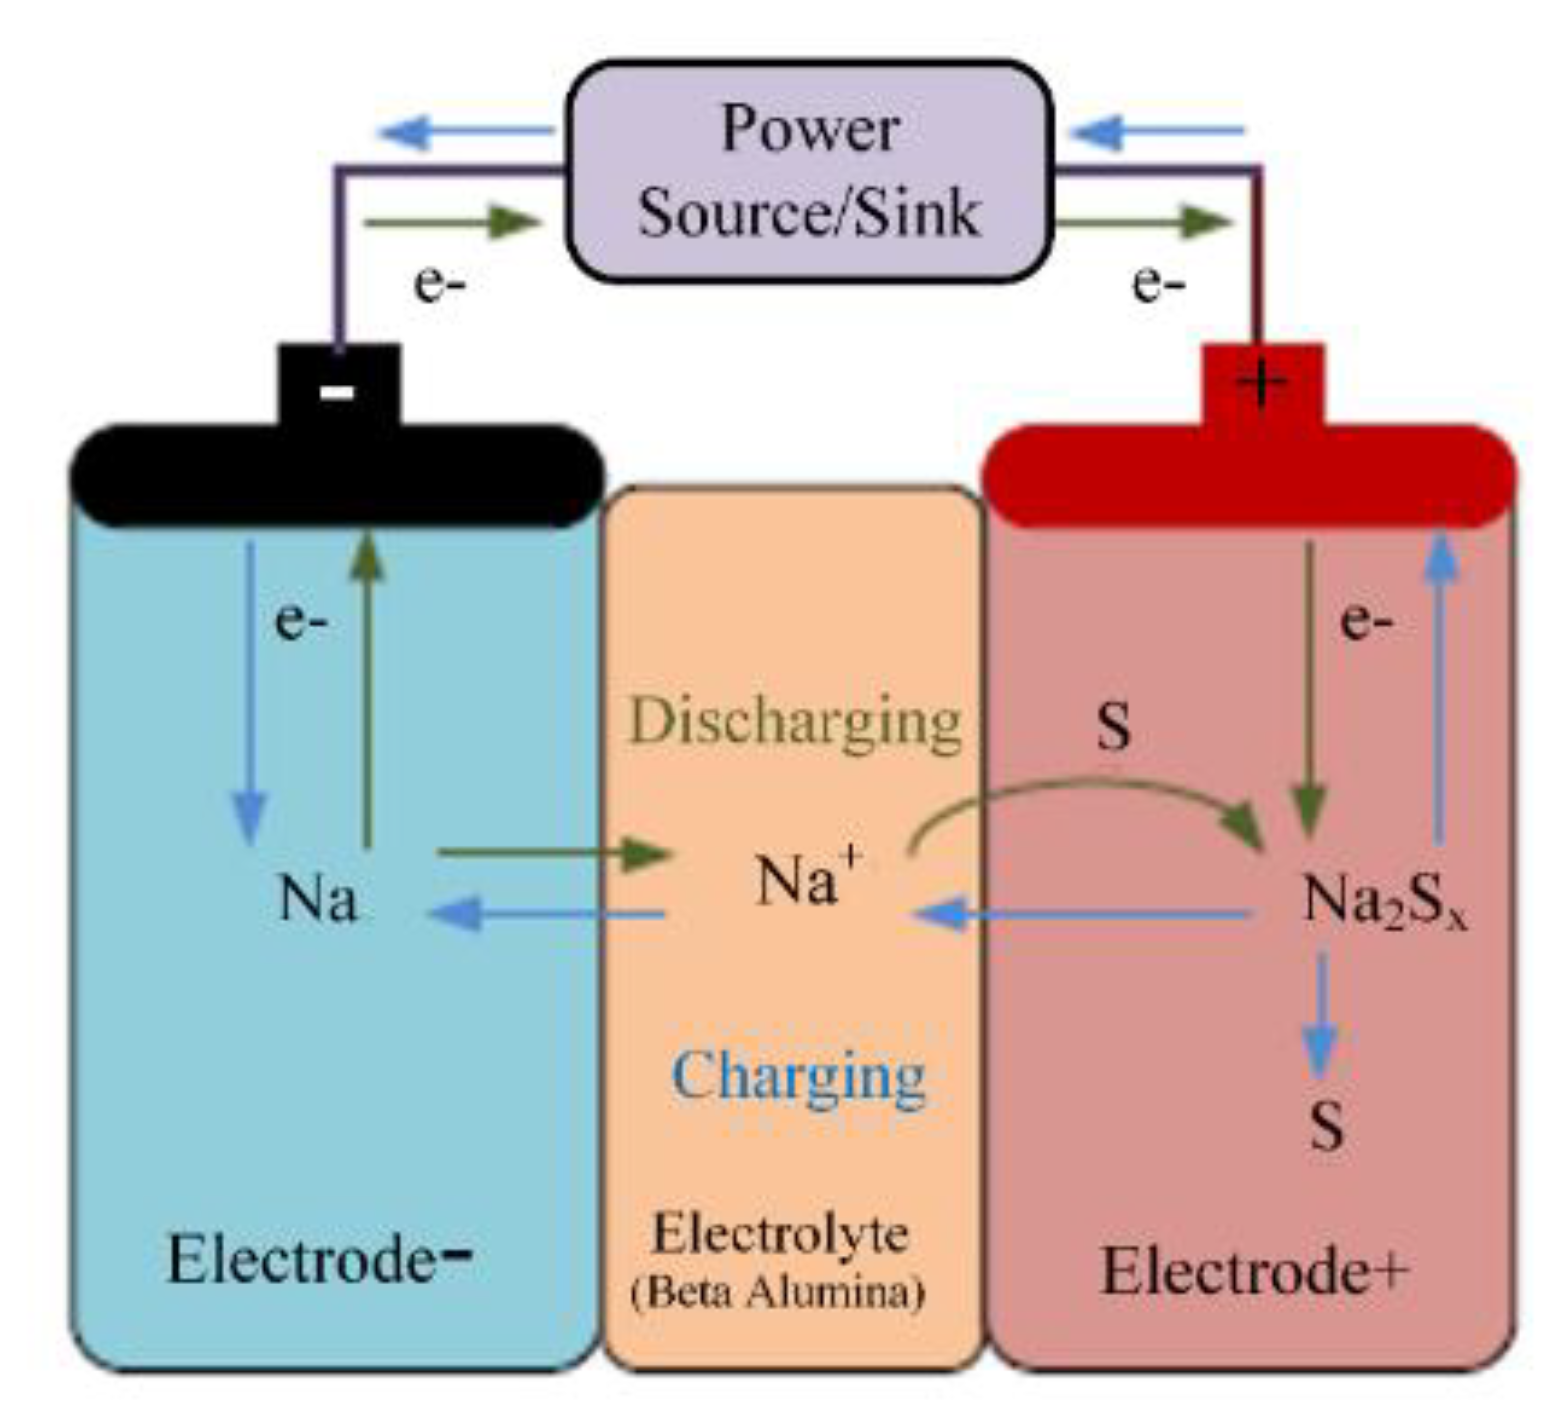
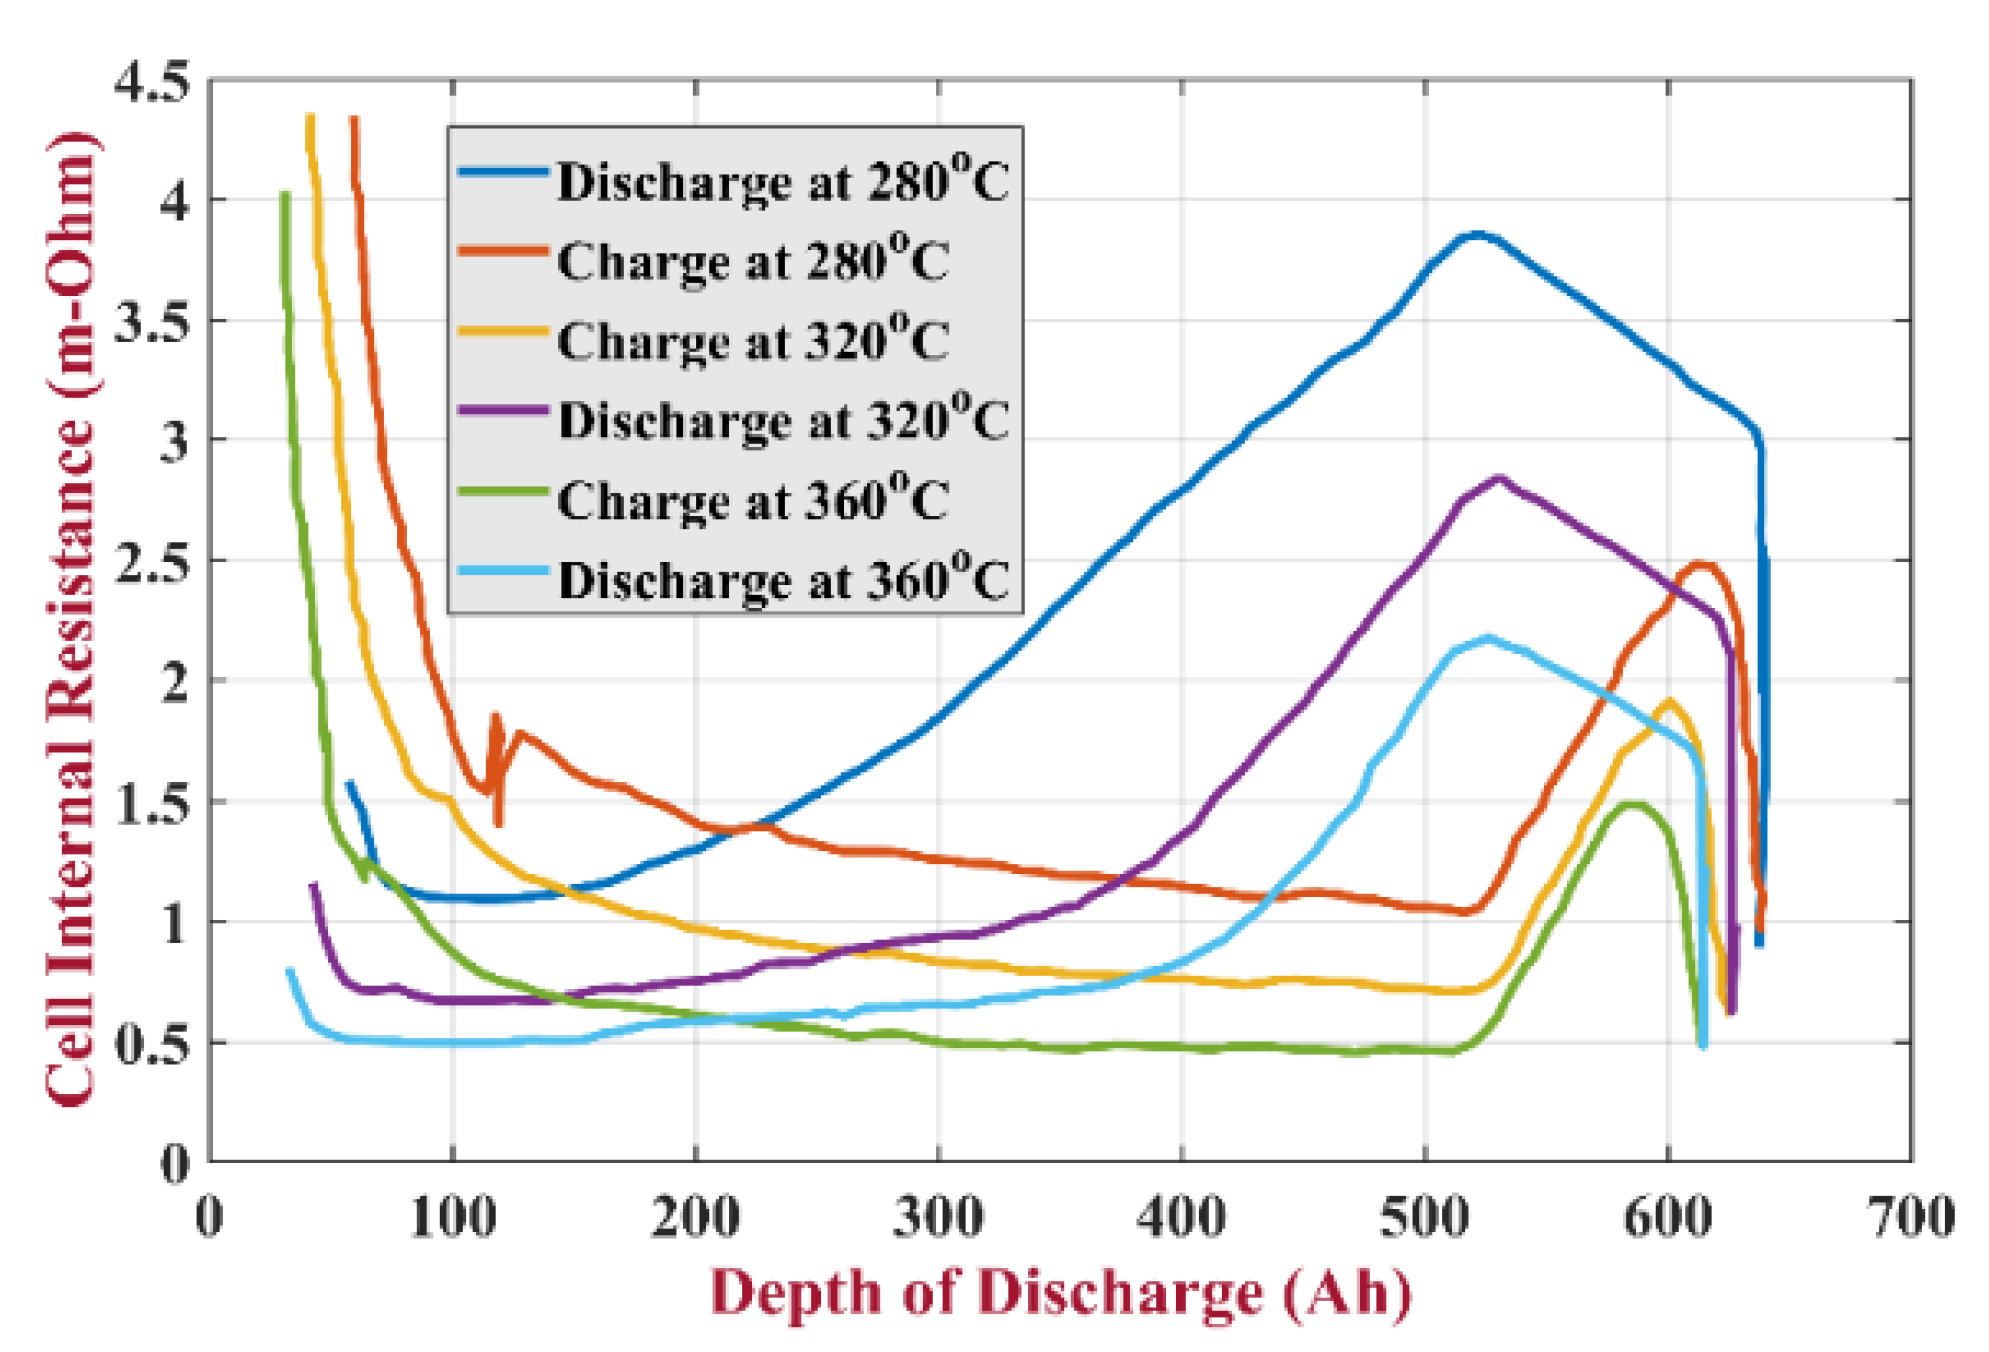
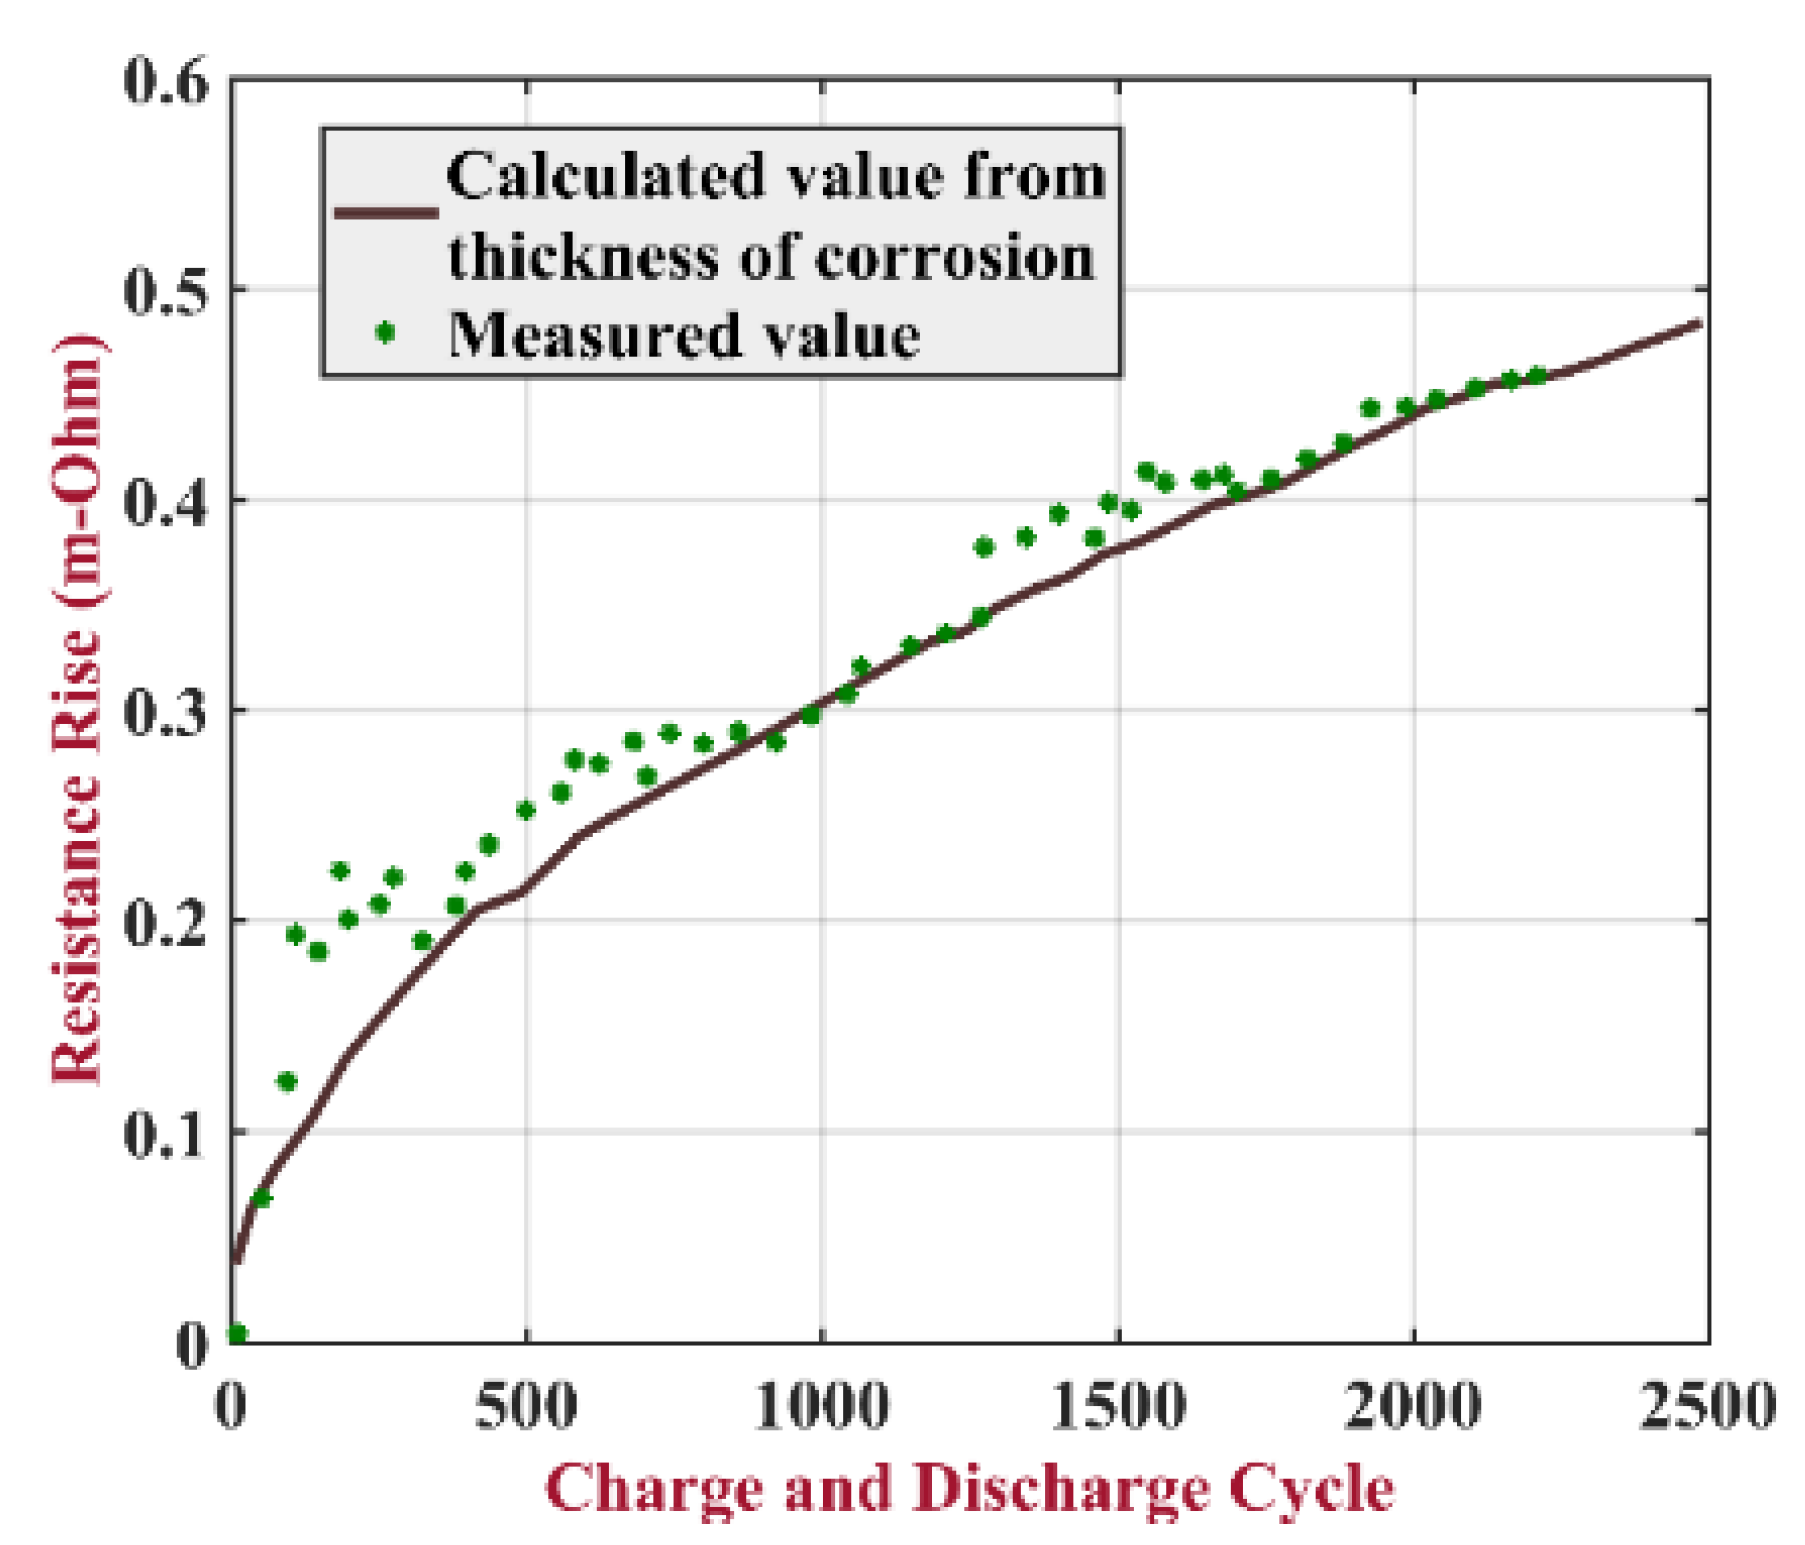
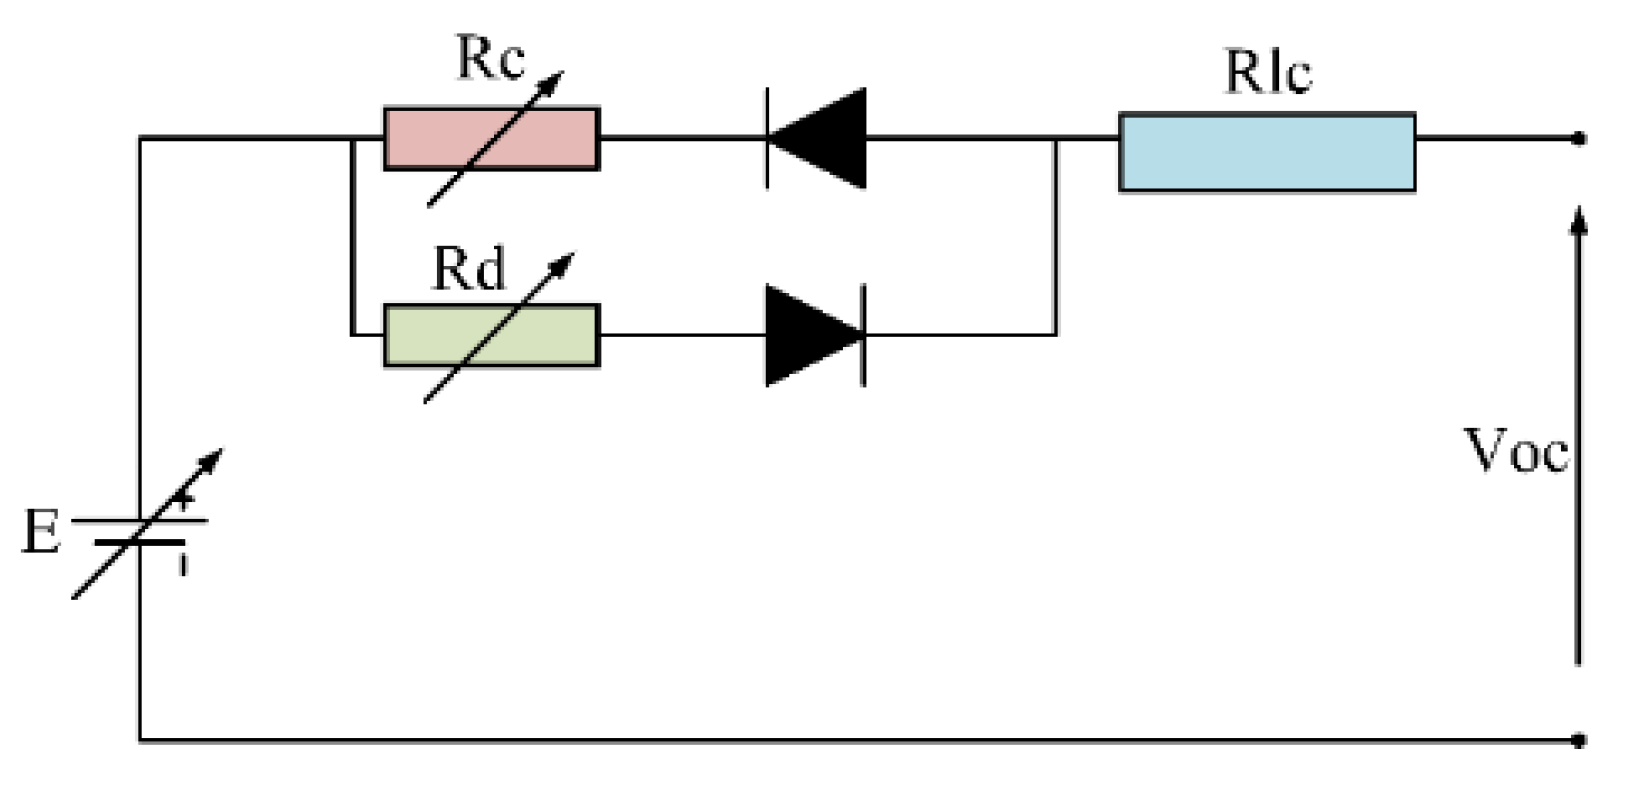
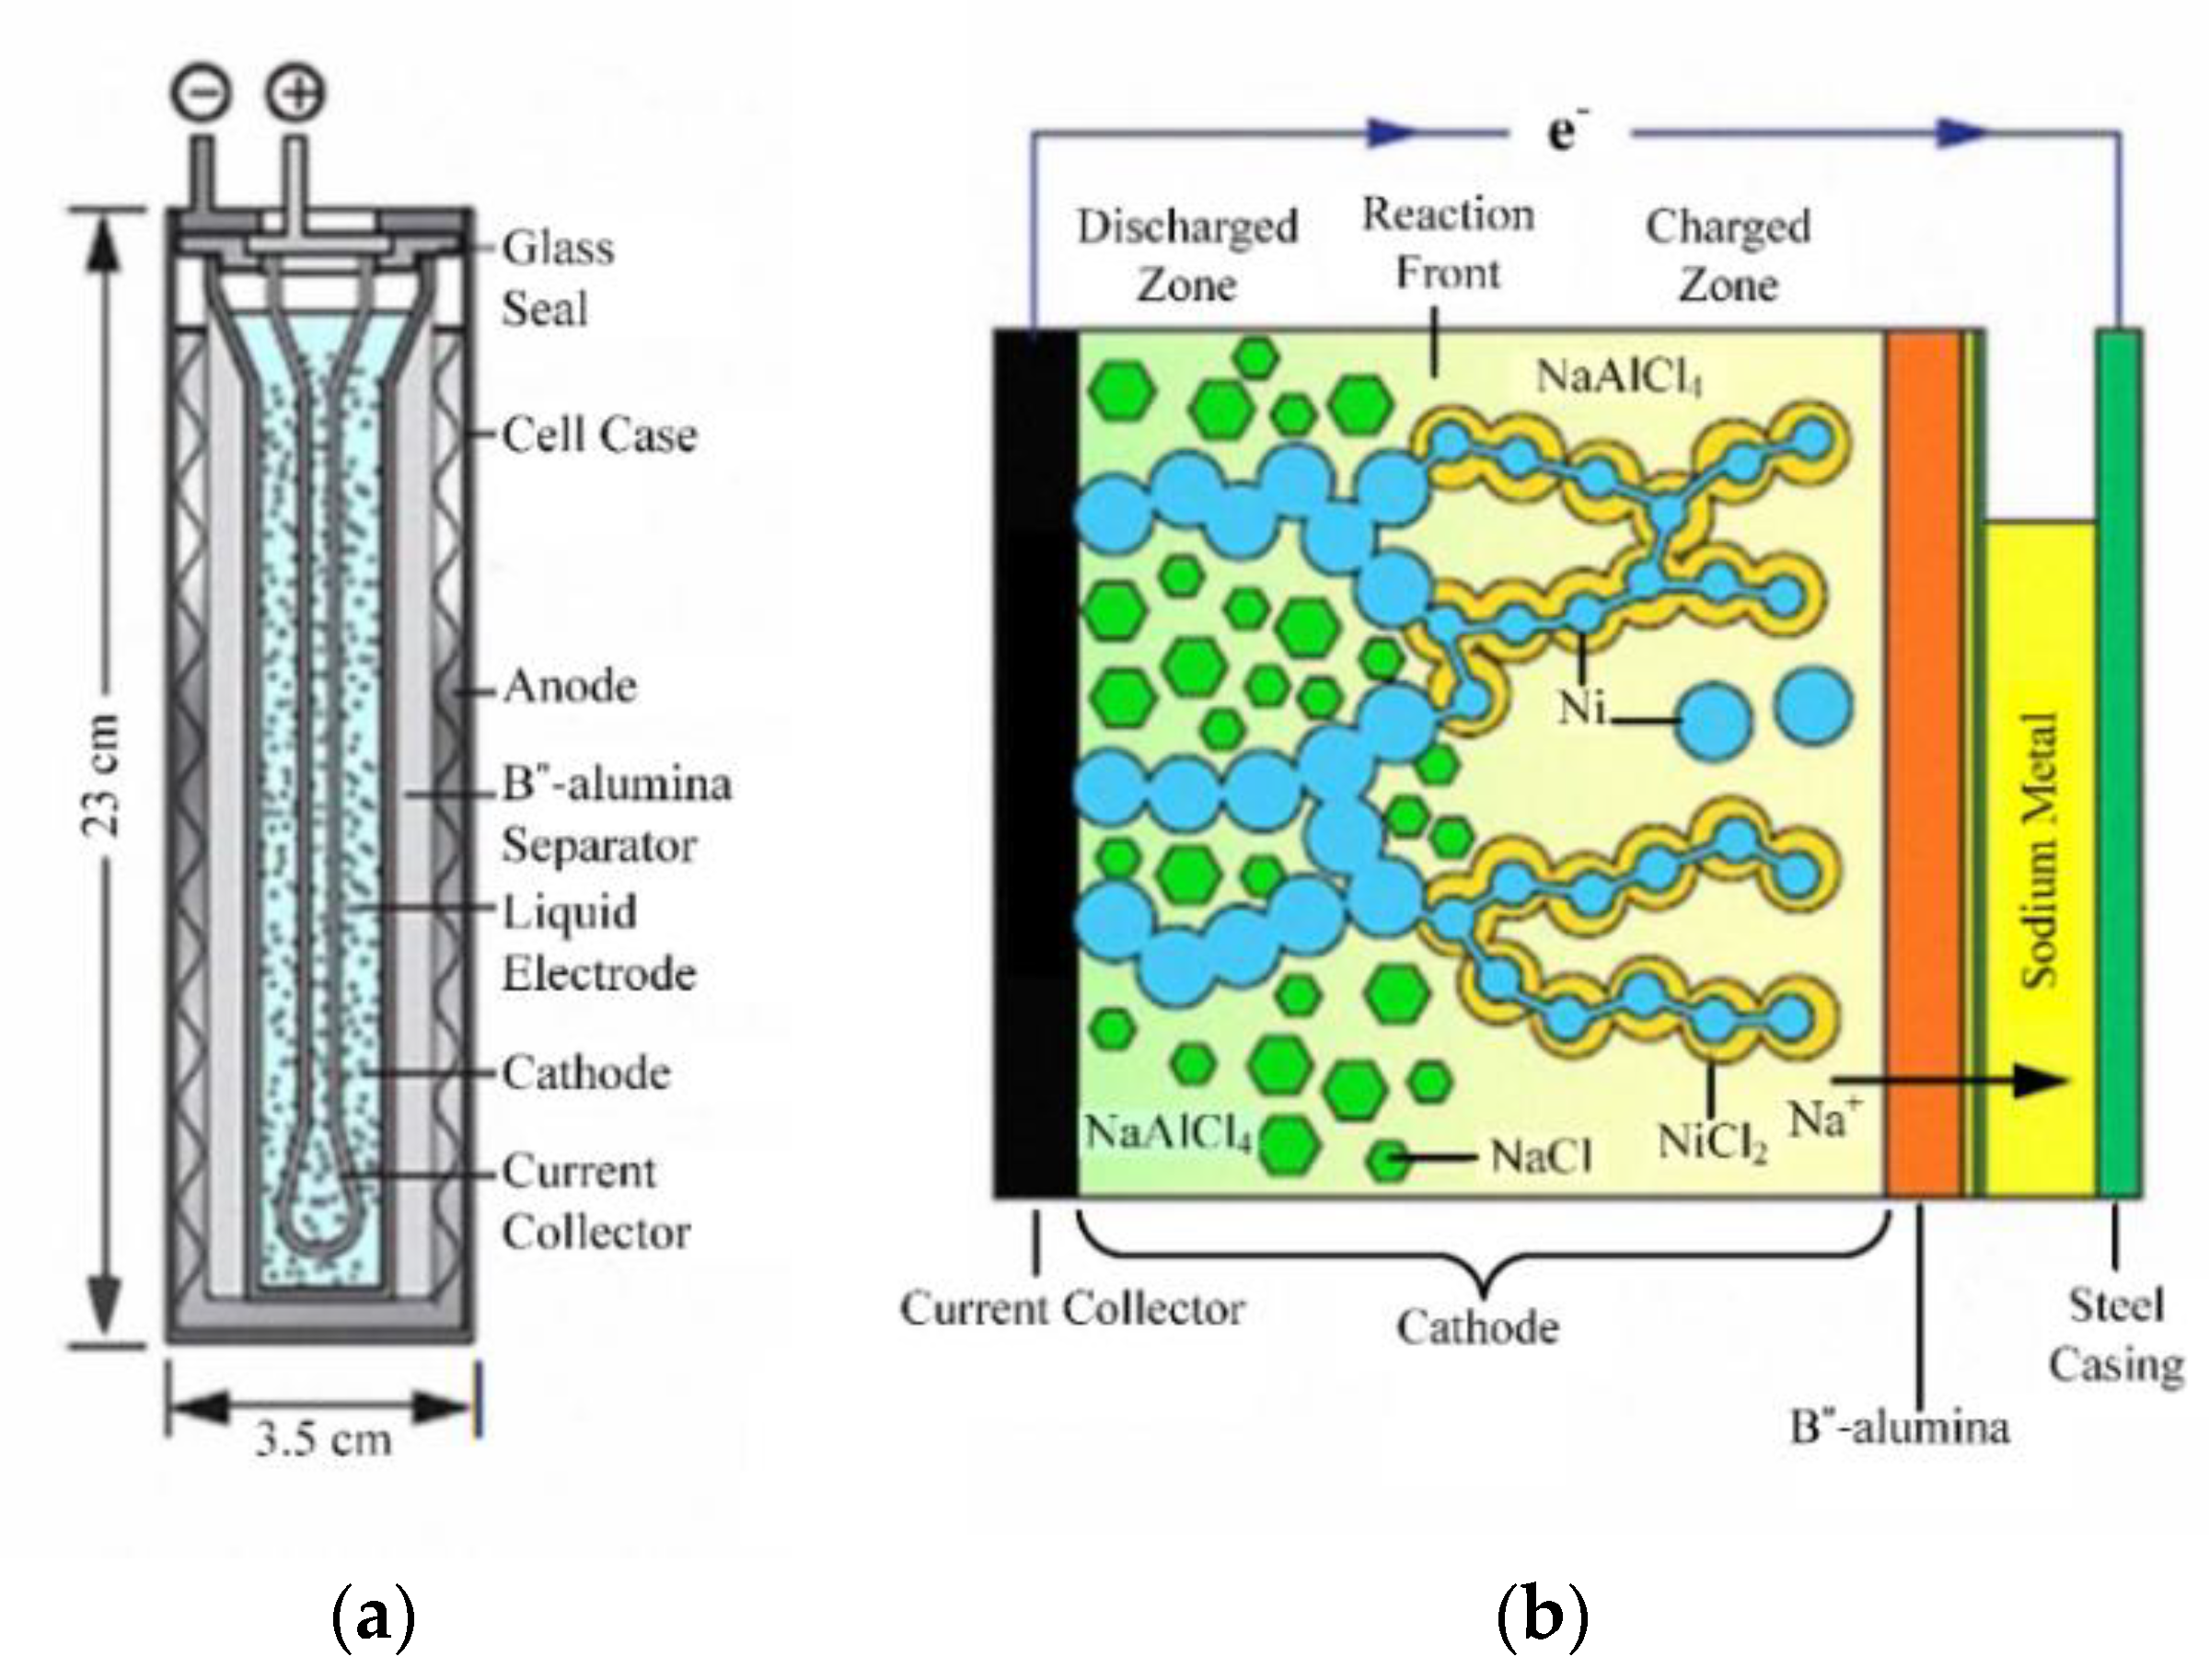
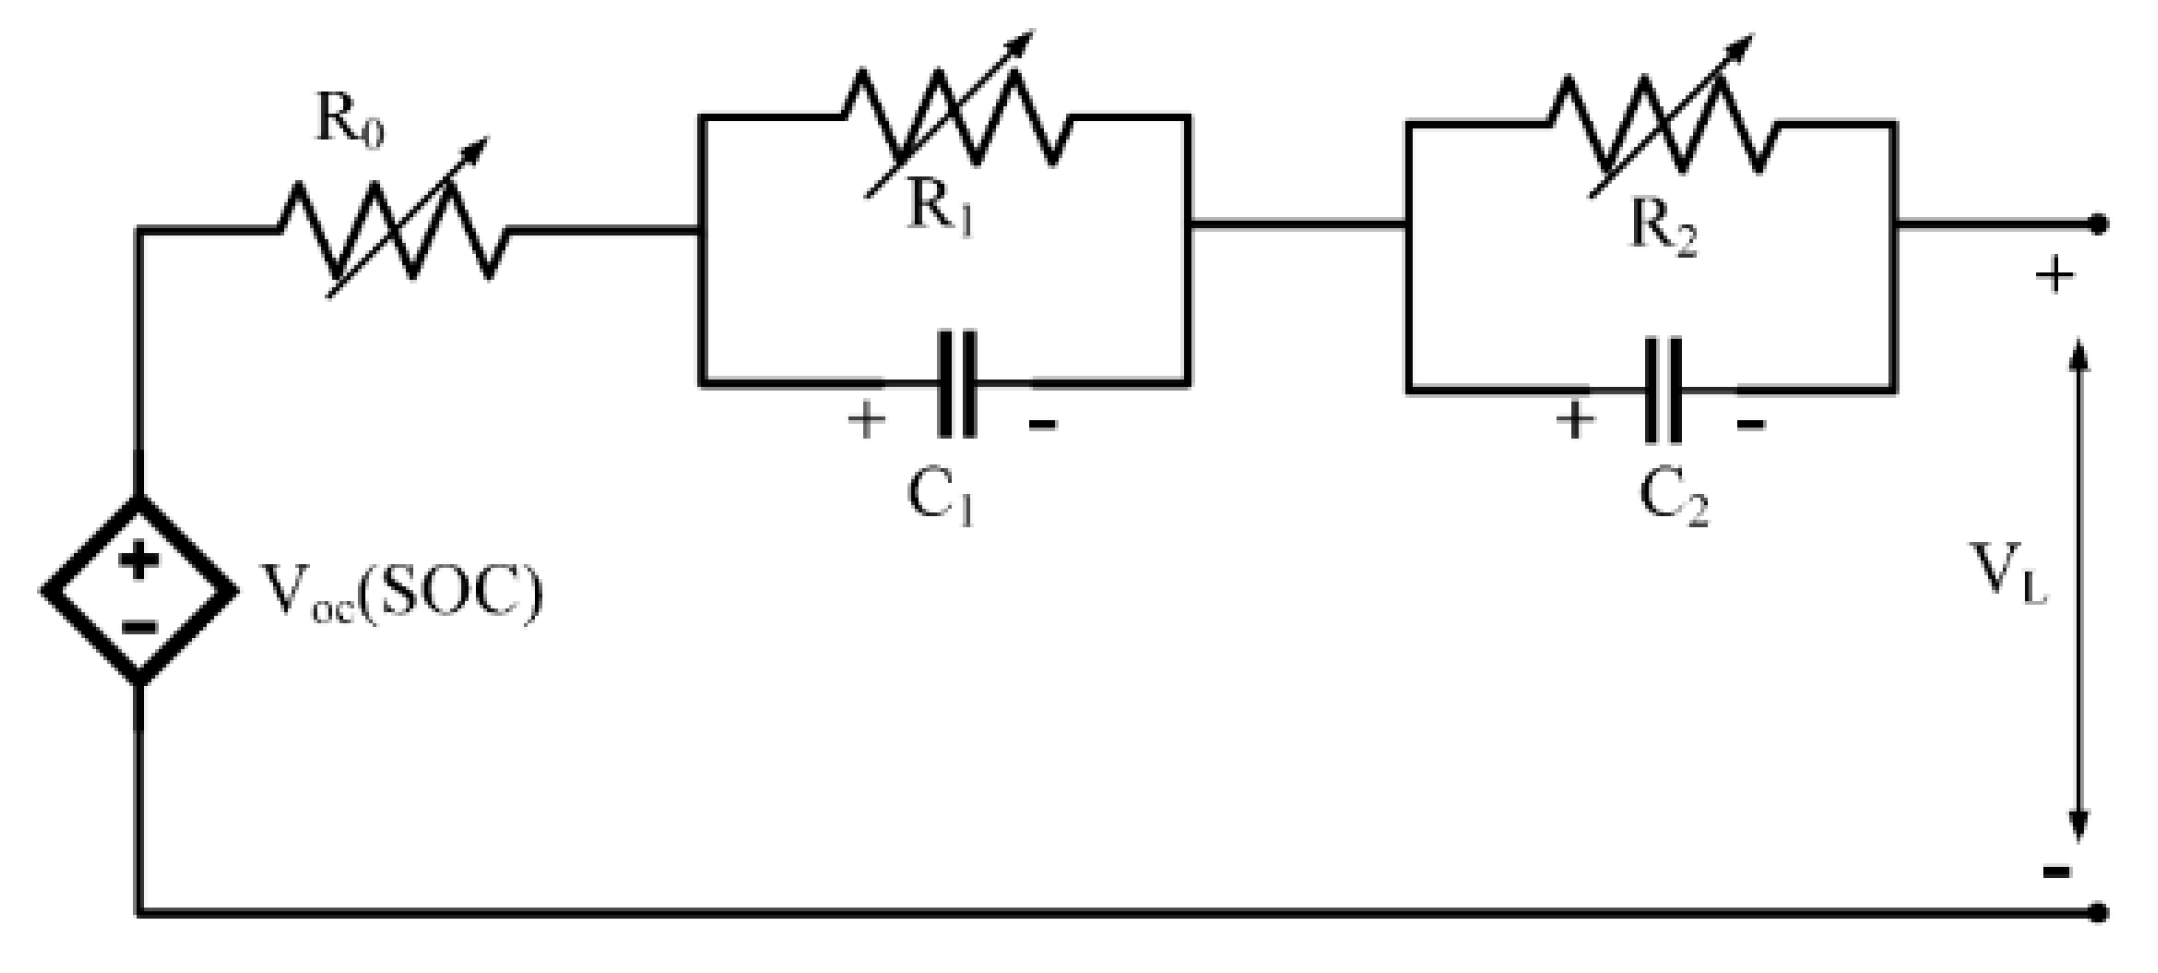
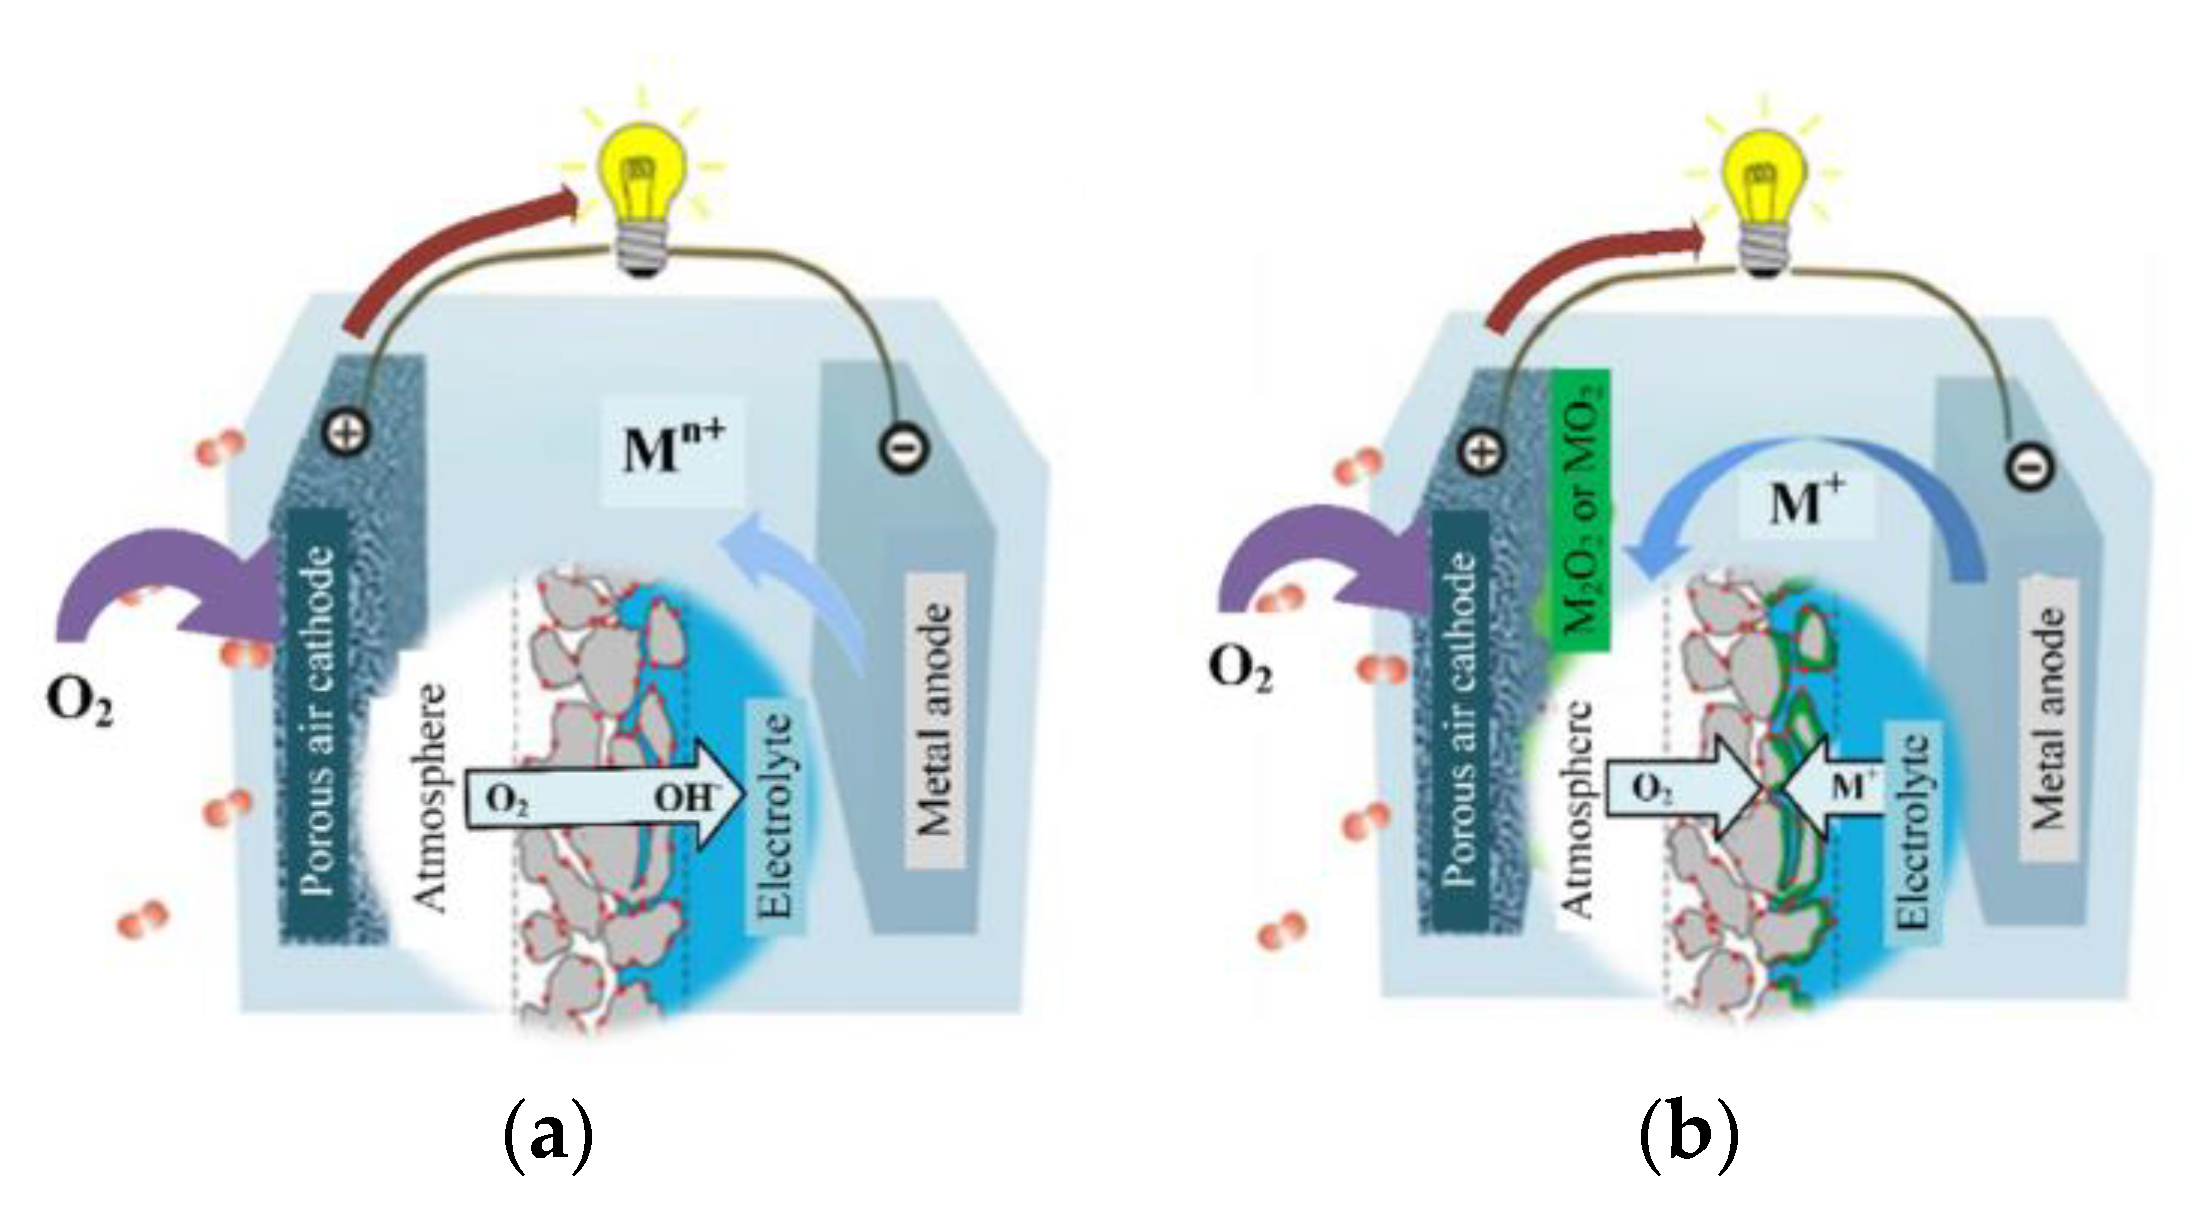
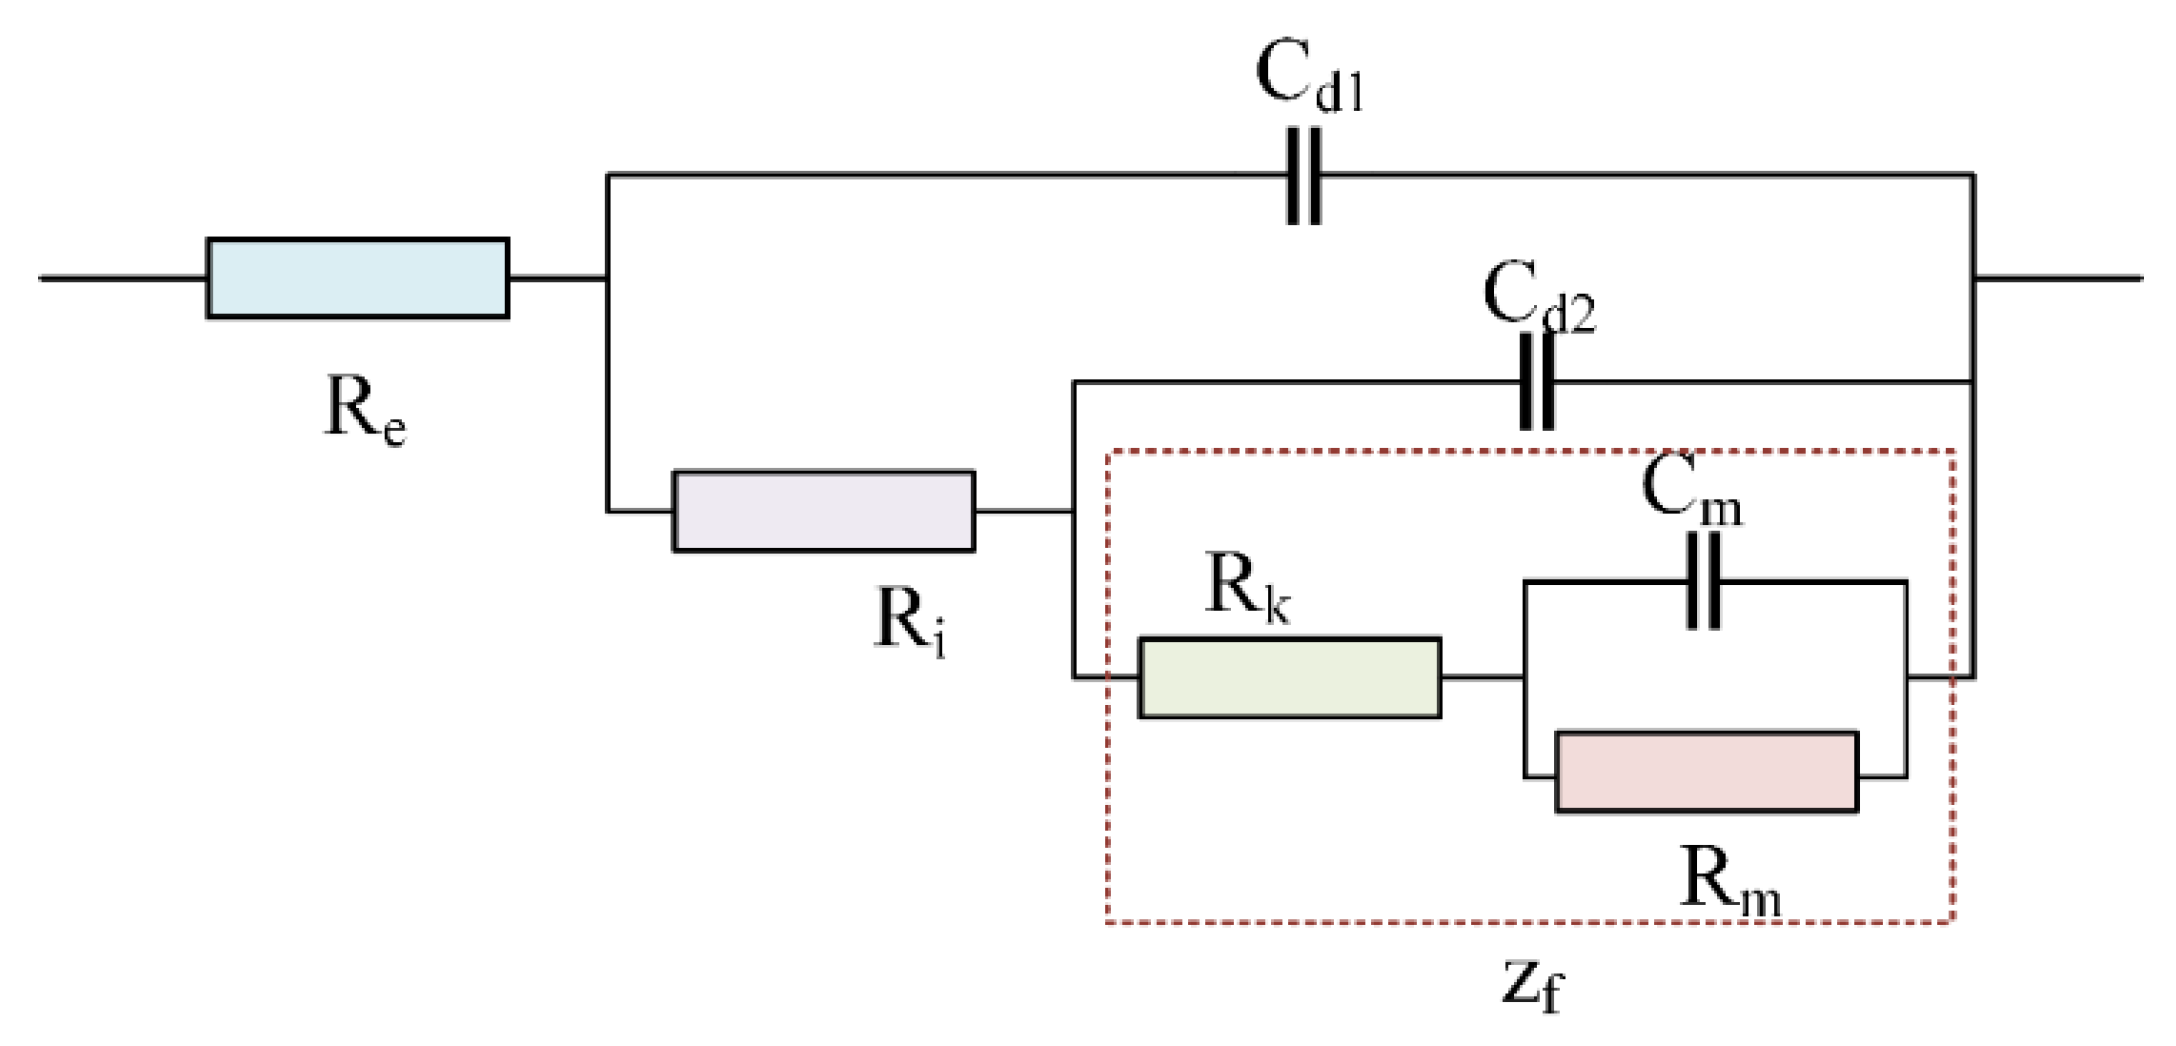
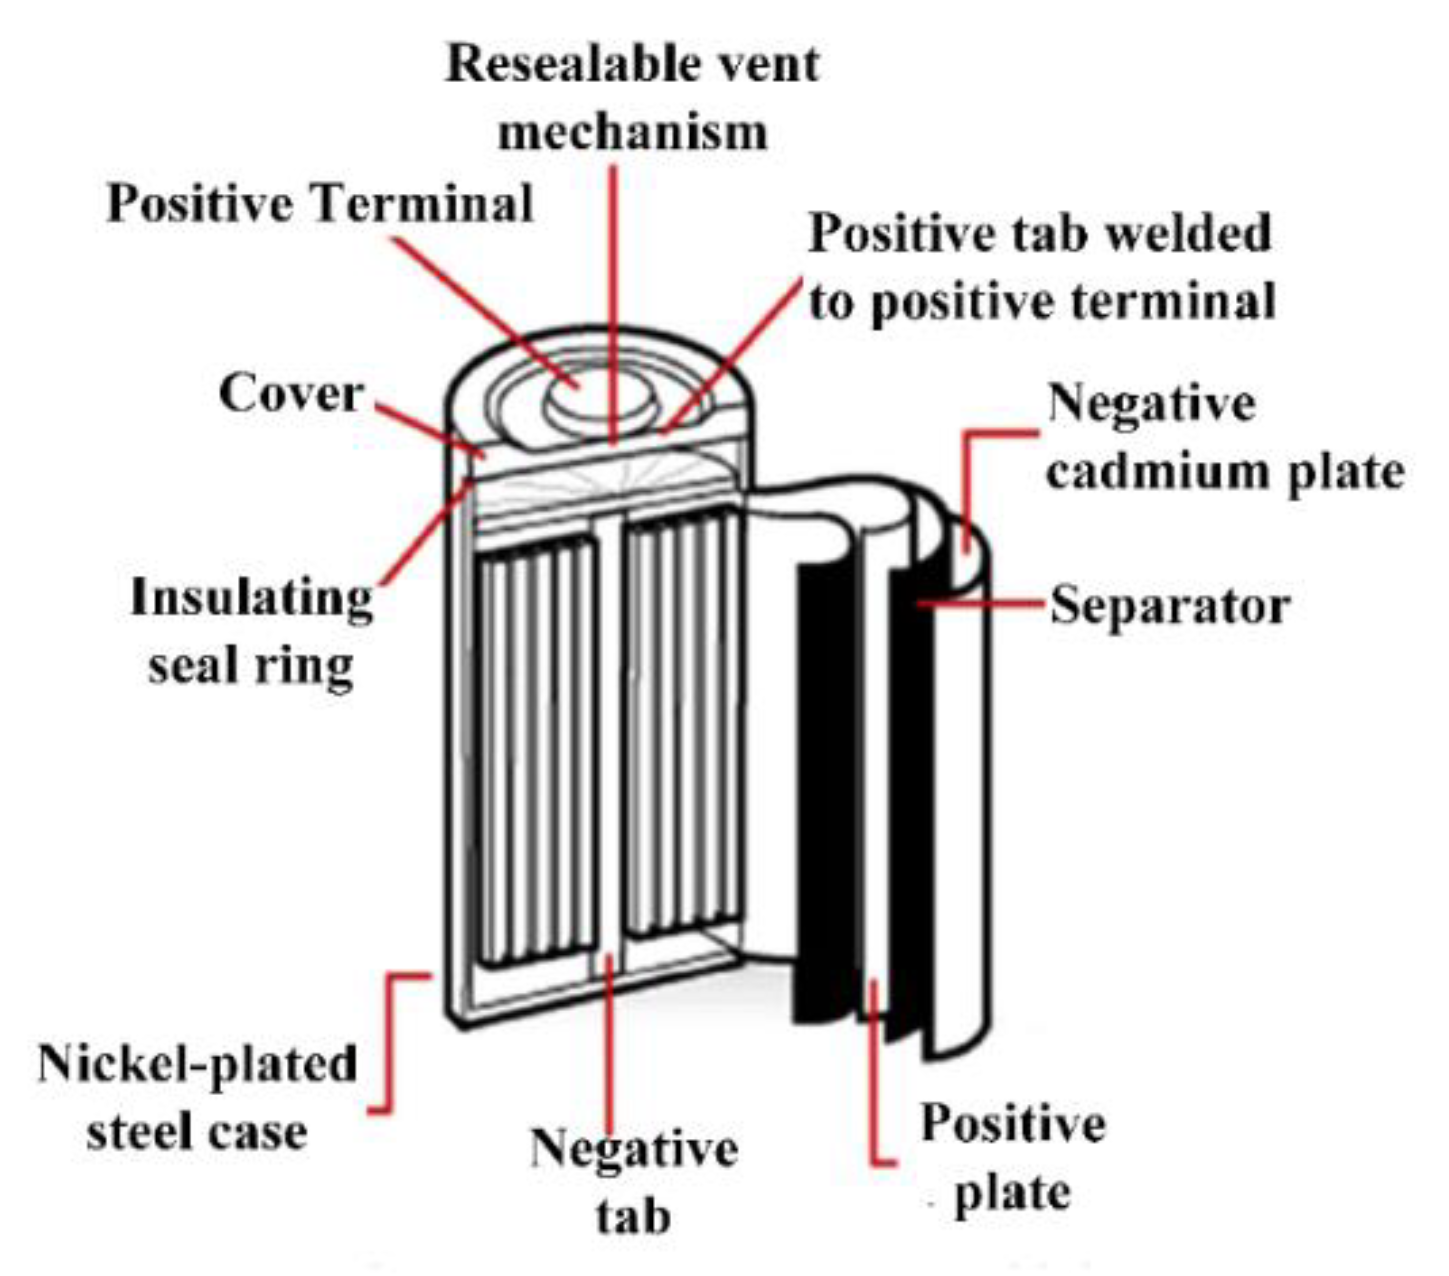
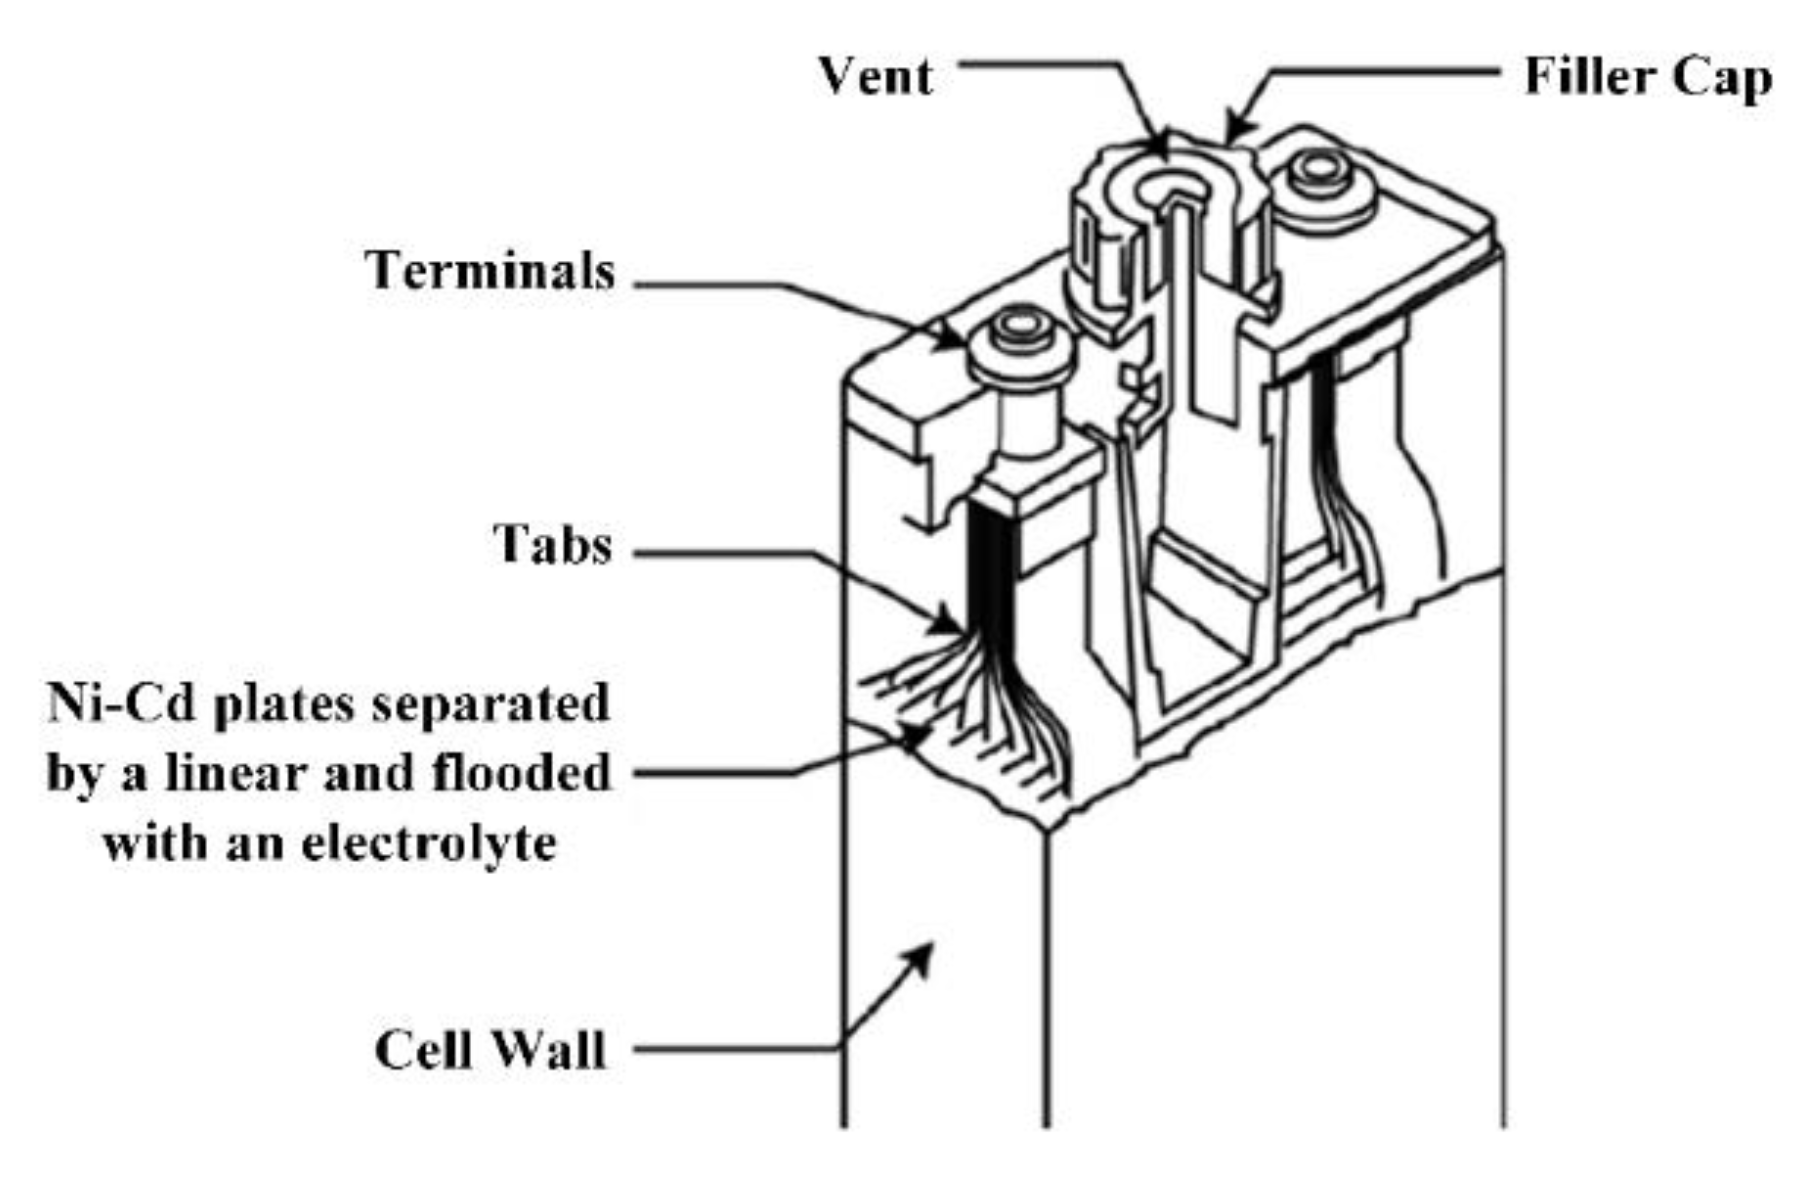
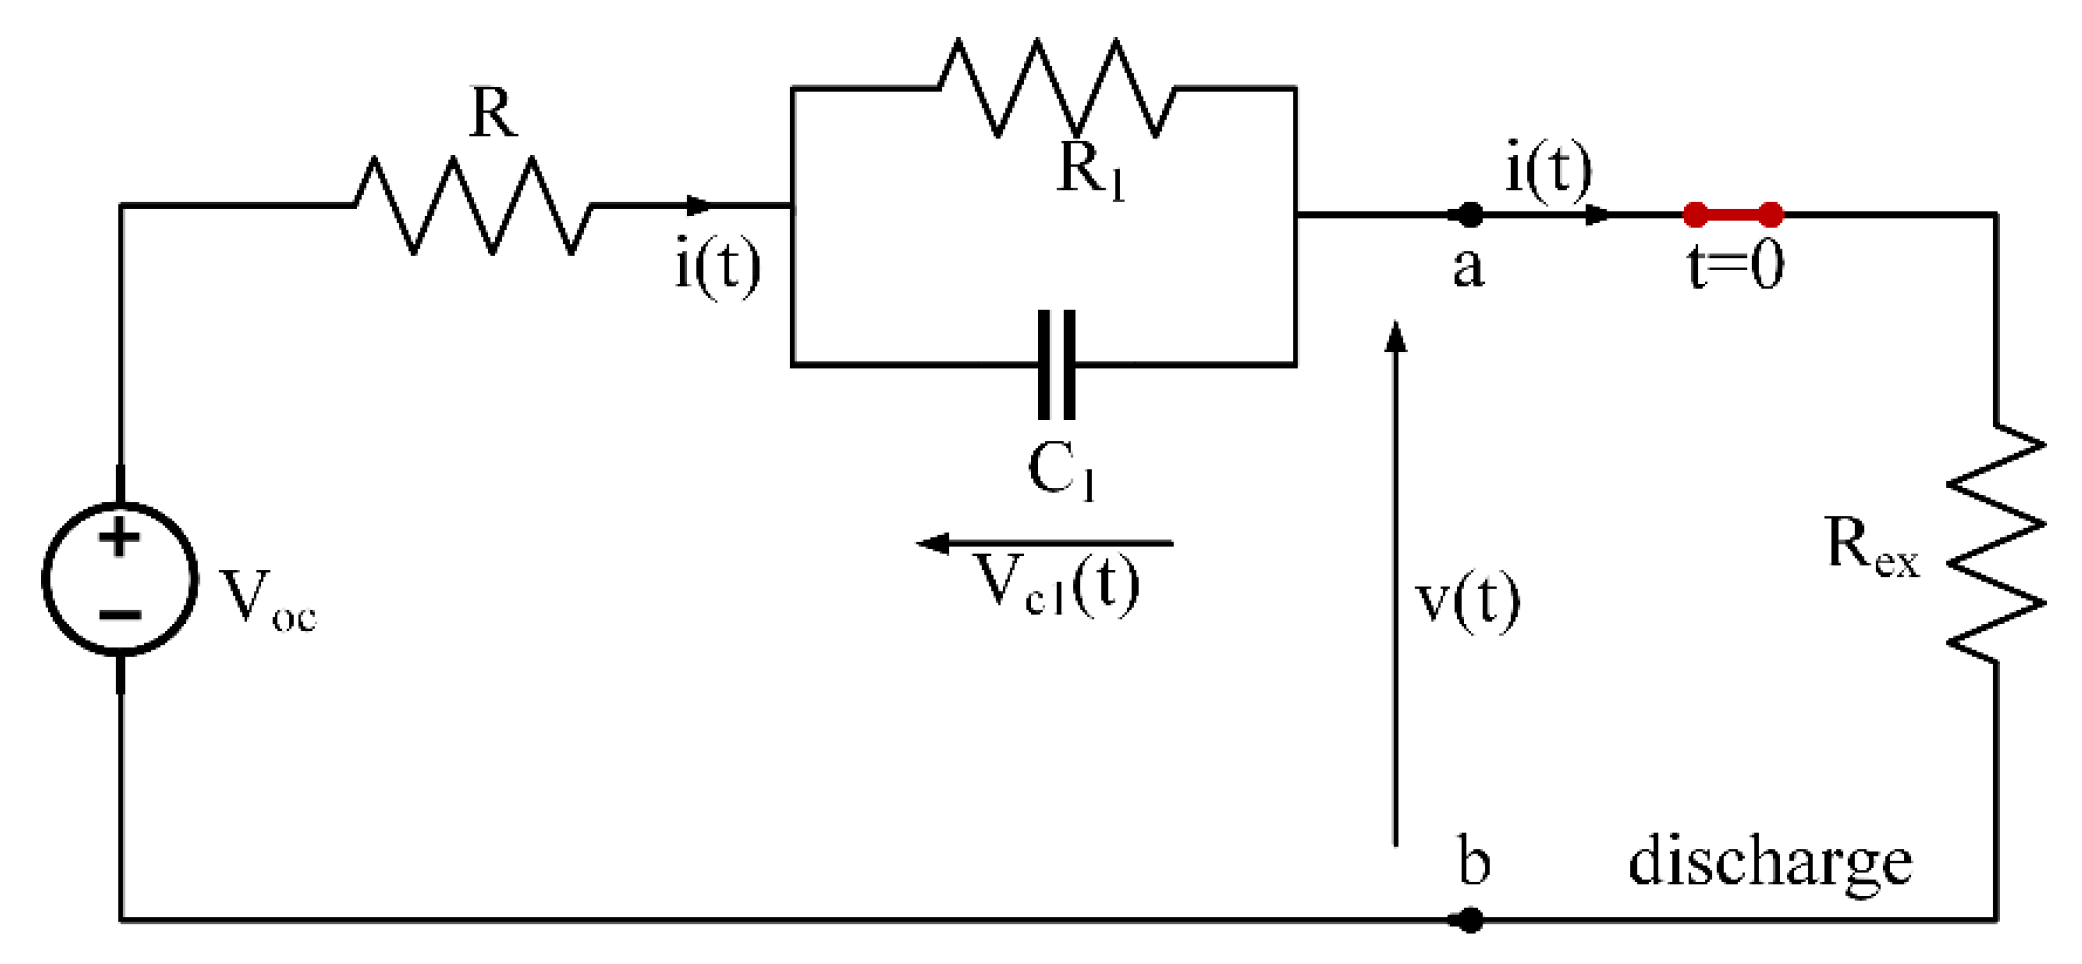
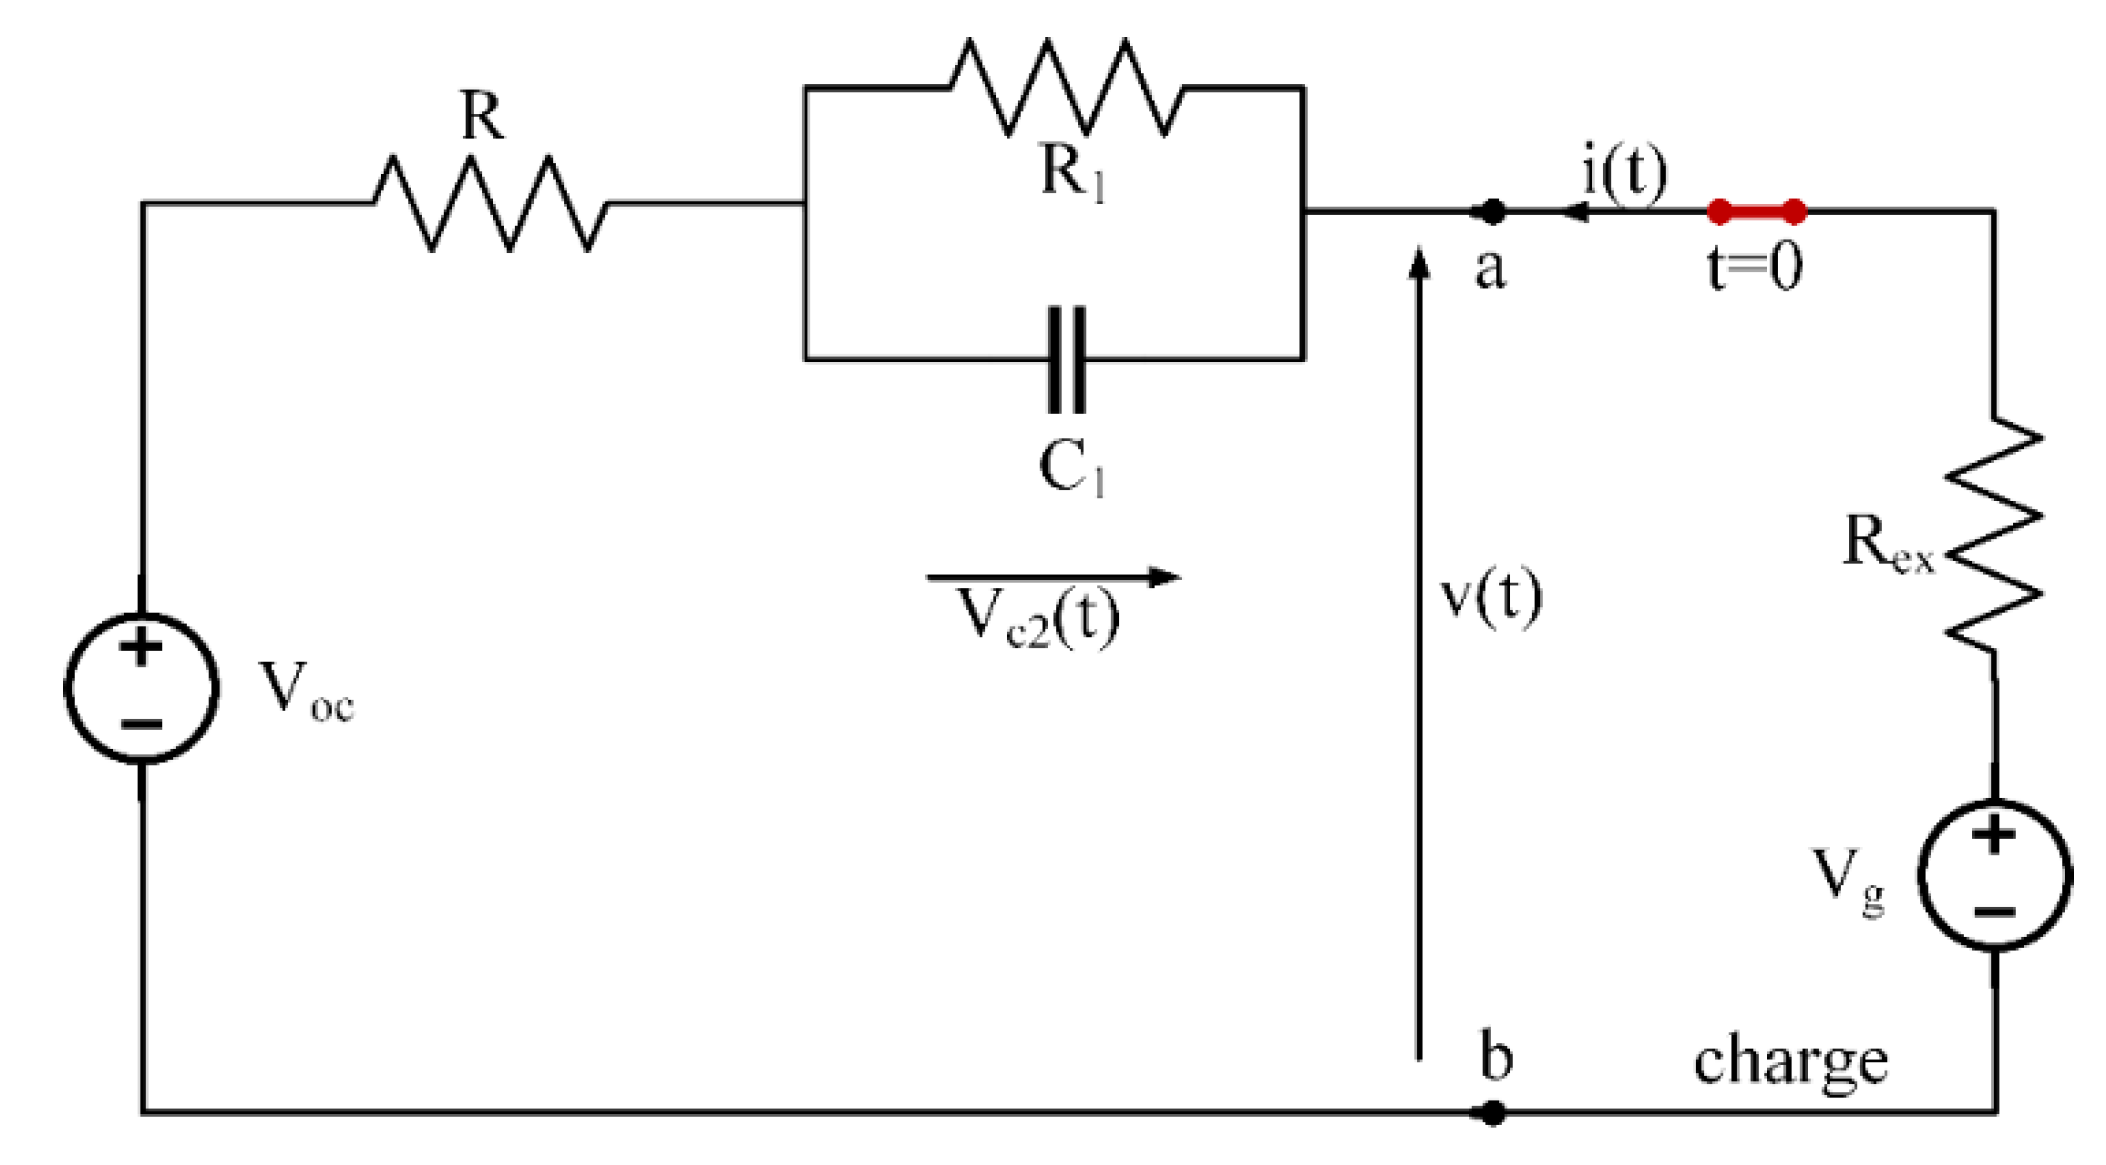
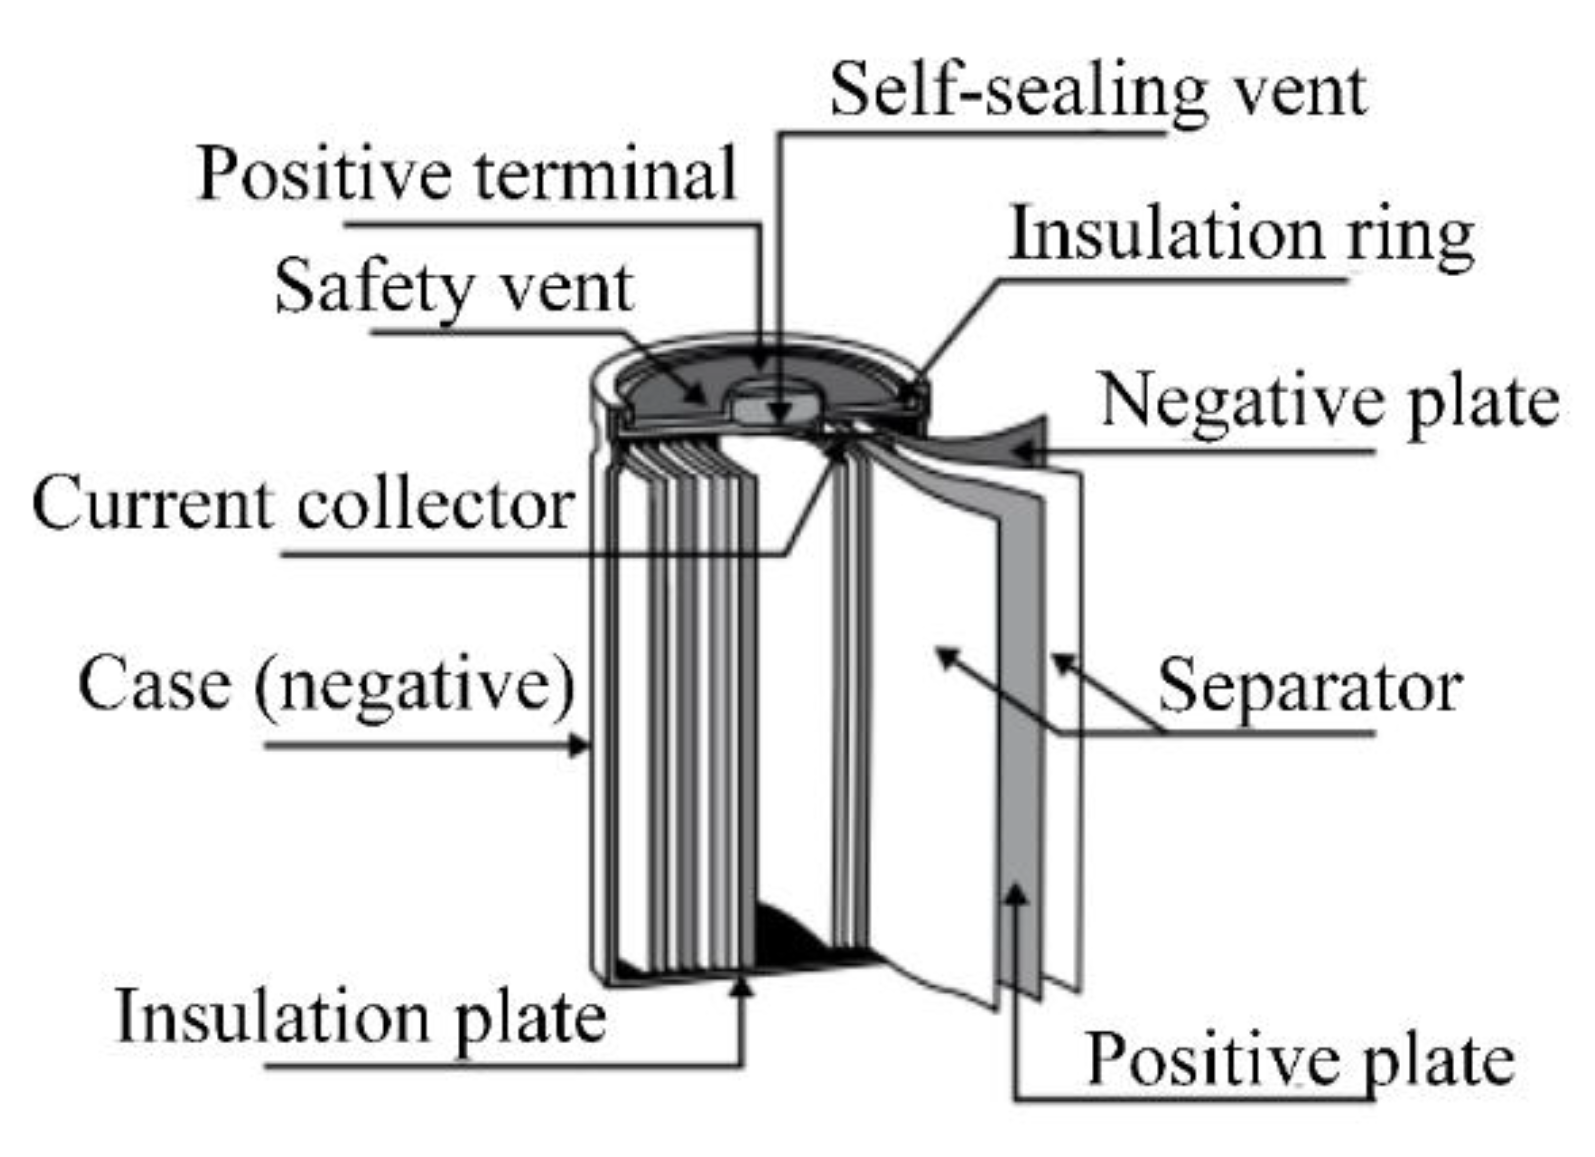
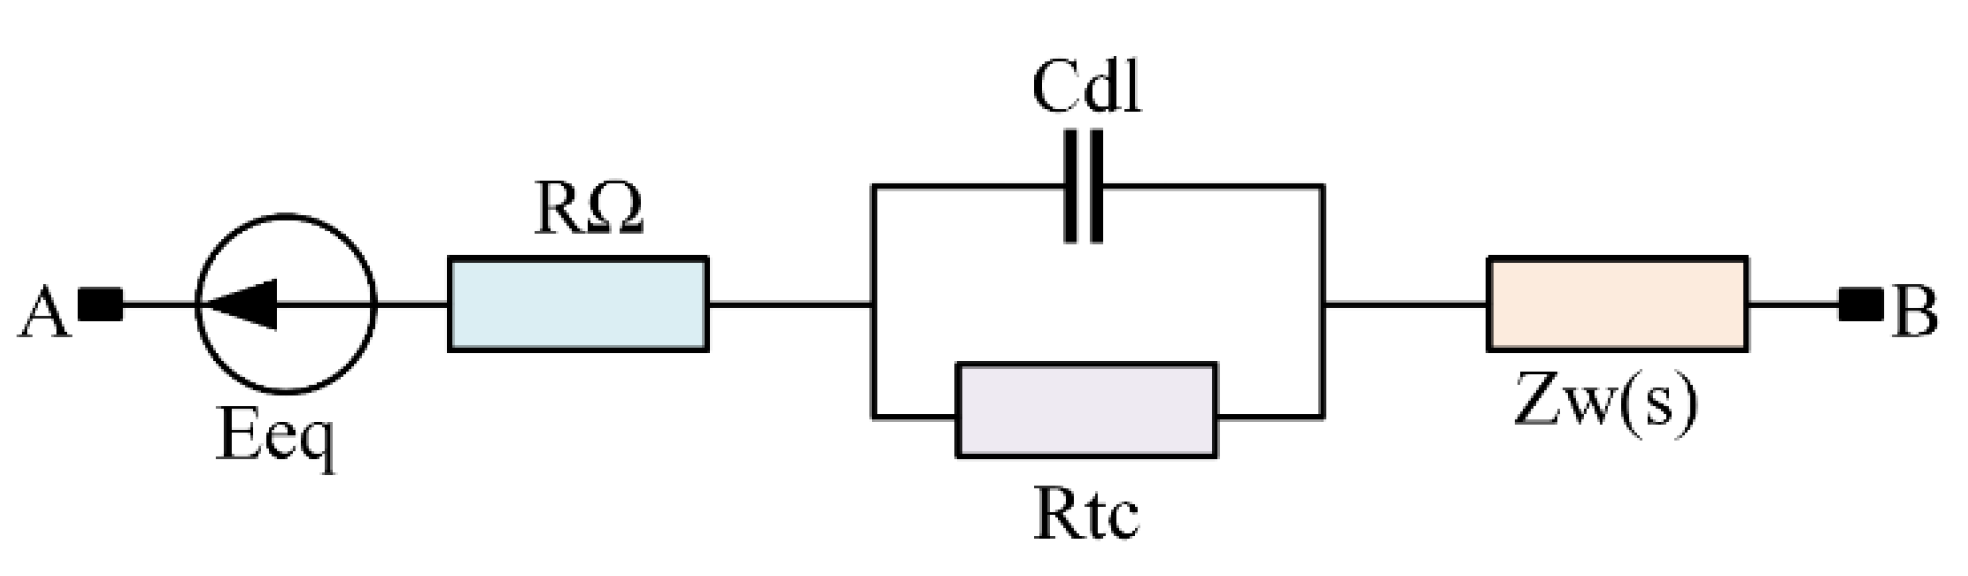
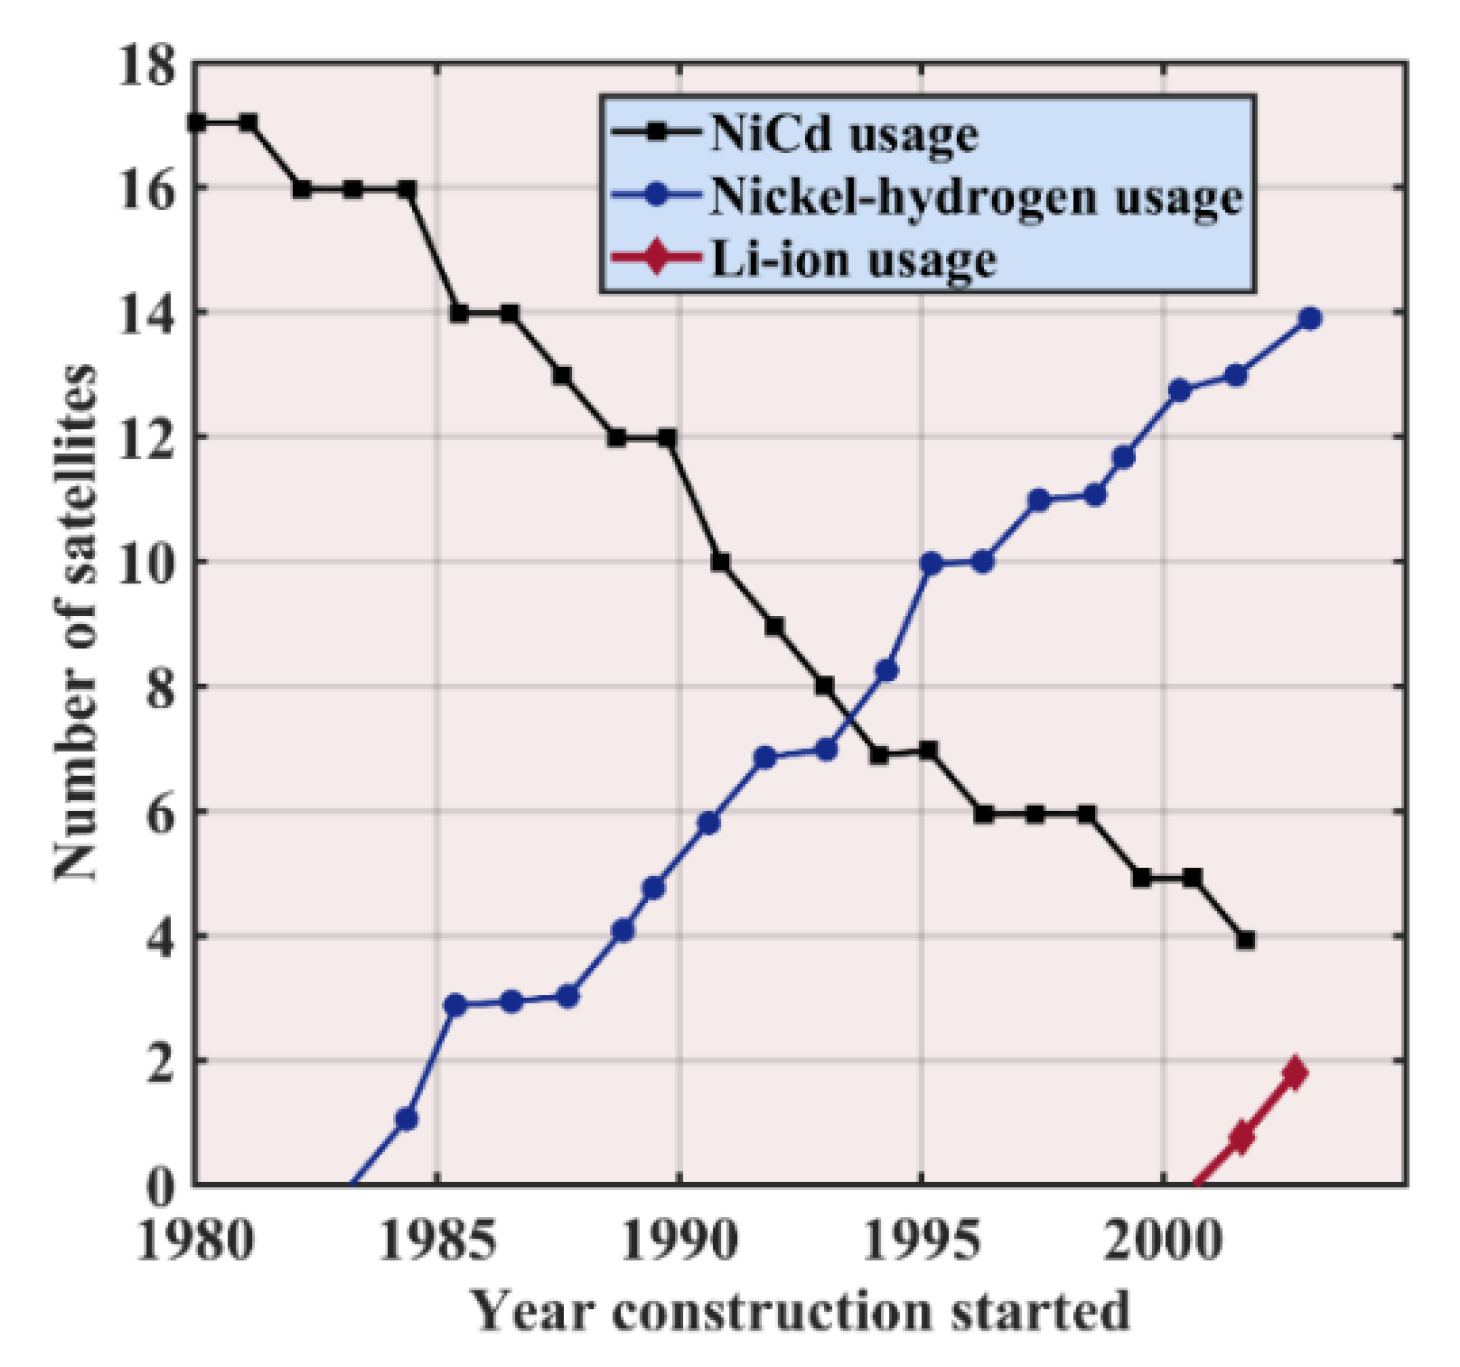
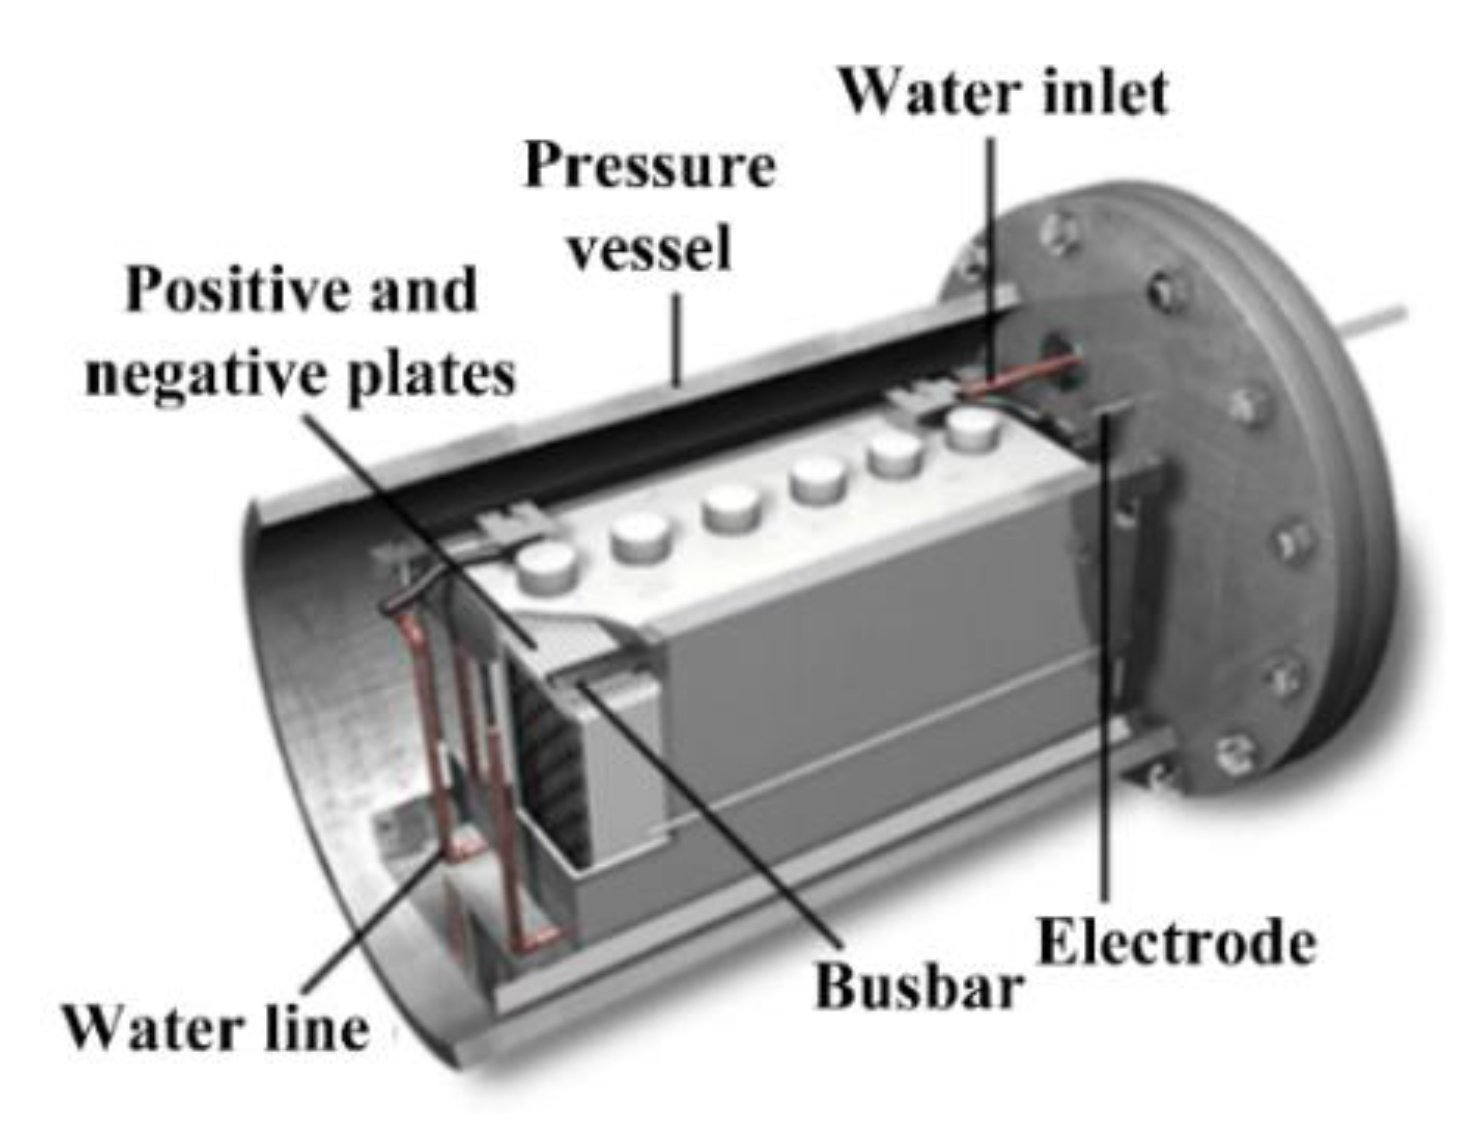
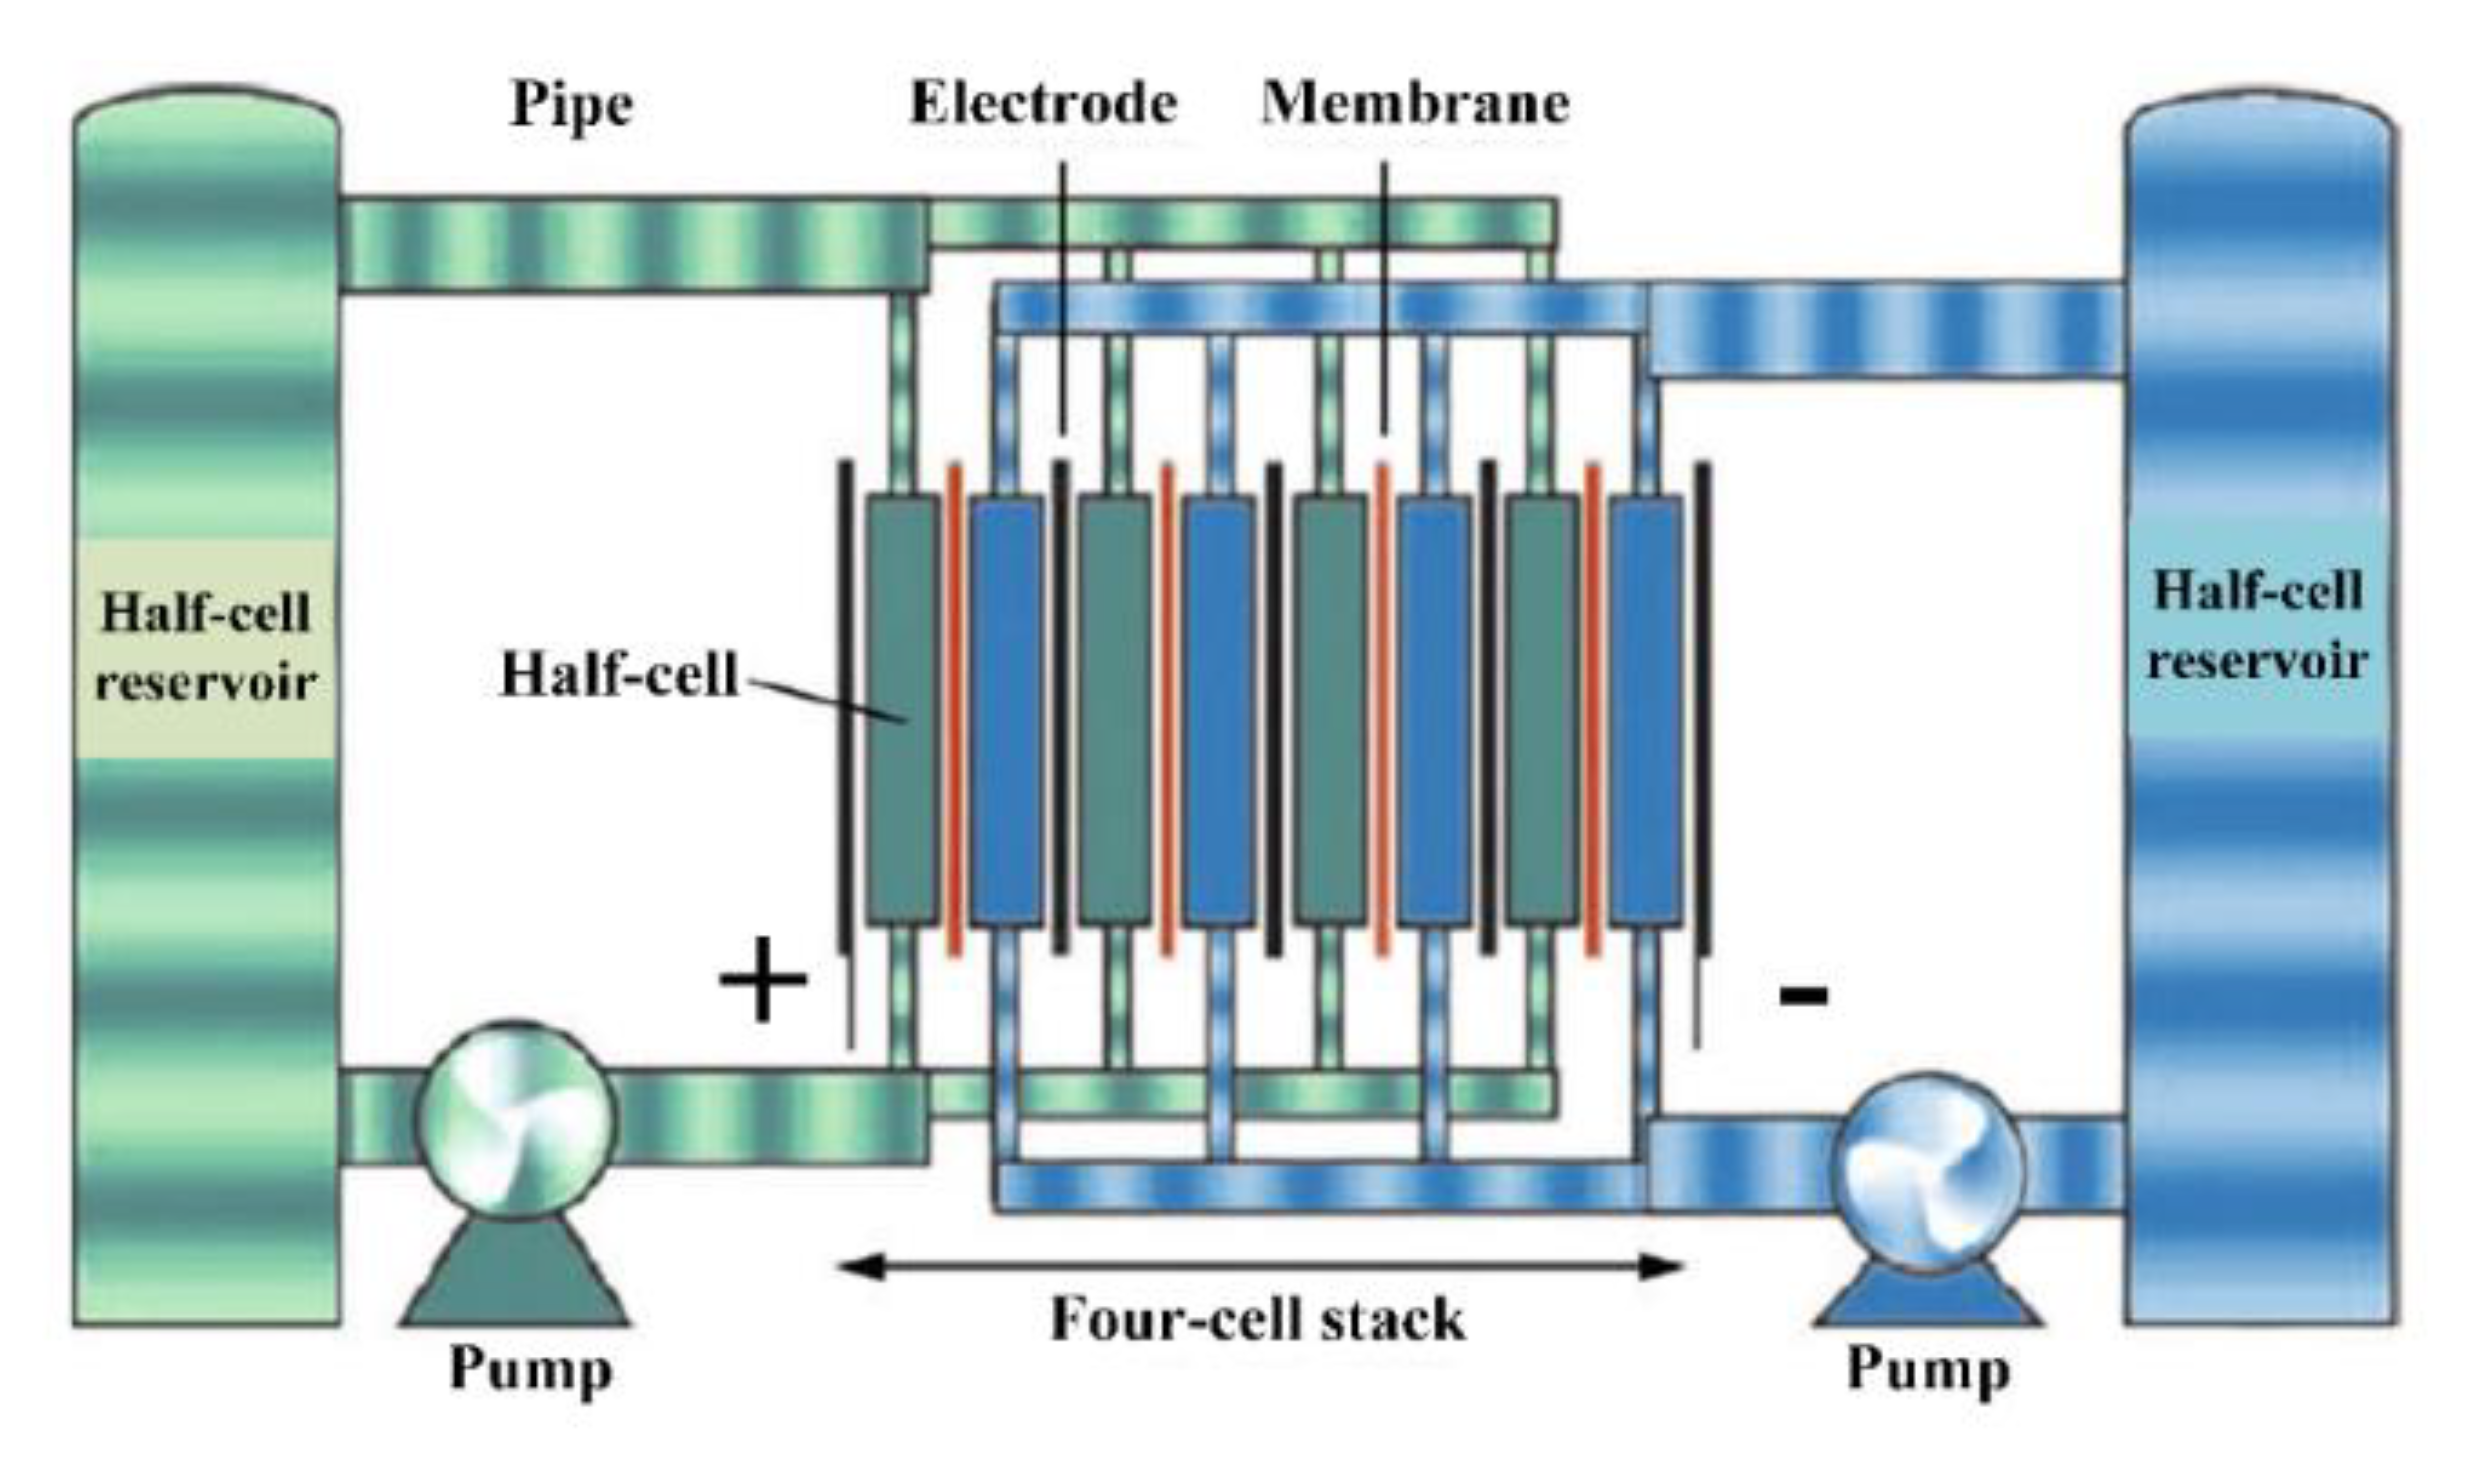
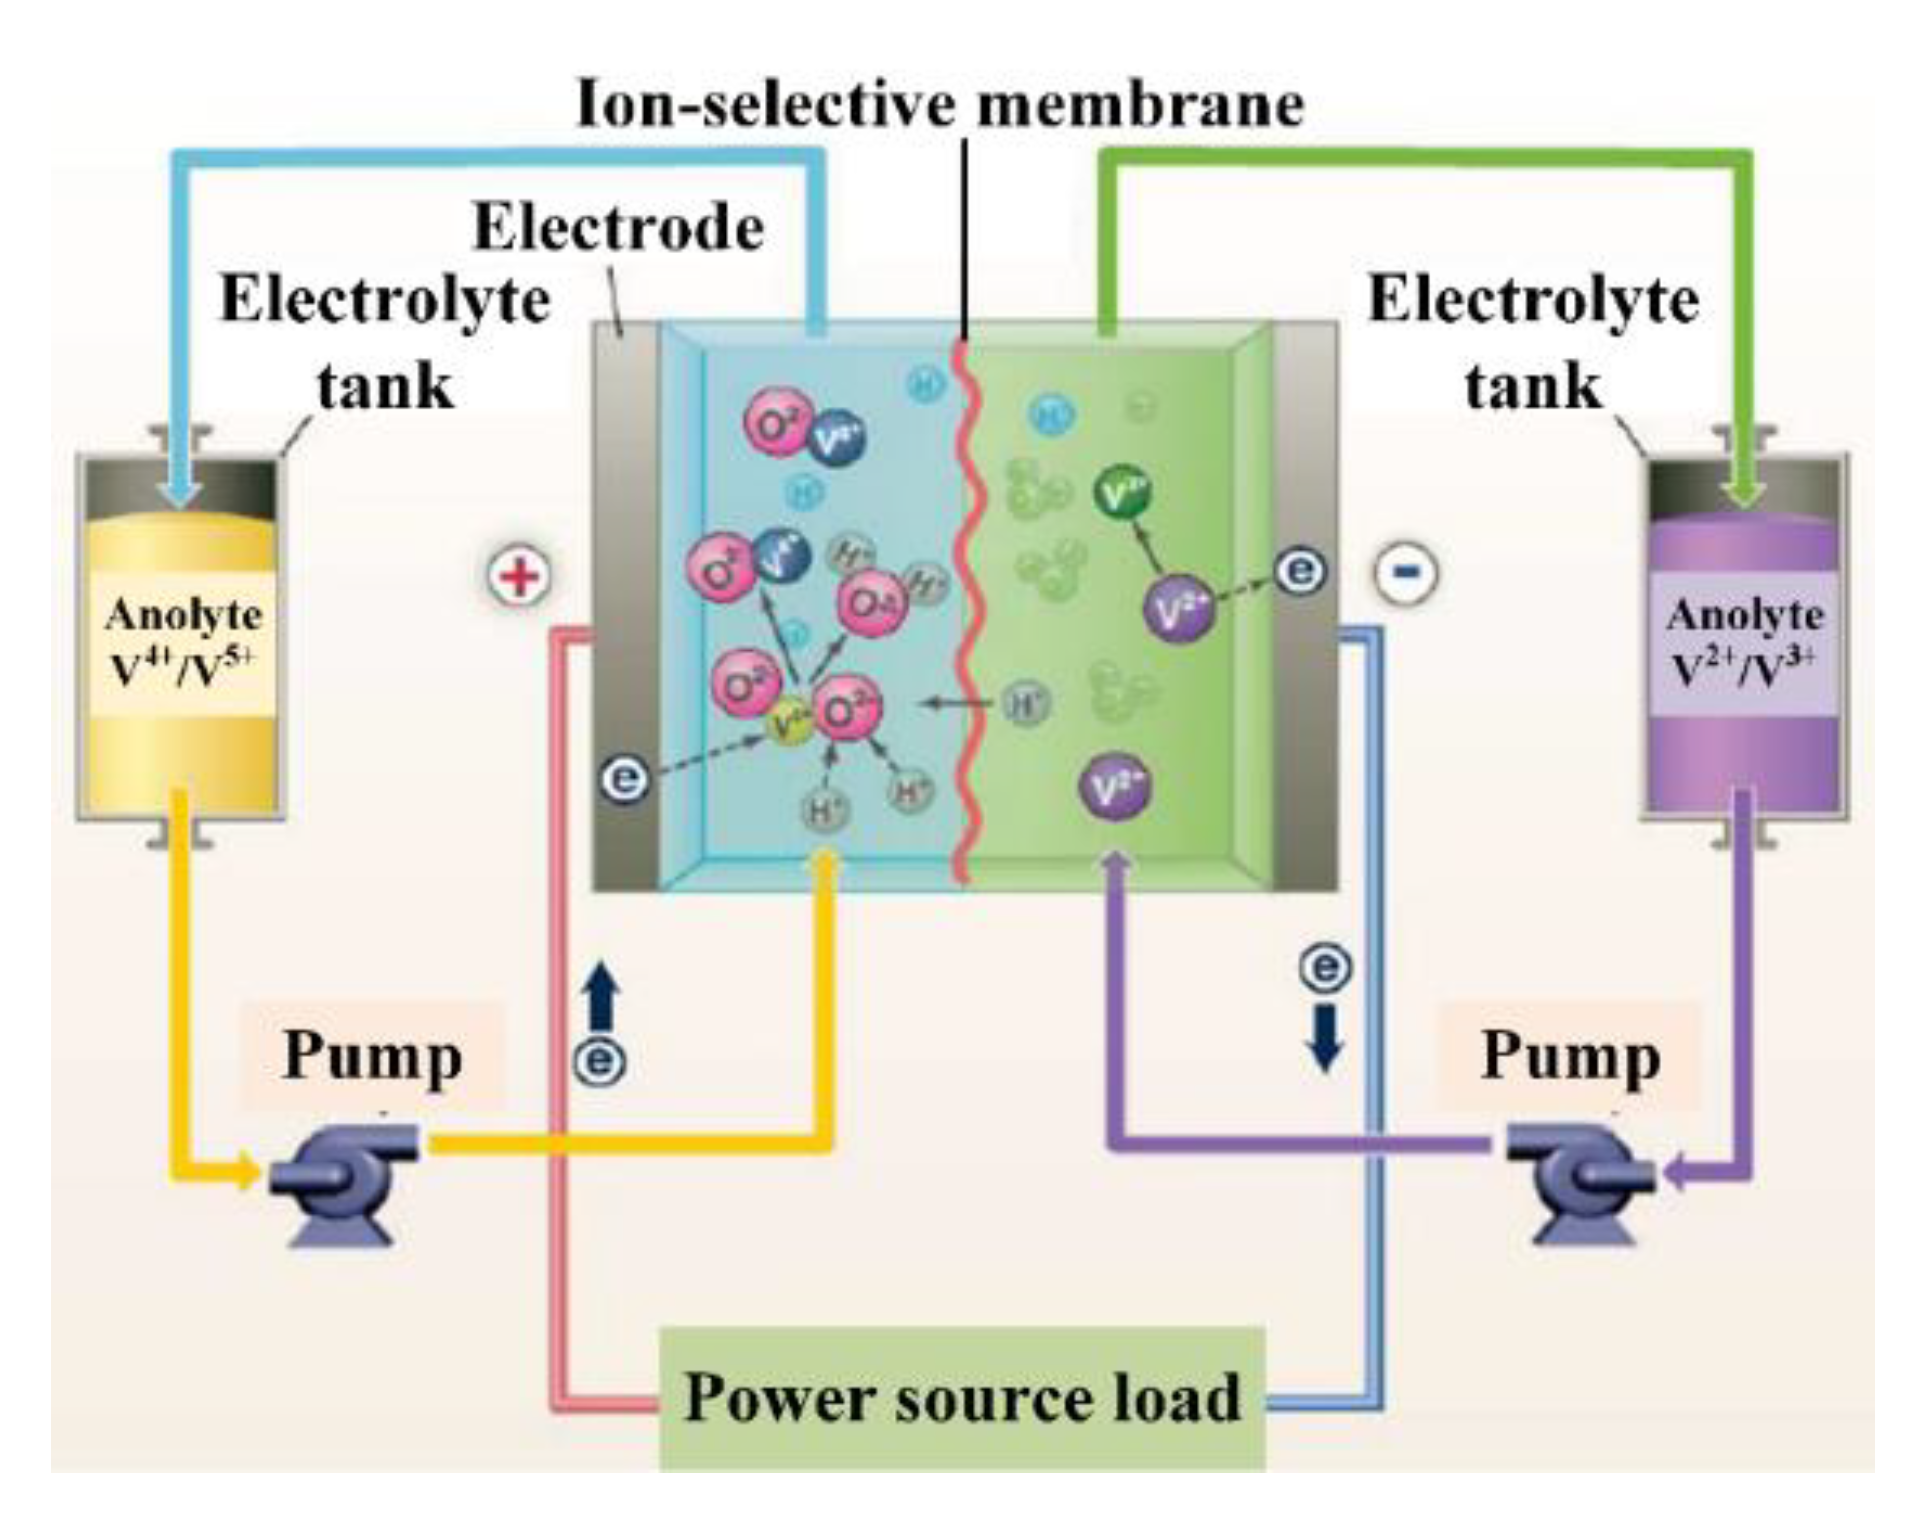
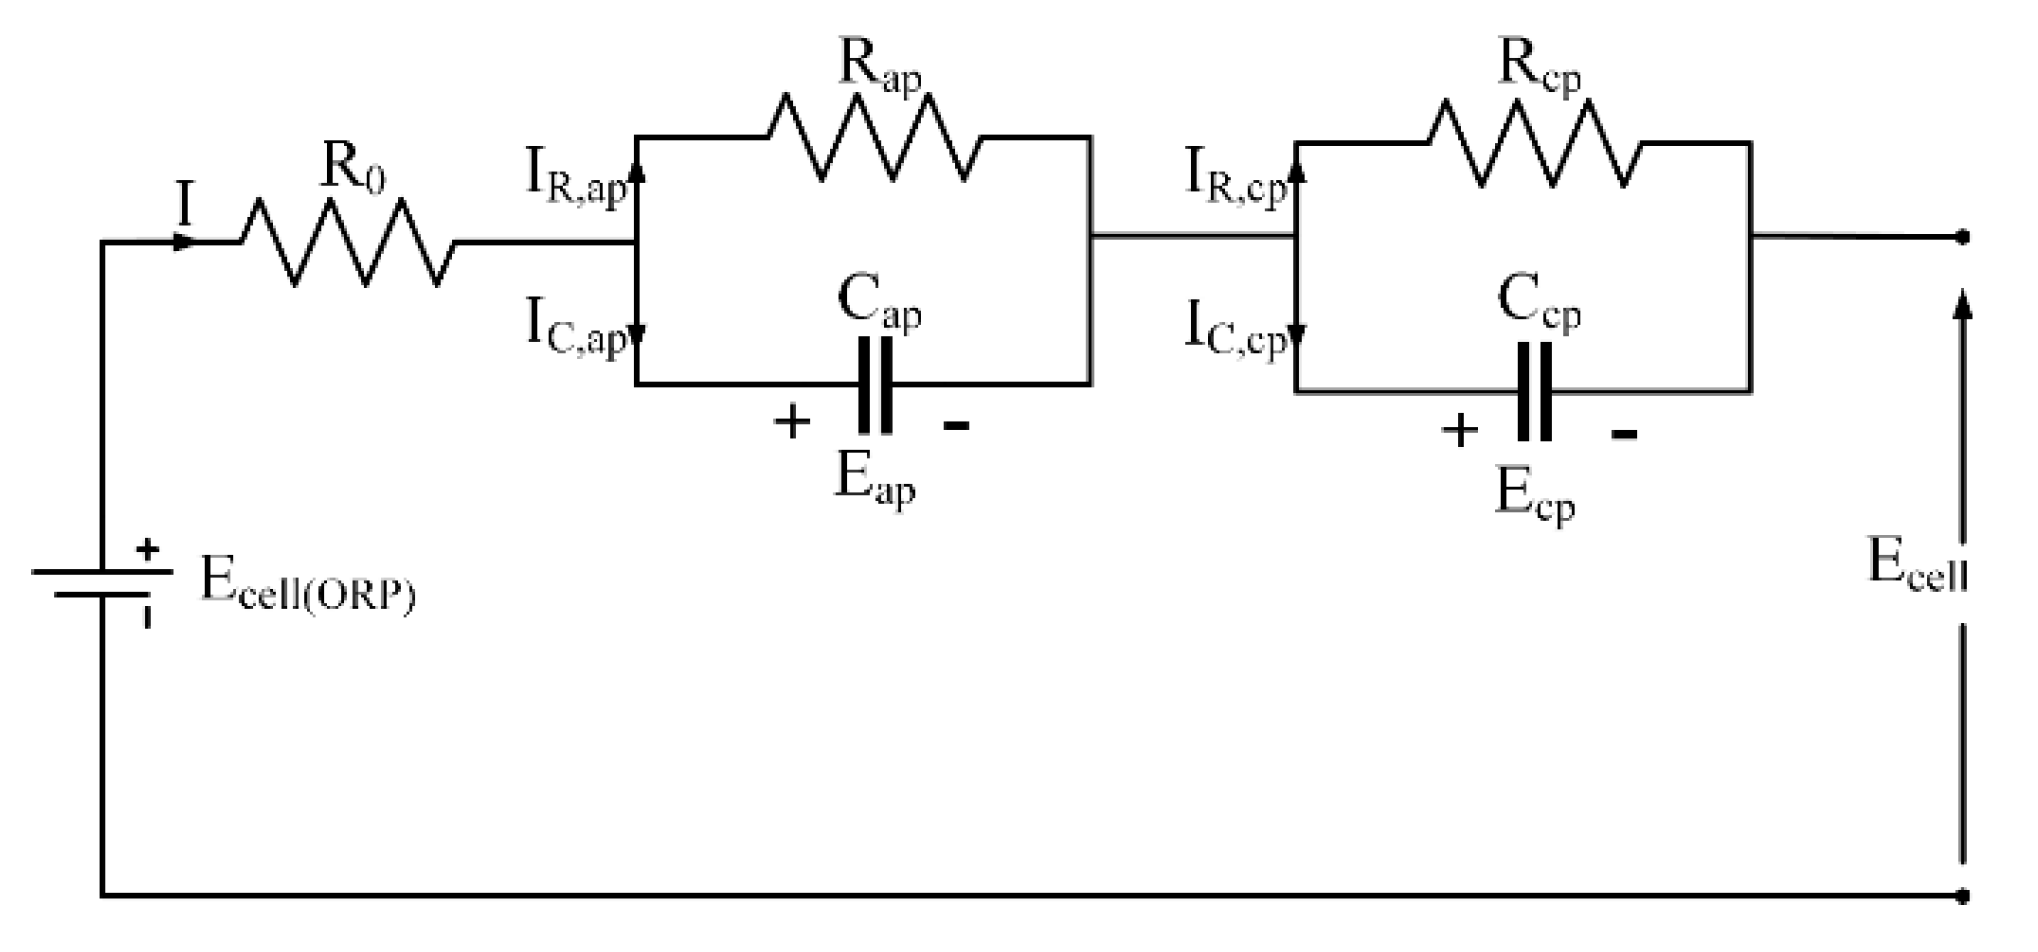
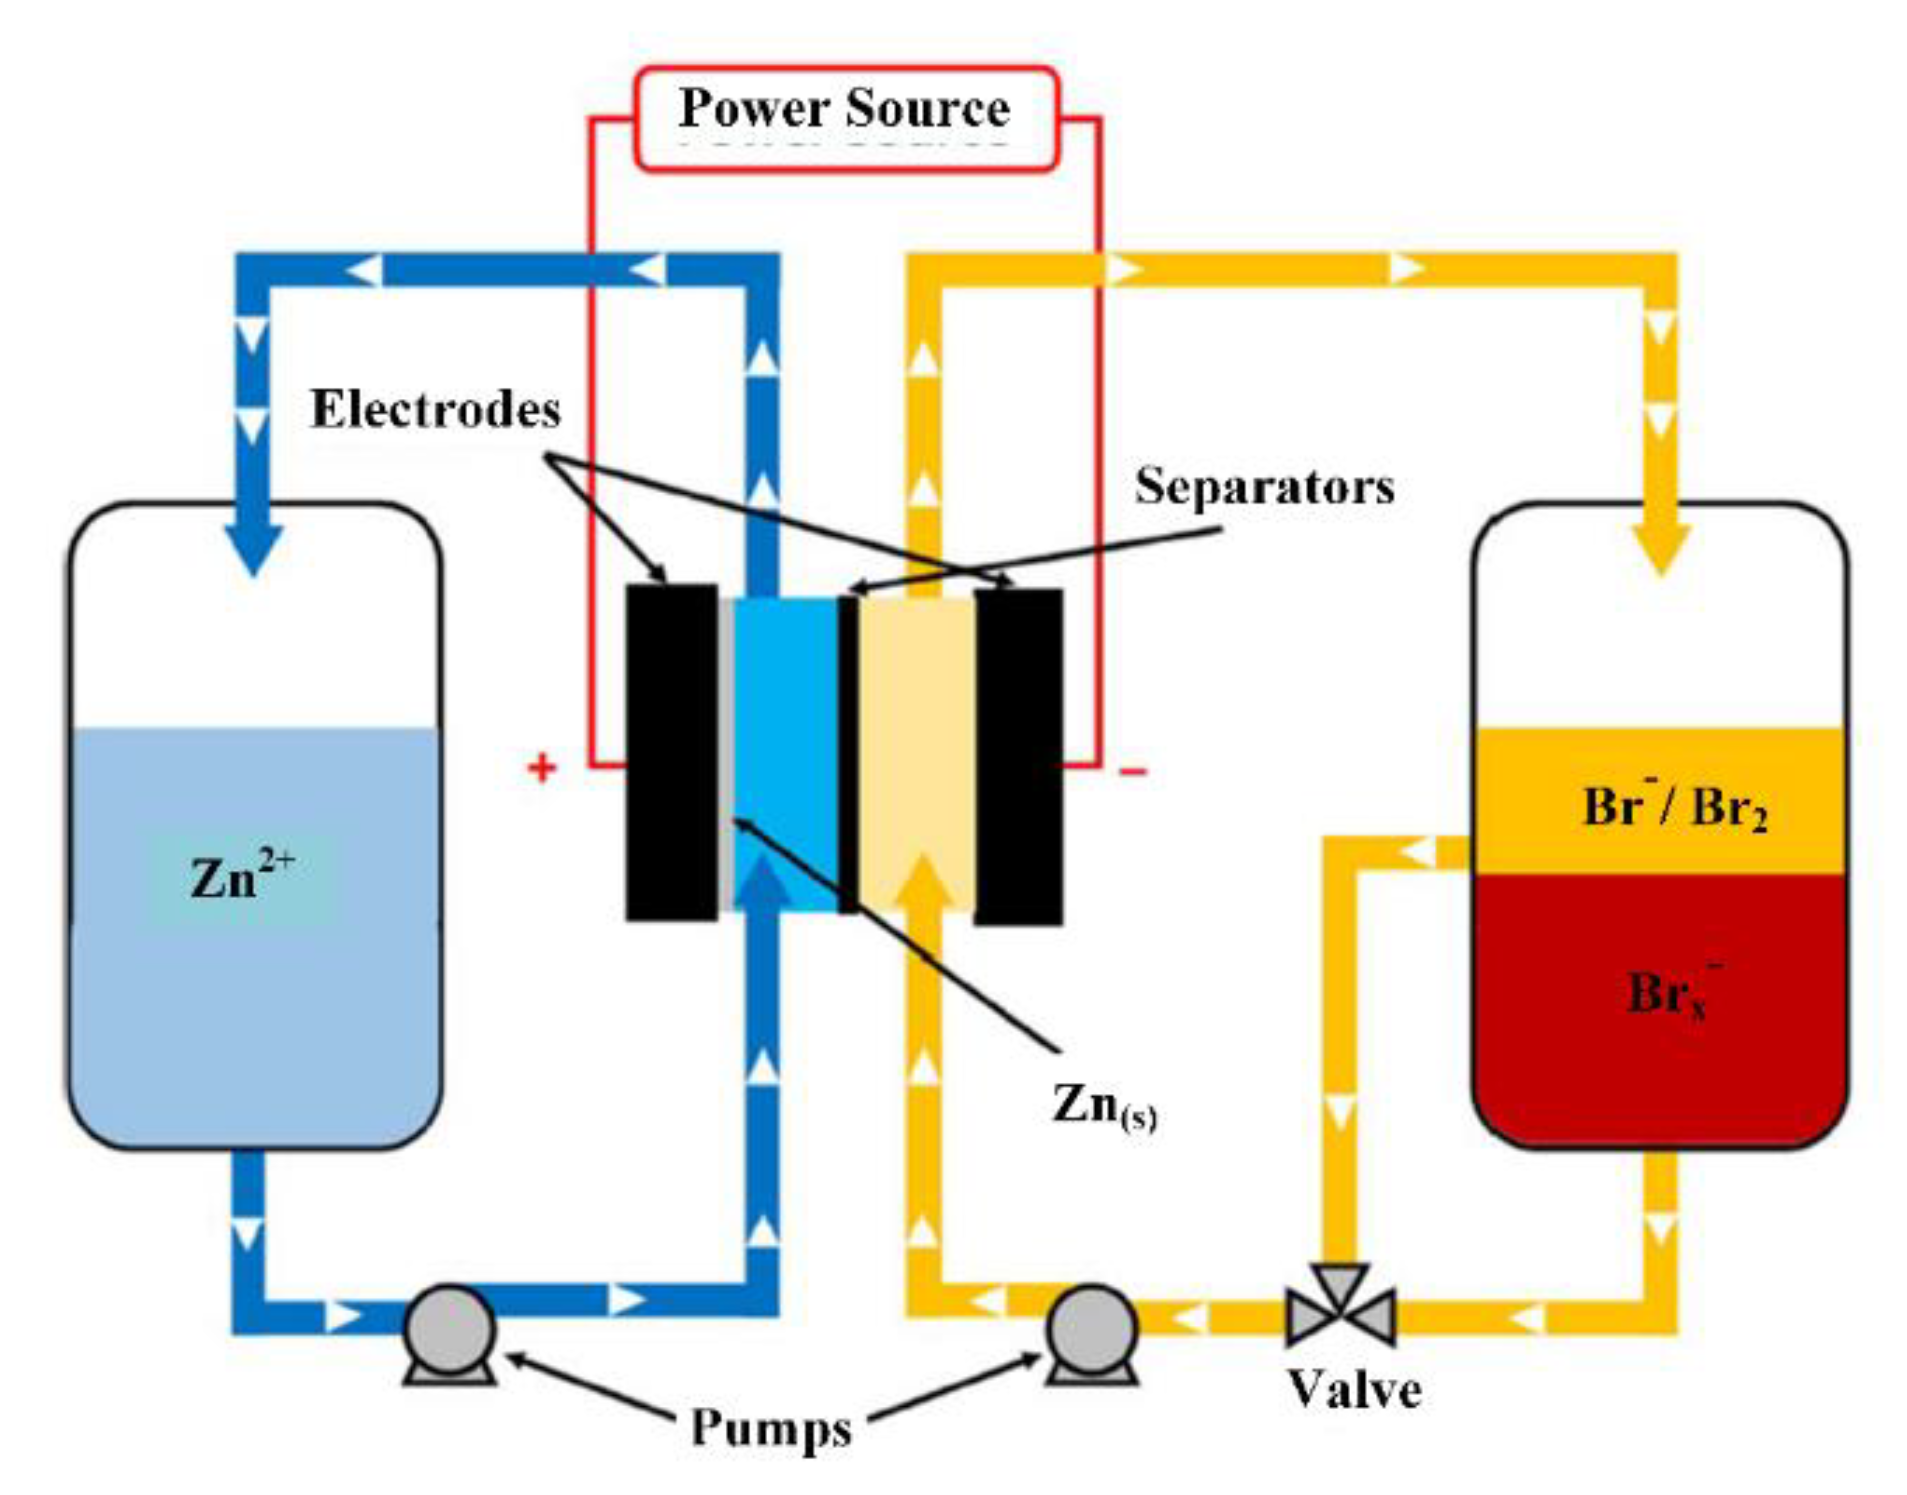
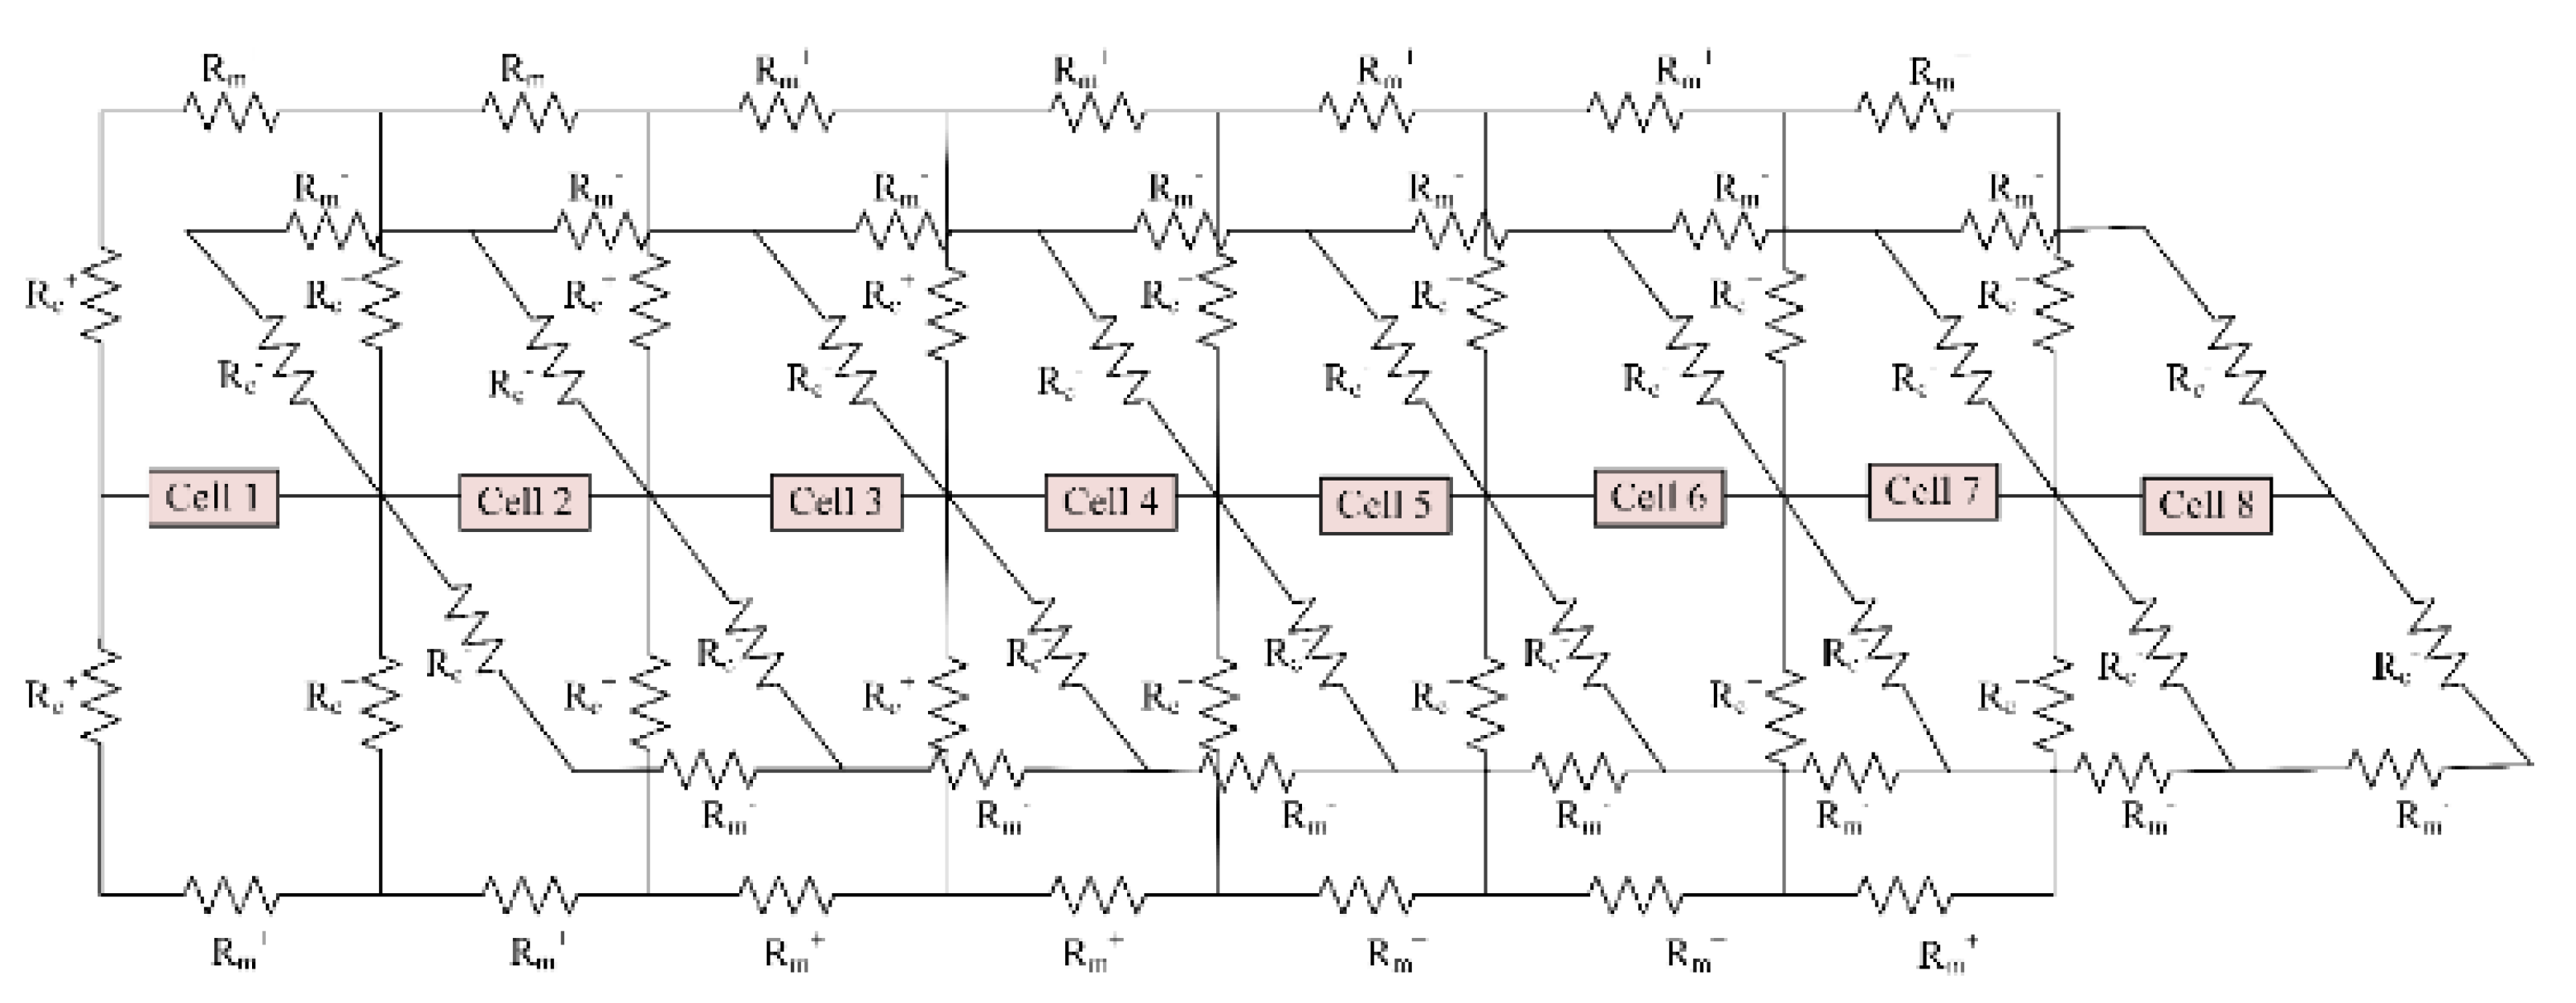
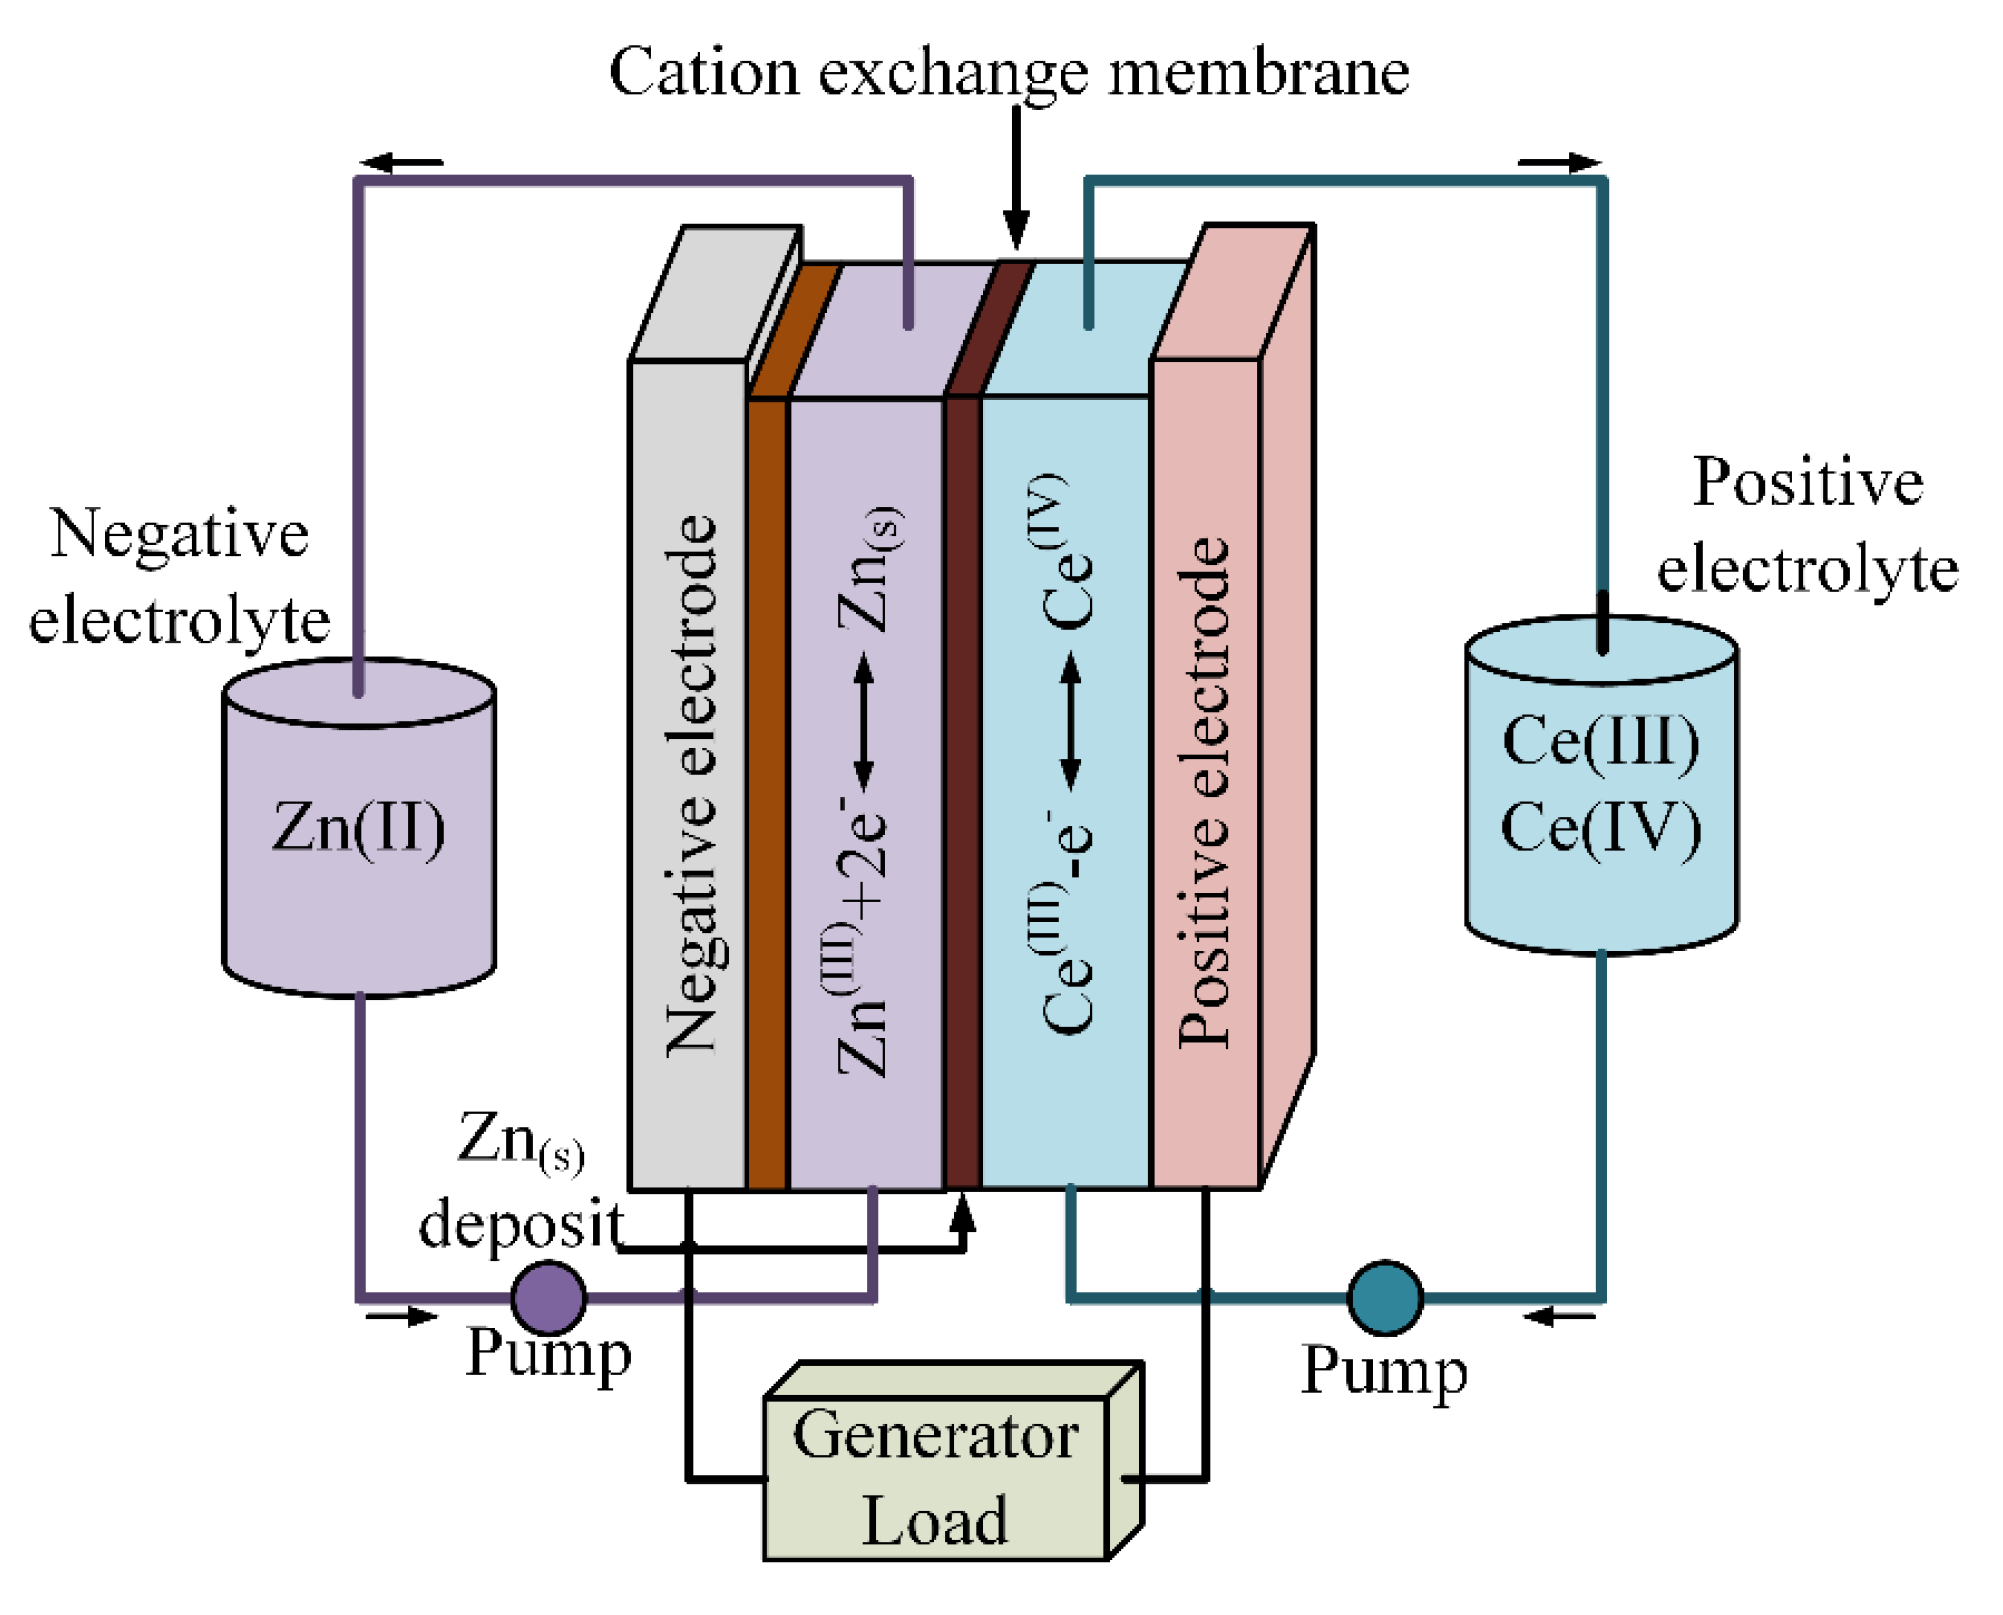
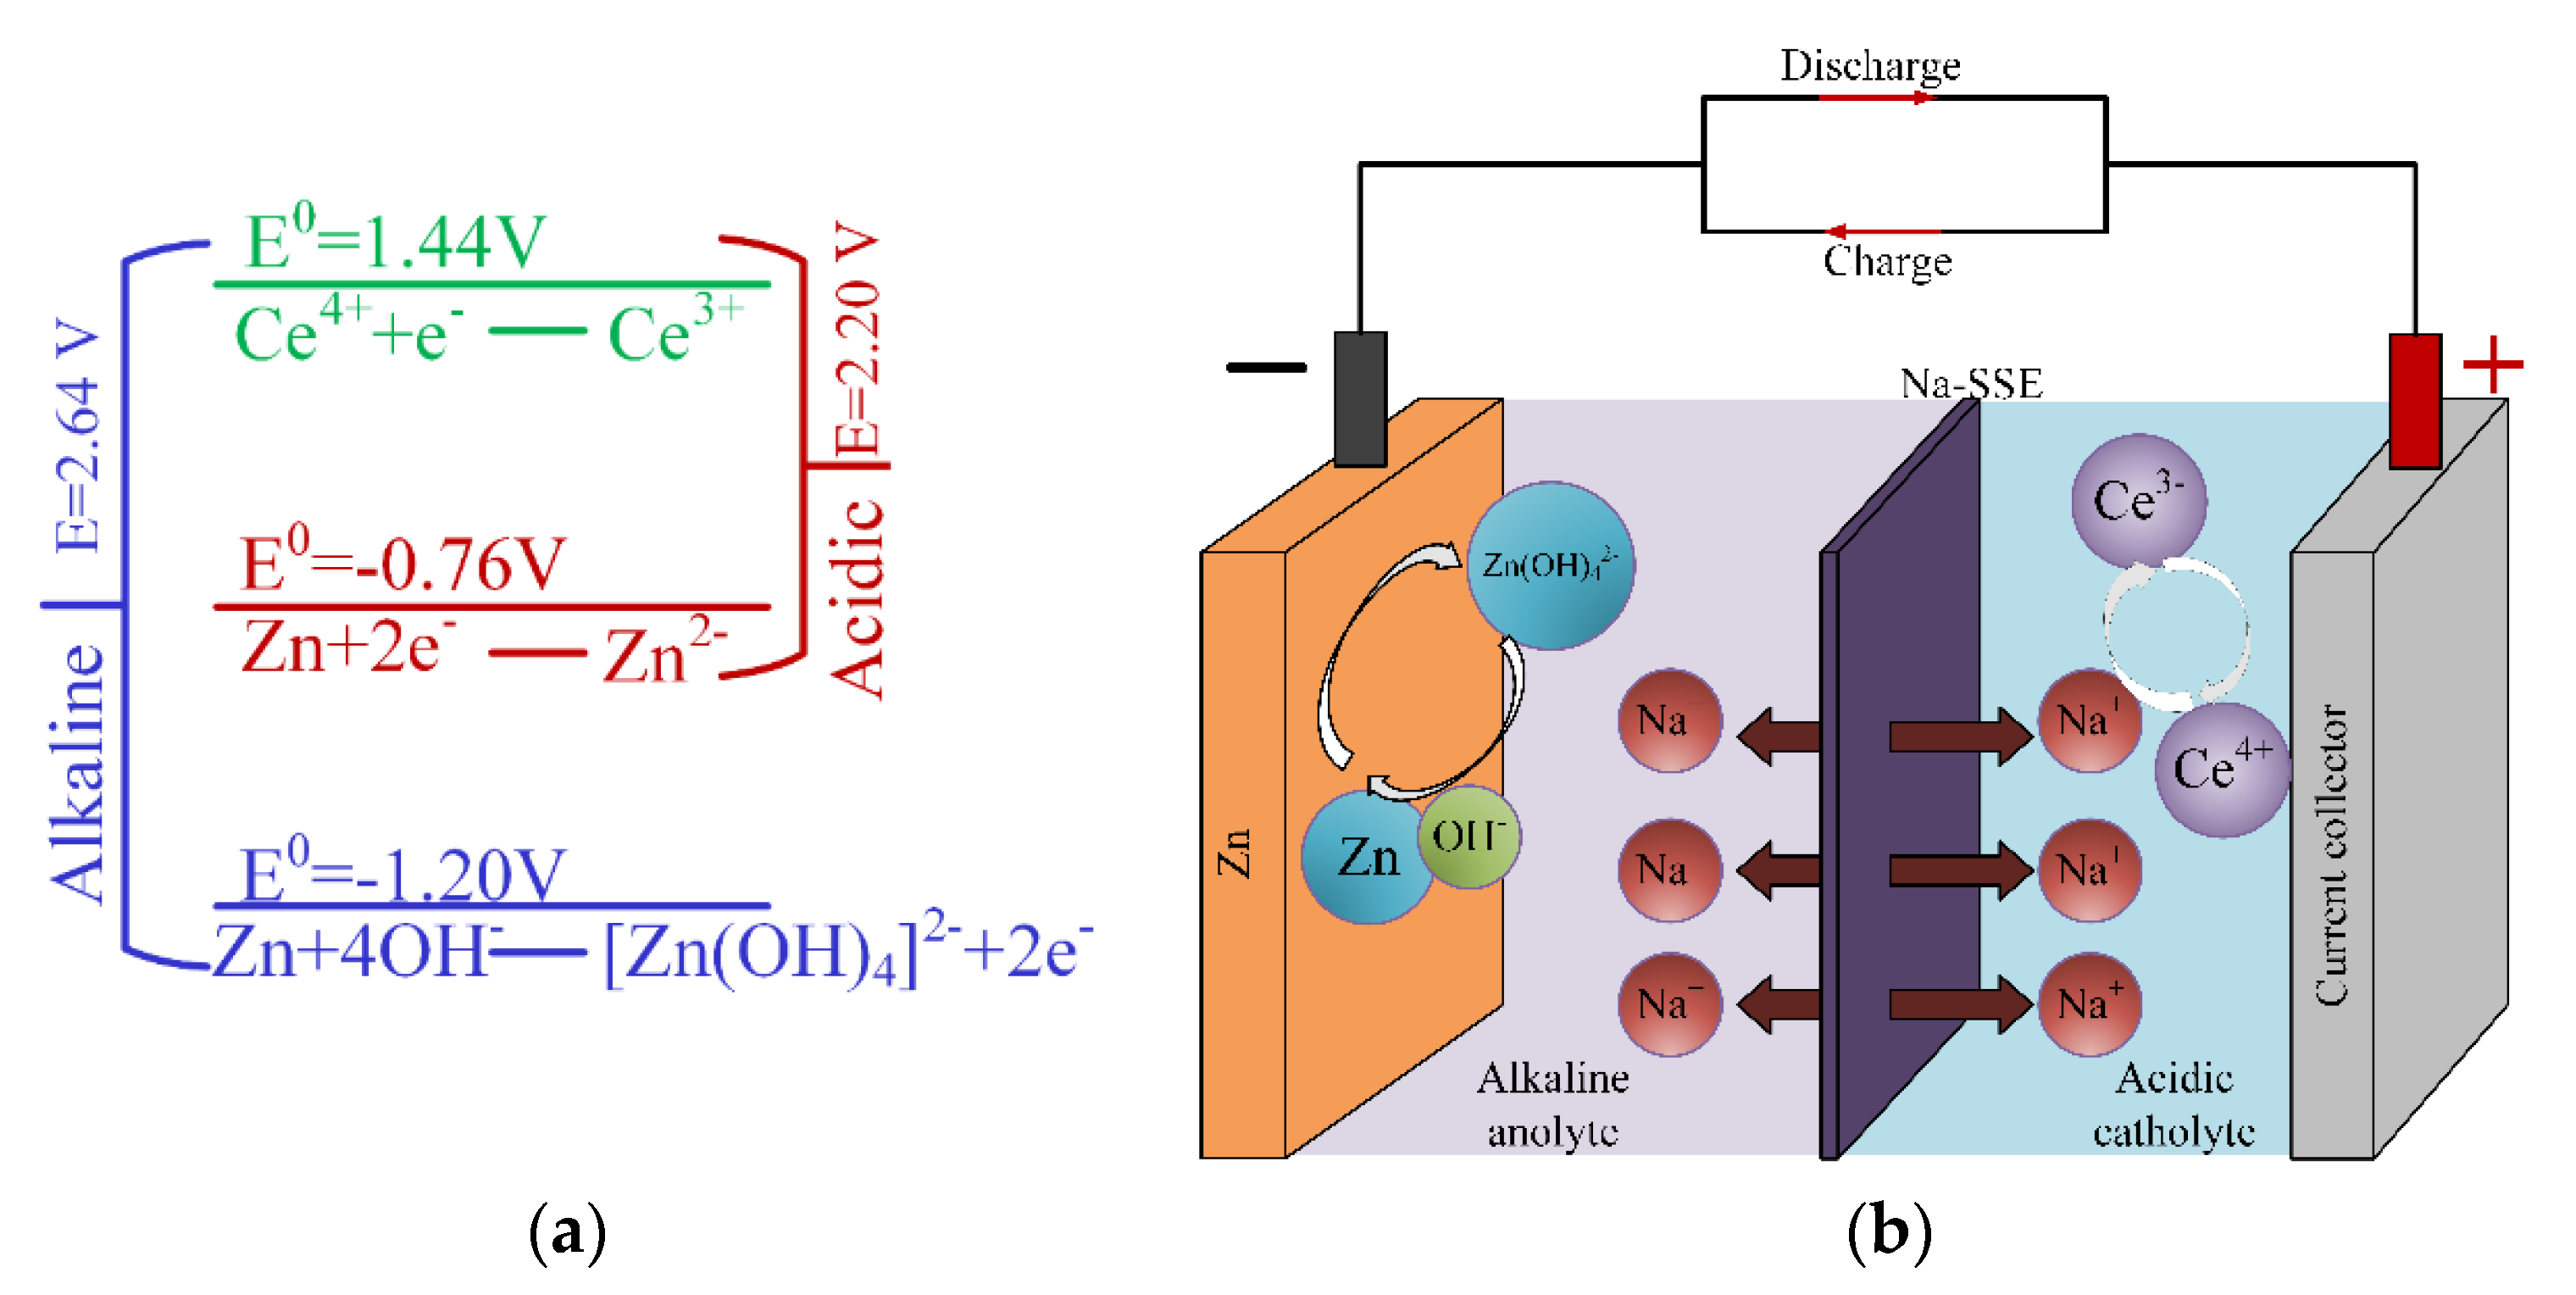
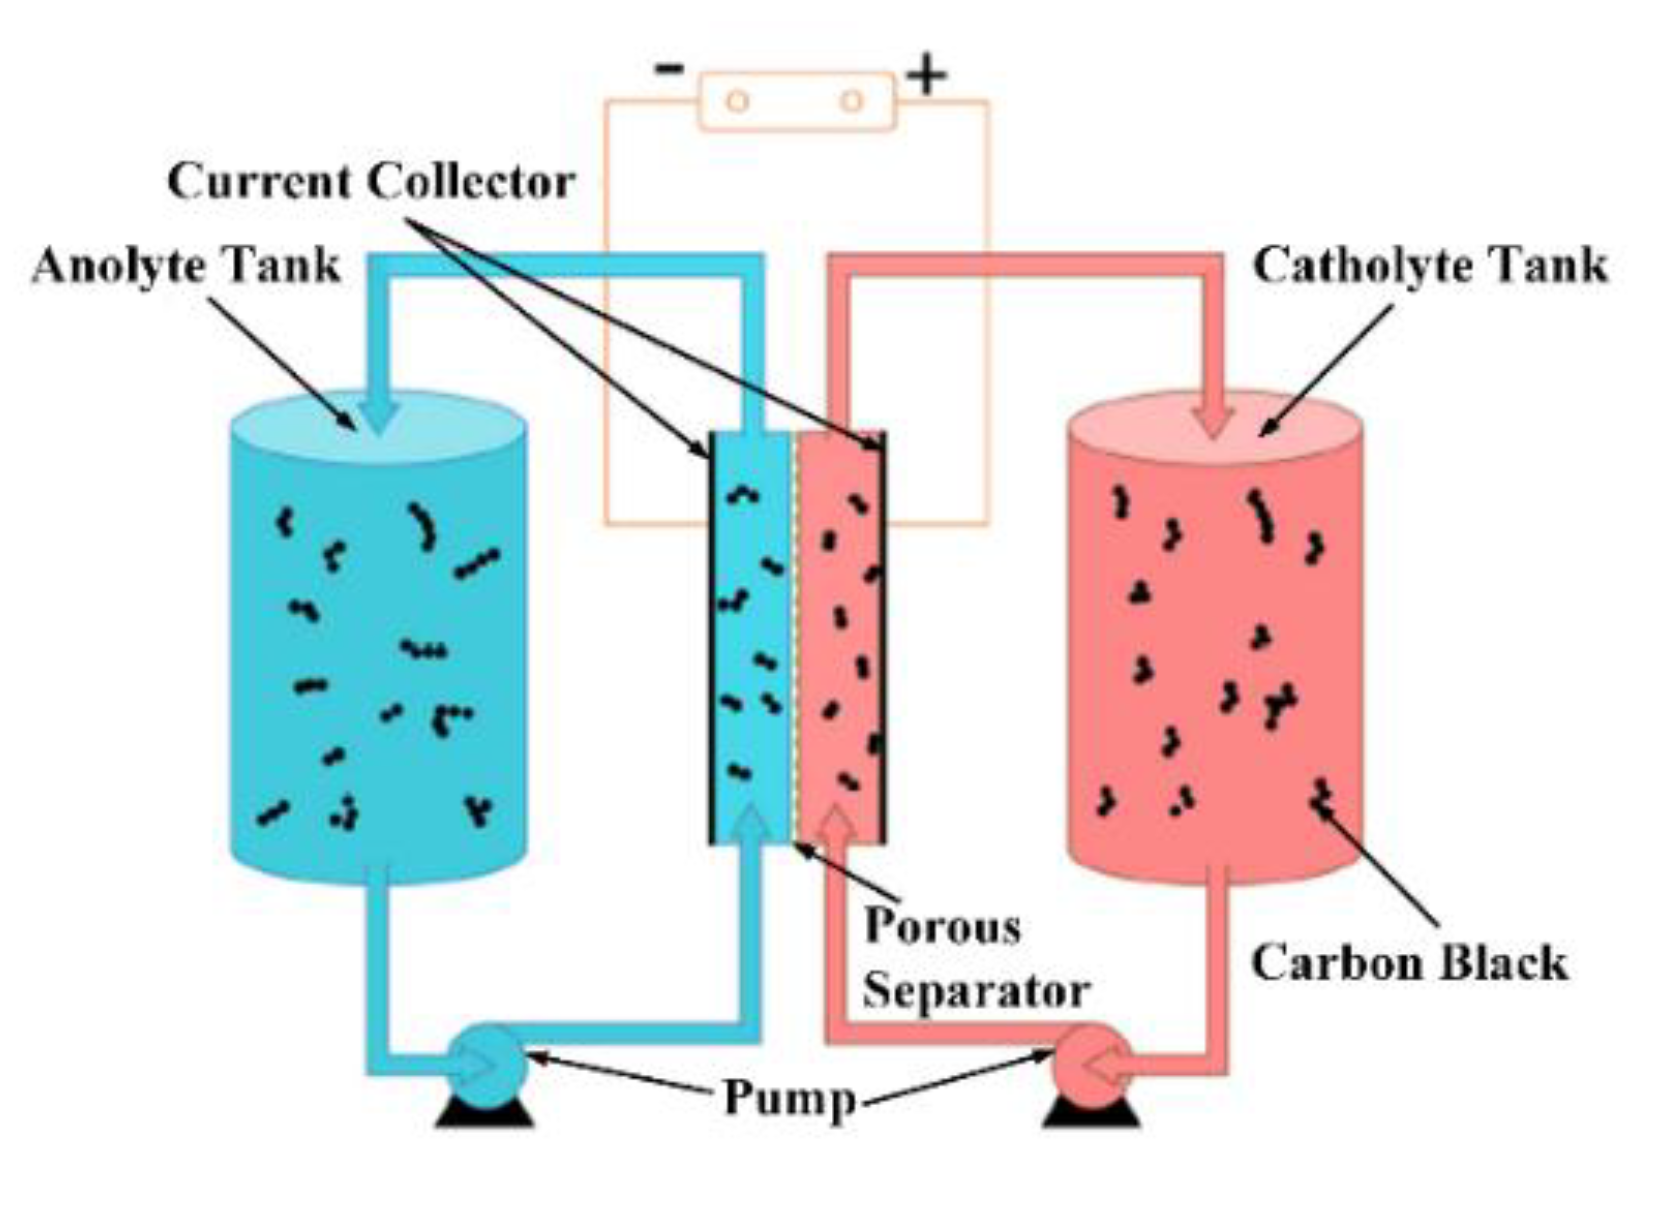
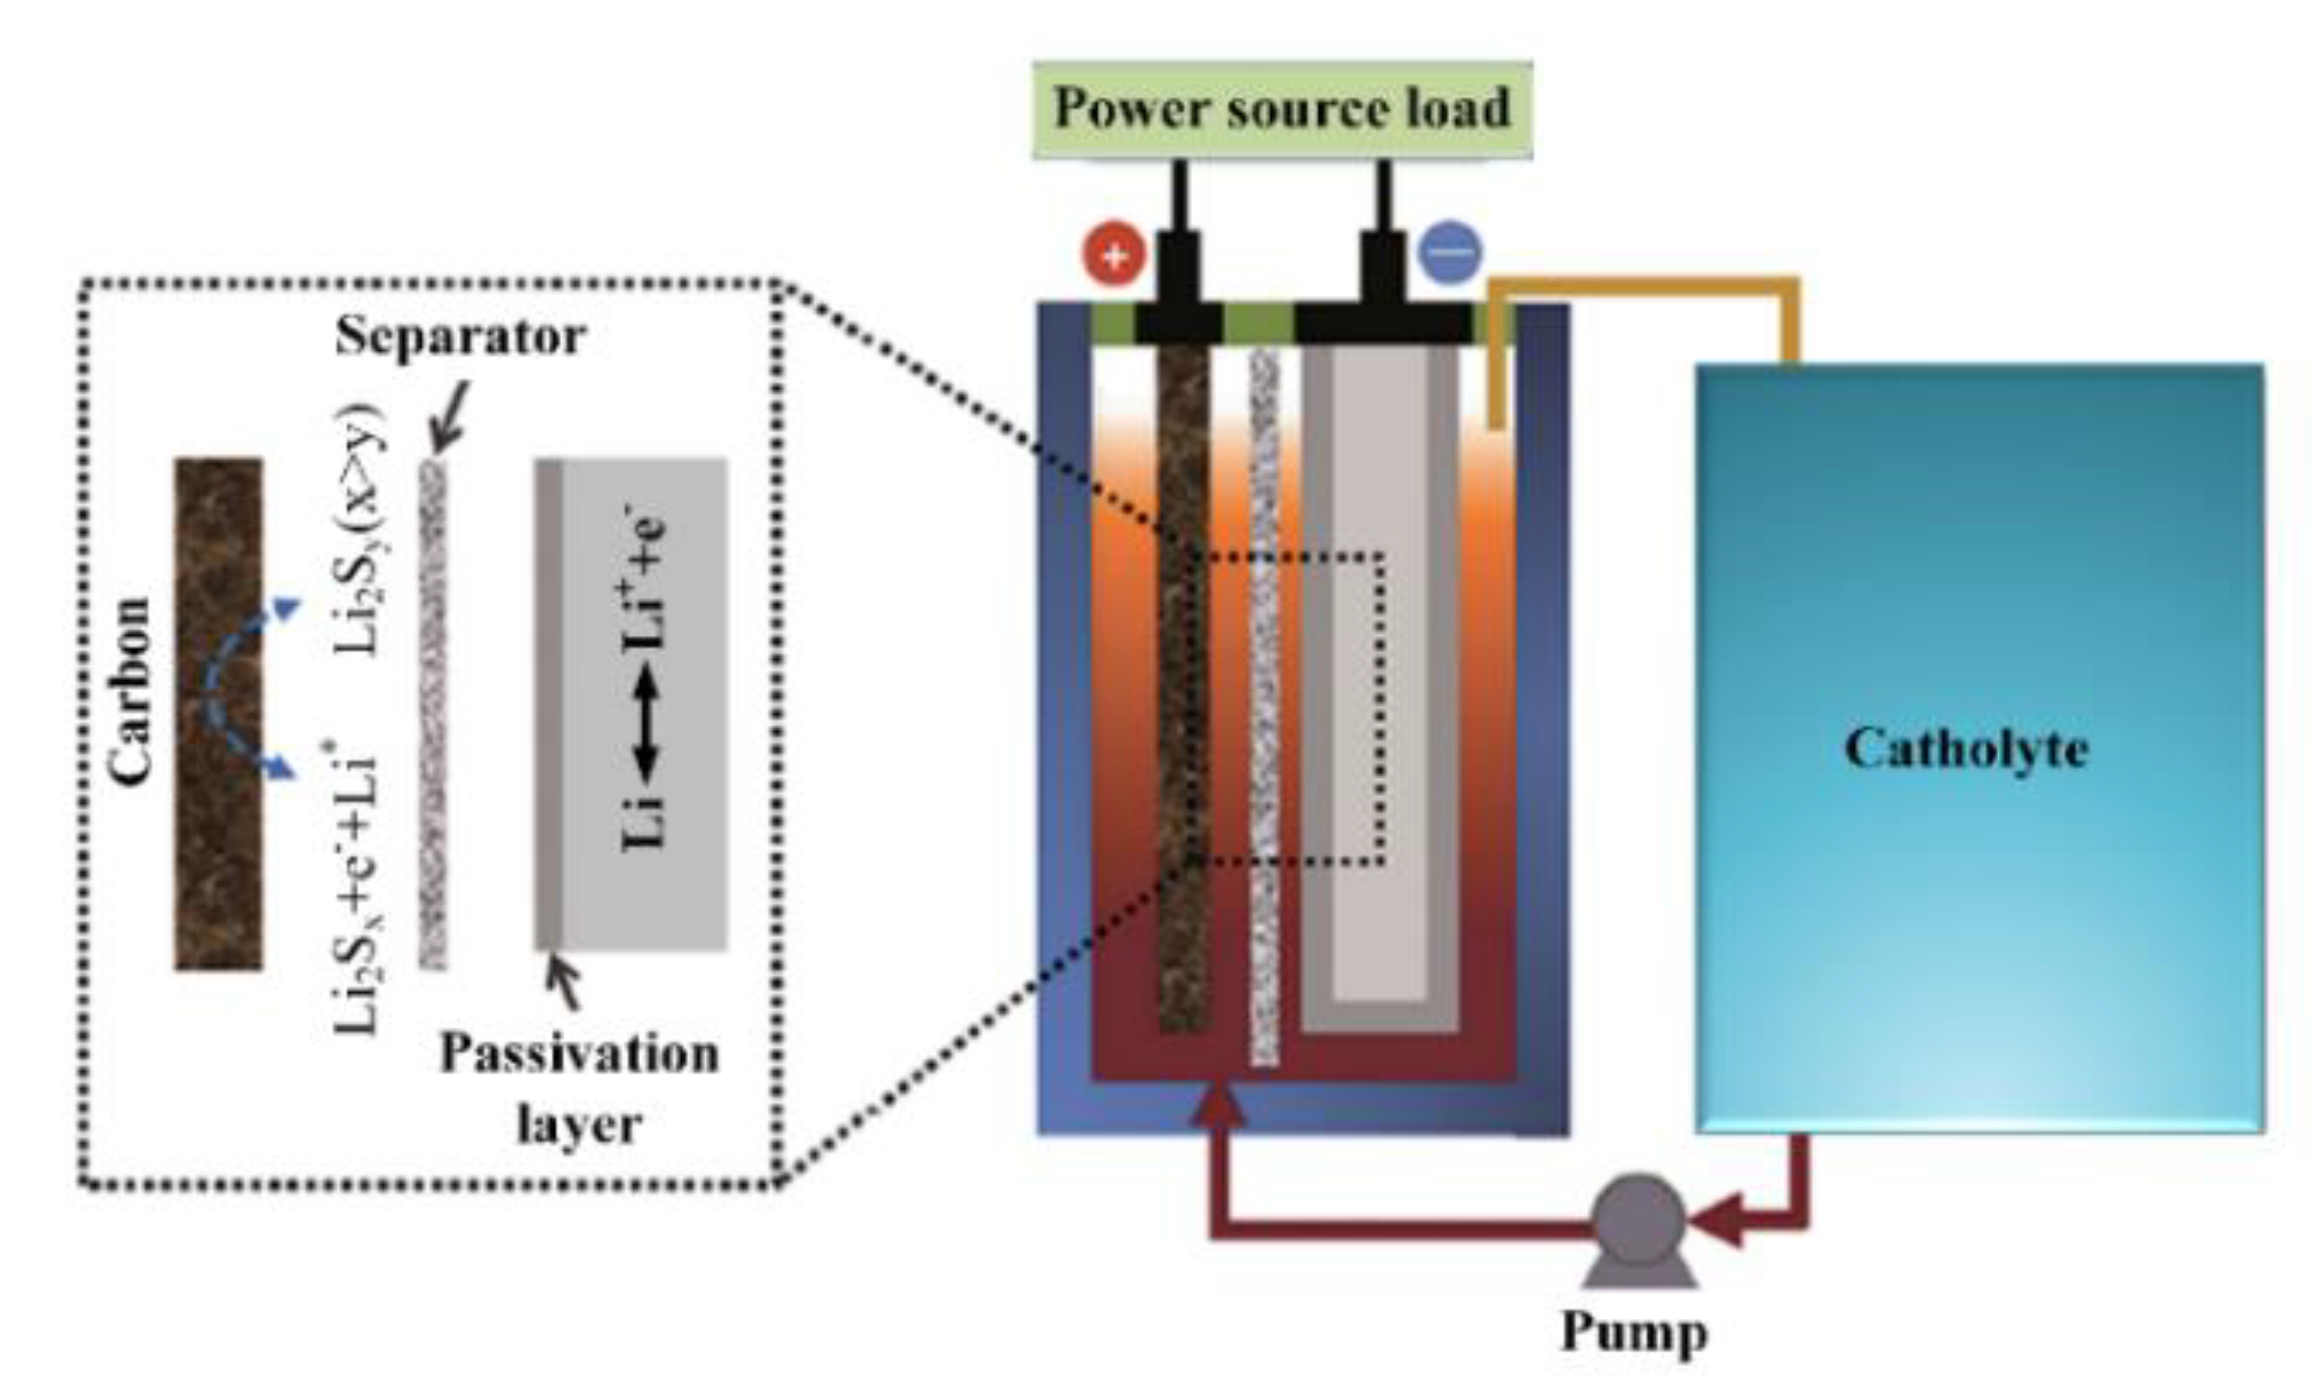
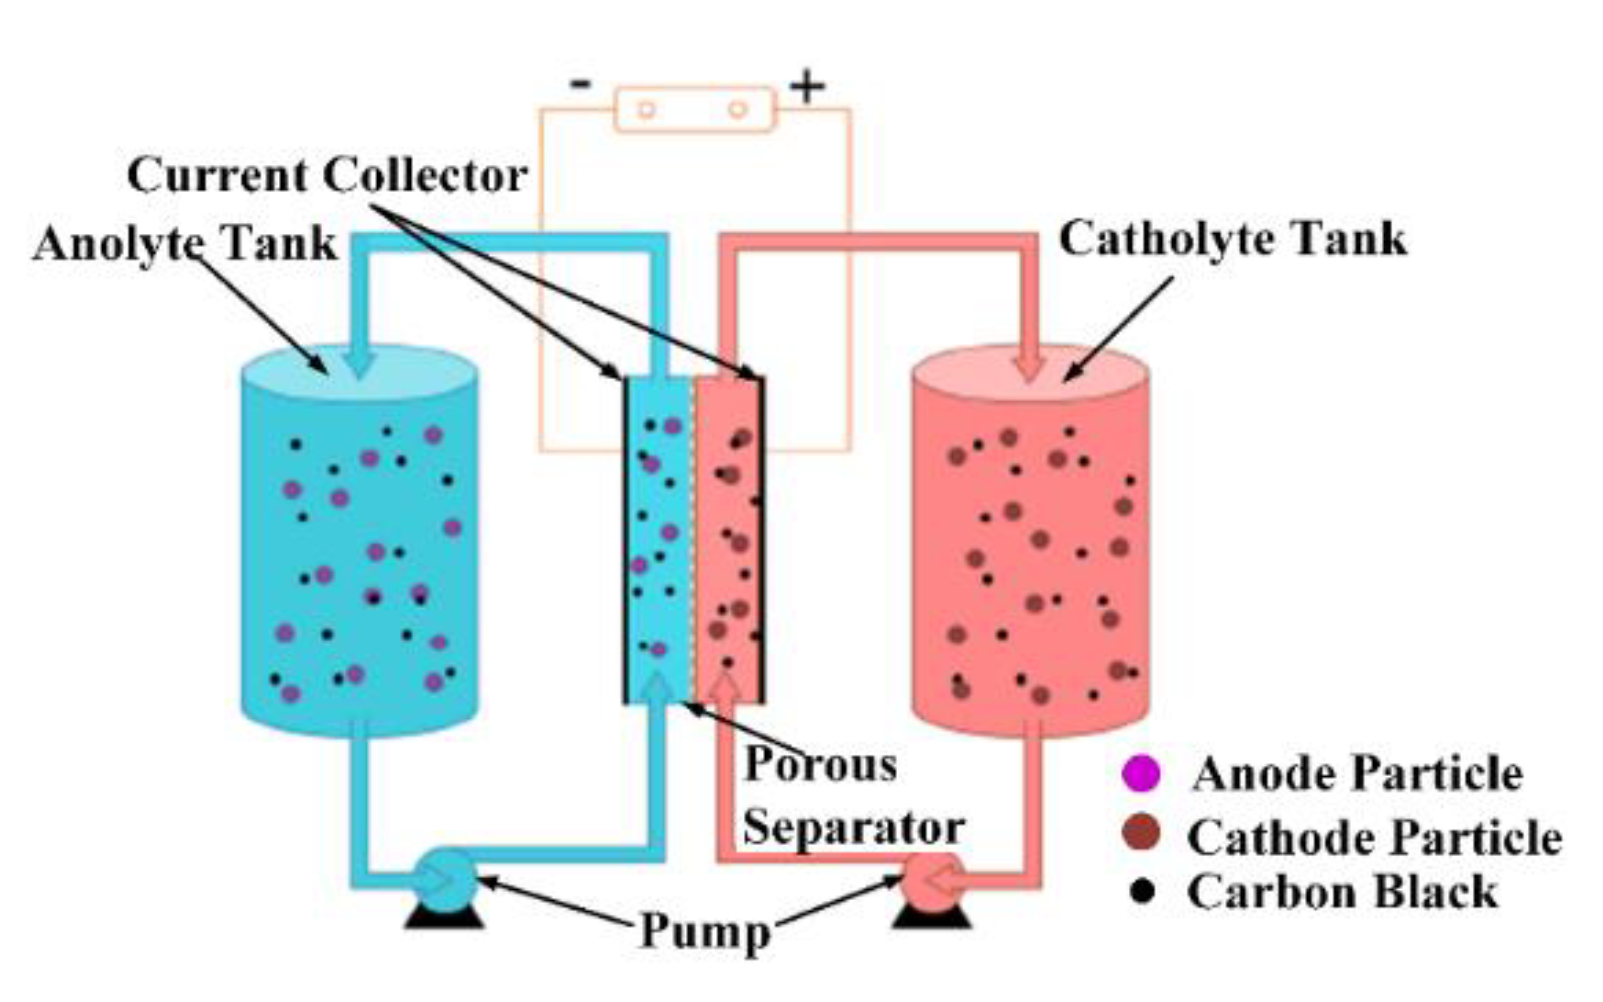
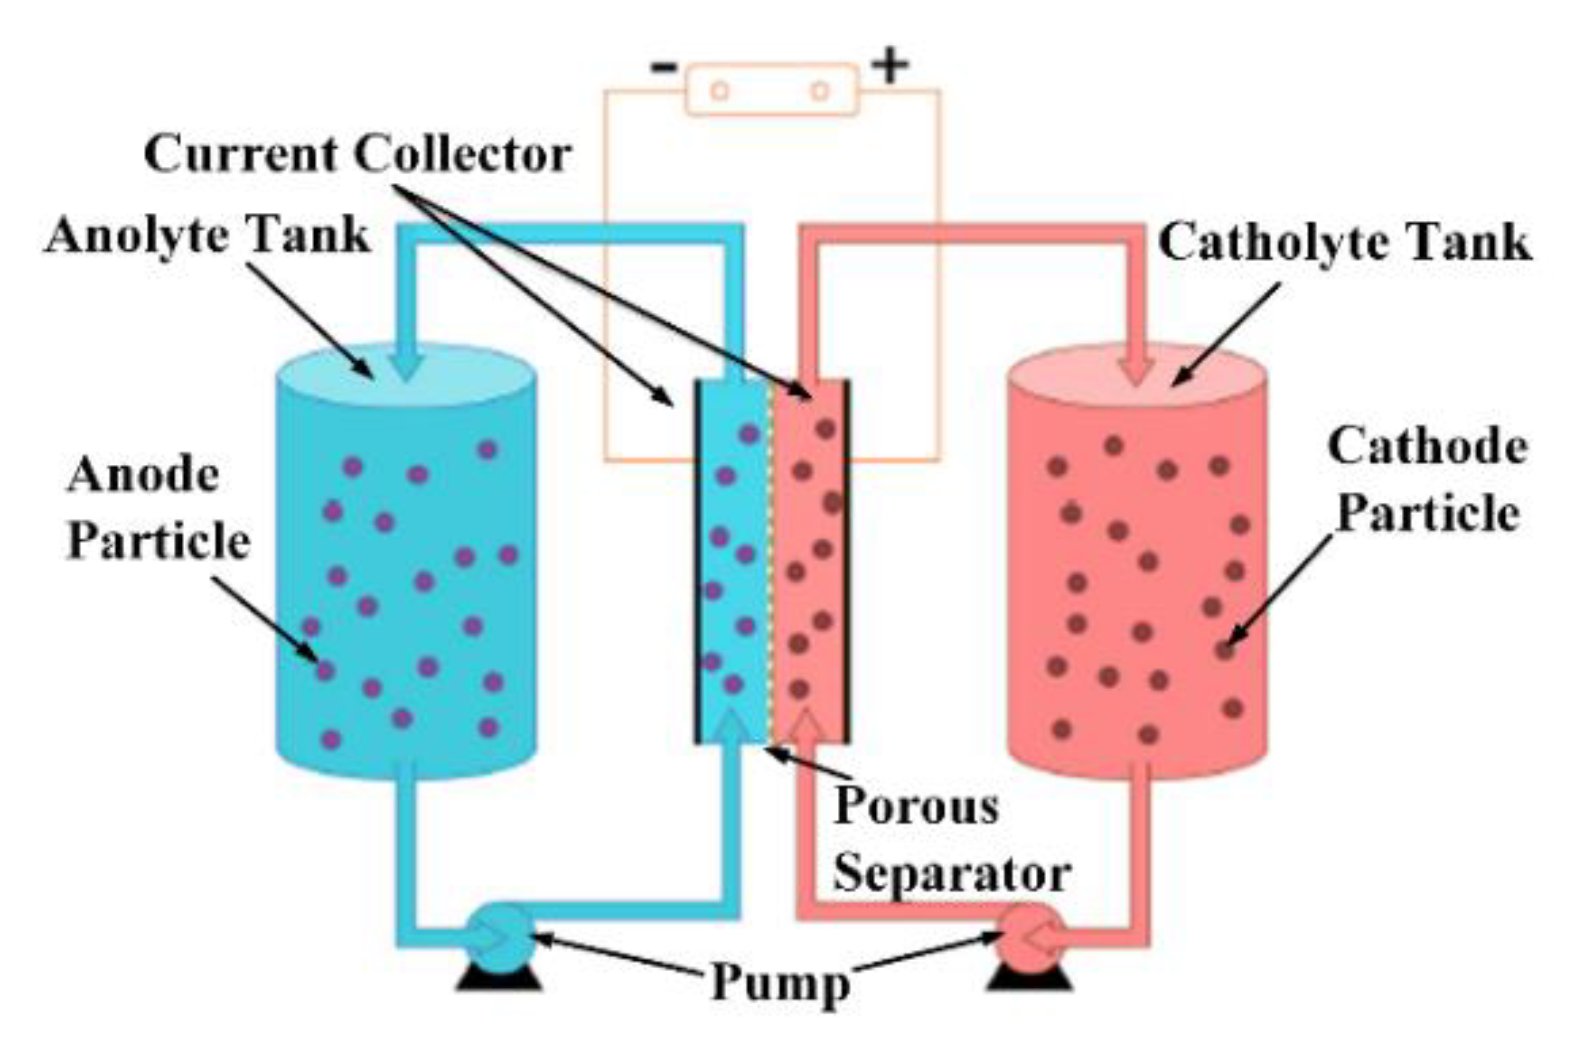
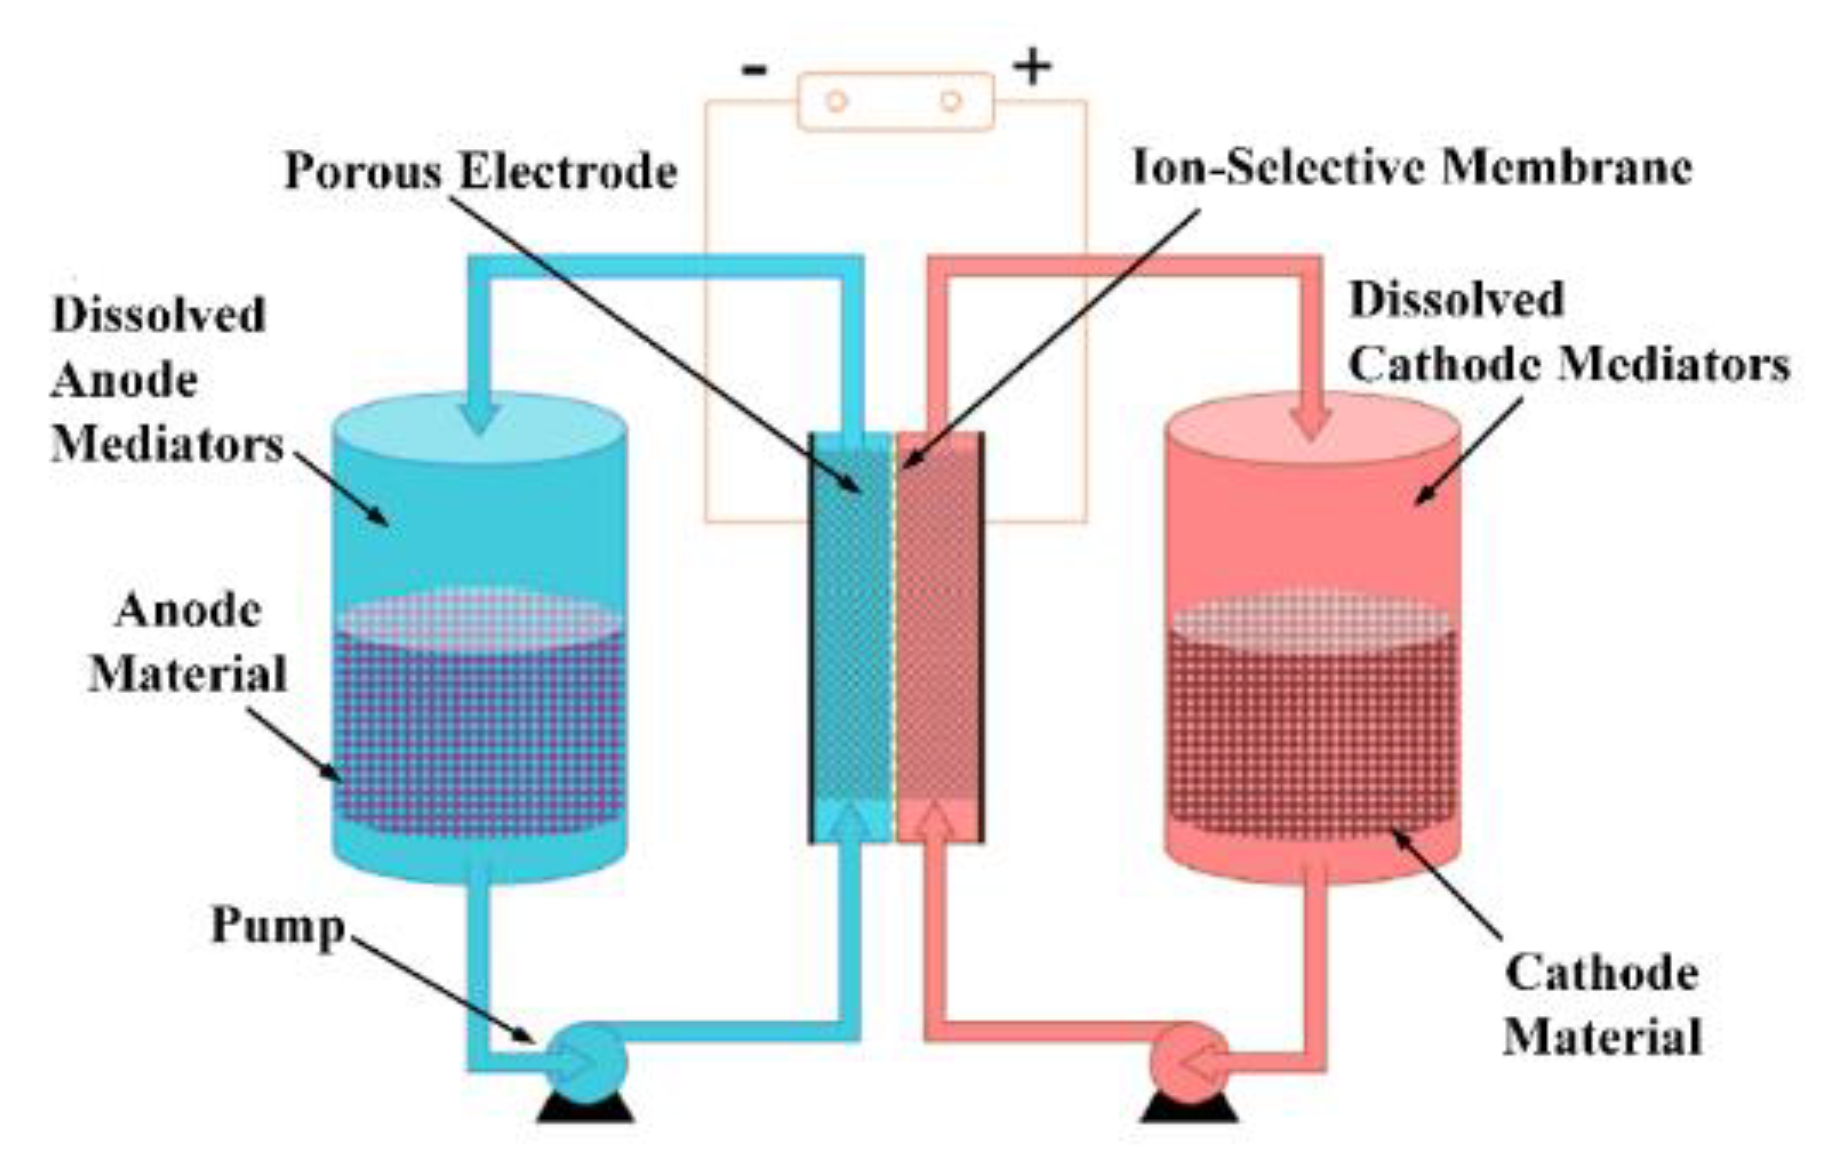
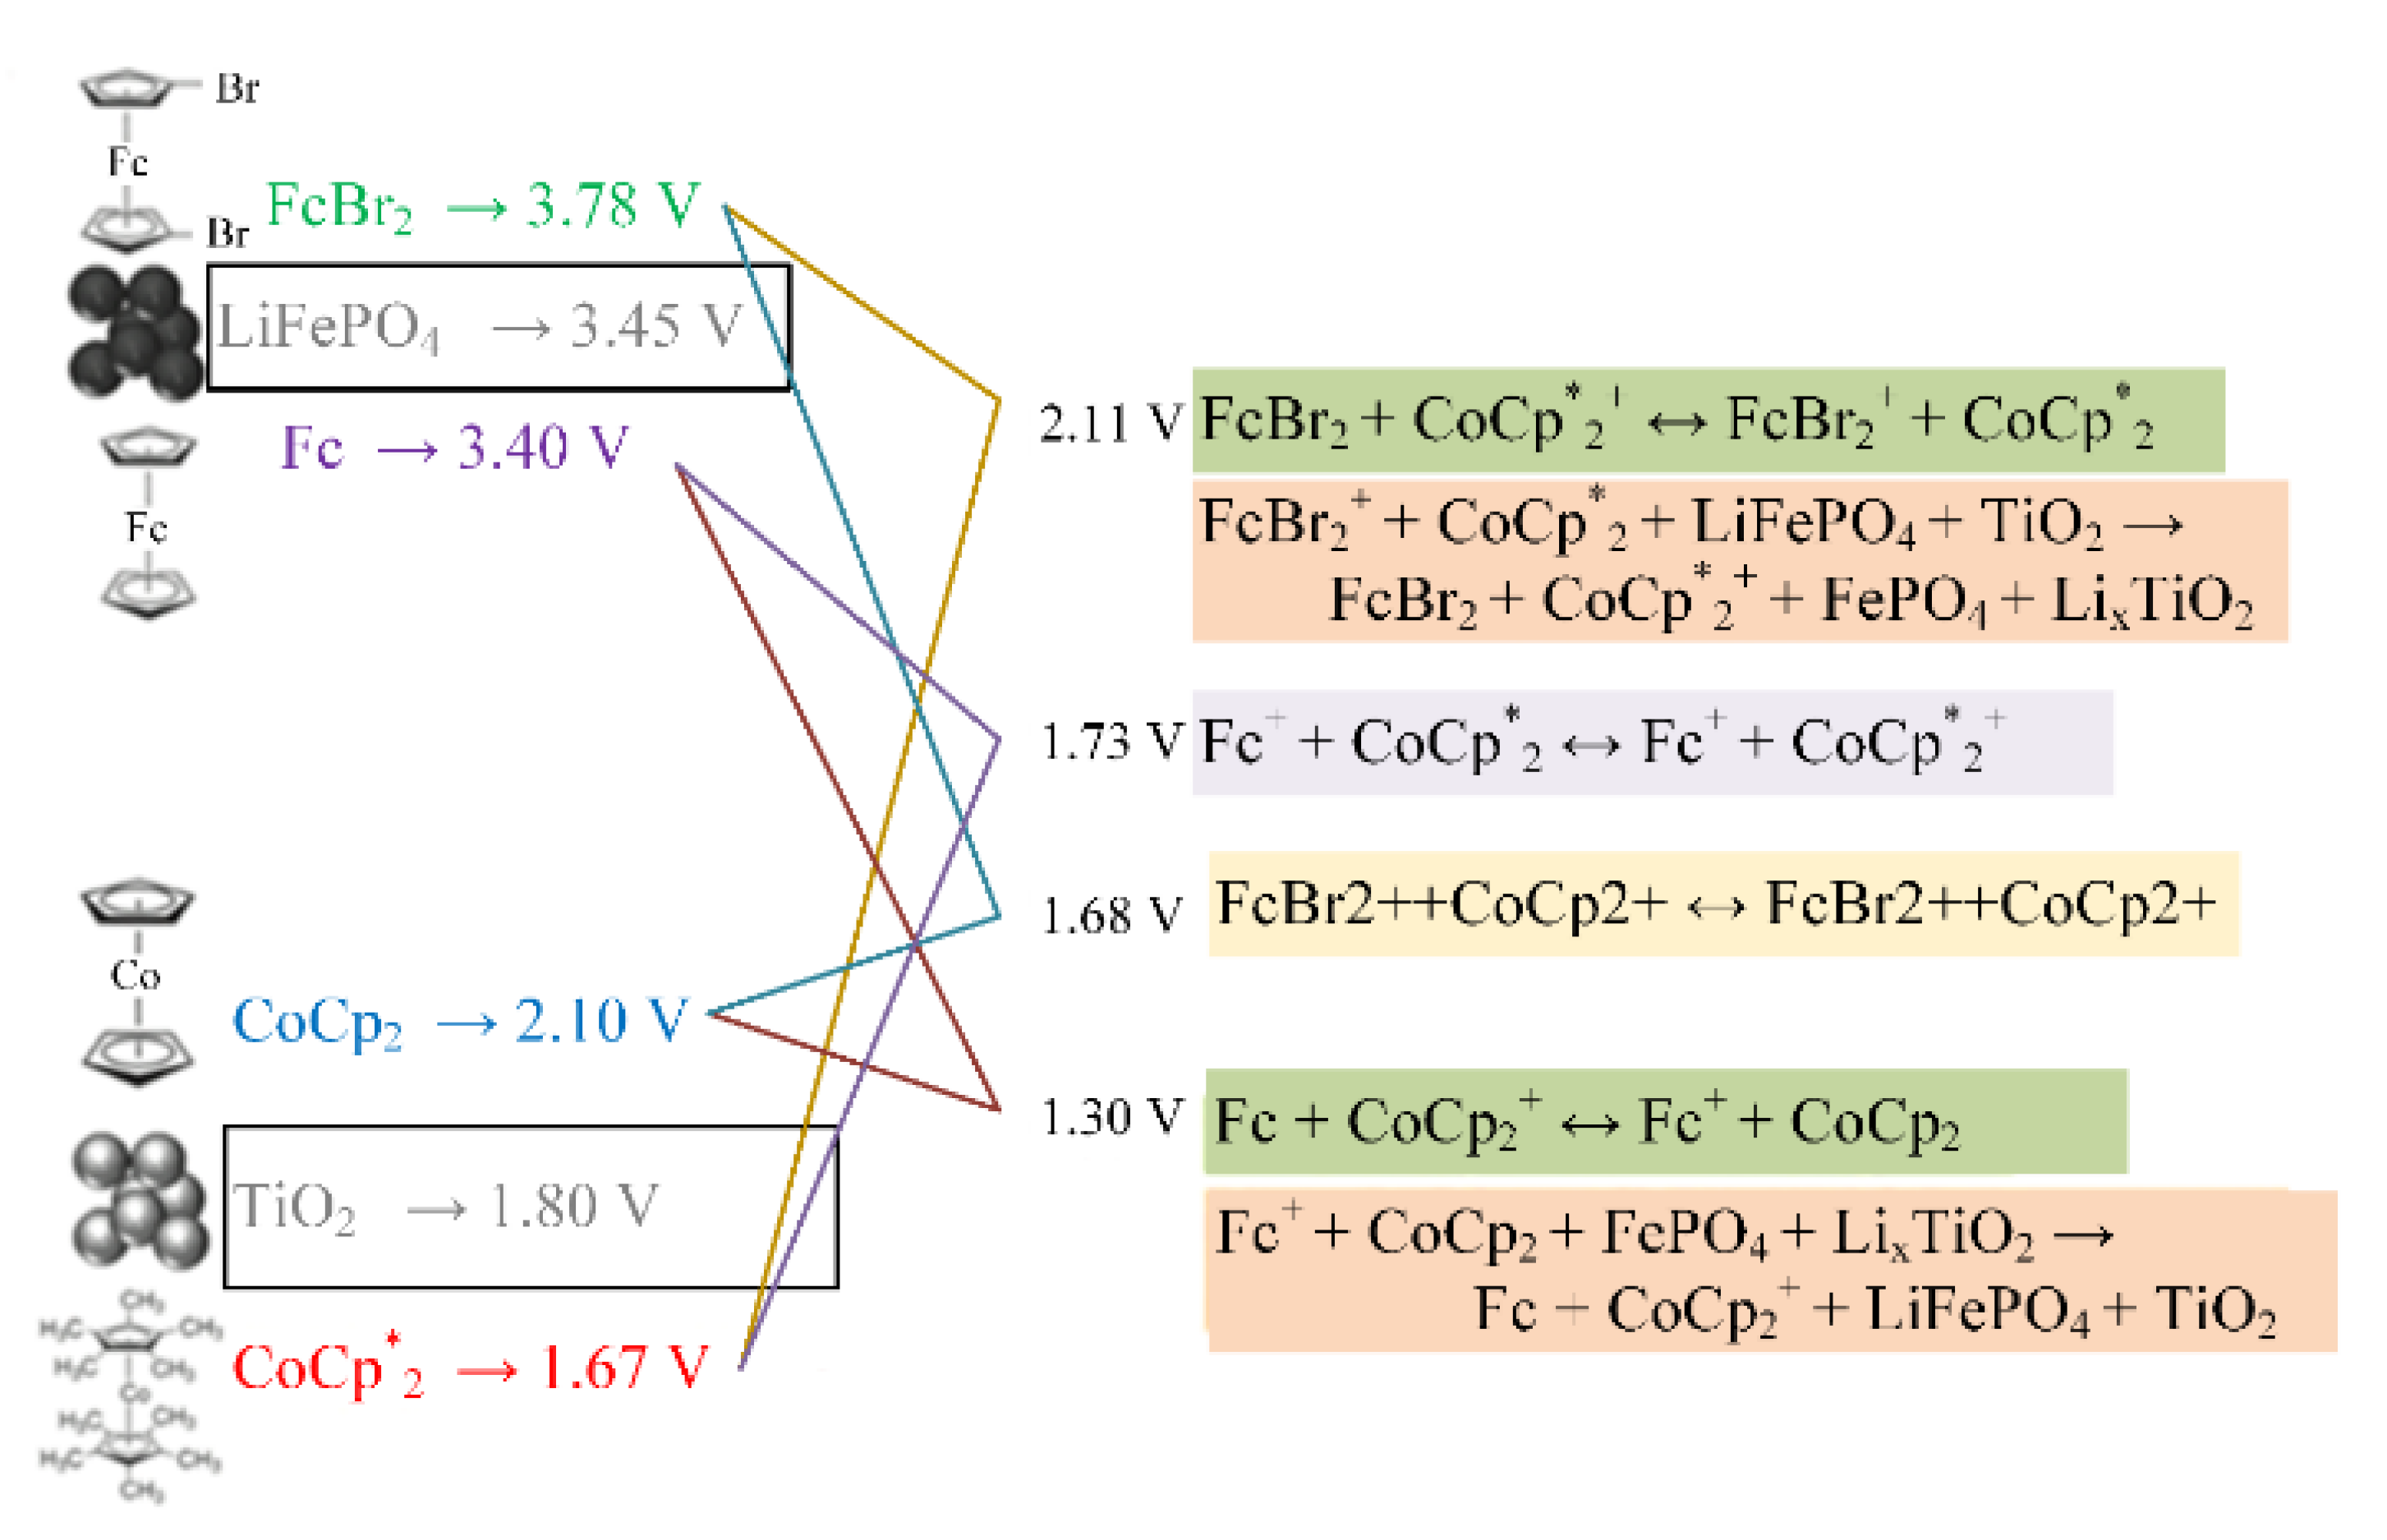
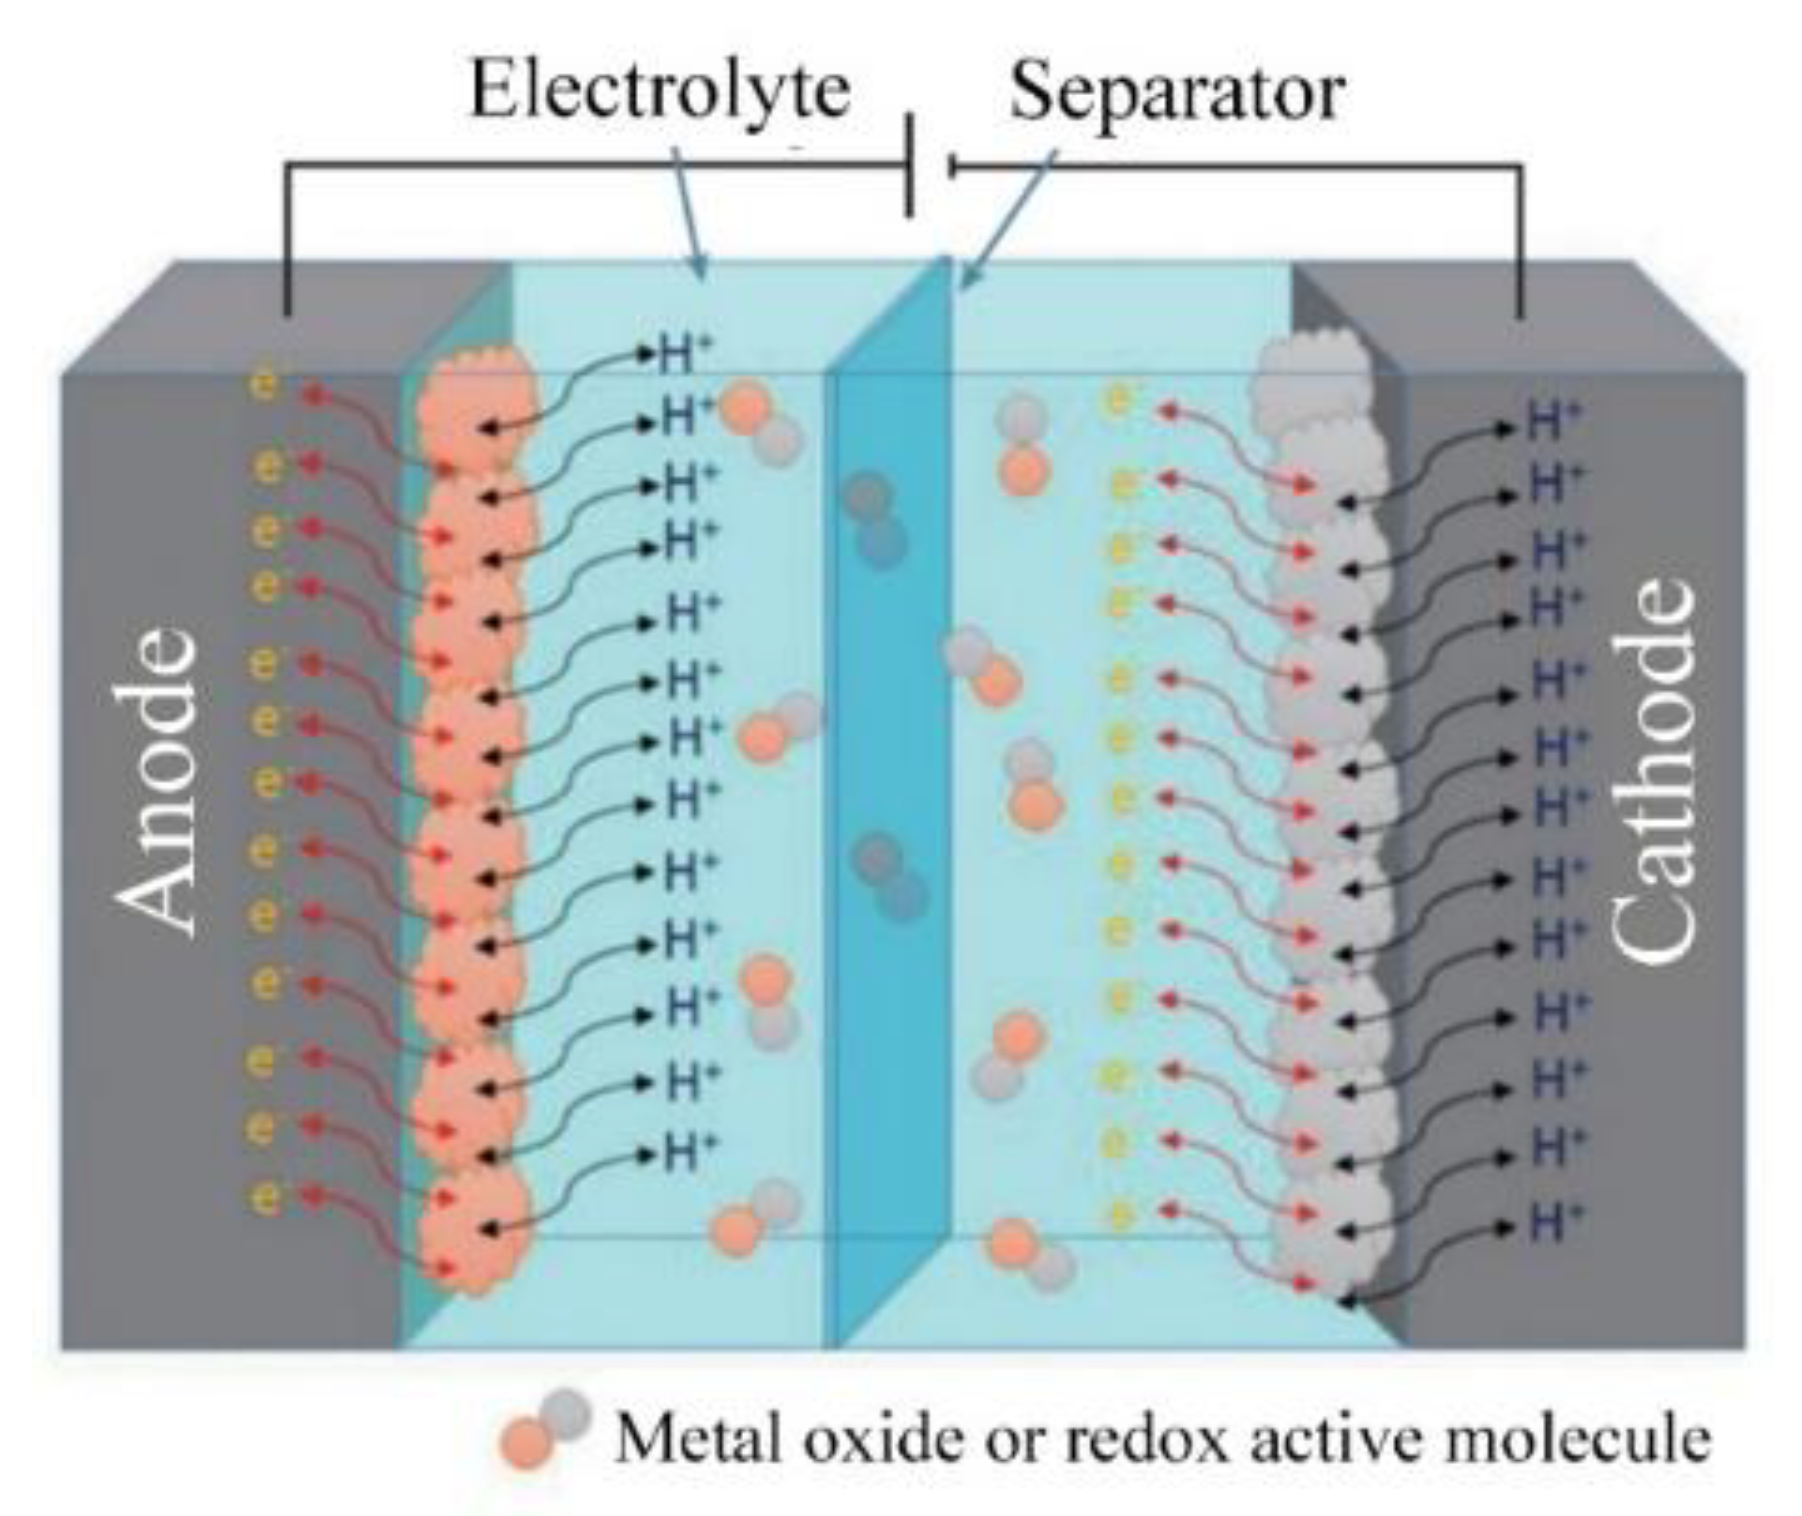
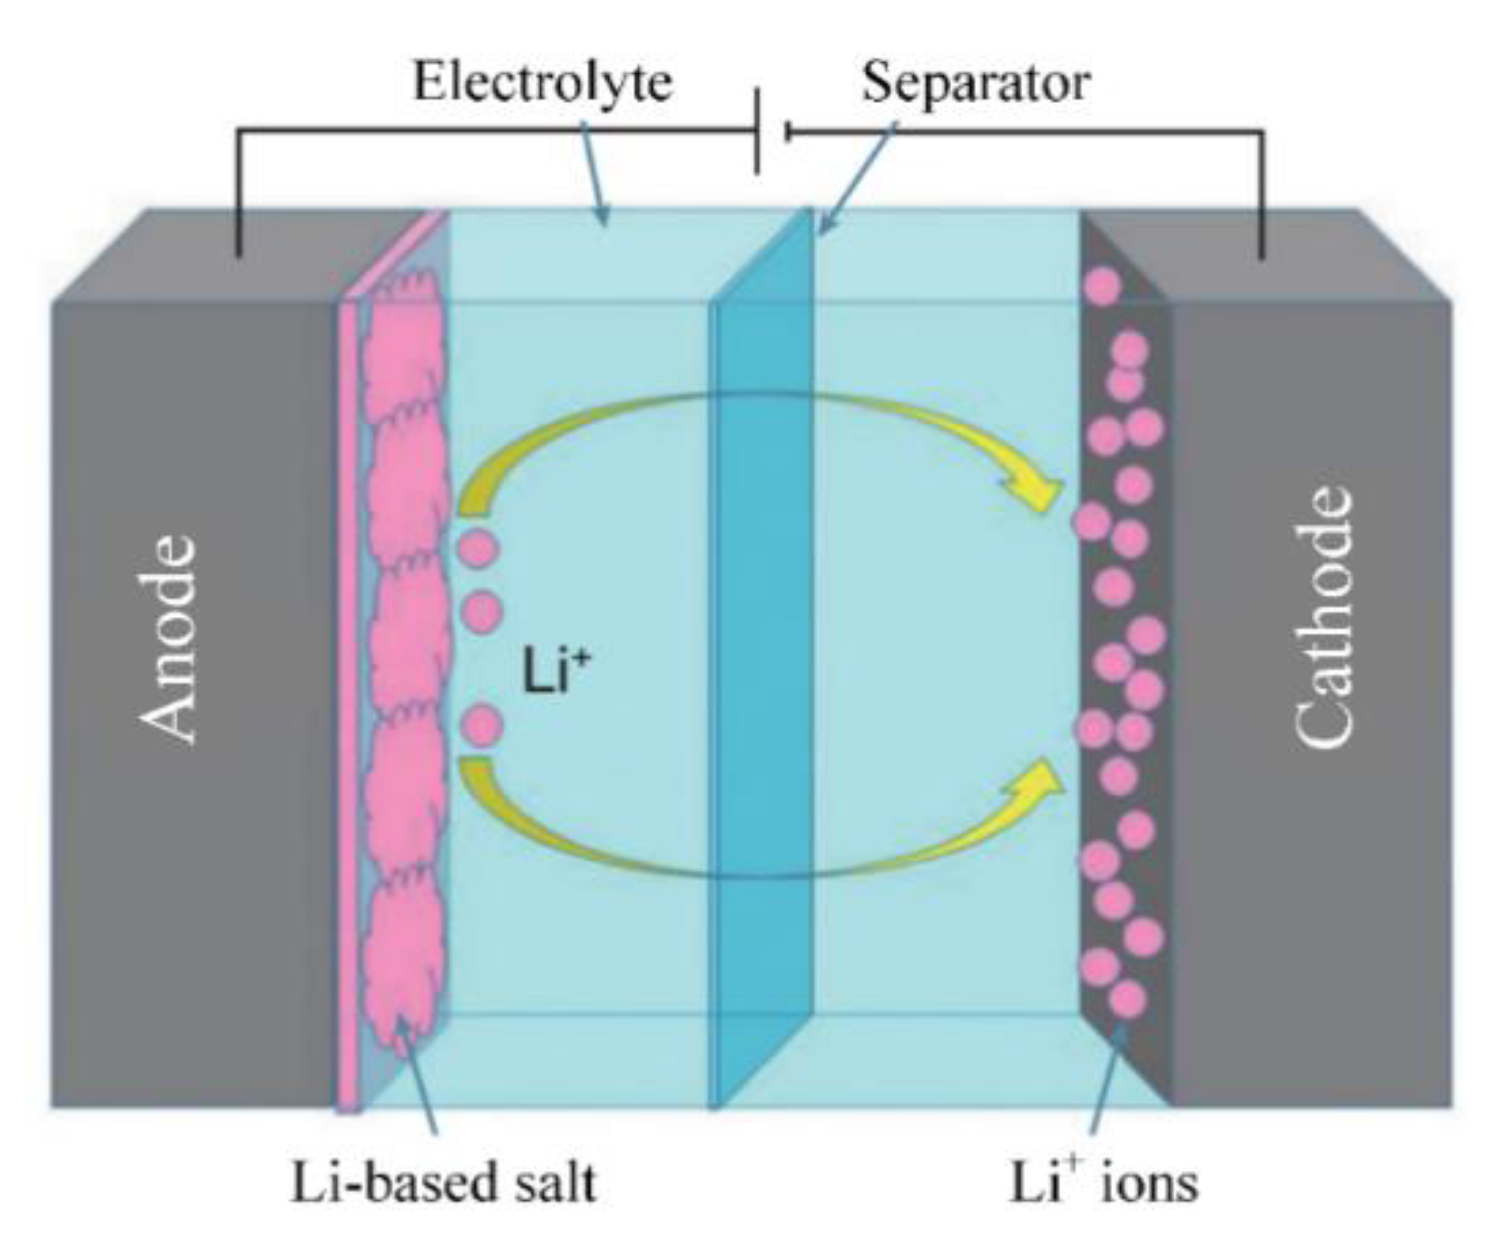
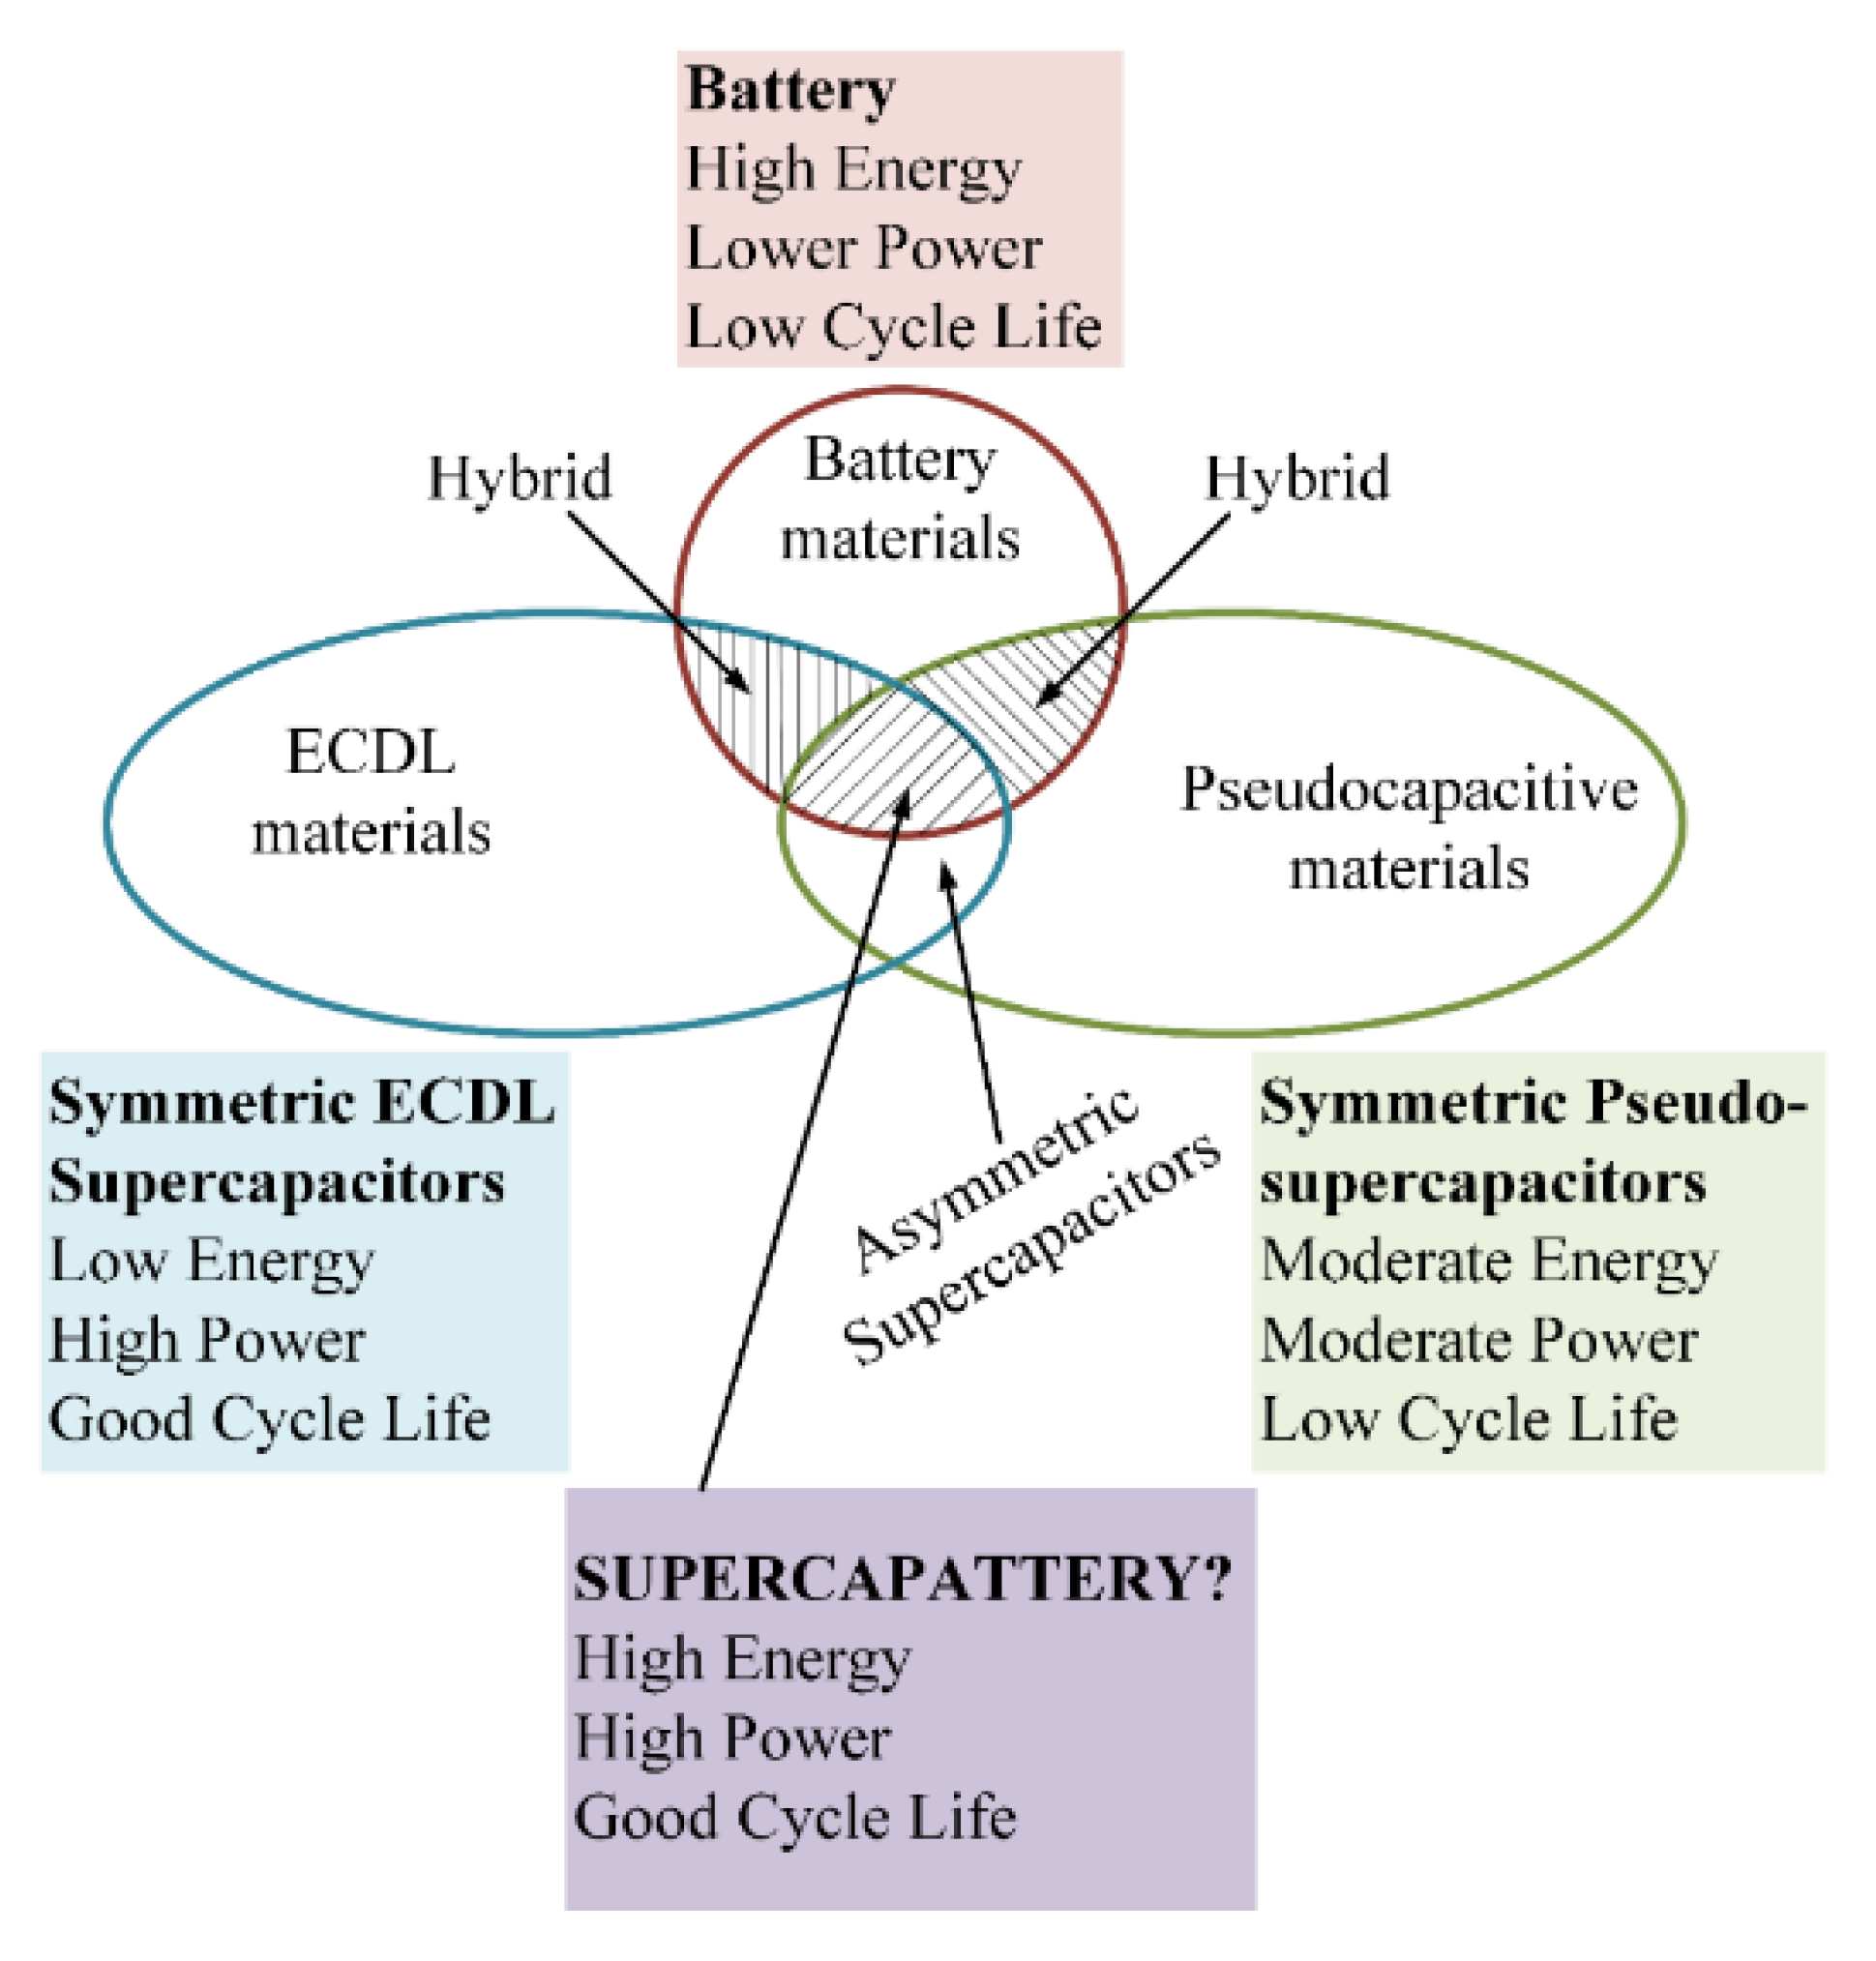
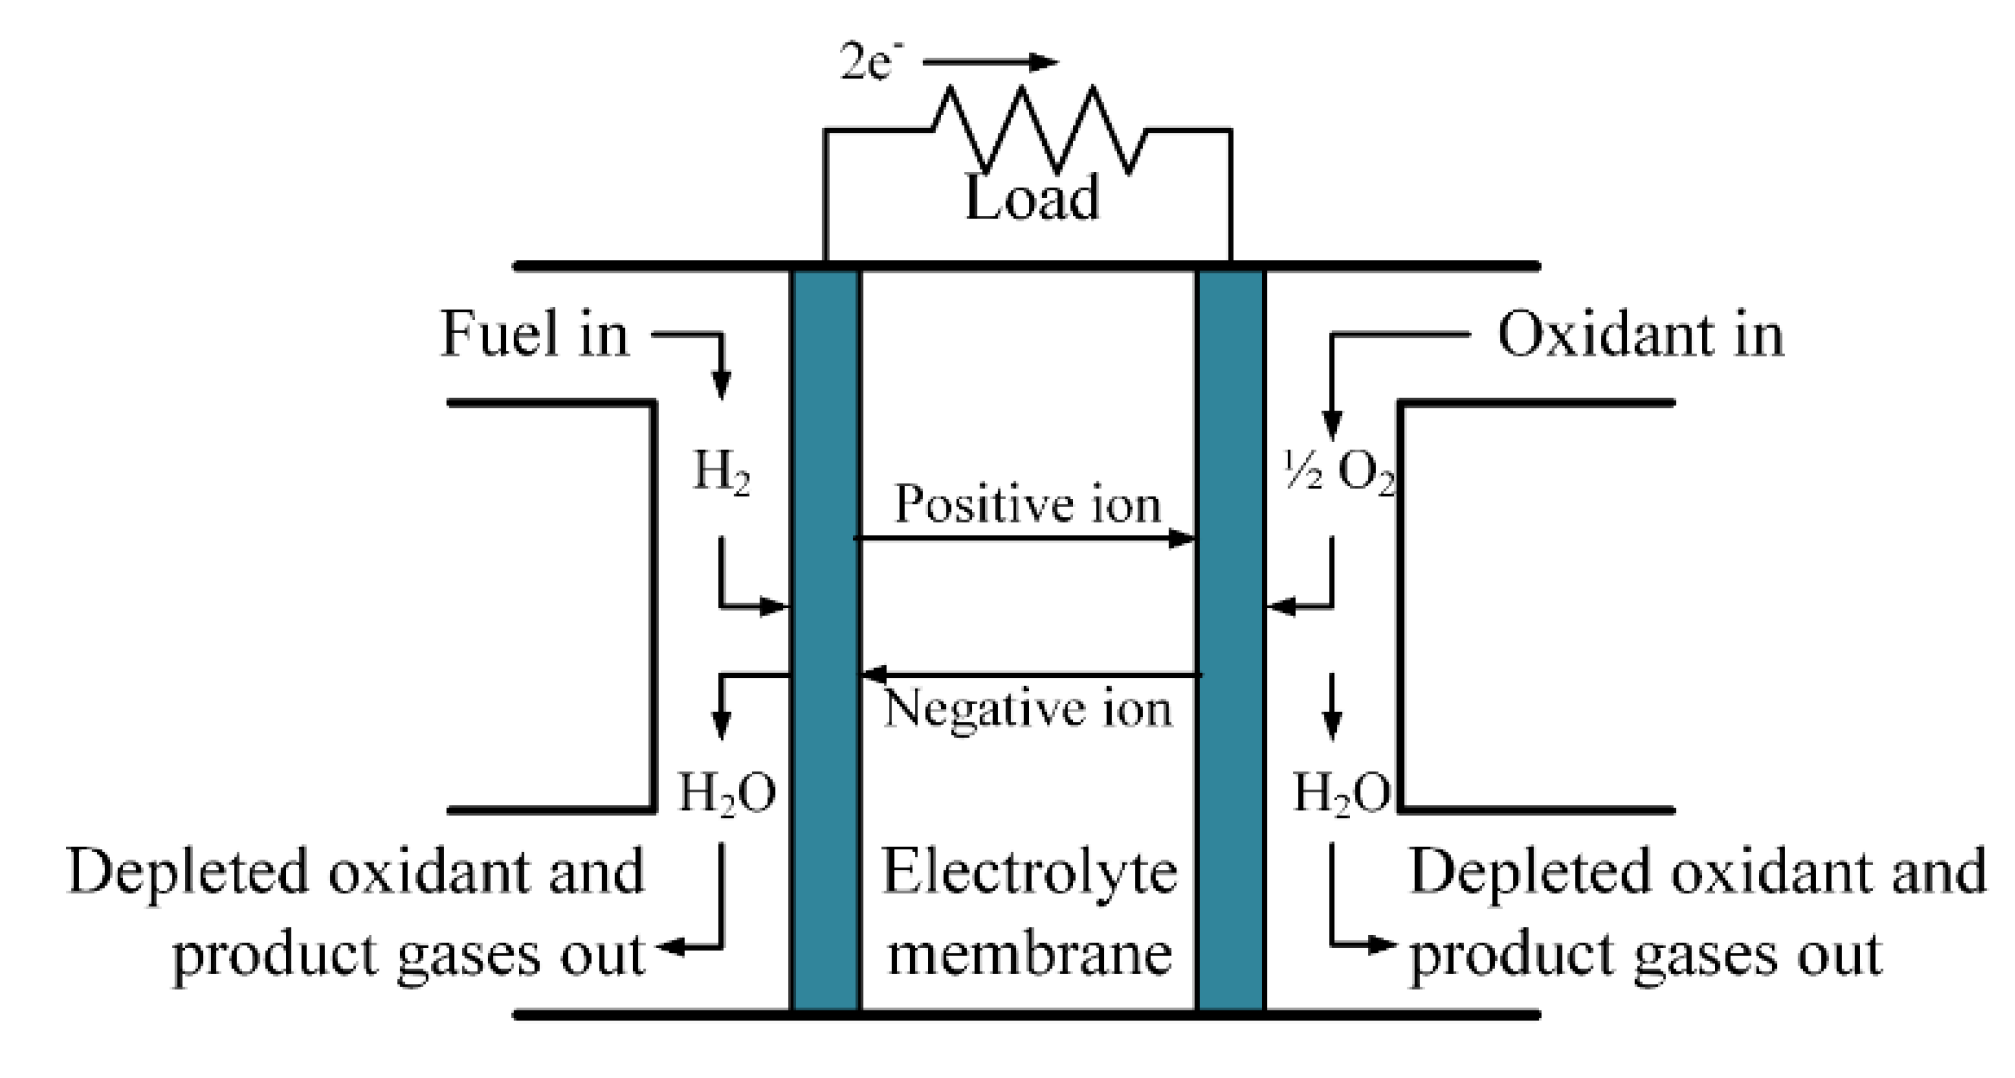
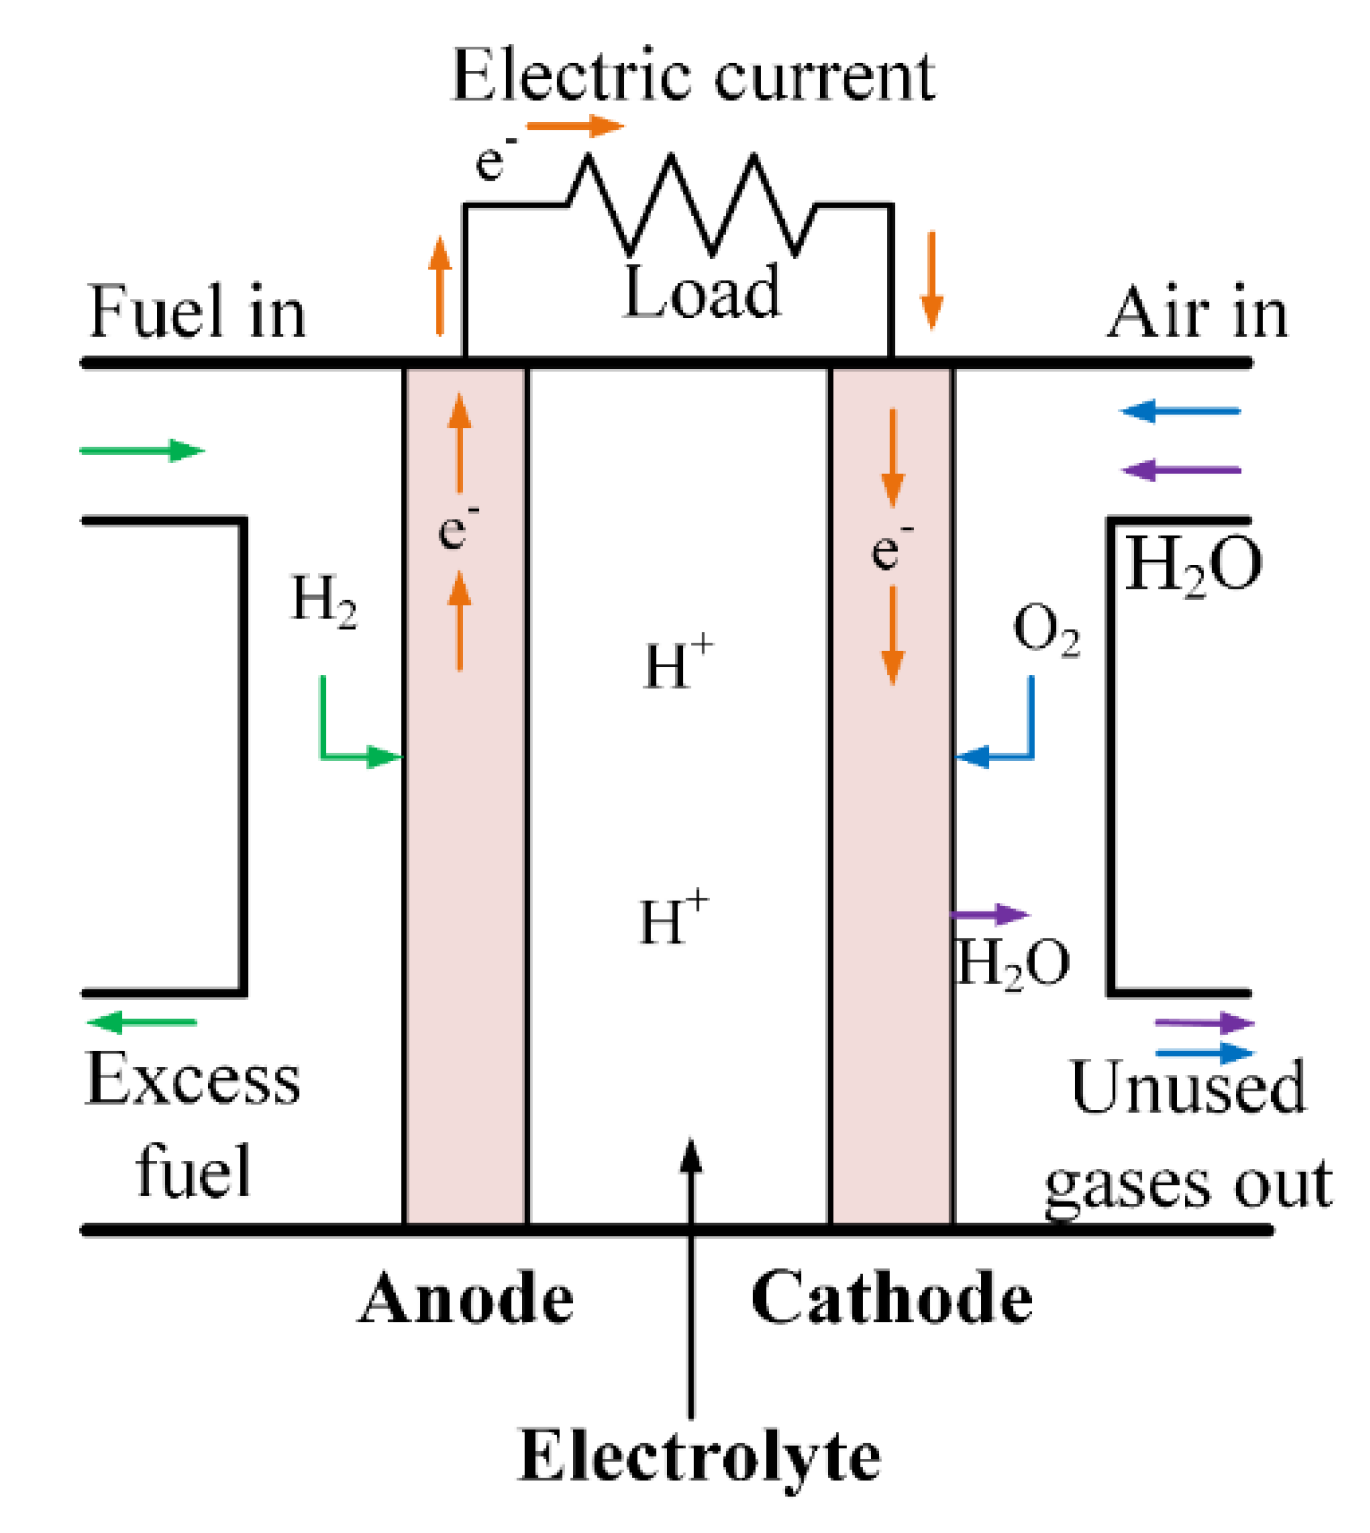
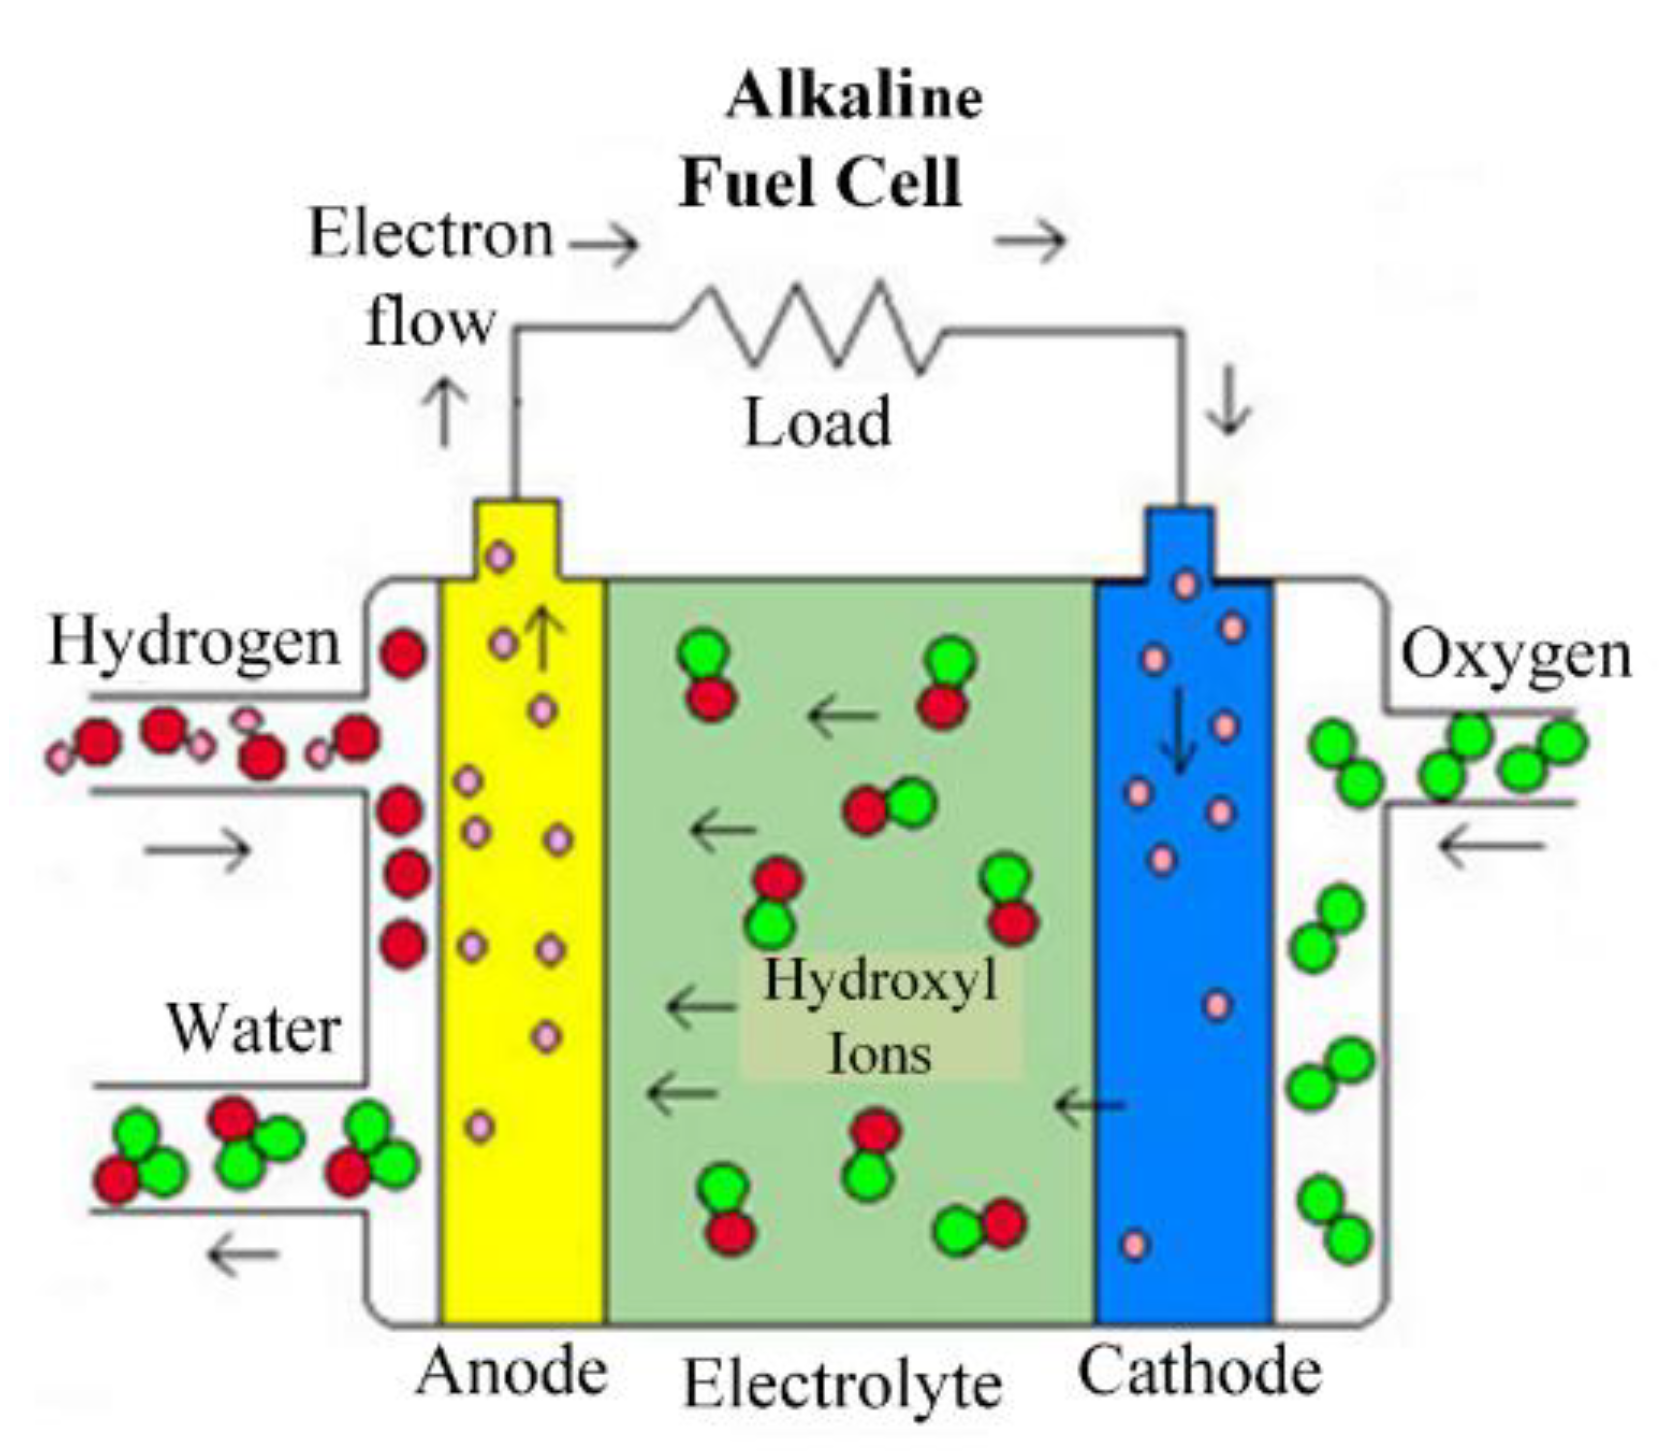
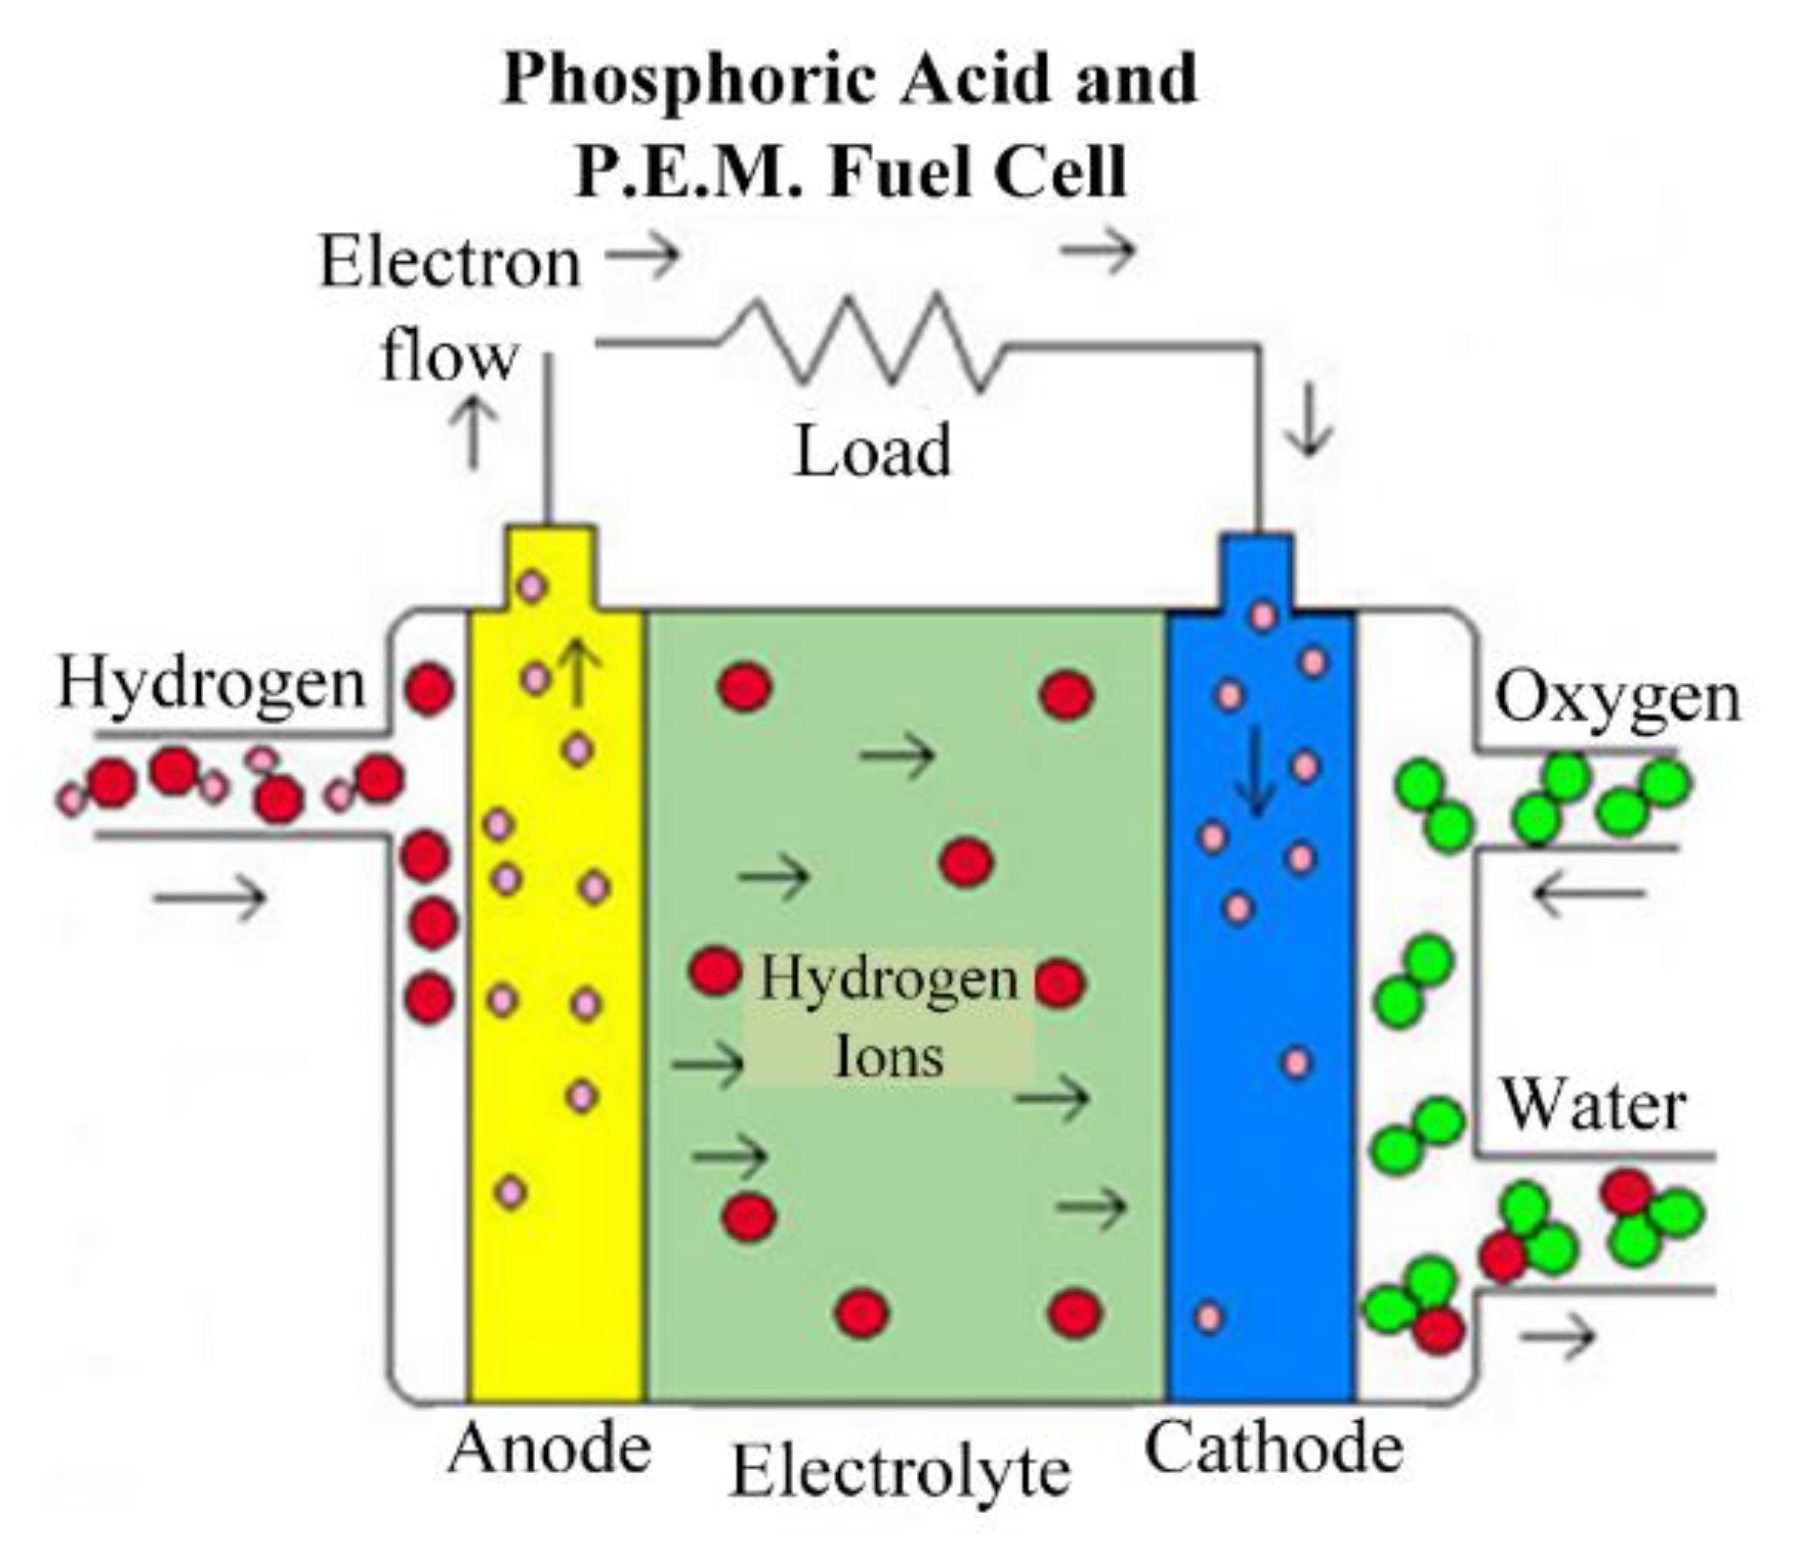
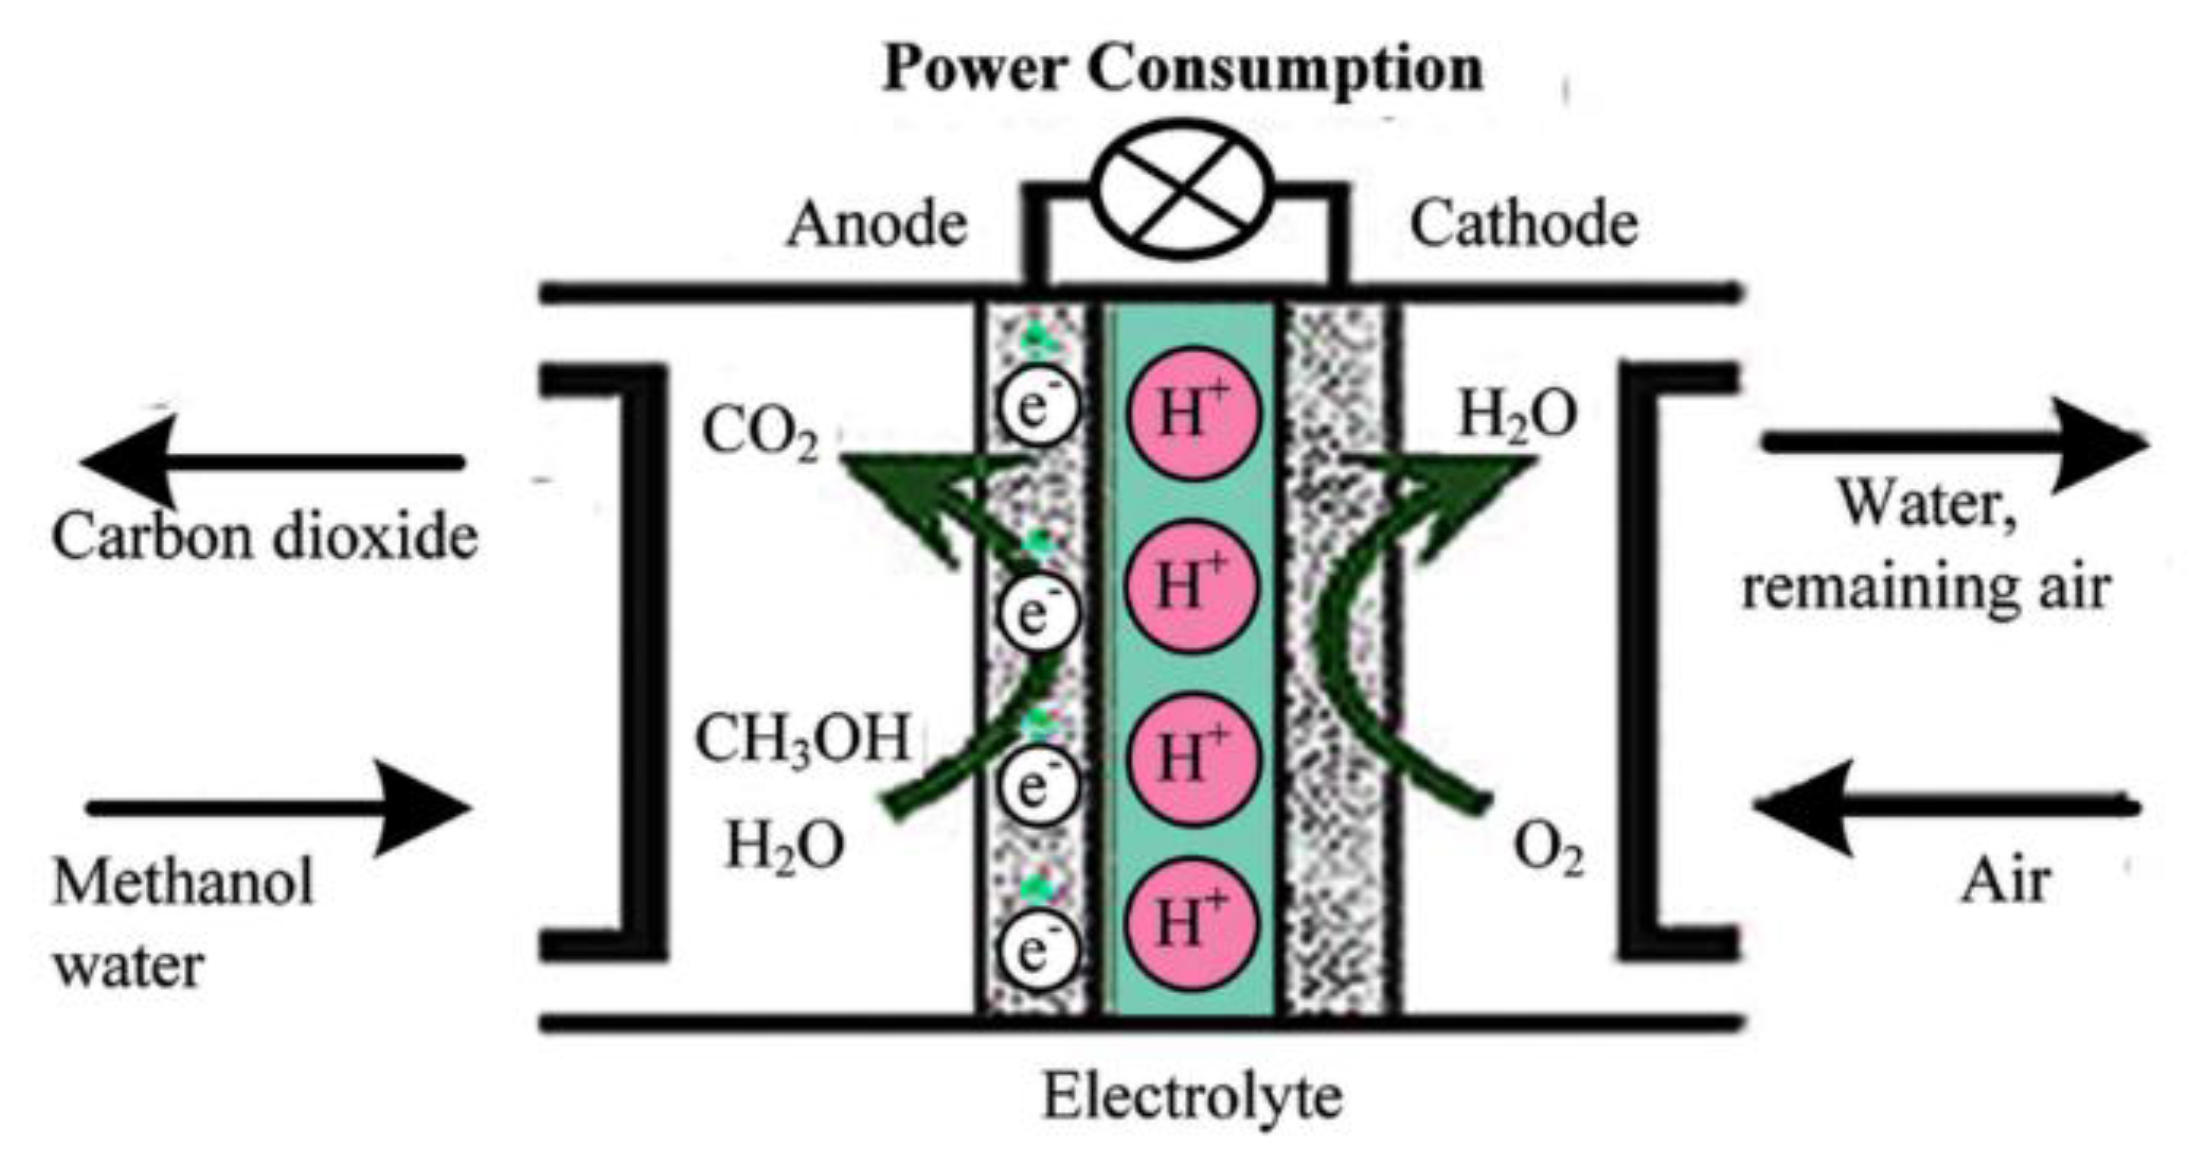
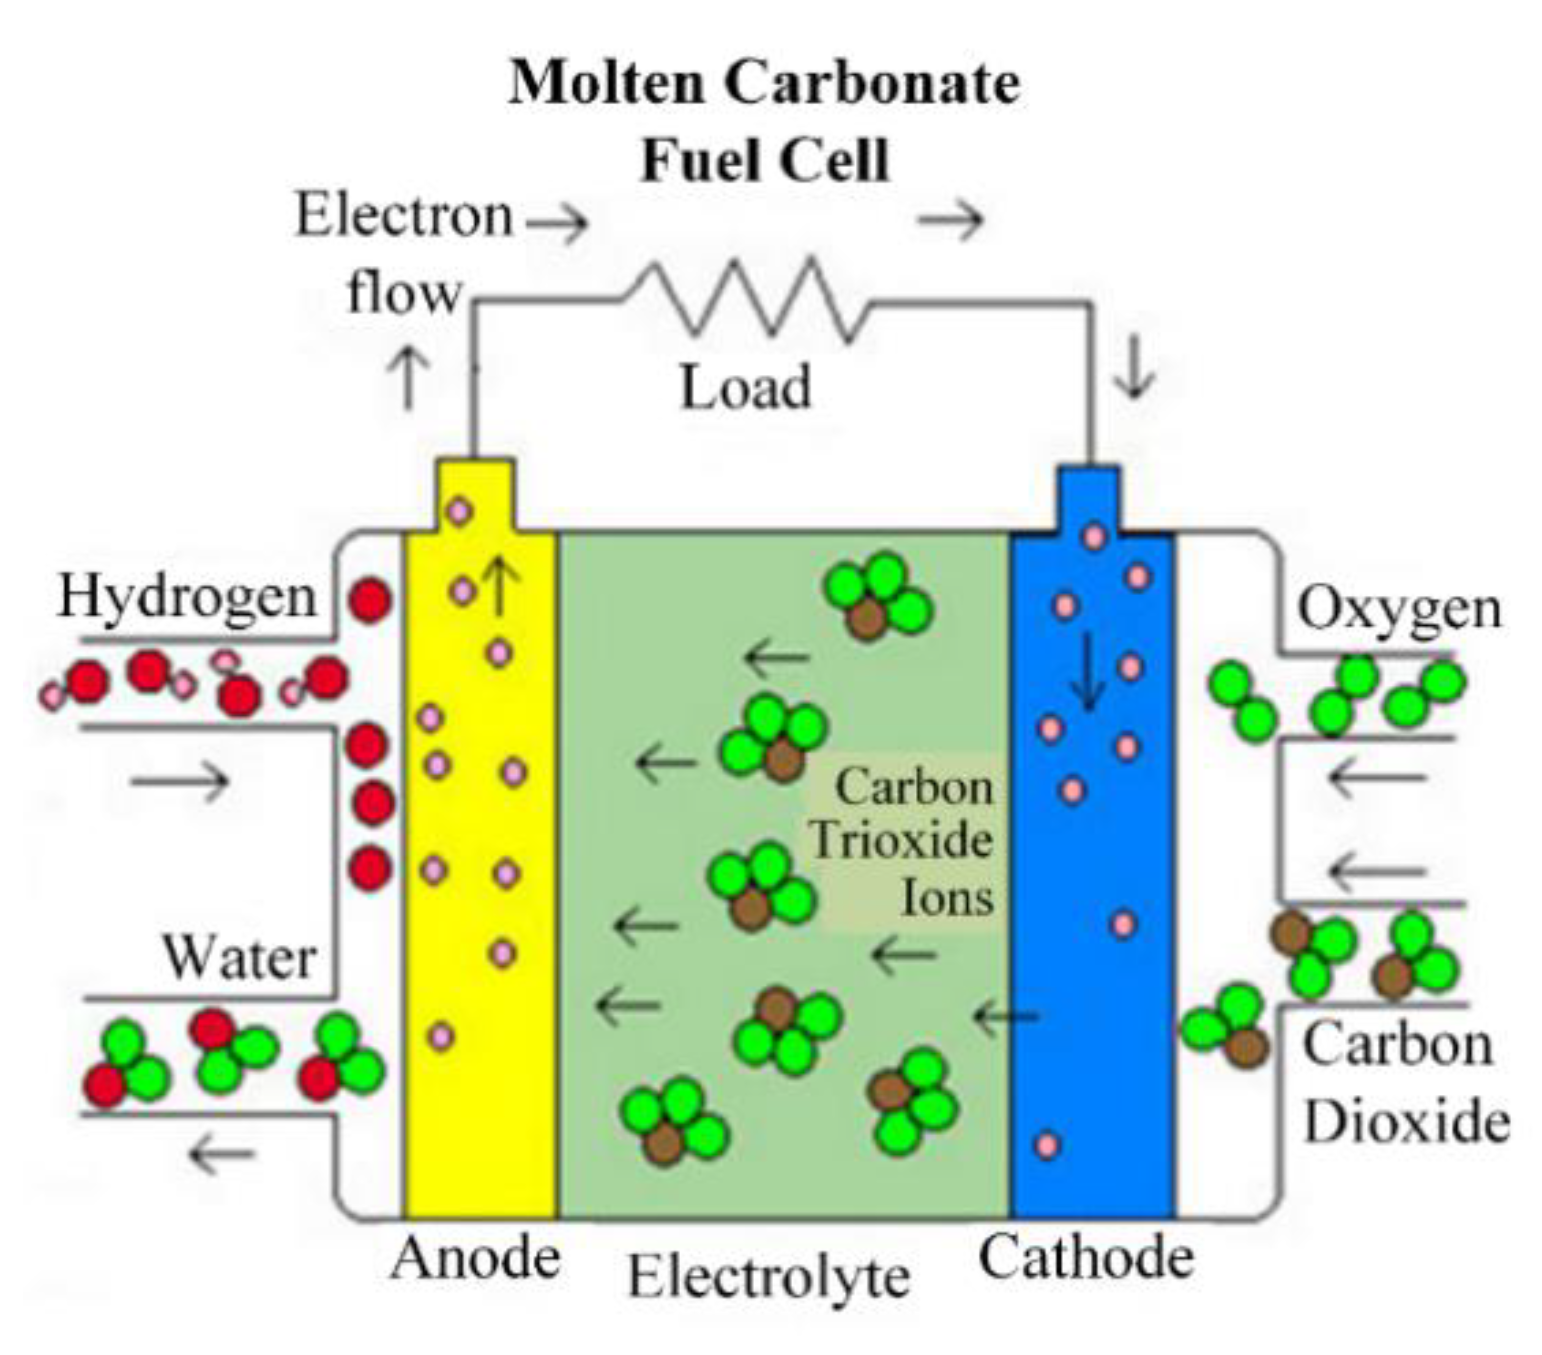
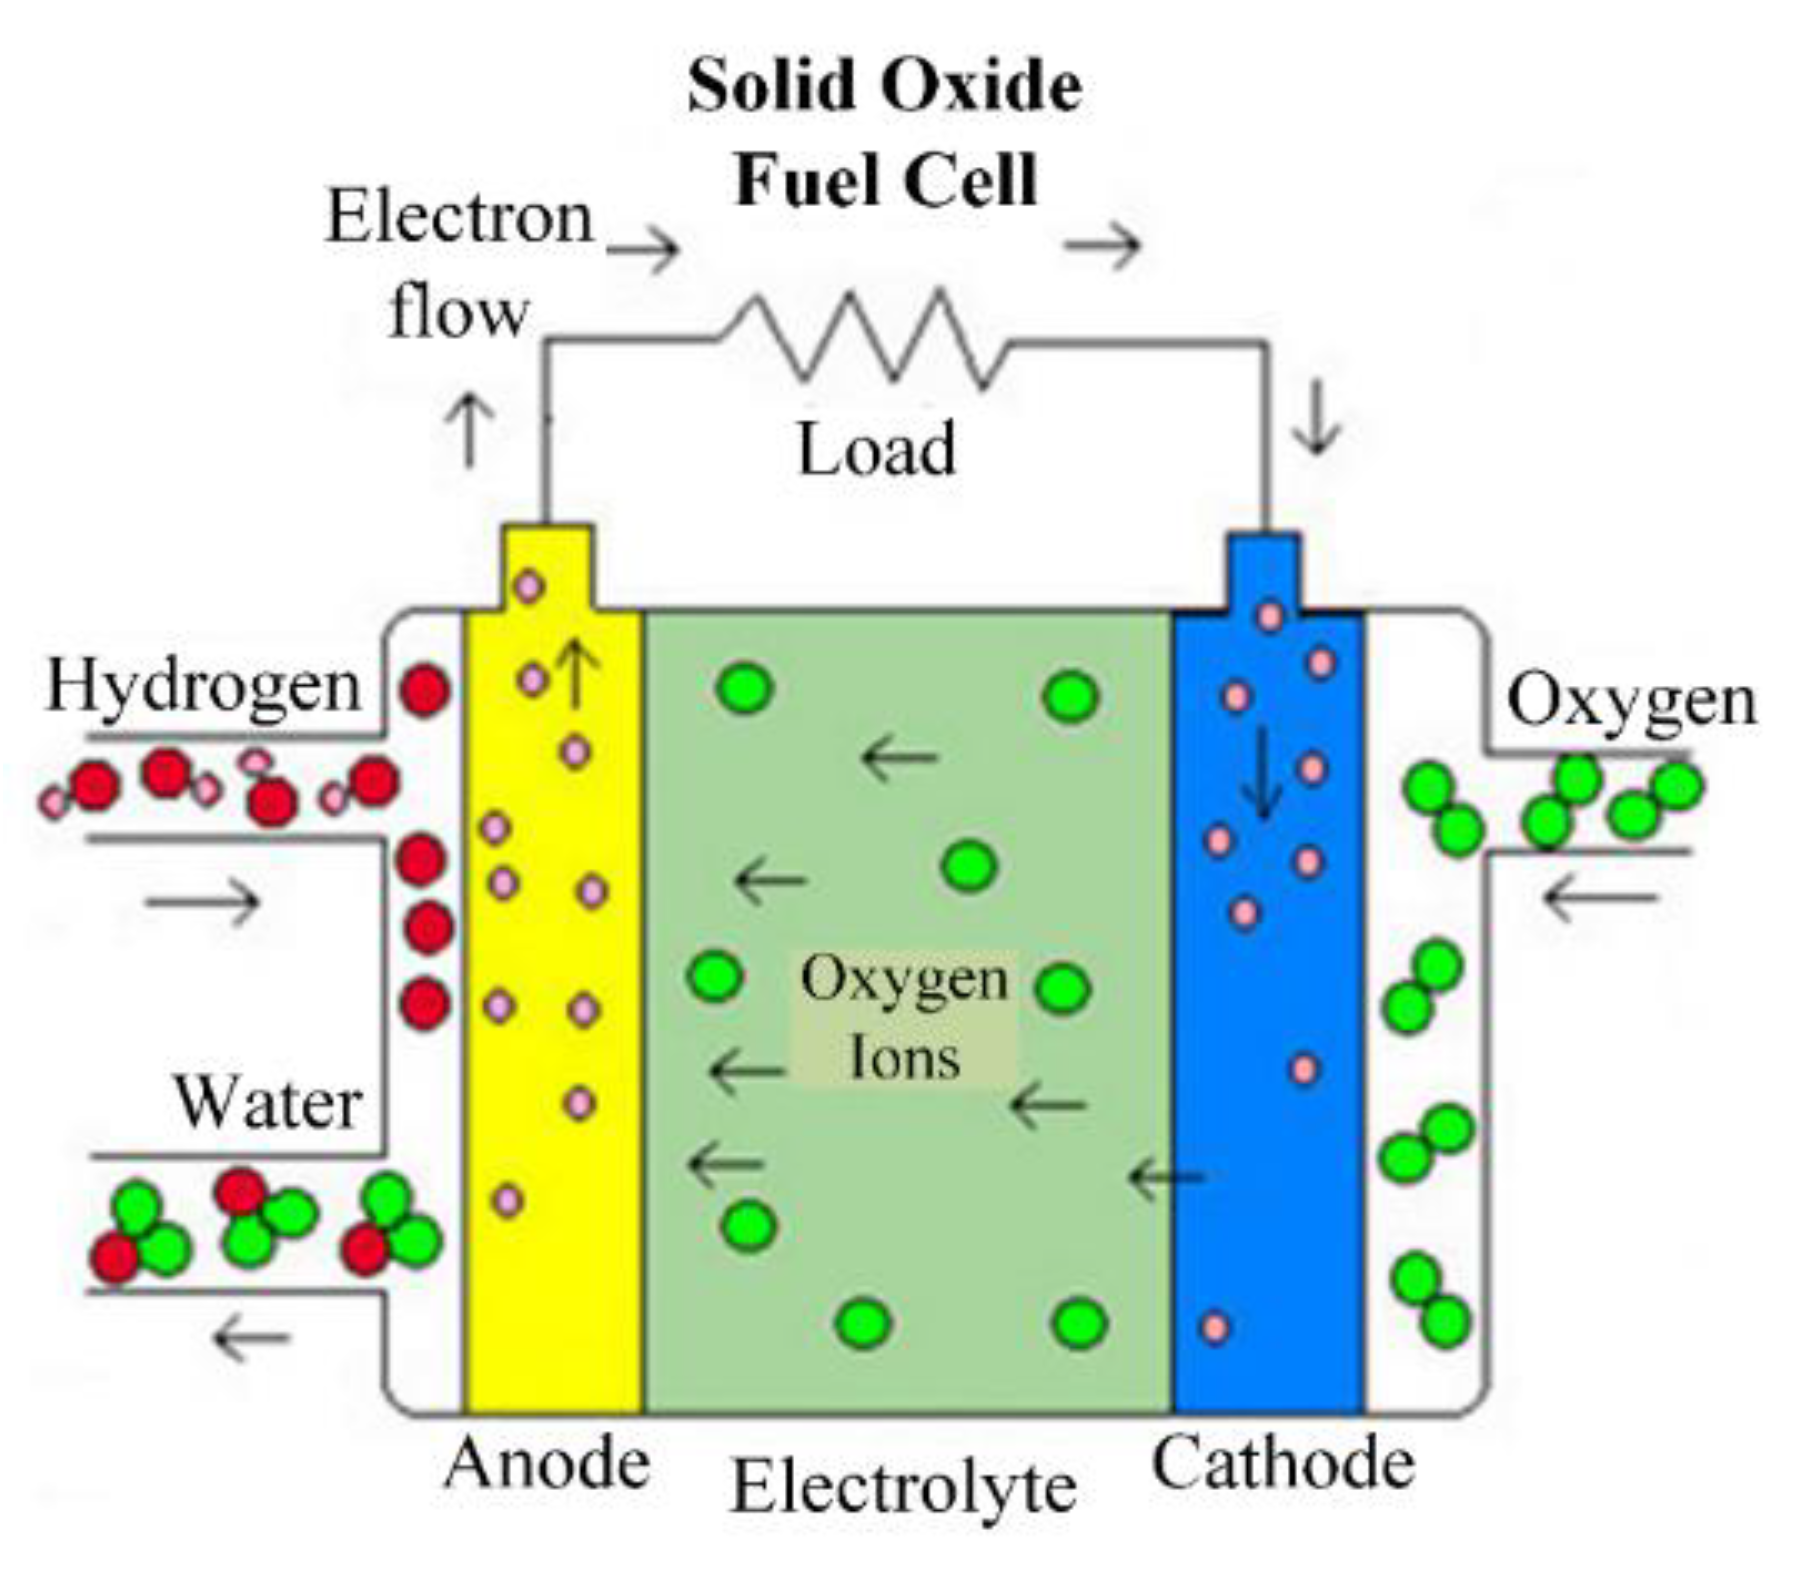
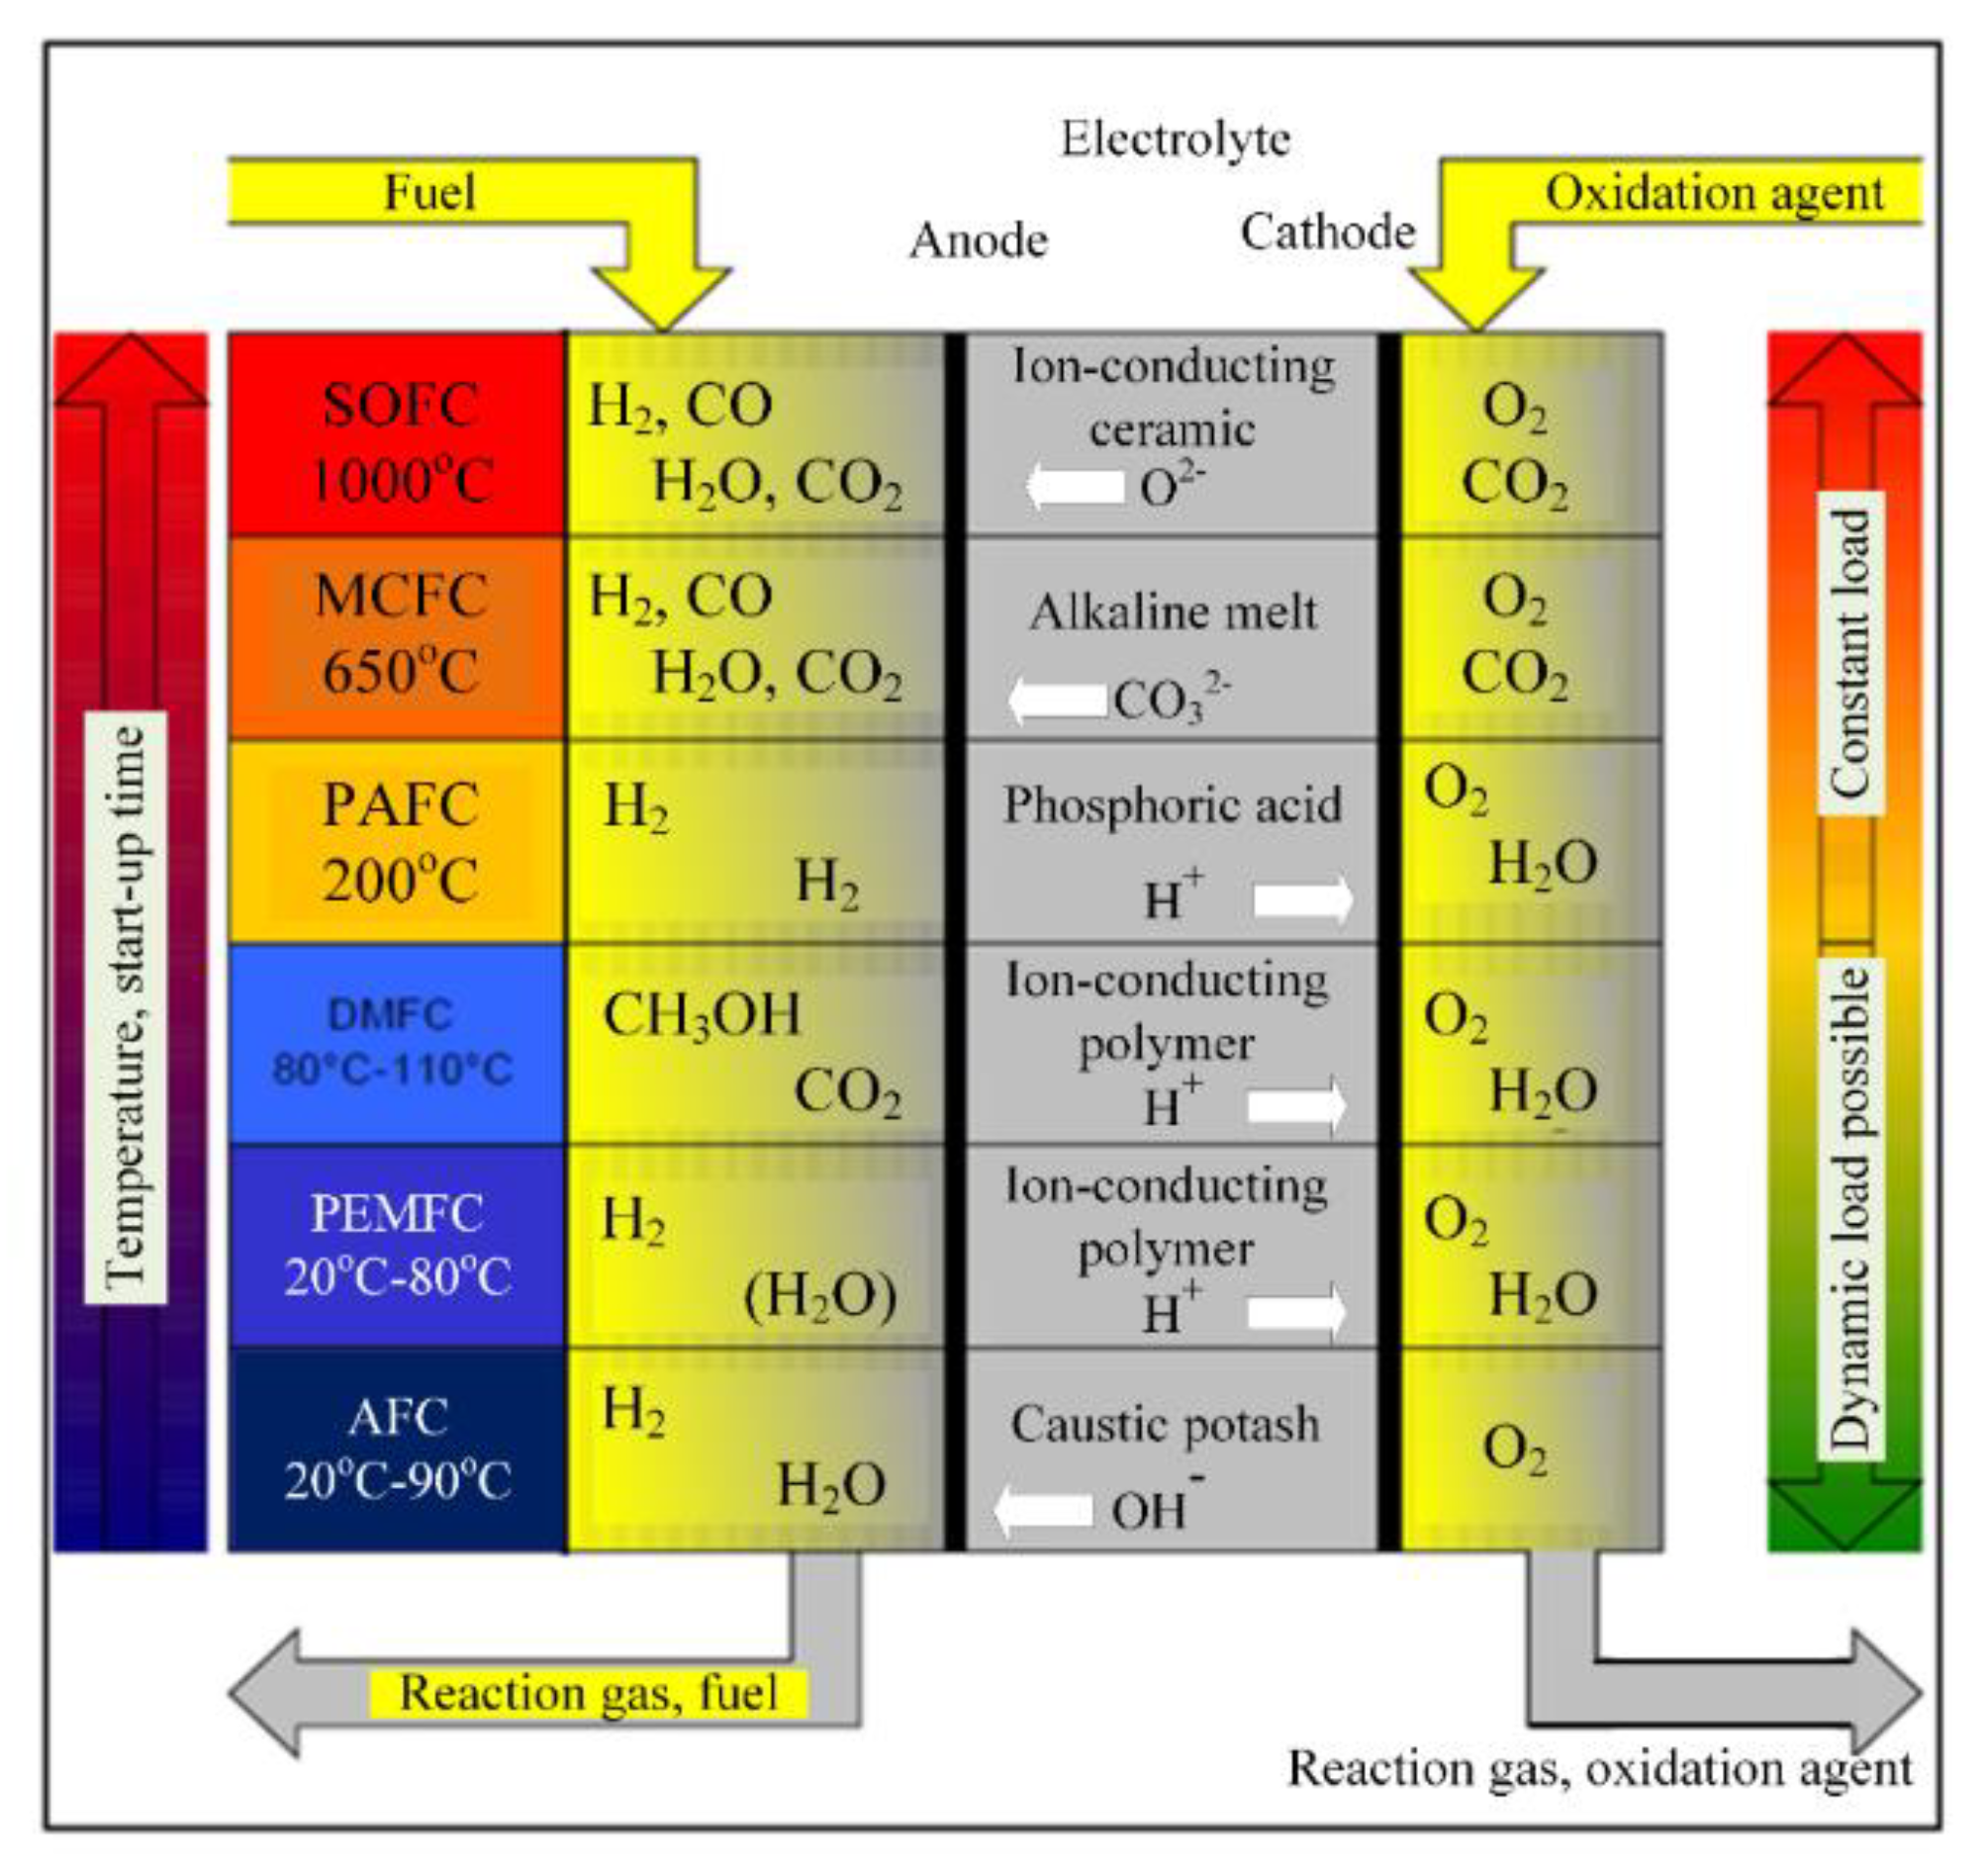
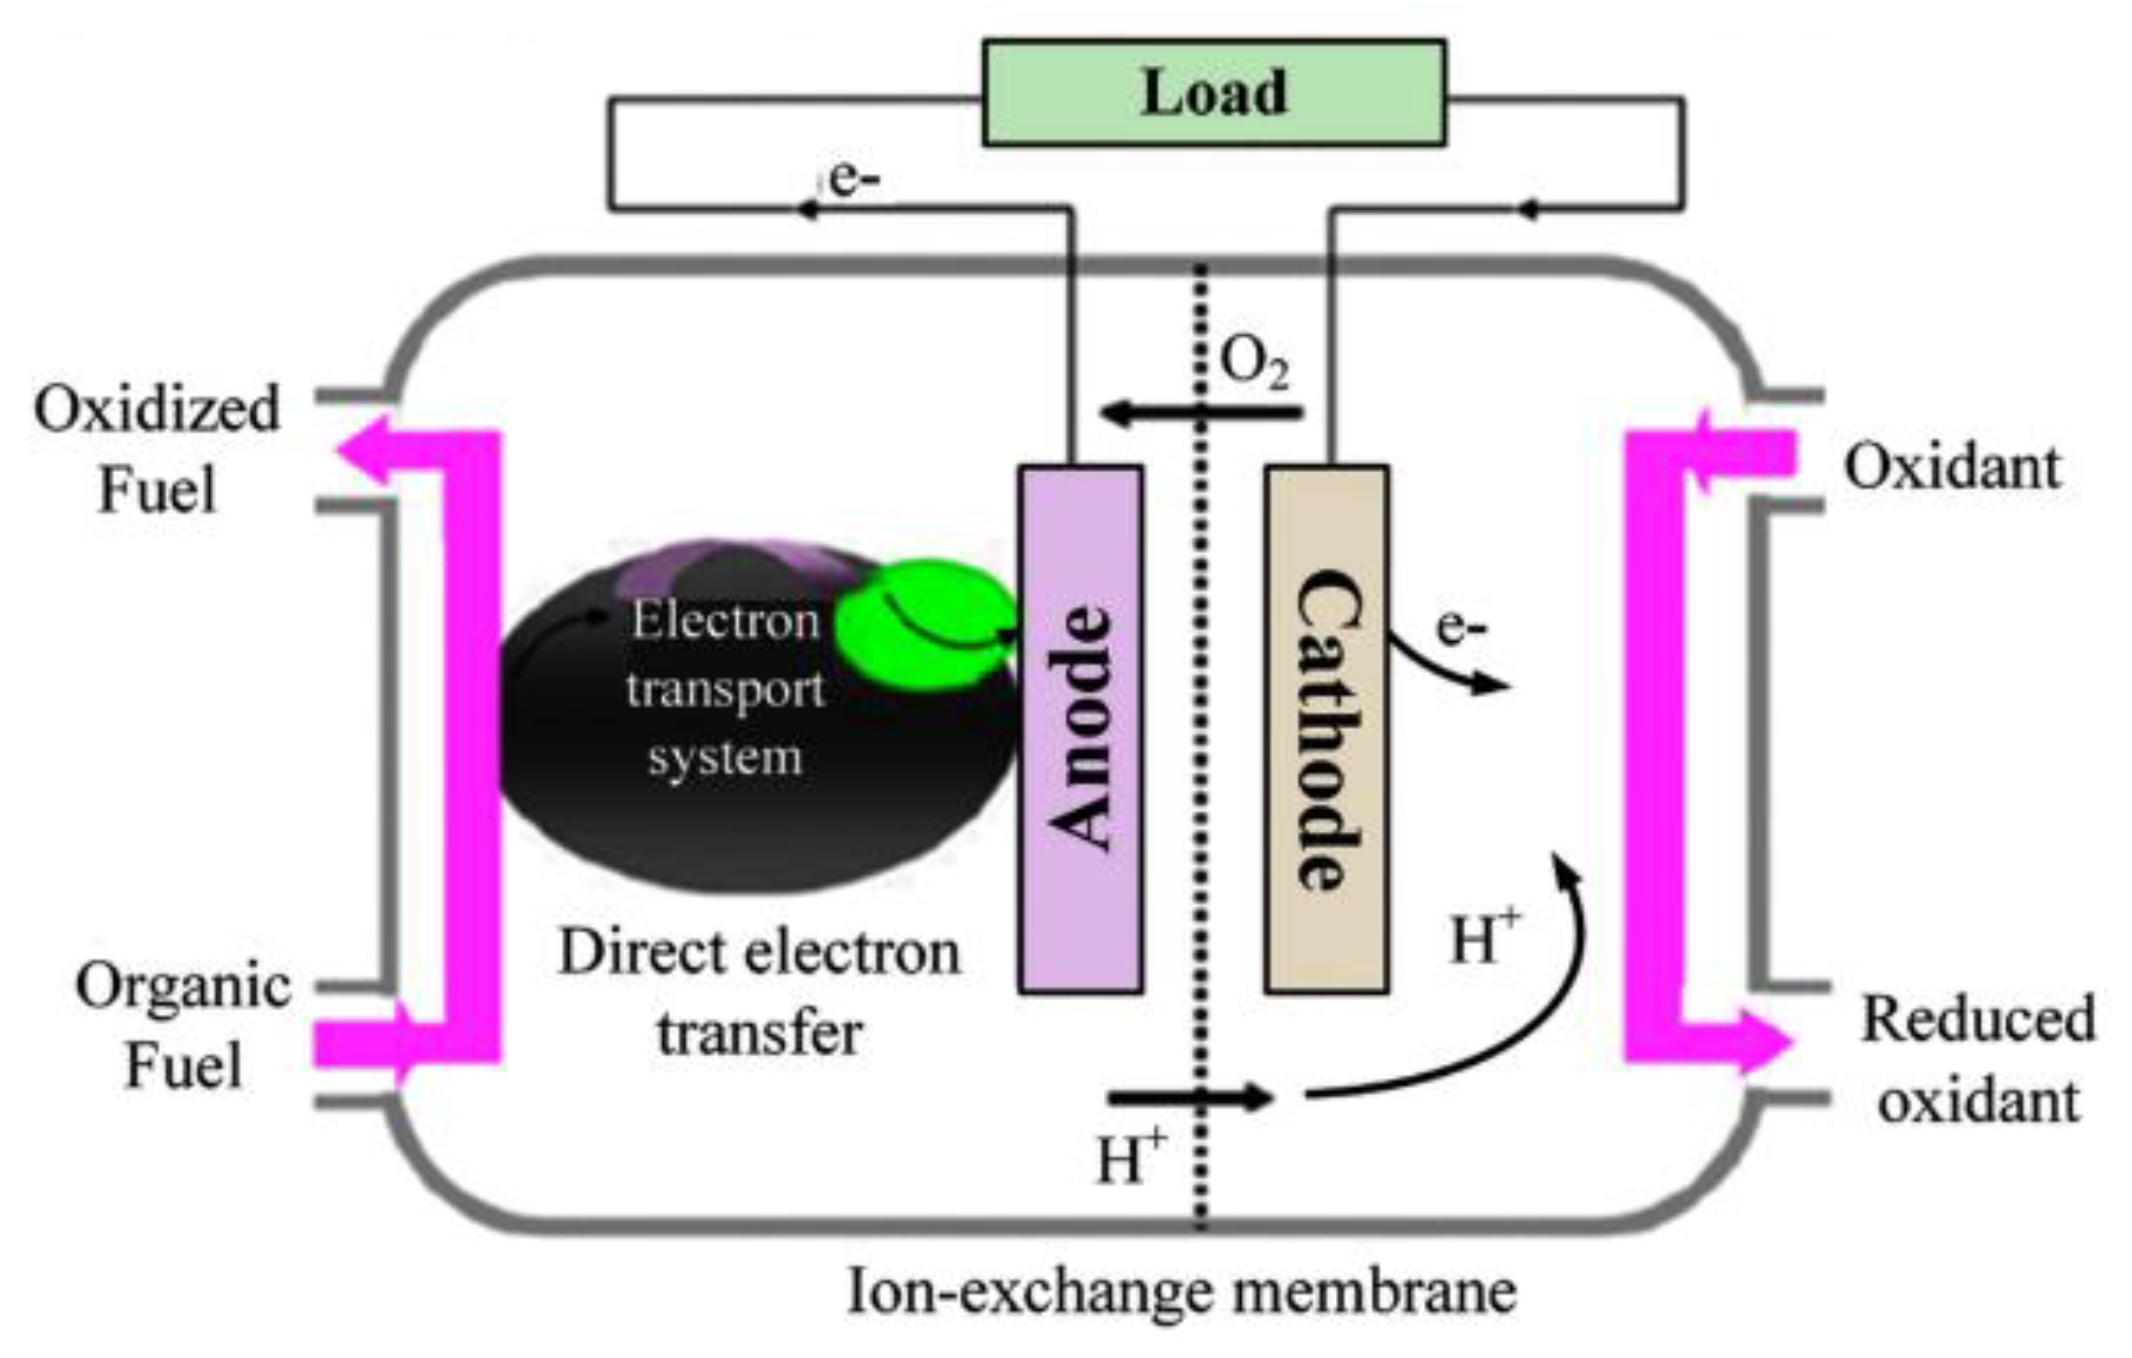
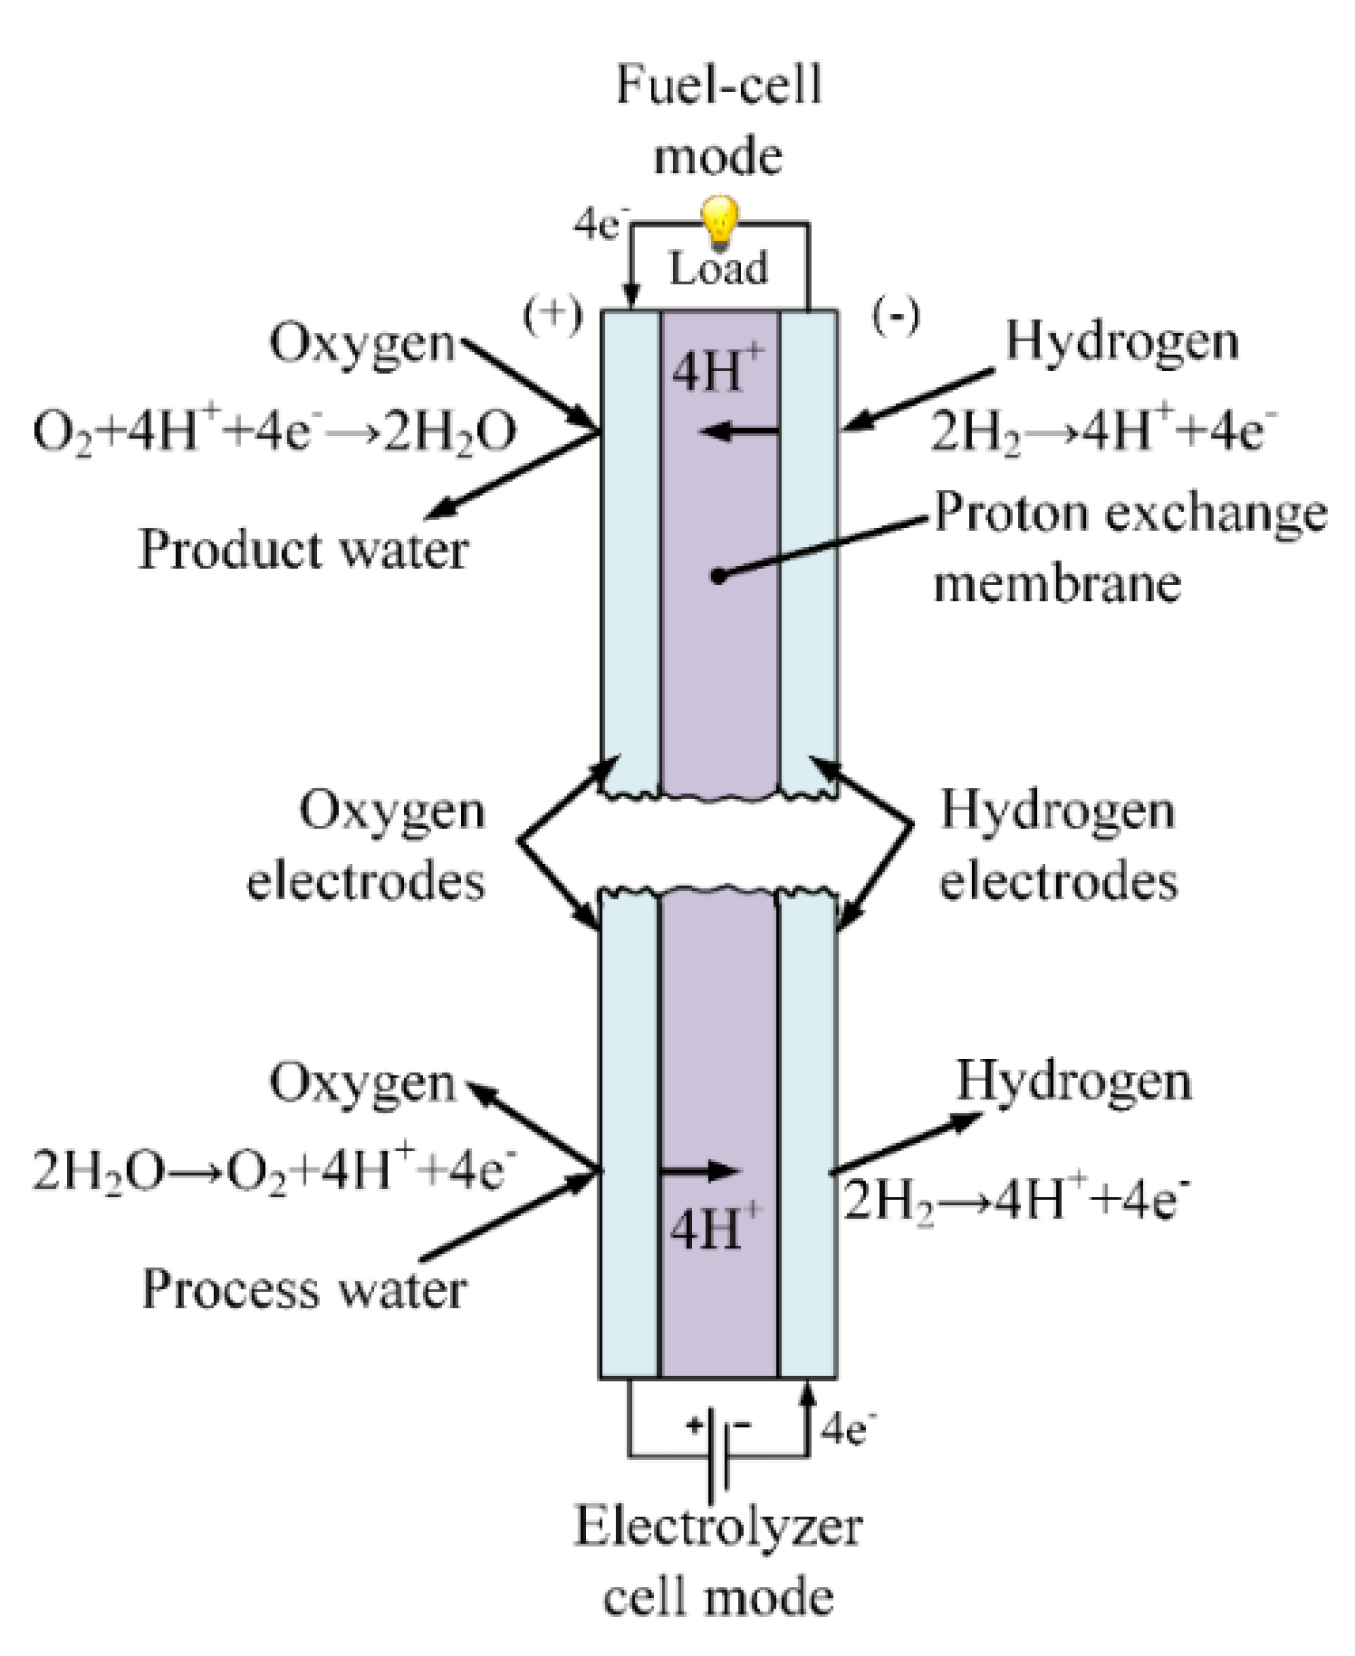
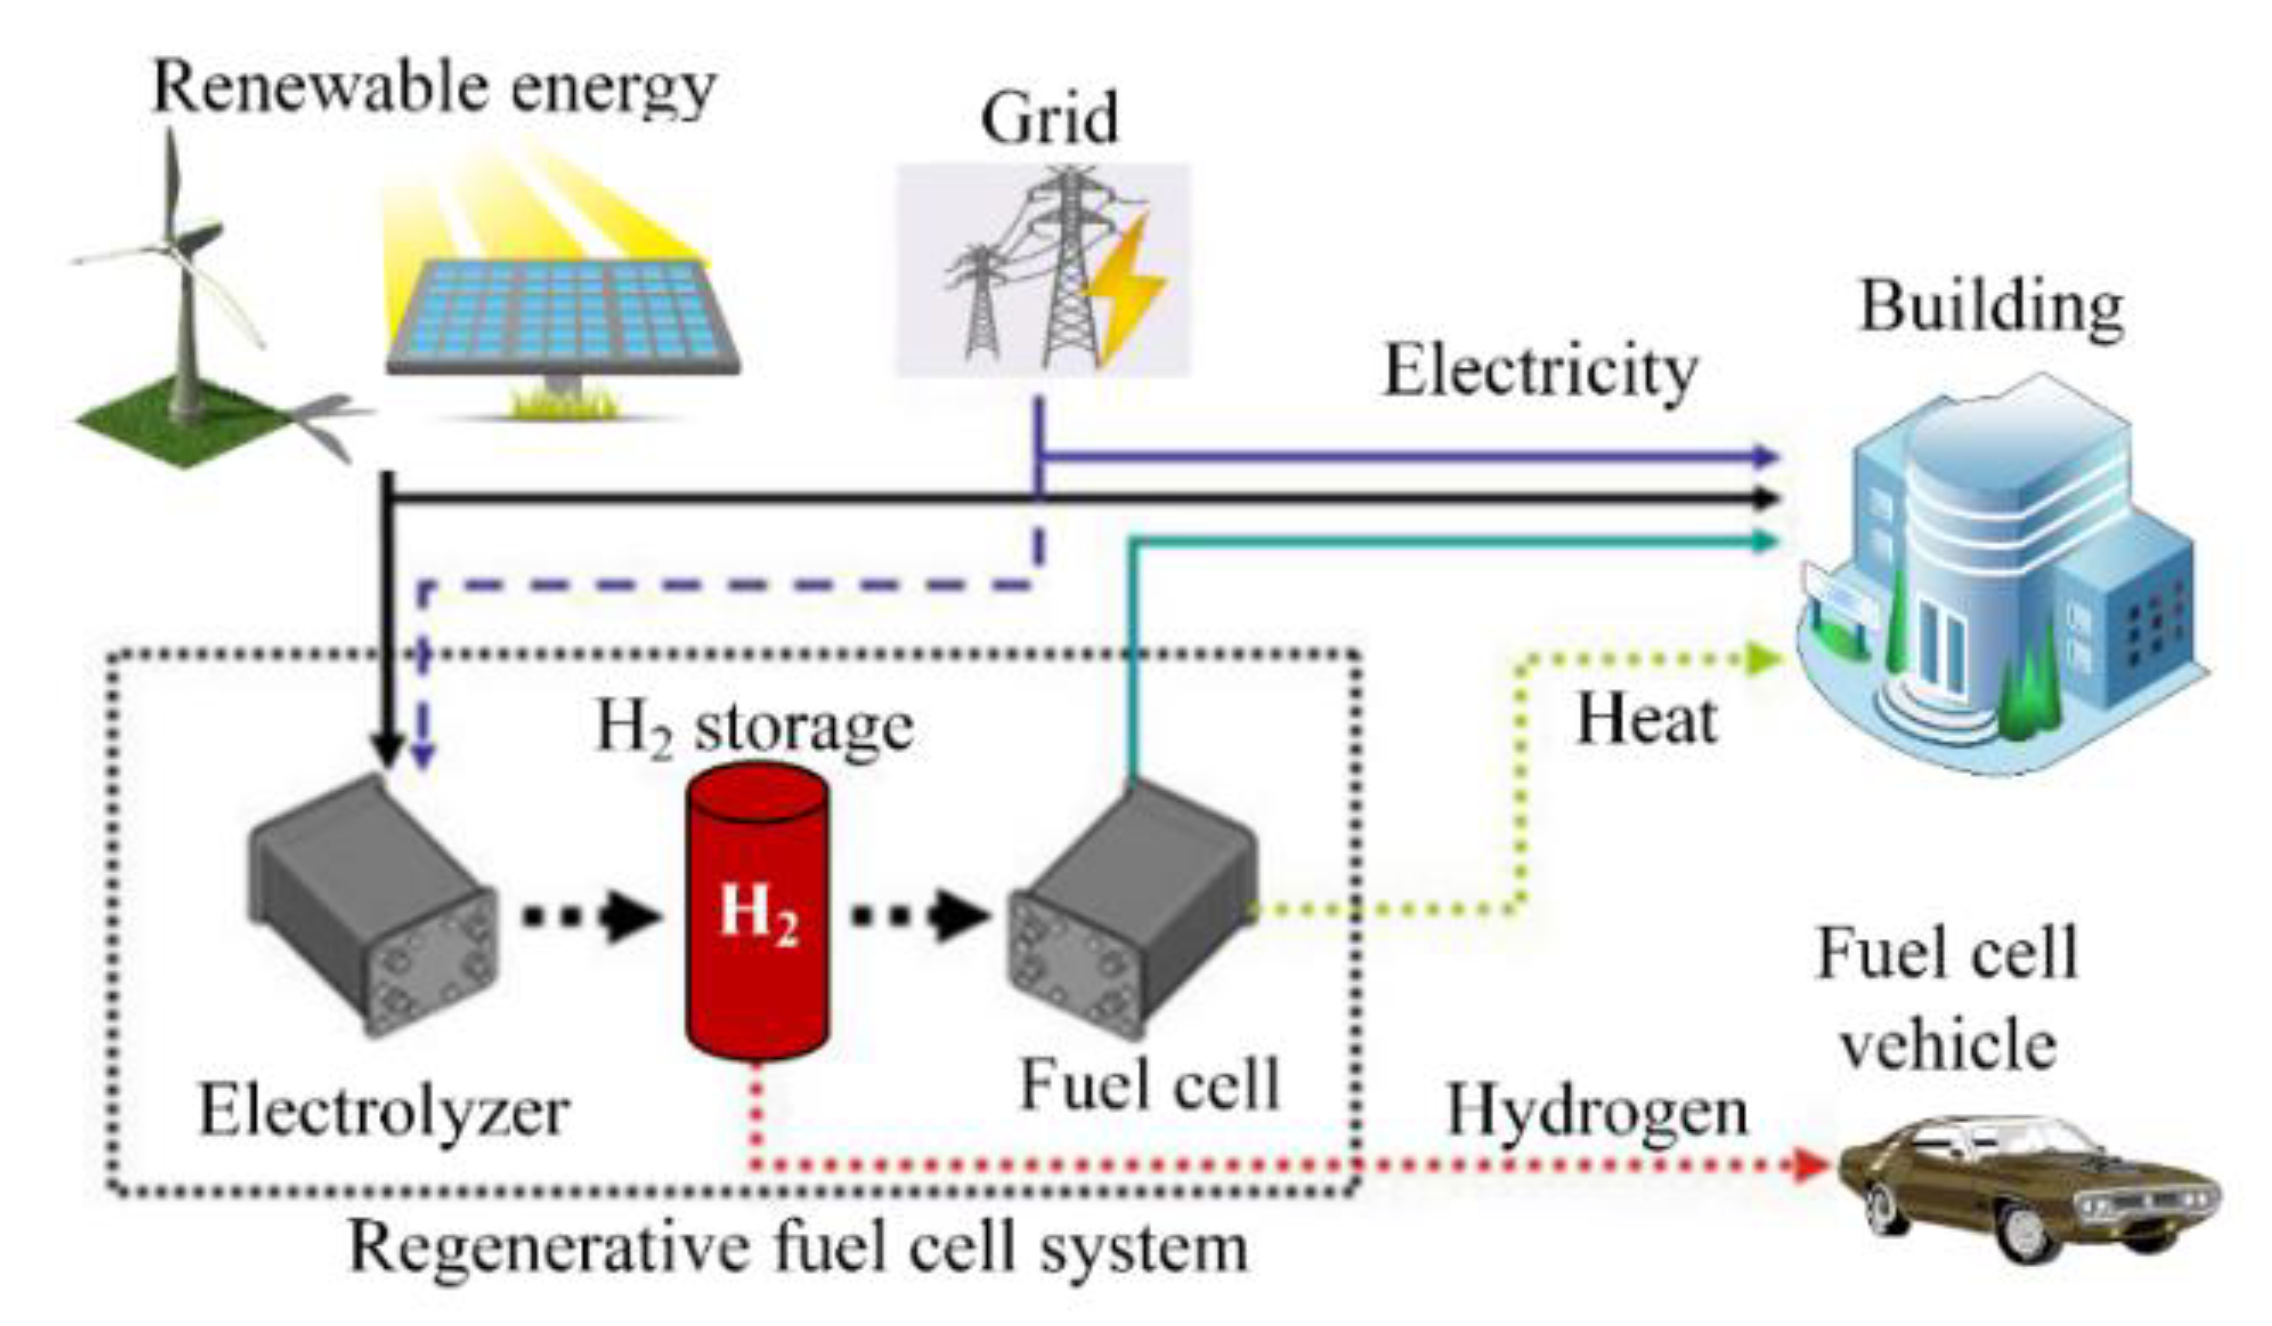
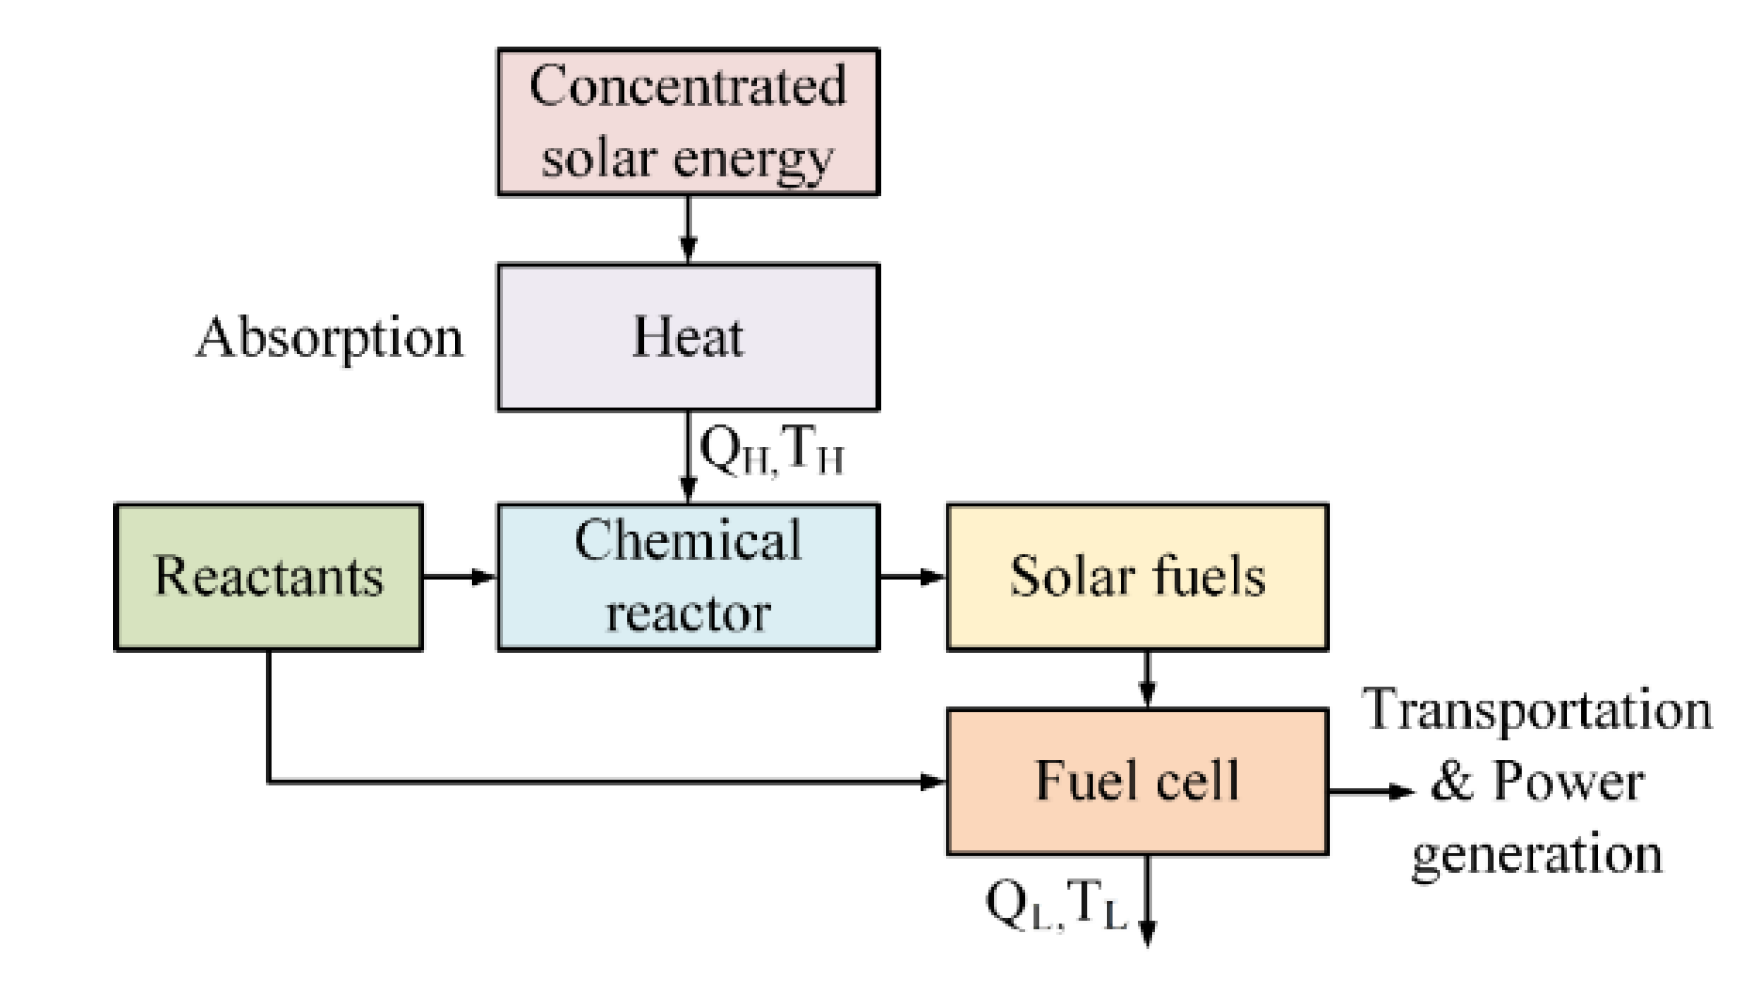
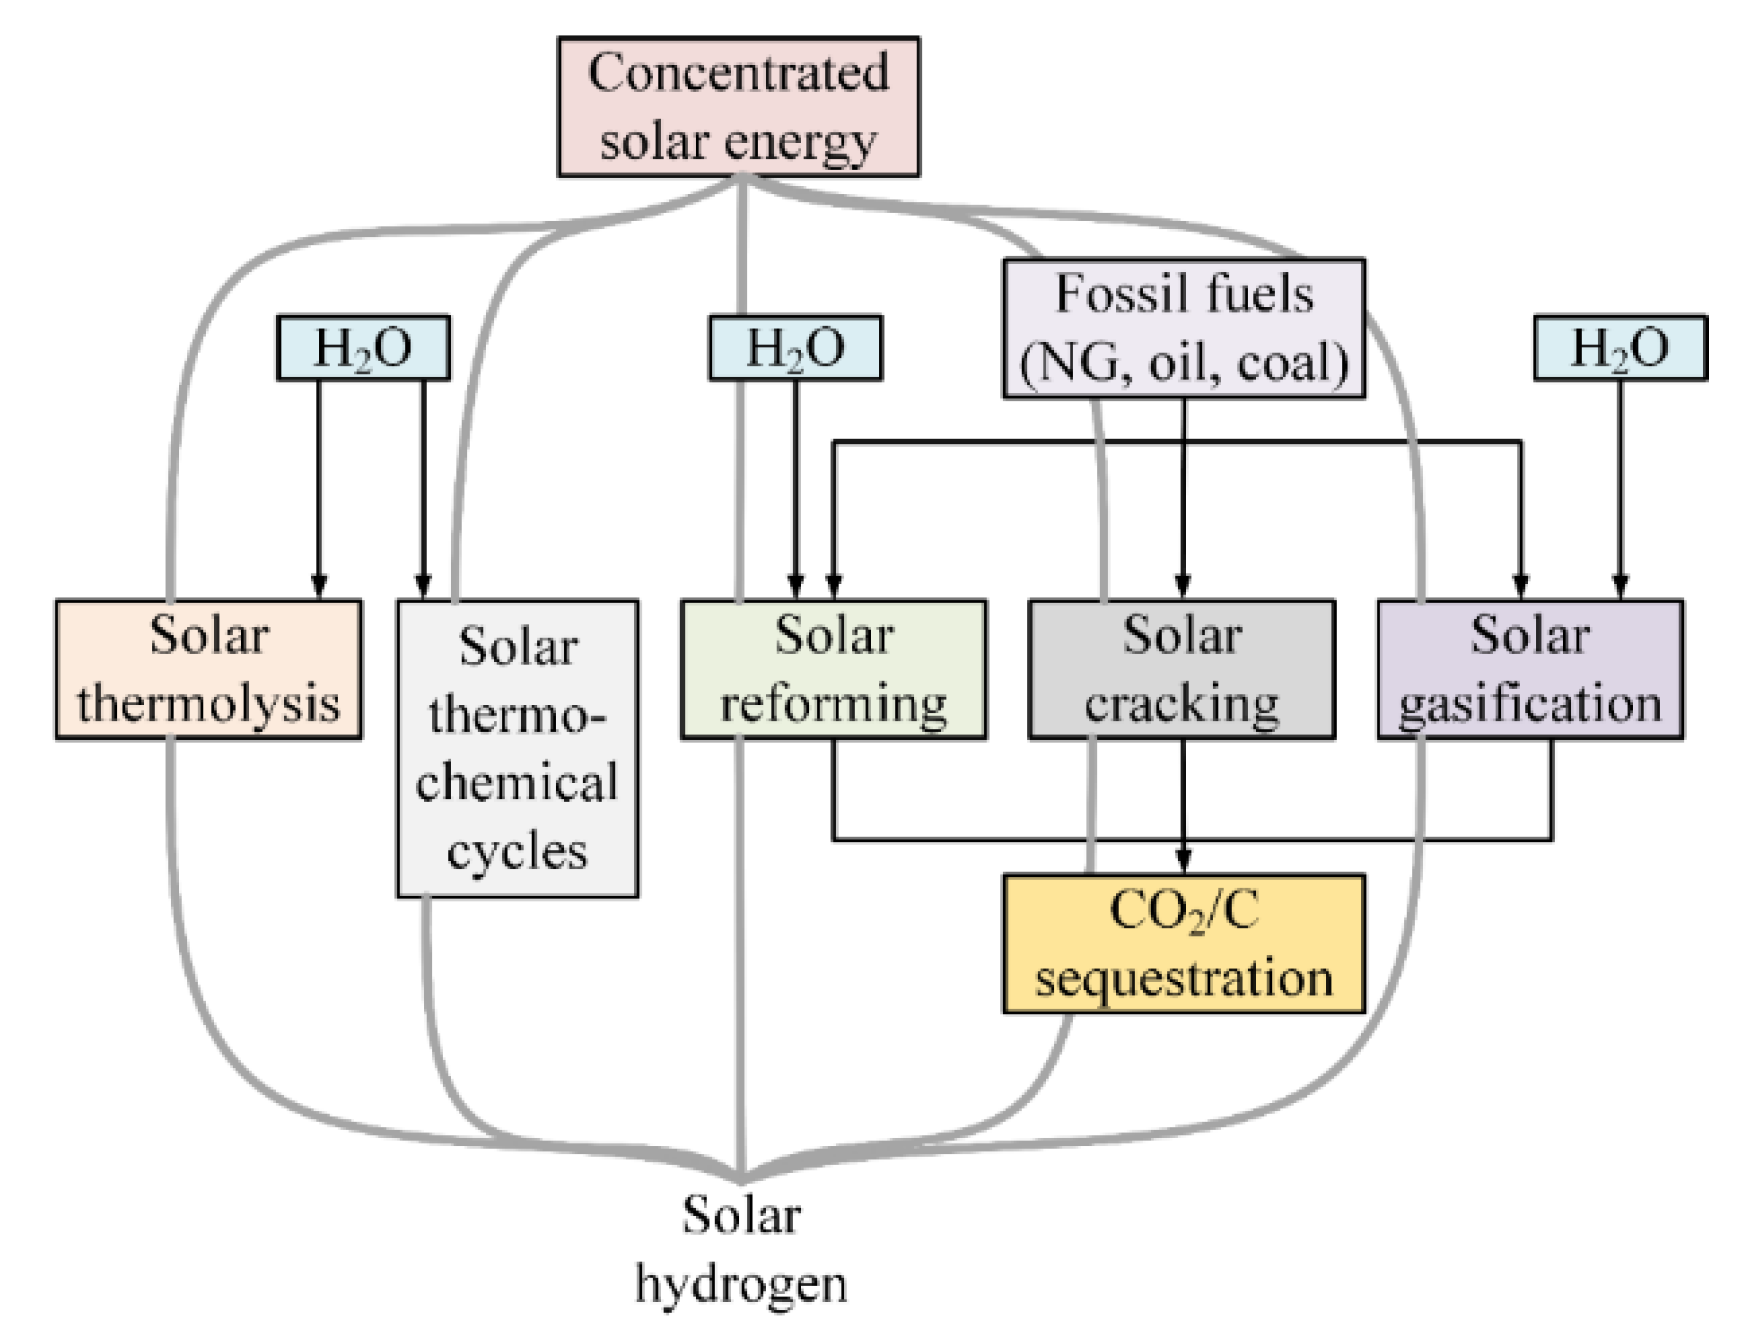
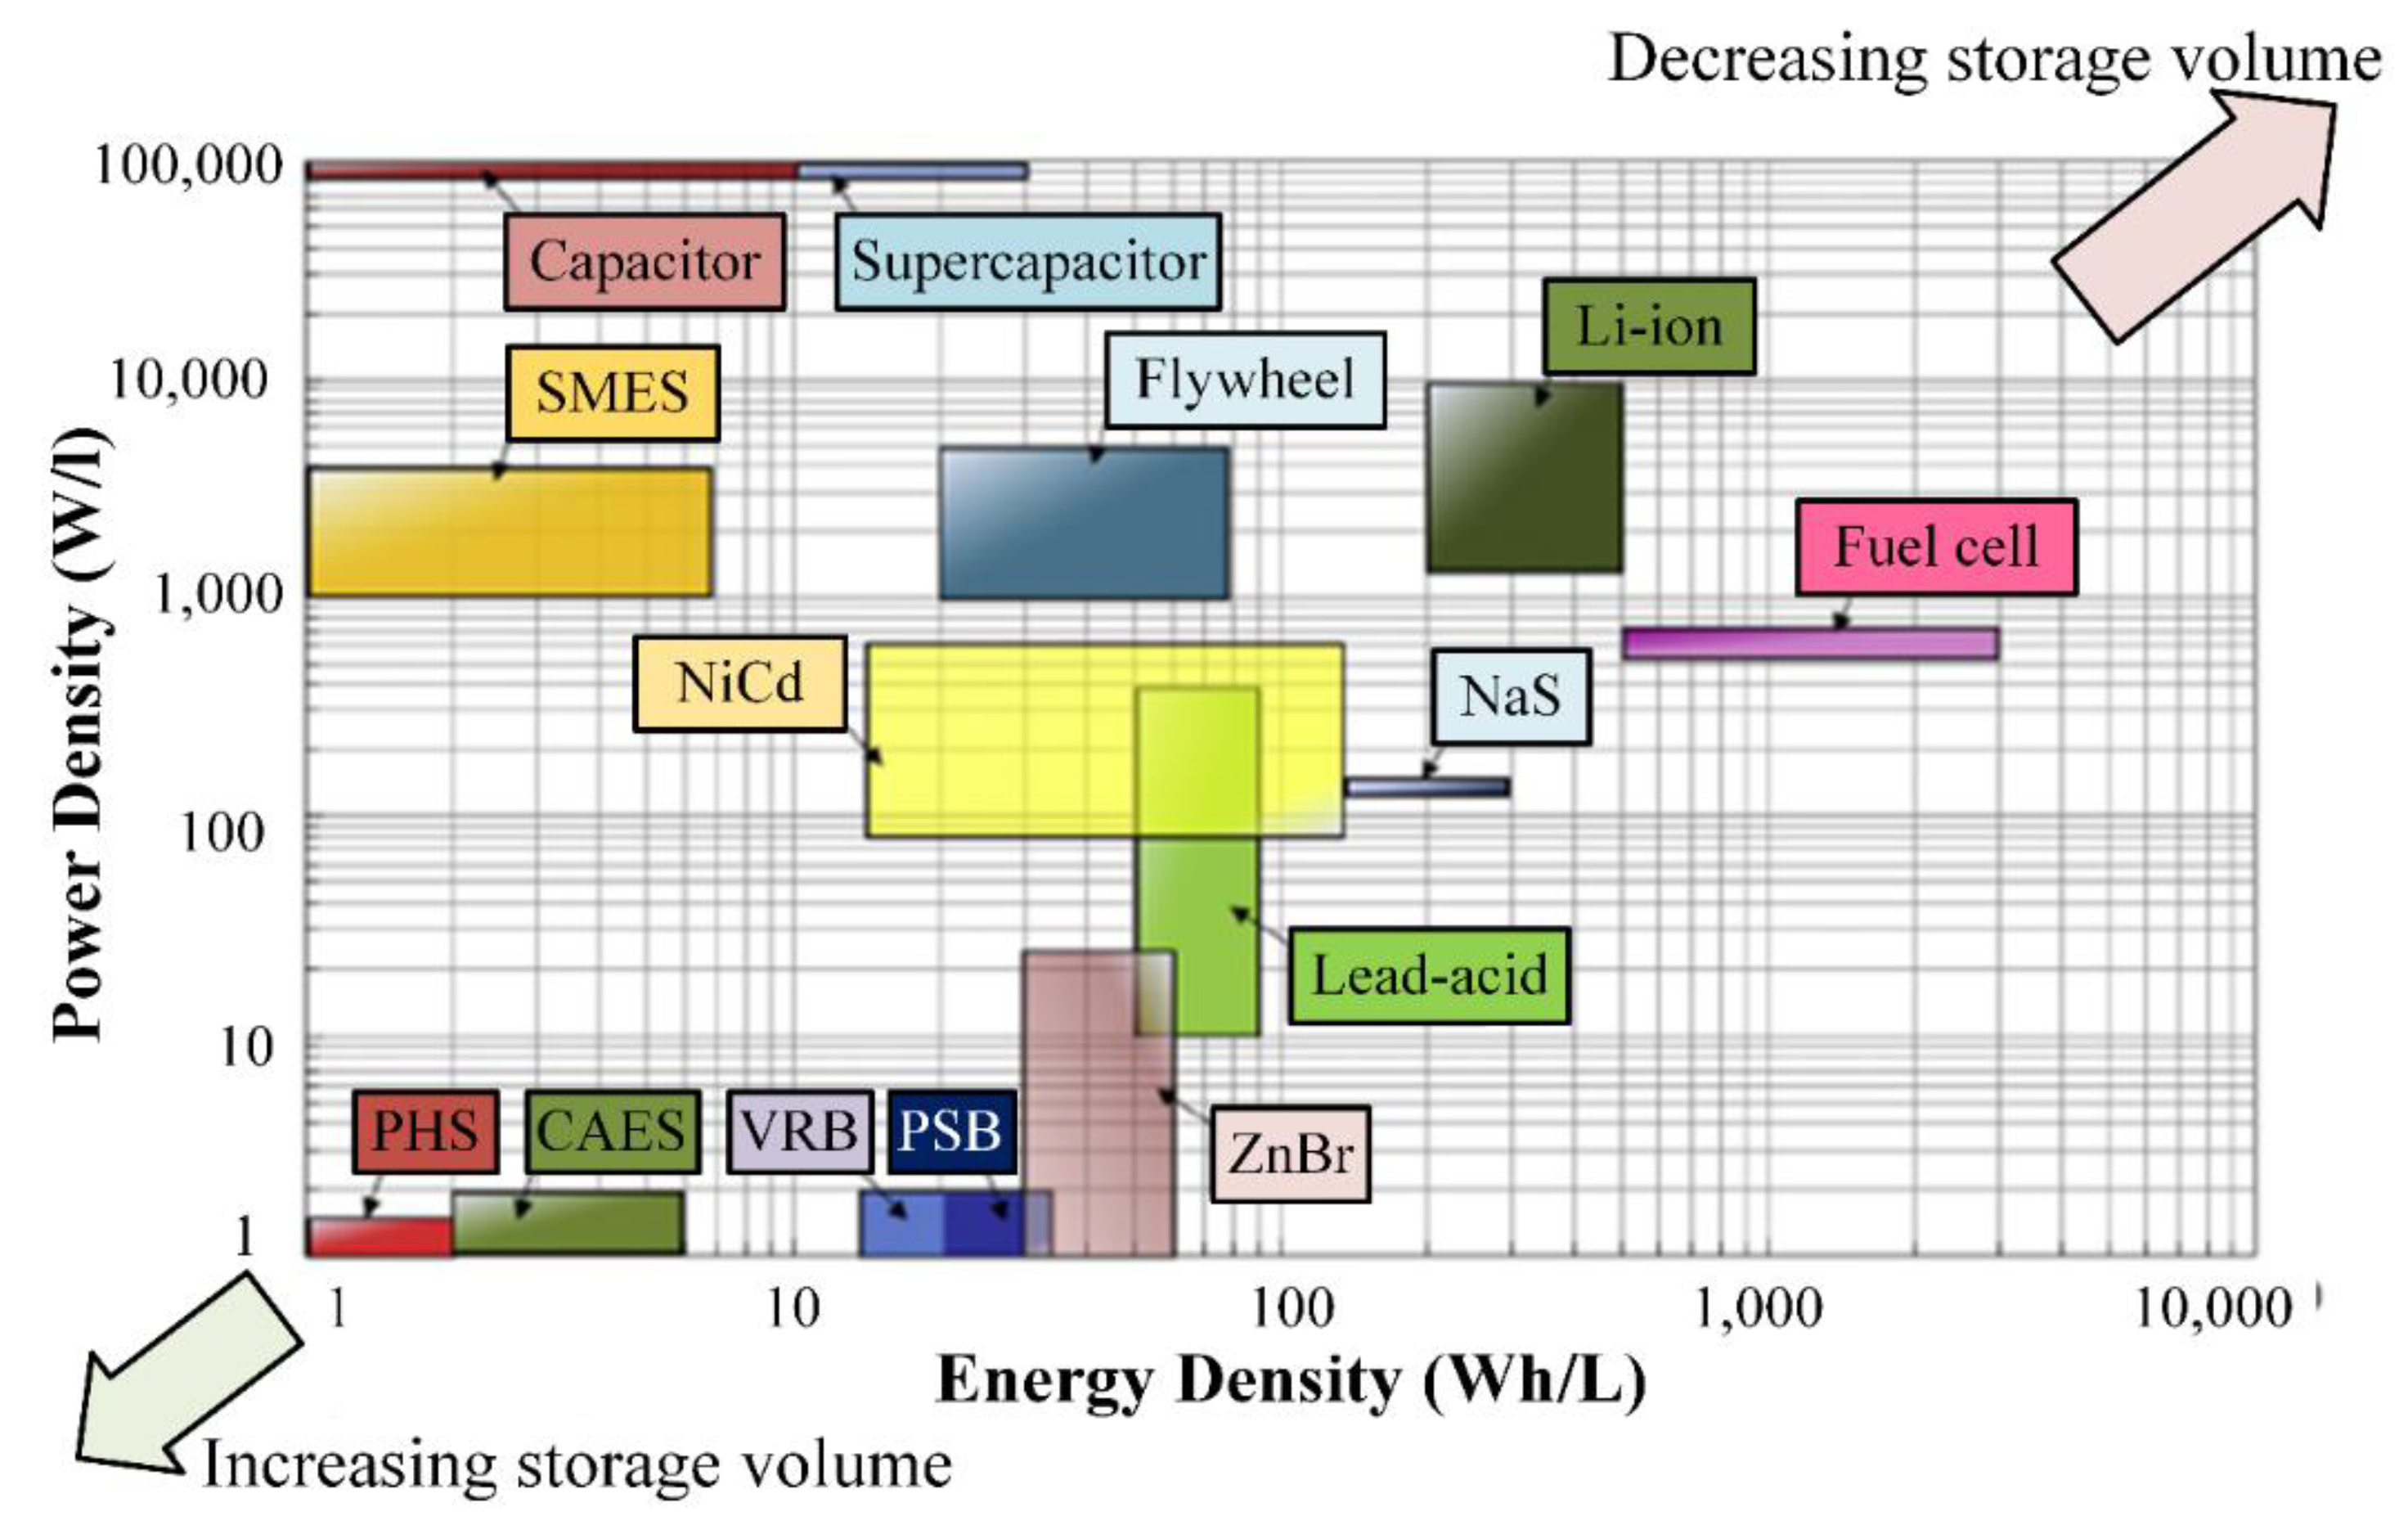
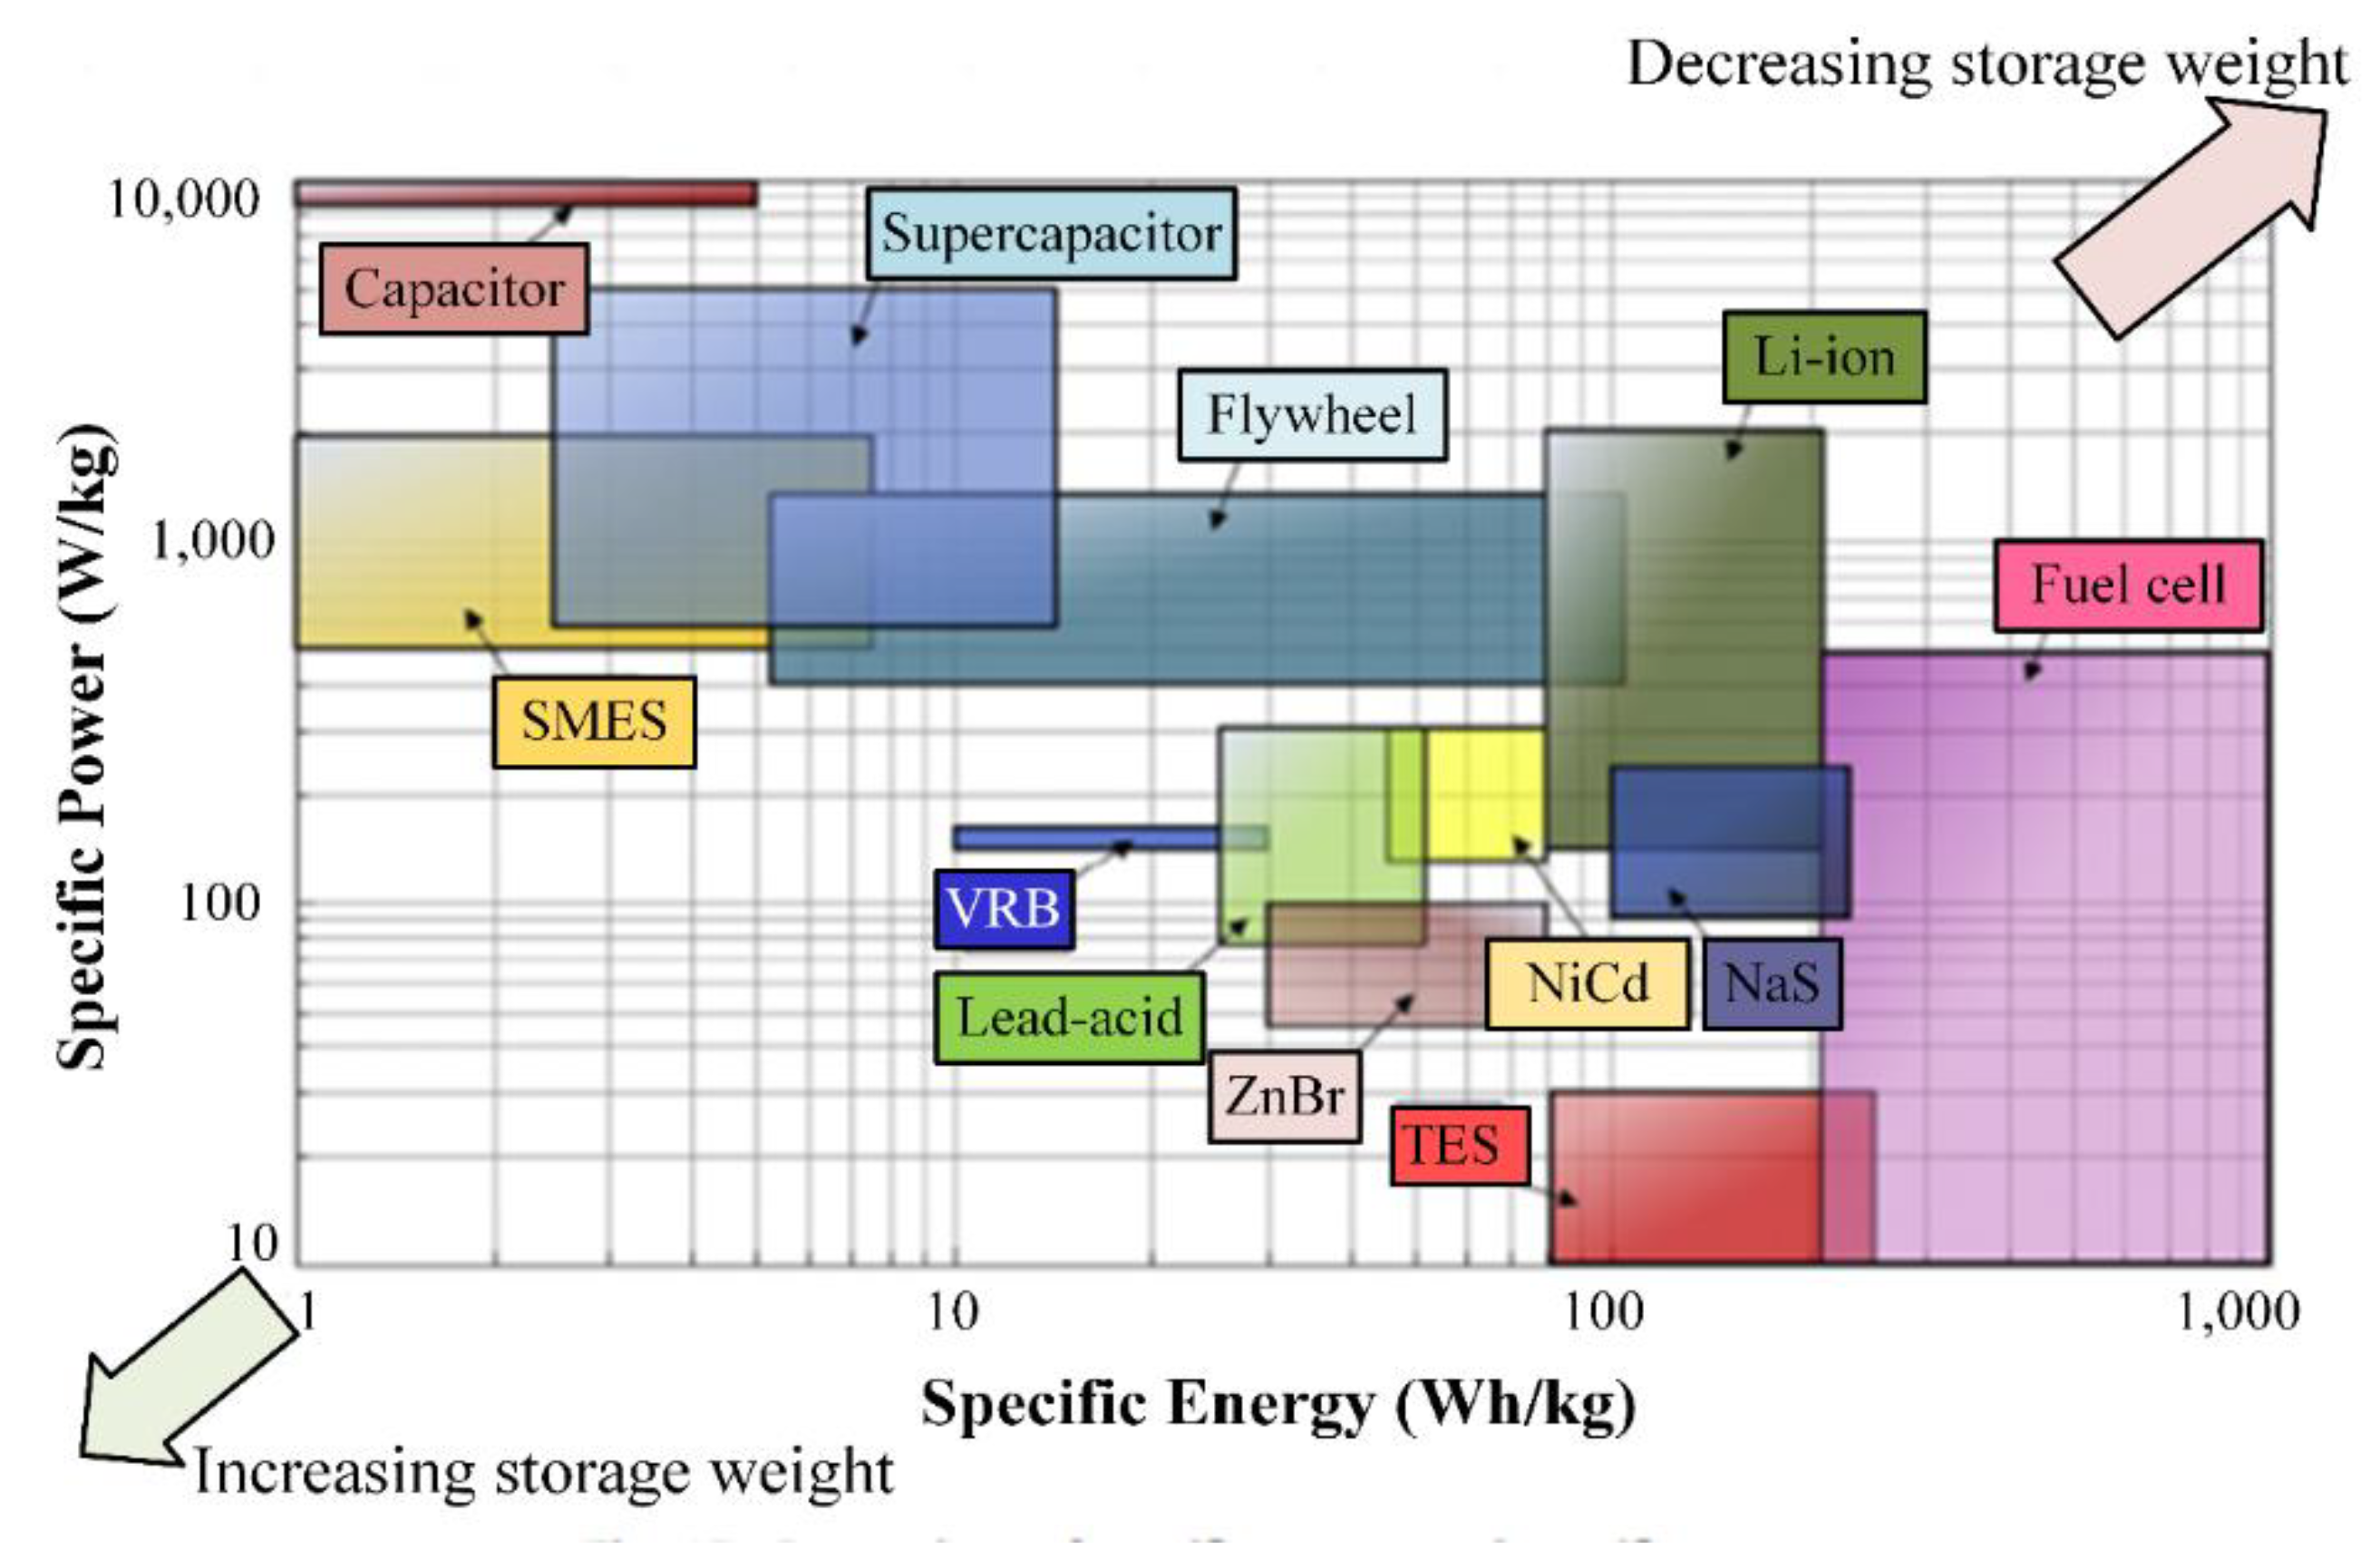
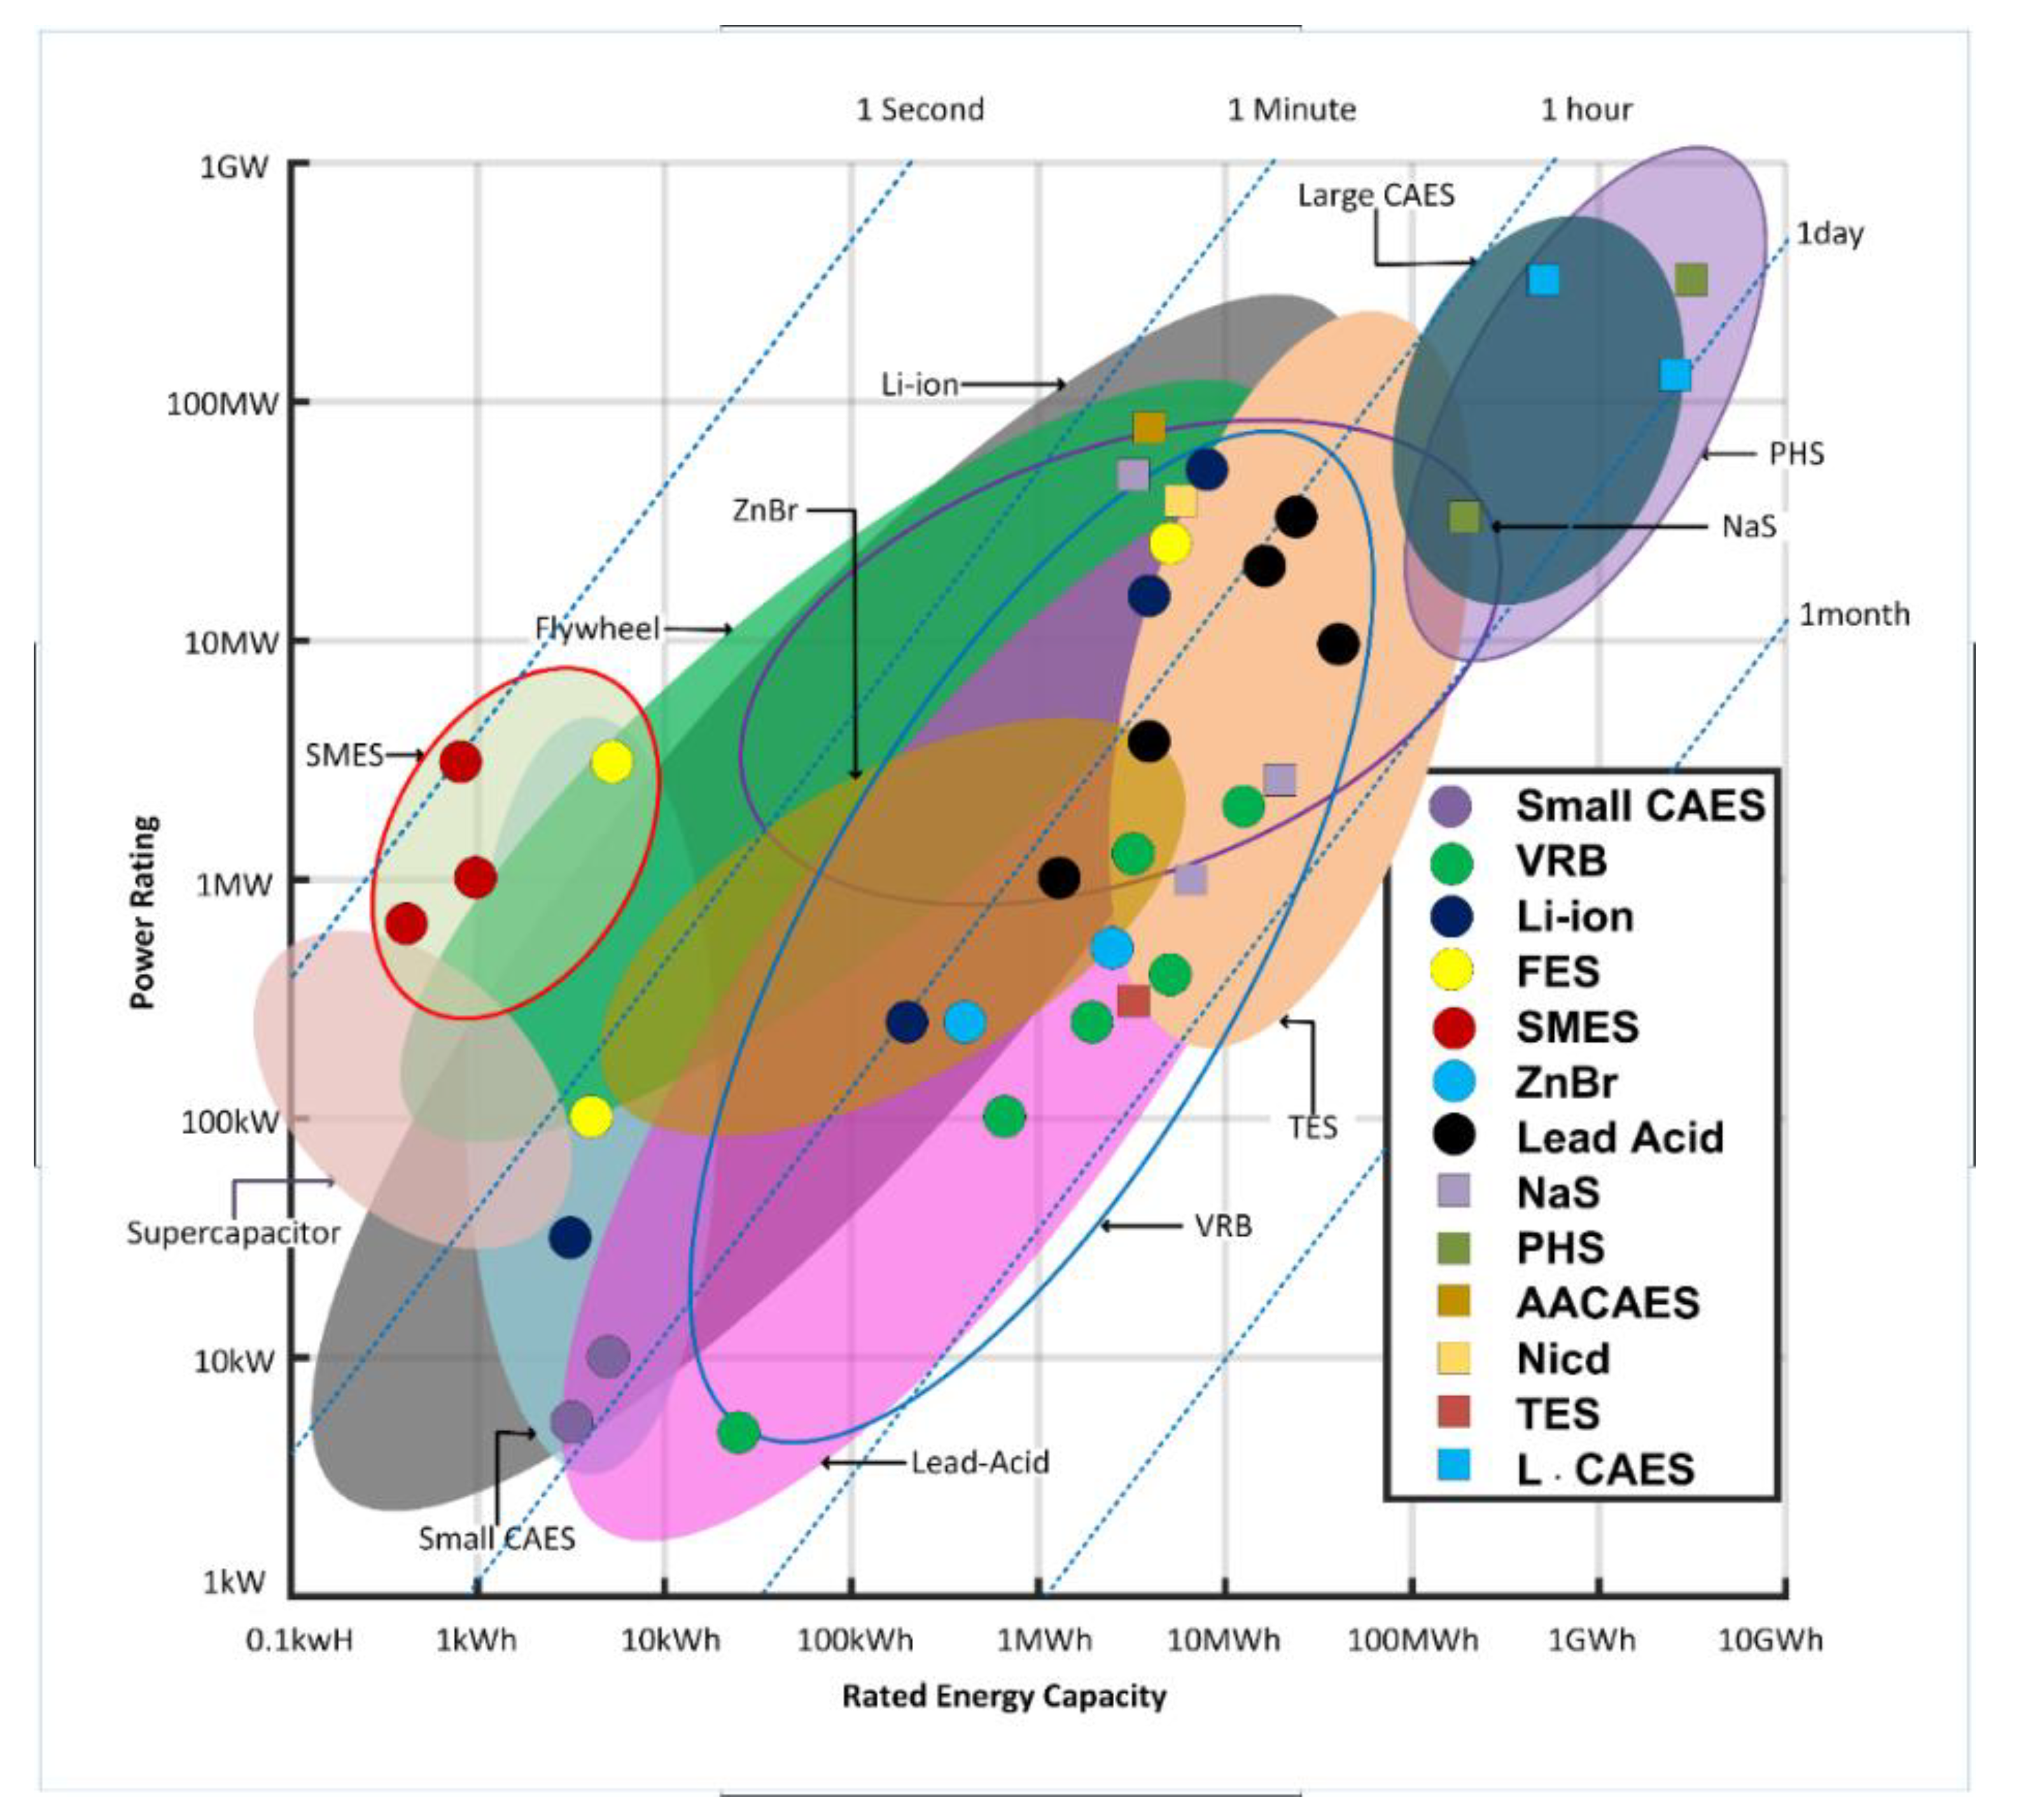
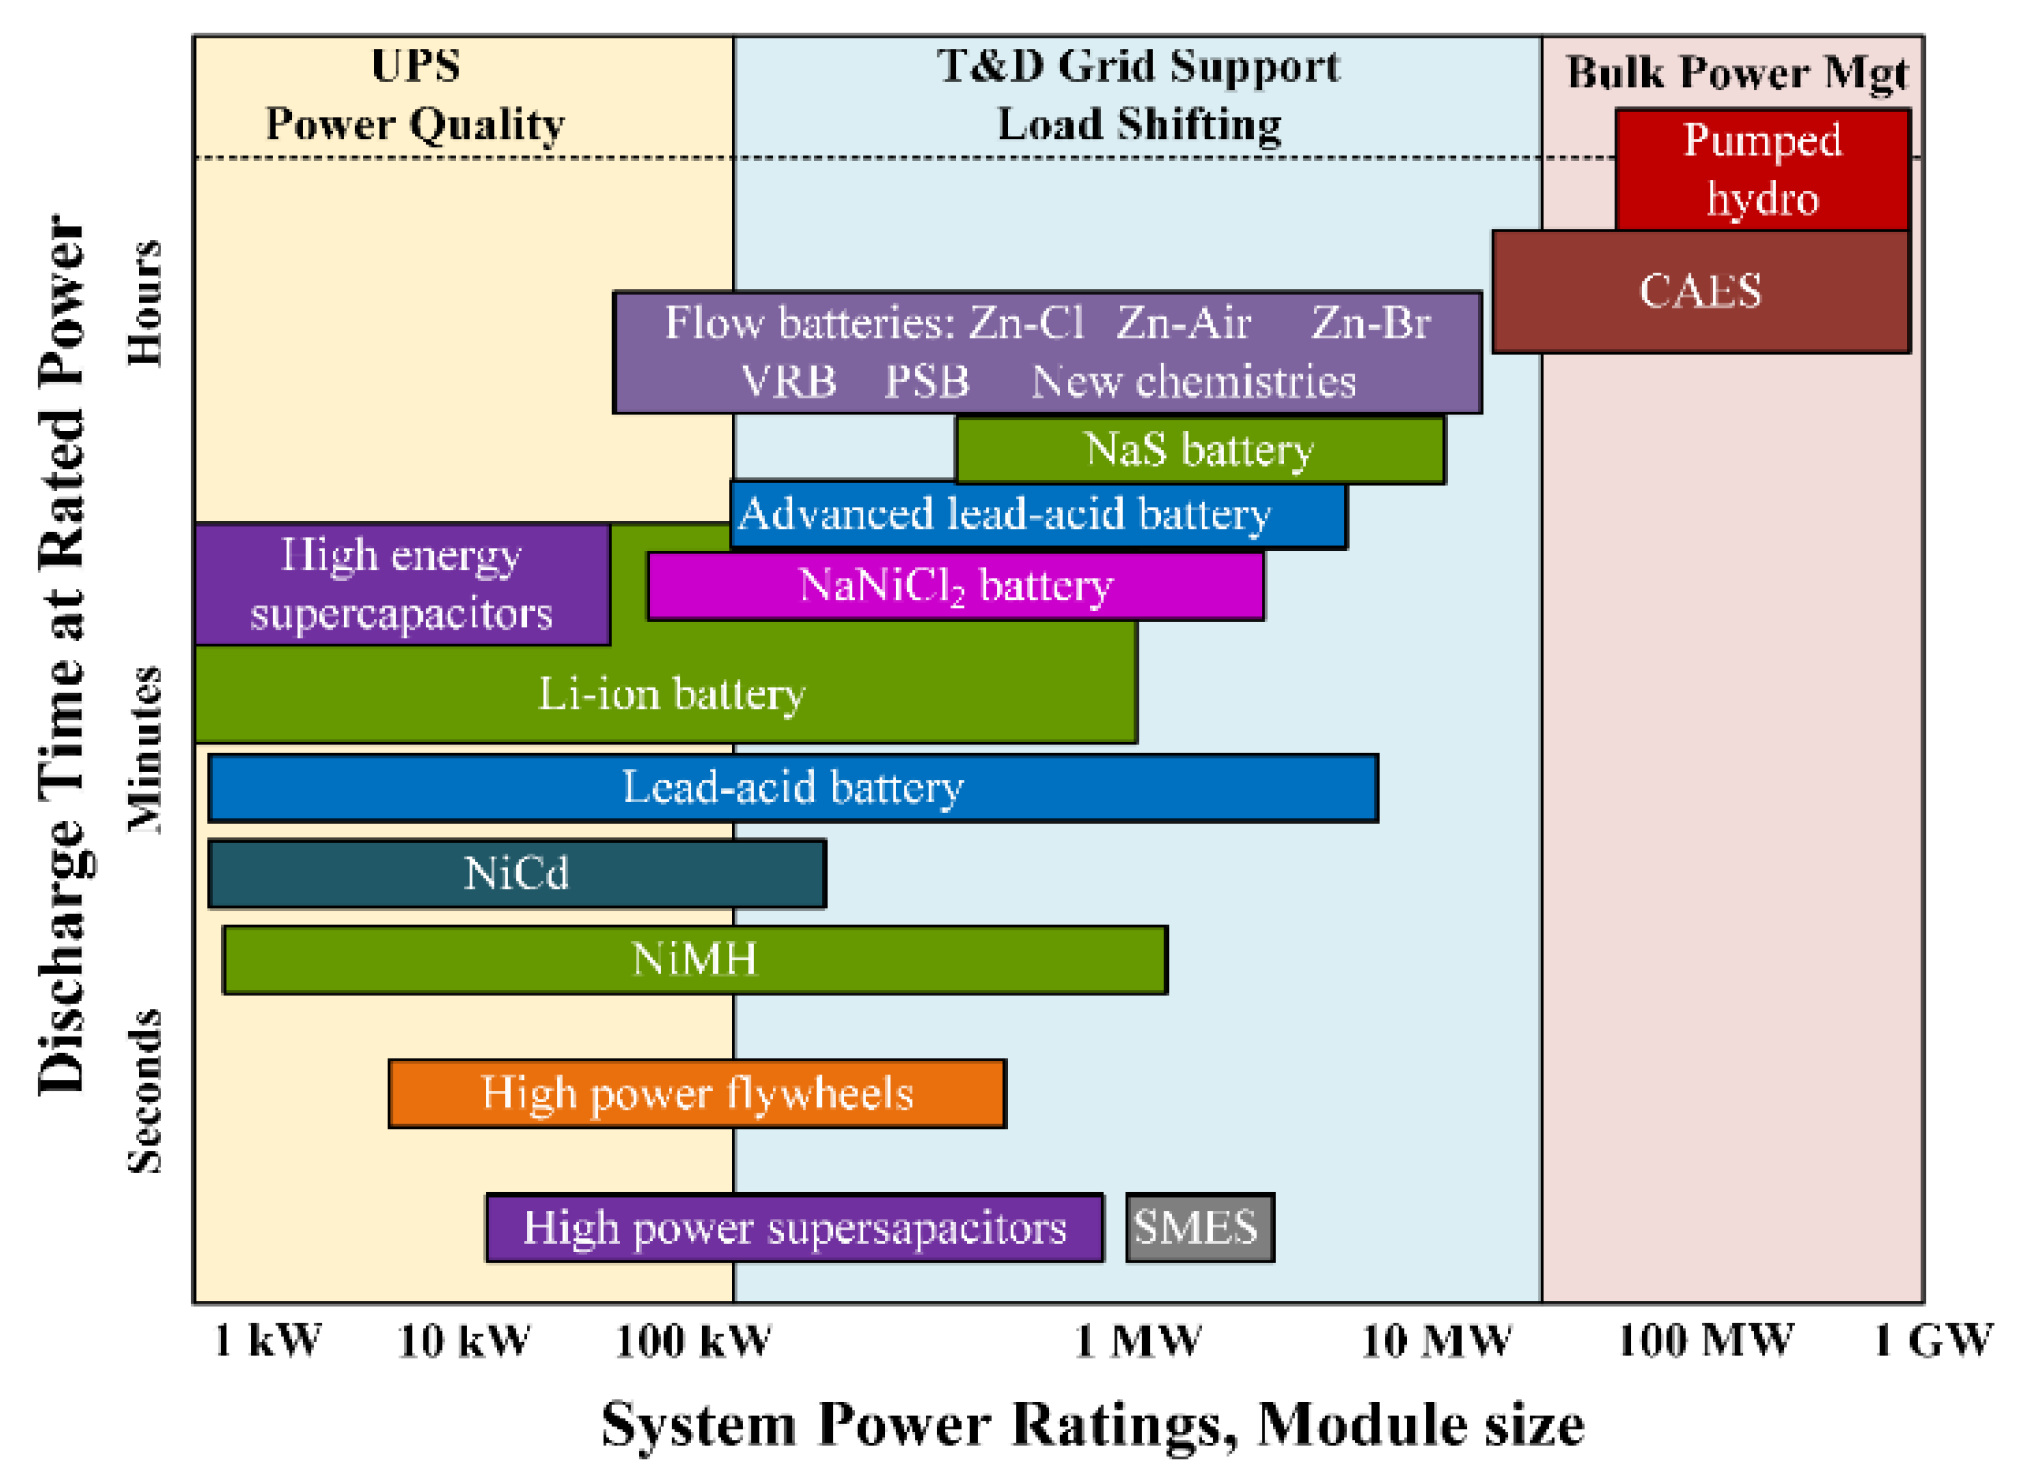
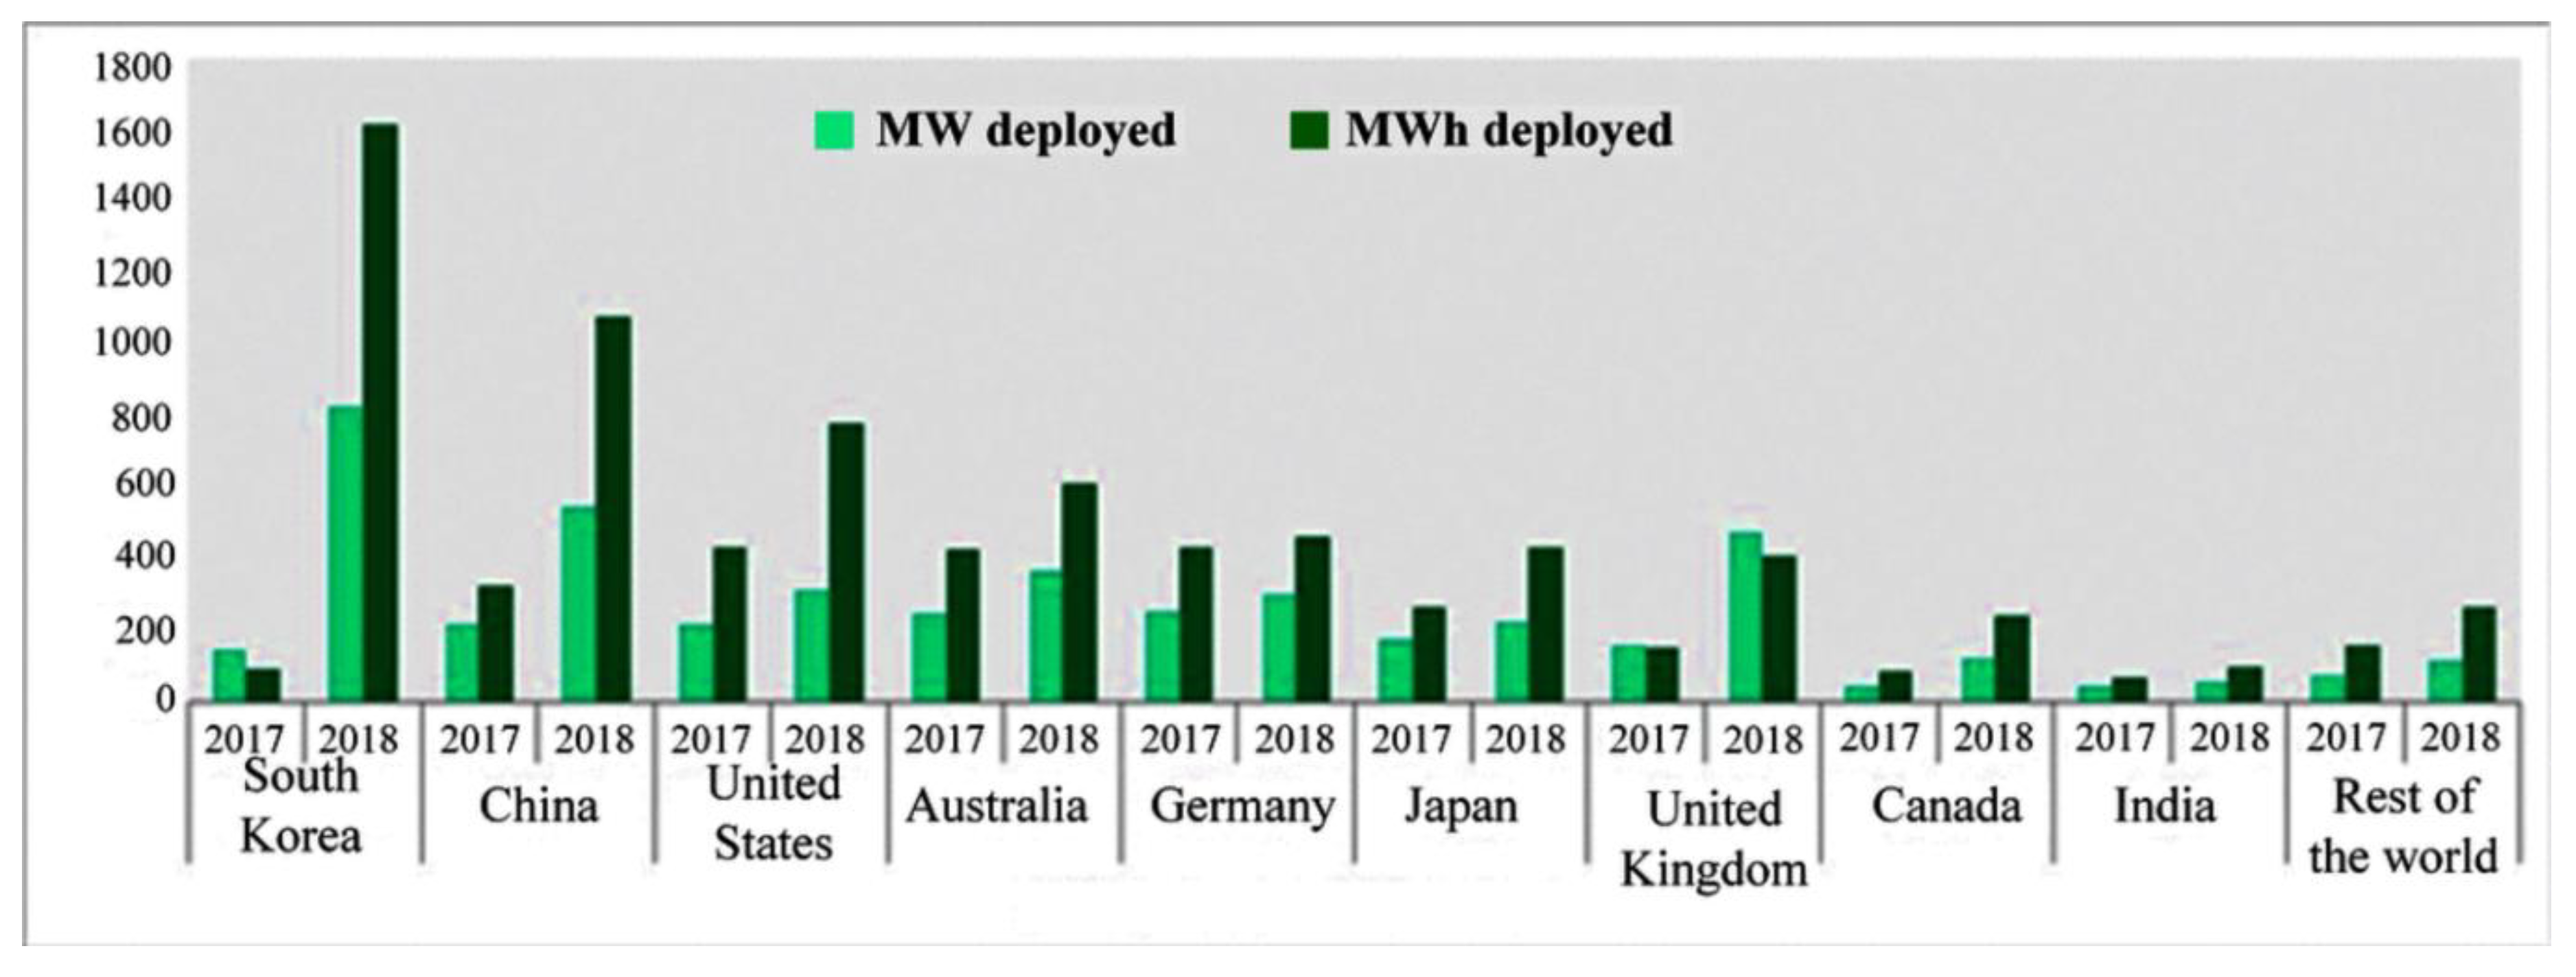
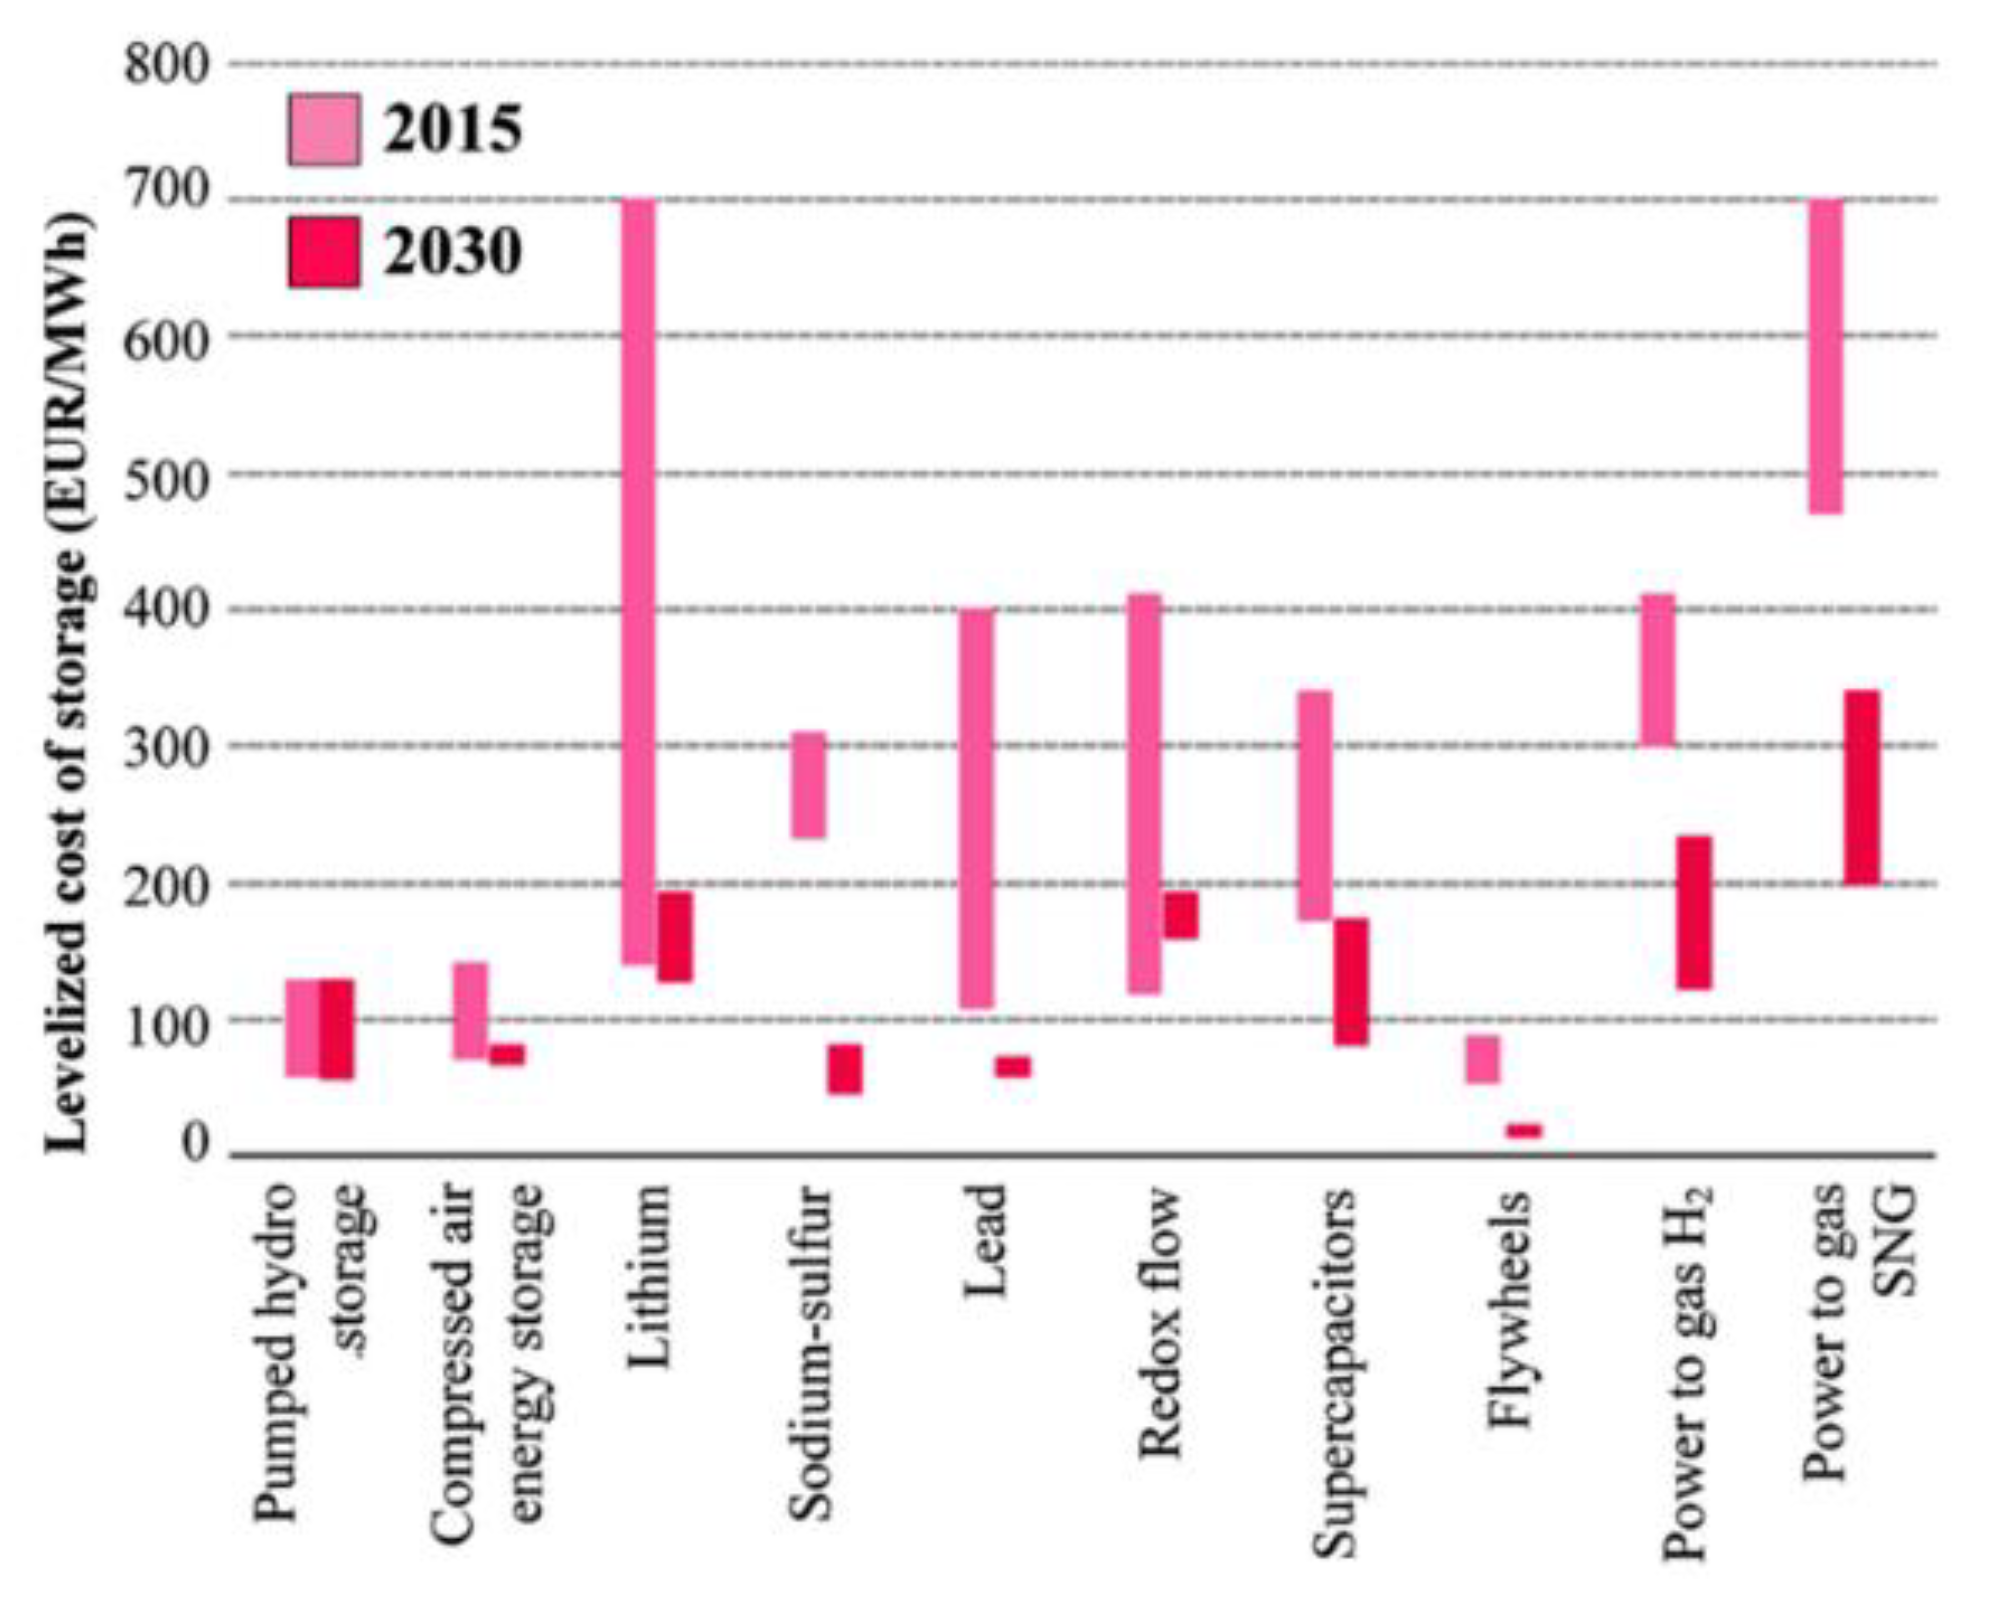
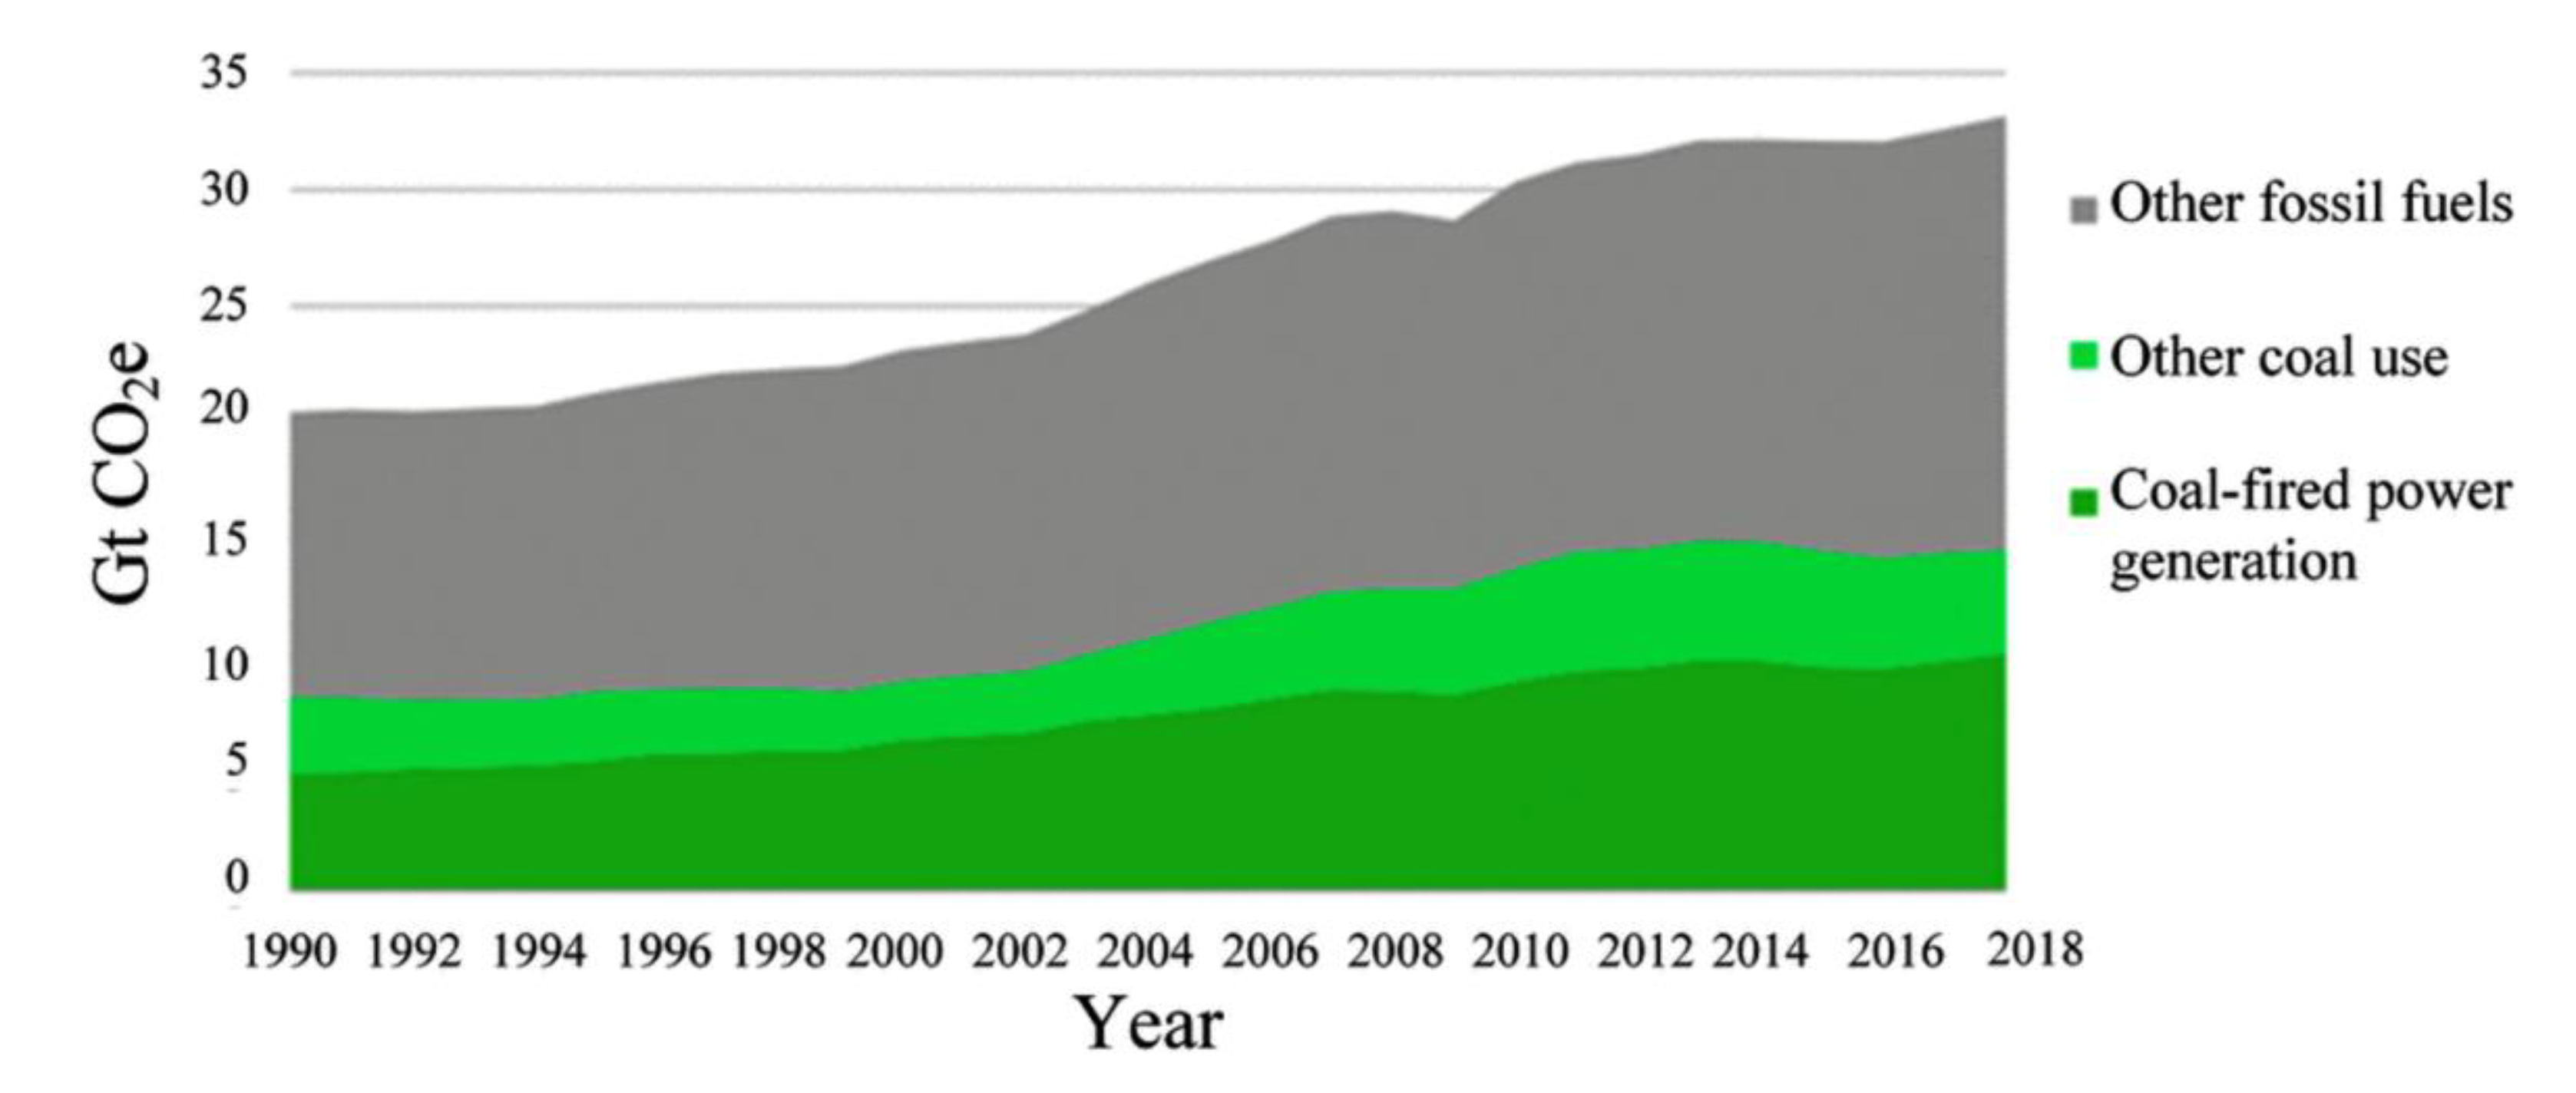
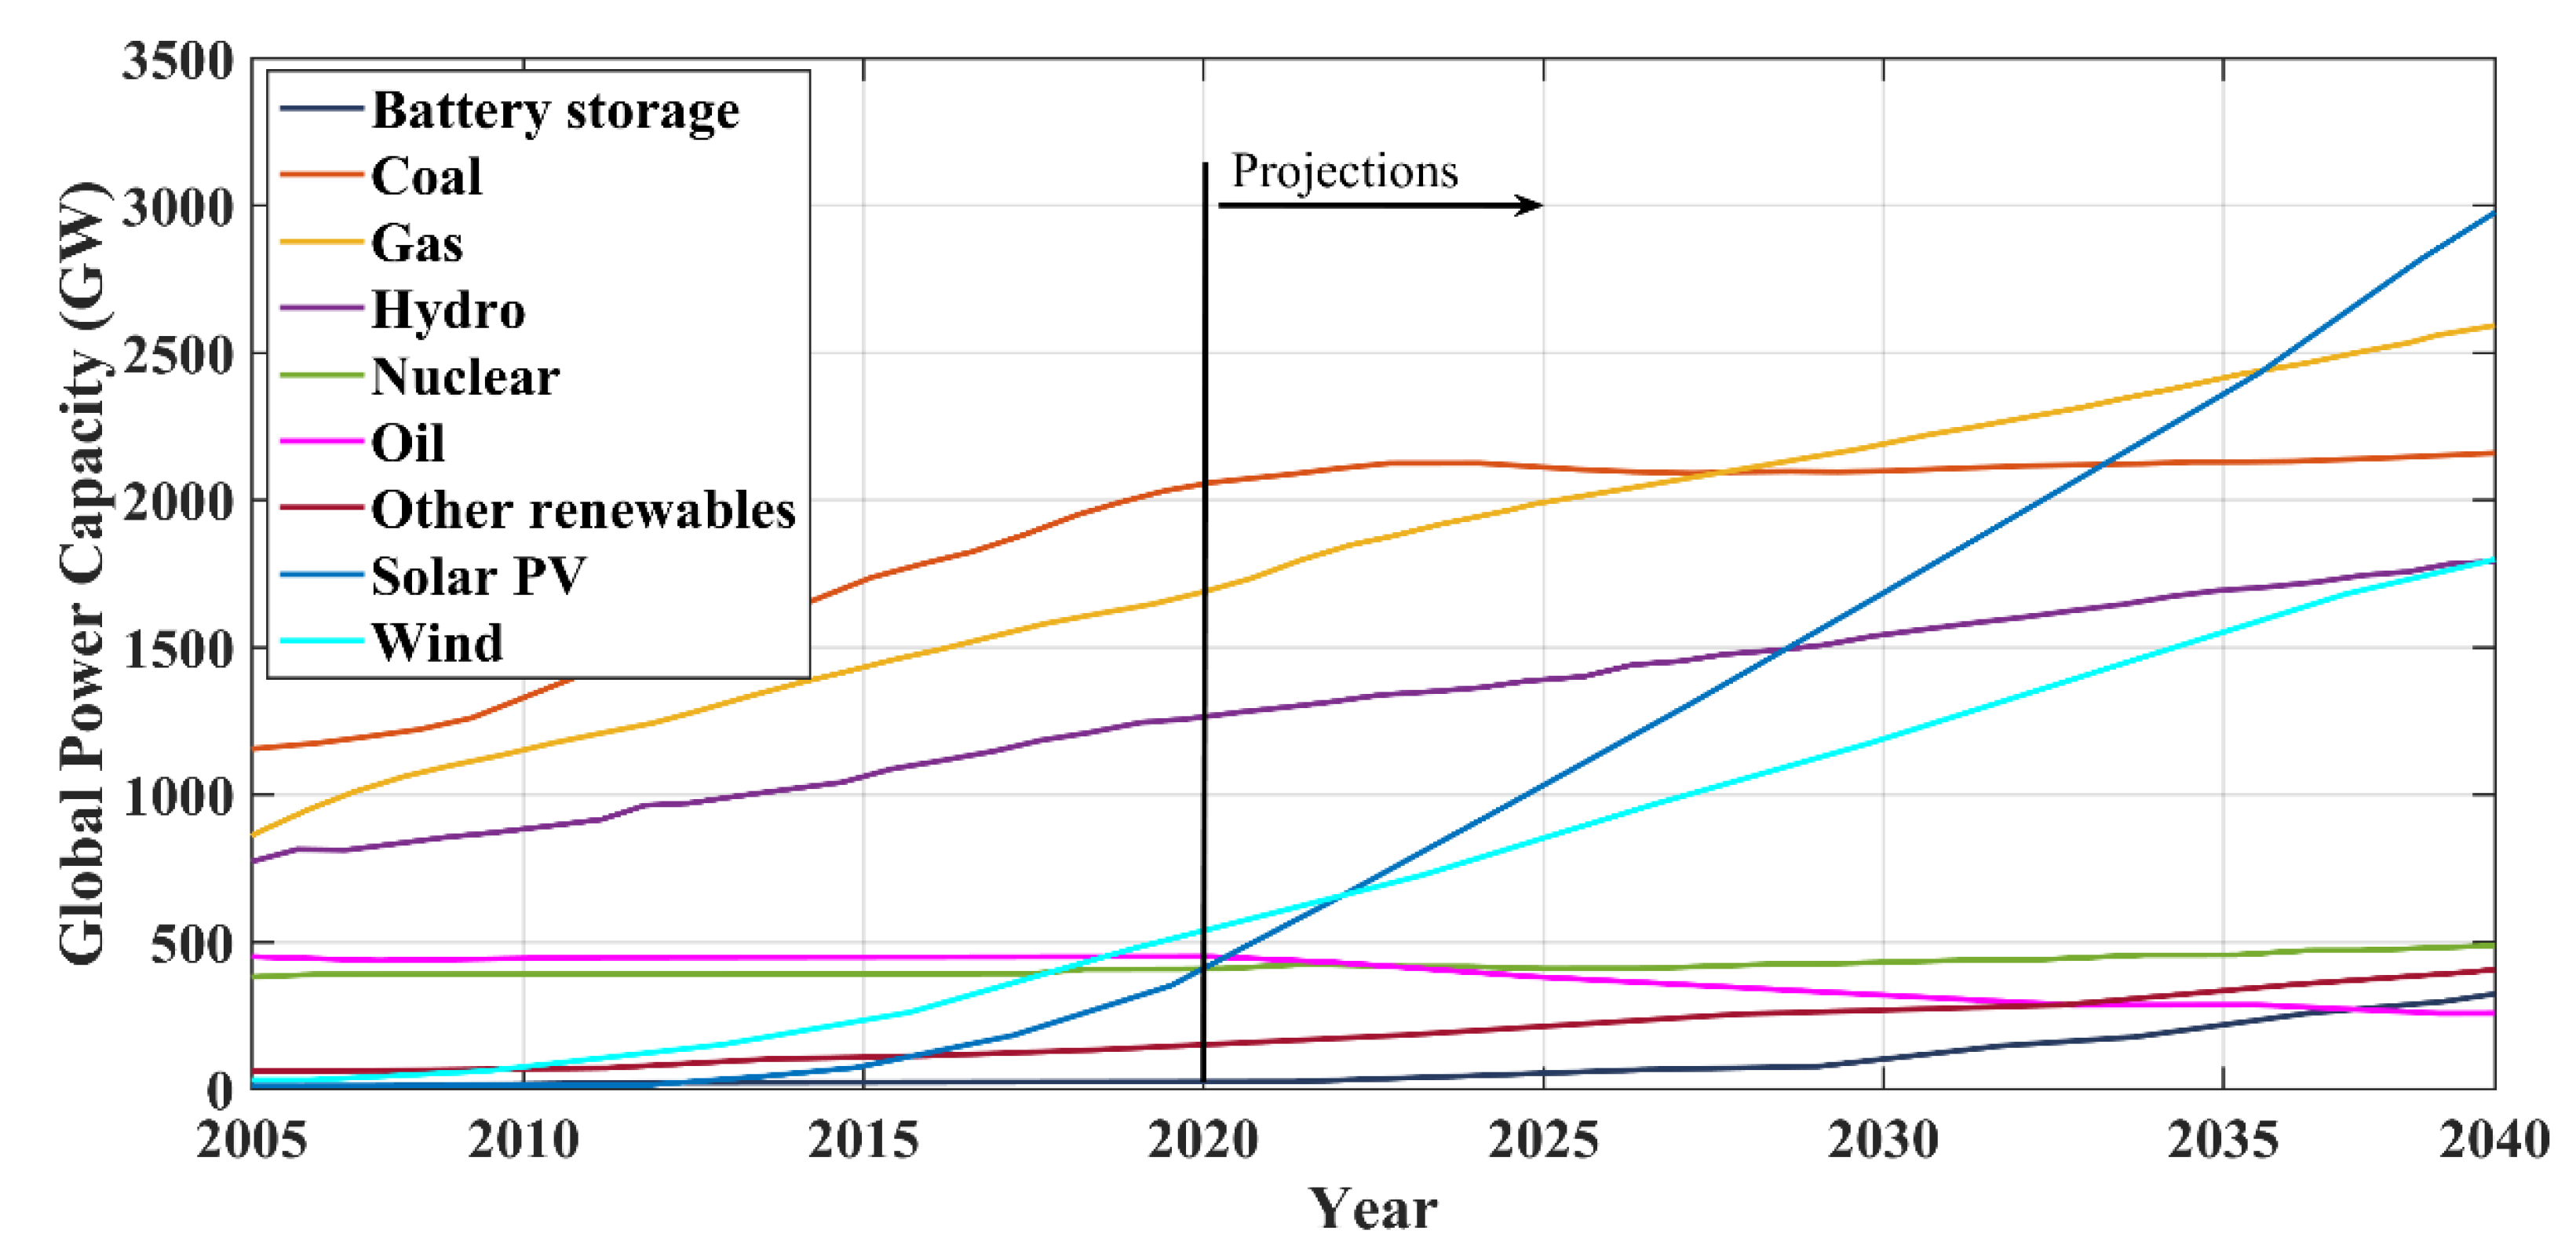
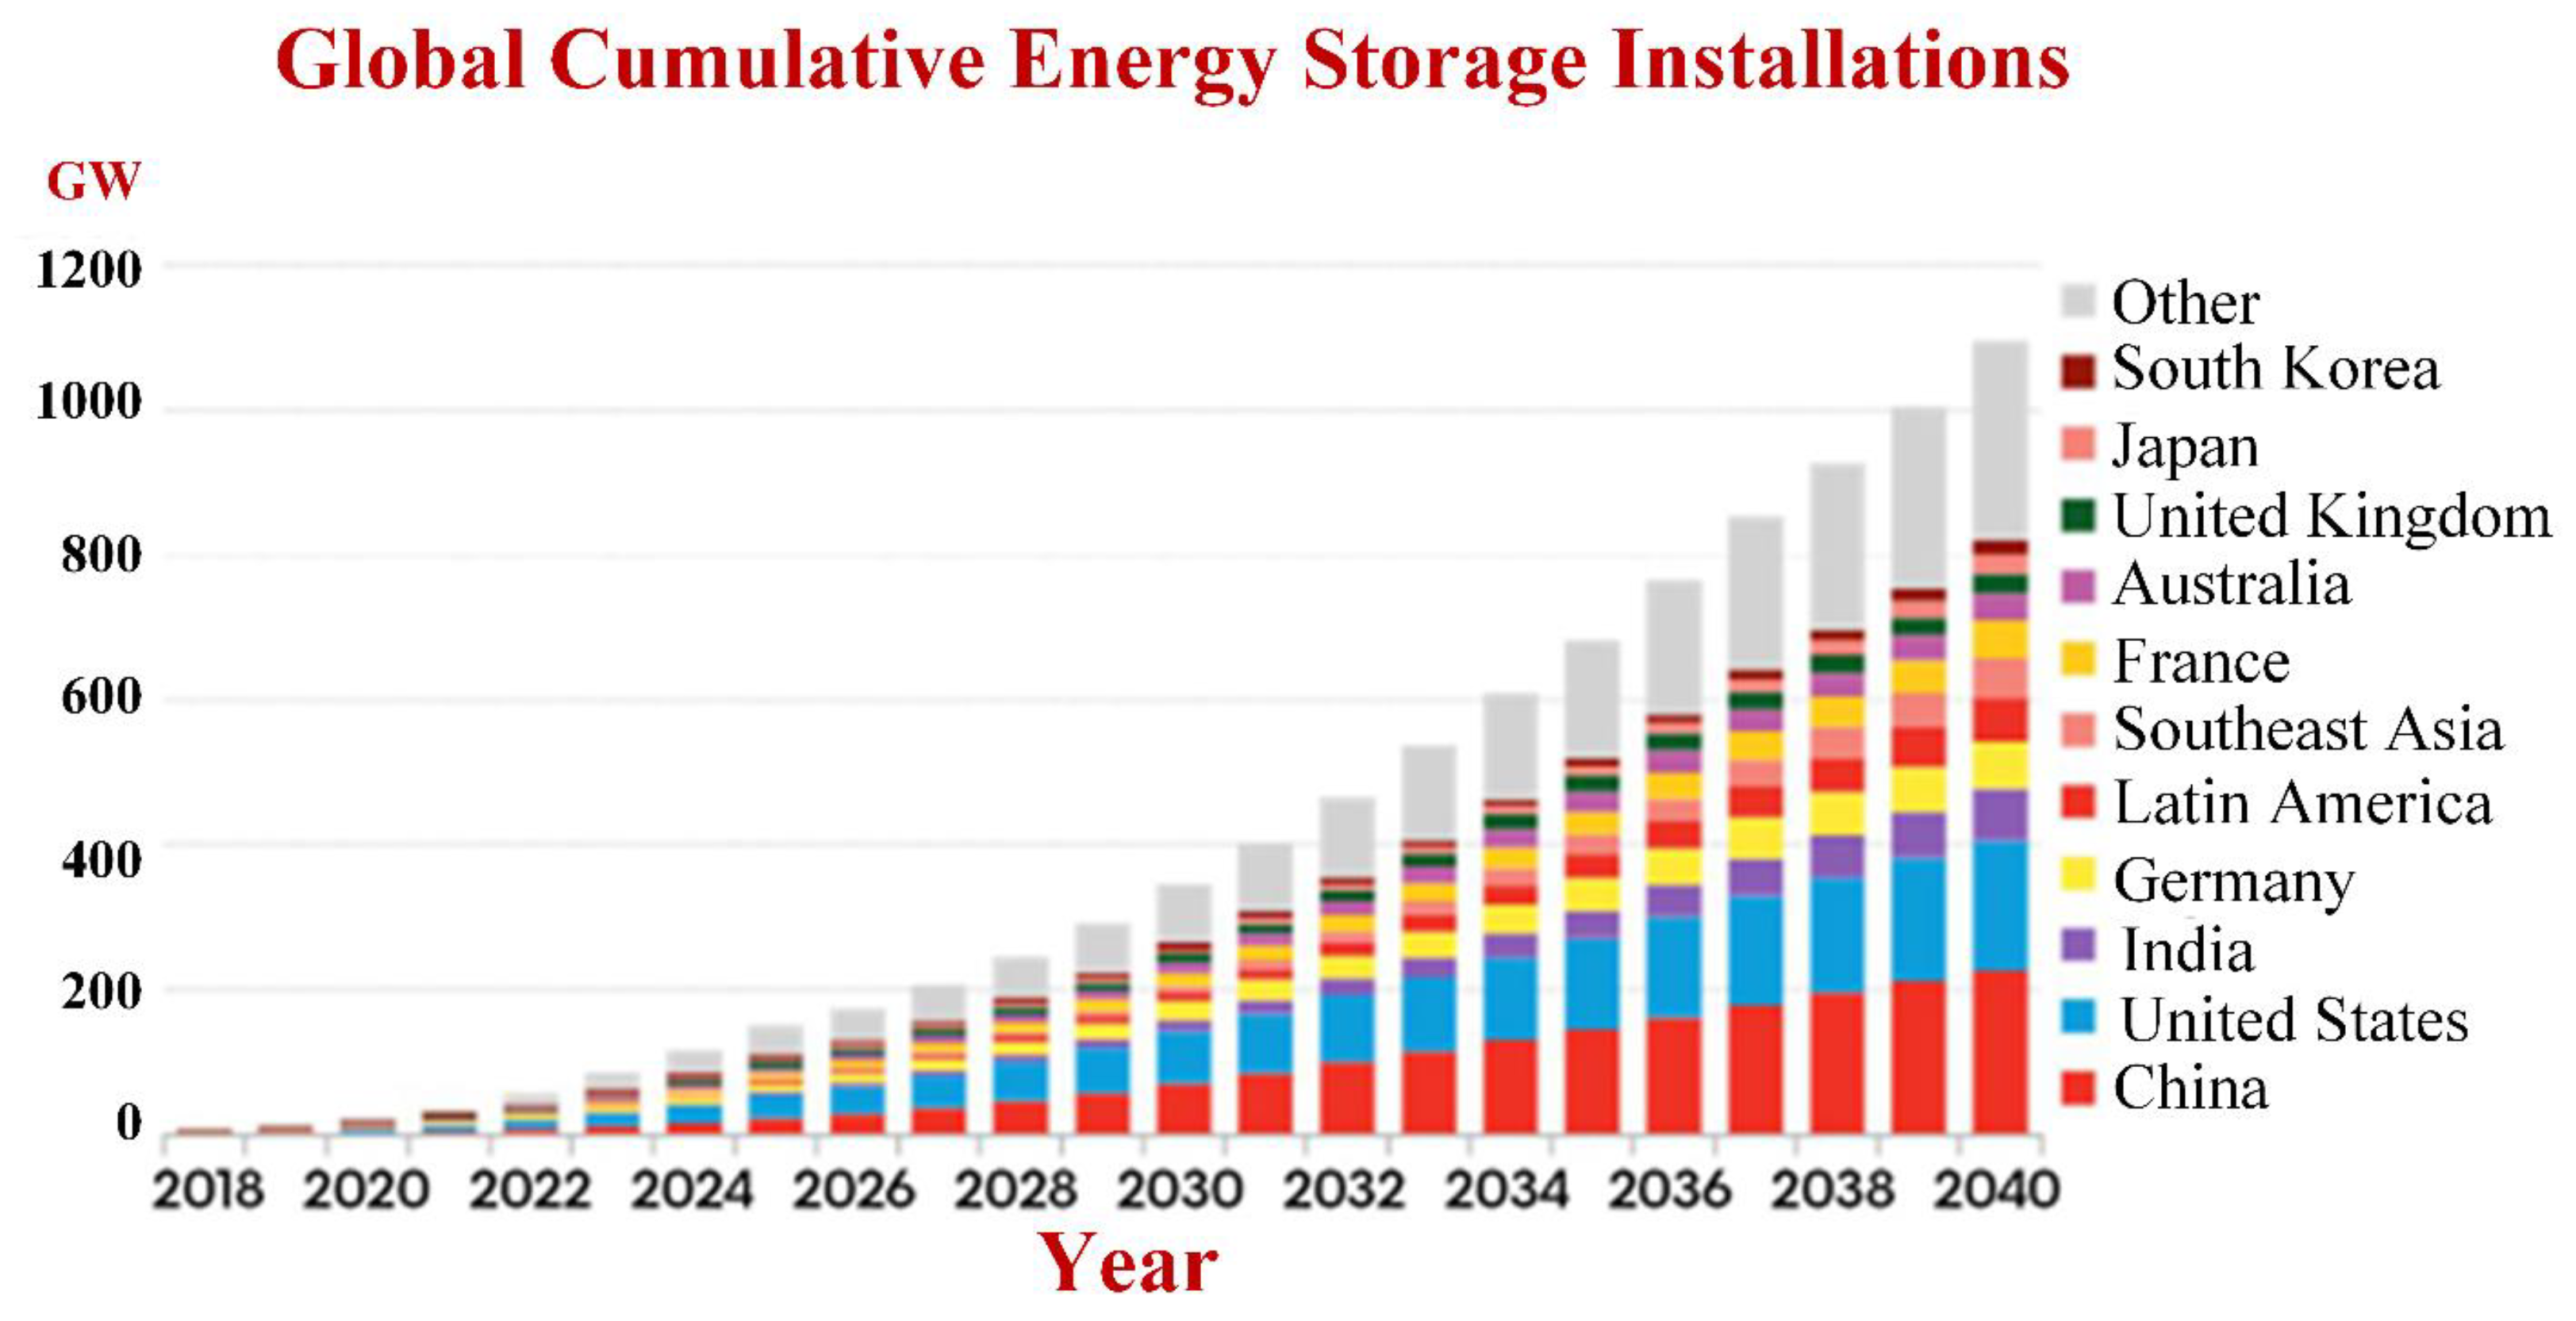
| Year | ESS | Introduction | Reference |
|---|---|---|---|
| Oldest | Bio fuels | Biofuels are in use since ancient times, in the form of wood and other types of solid biomass. | [10] |
| 1839 | Fuel cells | William Grove, a chemist, physicist, and lawyer invented the fuel cell in 1839. | [11] |
| 1859 | Lead acid battery | Invented in 1859 by French physicist Gaston Planté, lead acid battery is the earliest type of rechargeable battery. | [12] |
| 1882 | PHS | In 1882, the world’s first hydroelectric power plant began operating in the United States along the Fox River in Appleton, Wisconsin. | [13] |
| 1883 | FES | The first FES used purely for ES was made of steel. It was developed by John A. Howell in 1883 for military applications. | [14] |
| 1884 | Flow batteries | French engineer Charles Renard invented flow batteries in 1884 to power an airship with an electric propeller. | [15] |
| 1899 | Nickel Cadmium battery | Nickel cadmium battery was invented by Waldemar Jungner in 1899. Further improvements occurred in 1947 which led to the modern sealed NiCd battery. | [16] |
| 1899 | Nickel Zinc battery | Nickel zinc battery was first invented in 1899. Its commercial production started in 1920. | [17] |
| 1901 | Nickel iron battery | The nickel iron battery was developed by Thomas Edison in 1901, and used for electric vehicles, such as the Detroit Electric and Baker Electric | [18] |
| 1960 | Sodium sulphur battery | Sodium Sulphur battery was first discovered by Ford Motor Company in 1960 to power early-model electric cars. | [19] |
| 1967 | Nickel metal hydride battery | Research on nickel-metal-hydride battery started in 1967. | [16] |
| 1968 | Sodium metal halide battery | Also known as ZEBRA batteries, sodium metal halide batteries were first introduced in South Africa in 1968. | [20] |
| 1969 | Super magnetic | SMES was first proposed as a method of diurnal storage in the year 1969. | [21] |
| 1970 | Nickel hydrogen battery | The Nickel-hydrogen battery was developed Comsat laboratories and Tyco laboratories, sponsored by Intelsat. | [22] |
| 1978 | Supercapacitor | Research on supercapacitors began in the 1957 by General Electric Company. Followed by many episodes of development, the supercapacitor was marketed in 1978. | [23] |
| 1978 | CAES | The first utility-scale CAES project was the 290 MW Huntorf plant in Germany using a salt dome, which started in 1978. | [24] |
| 1980 | Li-ion battery | In 1980, American physicist Professor John Goodenough invented Li-ion battery. | [9] |
| 1980 | Li-polymer battery | The discovery of the lithium polymer battery came in the 1980s. The first commercial Li-ion cell was of Sony in 1991. | [25] |
| Newest | Solar fuels | Driven by environmental concerns, solar fuels are recently gaining attention, and are still under research and development. | - |
| Project | Initial Operation | Installed Capacity (MW) | Hours of Storage | Energy Storage (MWh) | Average Gross Head (feet) | Water Conduit Length (feet) | Length to Head Ratio; L/H | Number of Existing Reservoirs/Lakes |
|---|---|---|---|---|---|---|---|---|
| Taum Sauk | 1963 | 350 | 7.7 | 2700 | 809 | 7003 | 8.7 | 0 |
| Yards Creek | 1965 | 330 | 8.7 | 2894 | 723 | 3700 | 5.1 | 0 |
| Muddy Run | 1967 | 855 | 14.3 | 12,200 | 386 | 1290 | 3.3 | 1 |
| Cabin Creek | 1967 | 280 | 5.8 | 1635 | 1159 | 4340 | 3.7 | 0 |
| Seneca | 1969 | 380 | 11.2 | 3920 | 736 | 2520 | 3.4 | 1 |
| Northfield | 1972 | 1000 | 10.1 | 10,100 | 772 | 6790 | 8.8 | 1 |
| Blenheim Gilboa | 1973 | 1030 | 11.6 | 12,000 | 1099 | 4355 | 4.0 | 0 |
| Ludington | 1973 | 1888 | 9.0 | 15,000 | 337 | 1252 | 3.7 | 1 |
| Jocassee | 1973 | 628 | 93.5 | 58,757 | 310 | 1700 | 5.5 | 1 |
| Bear Swamp | 1974 | 540 | 5.6 | 3019 | 725 | 2000 | 2.8 | 0 |
| Raccoon Mountain | 1978 | 1370 | 24.0 | 33,000 | 968 | 3650 | 3.8 | 1 |
| Fairfield | 1978 | 512 | 8.1 | 4096 | 163 | 2120 | 13.0 | 0 |
| Helms | 1984 | 1200 | 118.0 | 14,200 | 1645 | 20,519 | 12.5 | 2 |
| Bath Country | 1985 | 2100 | 11.3 | 23,700 | 1180 | 9446 | 8.0 | 0 |
| Technology | Energy Density (Wh/L) | Power Rating (MW) | Storage Duration | Lifetime (Years) | Discharge Time | Cycling Times (Cycles) |
|---|---|---|---|---|---|---|
| Large CAES | 2–6 | 110 & 290 | Hours–months | 20–40 | 1–24+ hour | 8000–12,000 |
| AA-CAES | 2–6 | 110 & 290 | Hours–months | 20–40 | 1–24+ hour | - |
| LAES | 8–24 | 0.3 & 2.5 | - | 20–40 | 1–12+ hour | - |
| SC-CAES | 8–24 | 110 & 290 | Hours–months | 20–40 | 1–24+ hour | - |
| Small CAES | 2–6 | 0.003 & 3 | Hours–months | 23+ | Up to - hour | Test 30,000 |
| Characteristic | Low-Speed FESS | High-Speed FESS |
|---|---|---|
| Flywheel material | Steel | Composite materials: glass and C fibers |
| Electrical machine | Asynchronous, permanent magnet synchronous and reluctance machines | Permanent magnet synchronous and reluctance machines |
| Integration of electrical machine and flywheel | No or partial integration | Full or partial integration |
| Confinement atmosphere | Partial vacuum or light gas | Absolute vacuum |
| Enclosure weight | 2 flywheel weight | flywheel weight |
| Bearings | Mechanical or mixed (mechanical and magnetic) | Magnetic |
| Main applications | Power quality | Traction and aerospace industry |
| Cost | 1 | 5 |
| Electrode Material | Electrolyte | Specific Capacitance (Fg-1) |
|---|---|---|
| AC | Aqueous (NaOH/KOH) | 200–400 |
| Templated carbon | Aqueous (NaOH/KOH) | 120–350 |
| CNT | Aqueous (NaOH/KOH) | 20–180 |
| Carbide-driven carbon | Ionic liquids (KCl/NaCl) | 100–150 |
| Carbon black | Aqueous (NaOH/KOH) | <300 |
| Carbon Aerogels/xerogels | Aqueous (NaOH/KOH) | 40–200 |
| Graphite and reduced Graphene oxide (rGO) | Tetraethylammonium tetrafluoroborate (Et4NBF4) | 10–150 |
| Mesoporous carbon | KOH | 180 |
| AC fibers | KOH | 180–210 |
| Reduction Half Reaction | Standard Electrode Potential (V) |
|---|---|
| +2.87 | |
| +2.01 | |
| +1.23 | |
| +1.09 | |
| +0.80 | |
| +0.77 | |
| +0.54 | |
| +0.34 | |
| +0.15 | |
| +0.14 | |
| 0.00 | |
| −0.14 | |
| −0.26 | |
| −0.44 | |
| −0.74 | |
| −0.76 | |
| −1.18 | |
| −2.71 | |
| −3.04 |
| Property | Deep Cycle Flooded | Deep Cycle AGM | Deep Cycle Gel |
|---|---|---|---|
| Maintenance | Needed | Not needed | Not needed |
| Cost | Lowest | Low | Highest |
| Cycle Life | Excellent | Good | Good |
| Shipping | Hazardous | Non-hazardous | Non-hazardous |
| Temperature Range | Wide | Wide | Wide |
| Set Points | Generic | Special | Special |
| Self-Discharge Rate | High | Low | Low |
| Vibration/Shock Resistance | Excellent | Good | Good |
| Recyclability/Infrastructure | Good | Good | Good |
| Discharge Currents | Wide range | Wide range | Small |
| Charge Currents | Wide range | Wide range | Small |
| Applications | Wide range of power applications | High power/fast charge | Low power applications only |
| Float Characteristics | Not good for float or standby applications | Excellent float characteristics | Good for float applications |
| Type of Lithium Ion (Li-ion) Battery | Lithium Cobalt Oxide | Lithium Manganese Oxide | Lithium Nickel Manganese Cobalt Oxide | Lithium Iron Phosphate | Lithium Nickel Cobalt Aluminum Oxide | Lithium Titanate |
|---|---|---|---|---|---|---|
| Available since | 1991 | 1996 | 2008 | 1996 | 1999 | 2008 |
| Short Form | LCO or Li-cobalt | LMO or Li-manganese (spinel structure) | NMC | LFP or Li-phosphate | NCA or Li-aluminum | LTO or Li-titanate |
| Cathode | LiCoO2 (60% Co) | LiMn2O4 | LiNiMnCoO2 | LiFePO4 | LiNiCoAlO2 | LiMnO2 or LiNiMnCoO2 |
| Anode | Graphite | Graphite | Graphite | Graphite | Graphite | Li4Ti5O12 (titanate) |
| Voltages | 3.6 V nominal; typical operating range: 3–4.2 V/cell | 3.7 (3.8) V nominal; typical operating range: 3–4.2 V/cell | 3.6 V, 3.7 V nominal; typical operating range: 3–4.2 V/cell or higher | 3.2 V, 3.3 V nominal; typical operating range: 2.5–3.65 V/cell | 3.6 V nominal; typical operating range: 3–4.2 V/cell | 2.4 V nominal; typical operating range: 1.8–2.85 V/cell |
| Specific Energy (Capacity) | 150–200 Wh/kg; Specialty cells provide upto 240 Wh/kg | 100–150 Wh/kg | 150–220 Wh/kg | 90–120 Wh/kg | 200–260 Wh/kg; 300 Wh/kg predictable | 50–80 Wh/kg |
| Charge (C-rate) | 0.7–1 C, charges to 4.2 V (most cells); 3 h charge typical. Charge current above 1 C shortens battery life. | 0.7–1 C typical; 3 C maximum; charges to 4.2 V (most cells) | 0.7–1 C, charges to 4.2 V, some go to 4.3 V, 3 h charge typical. Charge current above 1 C shortens battery life. | 1 C typical; charges to 3.65 V; 3 h charge time typical | 0.7 C; charges to 4.2 V (most cells); 3 h charge typical; fast charge possible with some cells | 1 C typical; 5 C maximum; charges to 2.85 V |
| Discharge (C-rate) | 1 C; 2.5 V cut-off. Discharge current above 1 C shortens battery life. | 1 C; 10 C possible with some cells; 30 C pulse (5 s), 2.5 V cut-off | 1 C; 2 C possible on some cells; 2.5 V cut-off | 1 C; 25 C possible on some cells; 40 A pulse (2 s), 2.5 V cut-off (lower than 2 V causes damage) | 1 C typical; 3 V cut-off; high discharge rate shortens battery life | 100 C possible, 30 C 5 s pulse; 1.8 V cut-off on LCO/LTO |
| Cycle life | 500–1000, related to depth of discharge, load, temperature. | 300–700 (related to depth of discharge, temperature) | 1000–2000 (related to depth of discharge, temperature) | 1000–2000 (related to depth of discharge, temperature) | 500 (related to depth of discharge, temperature) | 3000–7000 |
| Thermal runaway | 150 °C (302 oF). Full charge promotes thermal runaway. | 250 °C (482 oF). High charge promotes thermal runaway. | 210 °C (410 oF). High charge promotes thermal runaway. | 270 °C (518 oF). Very safe battery even if fully charged. | 150 C or 3020F typical; high charge promotes thermal runaway | One of the safest Li-ion batteries |
| Cost | ~450$/kWh [98] | ~650$/kWh (as per 2014 data) [99] | ~420$/kWh (Source: RWTH Aachen) | ~580$/kWh (Source: RWTH Aachen) | ~350$/kWh (Source: RWTH Aachen) | ~1005$/kWh (Source: RWTH Aachen) |
| Applications | Mobile phones, tablets, laptops, cameras | Power tools, medical devices, electric powertrains | e-bikes, medical devices, EVs, industrial | Portable and stationary needing high load currents and endurances | Medical devices, industrial, electric powertrains (Tesla) | UPS, electric powertrain (Mitsubishi i-MiEV, Honda Fit EV), solar powered street lighting |
| Comments | Very high specific energy, limited specific power; Cobalt is expensive; Used as energy cells; Market share has stabilized. | High power but less capacity; Safer than Li-Cobalt; Commonly mixed with NMC to improve performance. | Provides high capacity and high power; Serves as hybrid cell; Favorite chemistry for many uses; Market share is increasing. | Very flat voltage discharge curve but low capacity; one of the safest Li-ions; Used for special markets; Elevated self-discharge. | Shares similarities with Li-cobalt. Serves as energy cell. | Long-life, fast-charge, wide temperature range; but low specific energy and expensive; among safest Li-ion batteries |
| 2019 Update | Early version; no longer relevant | Less relevant now; limited growth potential | Leading system; dominant cathode chemistry | Used primarily for energy storage; moderate growth | Mainly used by Panasonic and Tesla; growth potential | Ultra-fast charging ability; high cost limits special applications |
| Battery | Theoretical Specific Energy (kWh/kg) | Practical Specific Energy (kWh/kg) | Demonstrated Rechargeability | Calculated Open Circuit Voltage (V) | Advantages | Challenges |
|---|---|---|---|---|---|---|
| Fe-air | 1.2 | 0.7 | Yes | 1.3 | Approaching peak efficiency | Corrosion, easily changeable oxidation states, potentially cost prohibitive |
| Zn-air | 1.3 | 0.7–0.9 | Yes | 1.65 | Cost efficiency, approaching peak efficiency, long life-times probable, mutuality | Dendrite formation at Zn anode, air cathode materials need improvement, zincate supersaturation |
| Na-air | 2 | N/A * | No | 2.3 | Cost effective, mutuality | Cell maintenance requires high temperature, room temperature operation needs alternative solvents (ionic liquids, etc.), more effective air catalysts needed |
| Mg-air | 6.8 | N/A * | No | 2.93 | High theoretical specific energy, high working voltage | Any aqueous exposure results in corrosion, potentially expensive solvents, more effective air catalysts needed |
| Al-air | 8 | 0.4–1.8 | No | 1.2 | High theoretical specific energy, high working voltage, mutuality | Reactive in alkaline electrolyte causing electrode degradation, more effective air catalysts needed |
| Li-air | 12 | 0.9–5 | No | 2.91 | High theoretical specific energy, high working voltage | Multiple catalysts needed to control reactions on peroxide side, dendrite formation at Li electrode, pure Li presently required, high cost, more effective air catalysts needed |
| Battery | Cell Voltage (V) | Specific Energy (Wh/kg) | Specific Power (W/kg) | Energy Efficiency (%) |
|---|---|---|---|---|
| Nickel-iron | 1.2 | 30–60 | 100 | 60–70 |
| Nickel cadmium | 1.2 | 50–60 | 200 | 70–75 |
| Nickel-zinc | 1.65 | 80–100 | 170–1000 | 70–80 |
| Nickel-metal hydride | 1.2 | 60–70 | 170–1000 | 70–80 |
| Nickel-hydrogen | 1.55 | 55–75 | 220 | 85 |
| Electrode Material | Electrolyte | Specific Capacitance F/g |
|---|---|---|
| RuO2 | H2SO4 | 650–735 |
| MnO2 | K2SO4 | 261 |
| Ni(OH)2 | KOH | 578 |
| MnFeO2 | PF6 (Hexafluorophosphate) | 126 |
| TiN | KOH | 238 |
| V2O5 | KCl | 262 |
| Polyaniline (PANI) | Aqueous | 120–1530 |
| Non-Aqueous | 100–670 | |
| Polypyrrole (PPy) | Aqueous | 40–588 |
| Non-Aqueous | 20–355 | |
| Polythiophene (PTh) | Non-Aqueous | 1.5–6 |
| Poly(3-methyl thiophene) (PMT) | Non-Aqueous | 20–220 |
| Ionic liquid | 15–225 | |
| Poly(3,4-ethylenedioxythiophene) (PEDOT) | Aqueous | 100–250 |
| Non-Aqueous | 121 | |
| Ionic liquid | 130 | |
| Poly(4-fluorophenyl-3-thiophene) (PFPT) | Non-Aqueous | 10–48 |
| Electrode | Electrolyte | Specific Capacitance (F/g) |
|---|---|---|
| Carbon/rGO | Na2SO4 | 175–430 |
| RuO2/MWCNT | H2SO4 | 169.4 mF/cm |
| MnO2/MWCNT | Na2SO4 | 141 |
| MnO2/CNTA | Na2SO4 | 144 |
| rGO/MnO2 | Na2SO4 | 60 |
| PAN/Carbon nanofibers | KOH | 134 |
| PANI/MWCNT | H2SO4 | 360 |
| PPY/MWCNT | H2SO4 | 200 |
| PANI nanotubes/Titanium nanotubes | H2SO4 | 740 |
| Country | Production (Thousand Barrels/Day) | Share in World’s Total Biofuel Production in 2018 (%) |
|---|---|---|
| USA | 1190.2 | 45.5 |
| Brazil | 693.2 | 26.5 |
| Germany | 75.8 | 2.9 |
| Argentina | 70.6 | 2.7 |
| China | 68 | 2.6 |
| Technology | Energy Density (Wh/L) | Power Density (W/L) | Specific Energy (Wh/kg) | Specific Power (W/kg) | Rated Energy Capacity (MWh) | Power Rating (MW) |
|---|---|---|---|---|---|---|
| PHS | 0.5–2 | 0.5–1.5 | 0.5–1.5 | - | 180–8000 | 30–5000 |
| Large Scale CAES | 2–6 | 0.5–2 | 30–60 | - | 580–2860 | 110–1000 |
| Overground Small CAES | Higher than large scale CAES | Higher than large scale CAES | 140 at 300 bar | - | 0.0083–0.01 | 0.003–10 |
| Flywheel | 20–80 | 1000–5000 | 5–100 | 400–1500 | 0.0052–5 | 0.25–20 |
| Lead Acid | 50–80 | 10–400 | 25–50 | 75–300 | 0.001–40 | 0–40 |
| Li-ion | 200–500 | 1500–10,000 | 75–200 | 150–2000 | 0.004–10 | 0–100 |
| Na-S | 150–300 | 140–180 | 100–240 | 90–230 | 0.4–244.8 | <34 |
| NiCd | 15–150 | 80–600 | 45–80 | 150–300 | 6.75 | 0–40 |
| VRB | 16–35 | ~<2 | 10–30 | 166 | <60 | 0.03–50 |
| ZnBr | 30–65 | ~<25 | 30–80 | 100; | 0.05–4 | 0.05–10 |
| PSB | 20–30 | ~<2 | ~15–30 | - | Upto 120 | 0.004–15 |
| Capacitor | 0.05–10 | 100,000+ | 0.05–5; <~0.05 | ~100,000, >~3000–107 | - | 0–0.05 |
| Supercapacitor | 10–30 | 100,000+ | 0.05–15 | 500–10,000 | 0.0005 | 0–0.3 |
| SMES | 0.2–6 | 1000–4000; ~2500 | 0.5–5; 10–75 | 500–2000 | 0.0008–0.015 | 0.1–10 |
| Solar fuel | 500–10,000 | - | 800–100,000 | - | - | 0–20 |
| Hydrogen Fuel Cell | 500–3000 | 500+ | 800–10,000 | 5–800 | 0.312–39 | <58.5 |
| TES | 80–500 | - | 80–250 | 10–30 | - | 0.1–300 |
| Liquid Air Storage | 4–6 times than CAES at 200 bar | - | 214 | - | 2.5 | 0.3–200 |
| Technology | Daily Self-Discharge (%) | Lifetime (Years) | Cycling Times (Cycles) | Discharge Efficiency (%) | Cycle Efficiency (%) | Response Time |
|---|---|---|---|---|---|---|
| PHS | Very small | 40–60 | 10,000–30,000 | 87 | 70–87 | Minutes |
| Large Scale CAES | Very small | 20–40 | 8000–12,000 | 70–79 | 42–54; AA-CAES: 70 | Minutes |
| Overground Small CAES | Very small | 23+ | 30,000 | 75–90 | - | Seconds–Minutes |
| Flywheel | >20% per hour | 15–20 | 20,000 | 90–93 | 90–95 | Seconds |
| Lead Acid | >0.3 | 5–15 | 21,000 | 85 | 63–90 | Milli-seconds |
| Li-ion | >1 | 14–16 | 200–1800 | 85 | 75–97 | Milli-seconds |
| Na-S | Almost zero | 10–20 | 2500–4500 | 85 | 75–90 | Milli-seconds |
| NiCd | >0.6 | 15–20 | 2000–3500 | 85 | 60–83 | Milli-seconds |
| VRB | Very small | 10–20 | 12,000 | 75–82 | 65–85 | >1/4 cycle |
| ZnBr | Small | 5–10 | 1500–2000 | 60–70 | 65–80 | >1/4 cycle |
| PSB | Almost zero | 10–15 | - | - | 60–75 | 20 Milliseconds |
| Capacitor | ~50 in 15 min | 1–10 | 5–50,000 | 75–90 | 60–70 | Milliseconds |
| Supercapacitor | ~20–30 | 10–30 | 100,000+ | 95–98 | 84–97 | Milliseconds |
| SMES | 10–15 | 20–30 | 100,000 | 95 | 95–98 | Milliseconds |
| Solar fuel | Almost zero | - | - | - | 20–50 | - |
| Hydrogen Fuel Cell | Almost zero | ~20 | 20,000 | 59 | 20–66 | Seconds |
| TES | >1 | 20–30 | - | - | 30–60 | Minutes |
| Liquid Air Storage | Small | 25+ | - | - | 55–80 | Minutes |
| Technology | Suitable Storage Duration | Discharge Time at Rated Power | Power Capital Cost ($/kW) | Energy Capital Cost ($/kWh) | Operating and Maintenance Cost | Maturity |
|---|---|---|---|---|---|---|
| PHS | Hours–months; long term | 1–24 h | 2000–4300 | 5–100 | ~3 $/kW/year; 0.004 $/kWh | Mature |
| Large Scale CAES | Hours–months; long term | 1–24 h | 400–1000 | 2–120 | 19–25 $/kW/year; 0.003 $/kWh | Developed |
| Overground Small CAES | Hours–months; long term | 30 s–40 min; 3 h | 517–1550 | 200–250 | Very low | Developed |
| Flywheel | Seconds–minutes; short term | 8 s–15 min | 250–350 | 1000–14,000 | ~20 $/kW/year; 0.004 $/kWh | Commercialized |
| Lead Acid | Minutes–days; short to medium term | Seconds–hours | 200–600 | 50–400 | ~50 $/kW/year | Mature |
| Li-ion | Minutes–days; short to medium term | Minutes–hours | 900–4000 | 600–3800 | - | Commercialized |
| Na-S | Long term | Seconds–hours | 350–3000 | 300–500 | ~80 $/kW/year | Commercialized |
| NiCd | Minutes–days; short and long term | Seconds–hours | 500–1500 | 400–2400 | ~20 $/kW/year | Mature |
| VRB | Hours–months; long term | Seconds–hours | 600–1500 | 150–1000 | ~70 $/kW/year | Developing |
| ZnBr | Hours–months; long term | Seconds–hours | 200–2500 | 150–1000 | - | Demonstration |
| PSB | Hours–months; long term | Seconds–hours | 700–2500 | 150–1000 | - | Developing |
| Capacitor | Seconds–hours | Milliseconds–1 h | 200–400 | 500–1000 | 13 $/kW/year; <0.05 $/kWh | Commercialized |
| Supercapacitor | Seconds–hours; short term | Milliseconds–1 h | 100–450 | 300–2000 | 0.005 $/kWh; ~6 $/kW/year | Developing |
| SMES | Minutes–hours; short term | Milliseconds–30 min | 200–489 | 500–72,000 | 18.5 $/kW/year; 0.001 $/kWh | Early commercialized |
| Solar fuel | Hours–months | 1–24 h | - | - | - | Developing |
| Hydrogen Fuel Cell | Hours–months | Seconds–24 h | 500–3000 | 2–15 | 0.0019–0.0153 $/kW | Developing |
| TES | Minutes–months | 1–24 h | 100–400 | 3–60 | - | Early commercialized |
| Liquid Air Storage | Long term | Several hours | 900–1900 | 260–530 | - | Developing |
| Regions | Project Name | Storage System Technology | Location | Rated Capacity | Services | Applications | Status | Dates | Reference |
|---|---|---|---|---|---|---|---|---|---|
| USA | UCI Microgrid: Thermal Storage | Chilled Water Thermal Storage | Irvine, California, United States | 6590 kW | Ancillary service | Electric Bill Management | Operational | 1993–-Present | [237] |
| Texas Instruments Manufacturing Plant | Chilled Water Thermal Storage | Dallas, Texas, United States | 6400 kw | Ancillary services | Electric Bill Management, Electric Energy Time Shift | Operational | 1989–-Present | [237] | |
| Riverside Public Utilities 5 MW Ice Energy Project | Ice Thermal Storage | Riverside, California, United States | 5000 kw | Ancillary services | Electric Energy Time Shift, Renewables Energy Time Shift, Stationary Transmission/Distribution Upgrade Deferral | Announced | 2016 | [237] | |
| Los Angeles Community College District - Calmac | Ice Thermal Storage | Los Angeles, California, United States | 4620 kw | Ancillary services |
Electric Bill Management, Electric Energy Time Shift, Electric Supply Reserve Capacity - Non-Spinning | Operational | 2008–-Present | [237] | |
| Raccoon Mountain Pumped Storage Plant | Open-loop Pumped Hydro Storage | Chattanooga, Tennessee, United States | 1,652,000 kW | Ancillary service | Electric Energy Time Shift, Electric Supply Capacity | Operational | 1978 | [237] | |
| Ludington Pumped Storage | Open-loop Pumped Hydro Storage | Ludington, Michigan United States | 1,872,000 kW | Ancillary service | Electric Energy Time Shift, Electric Supply Capacity, Electric Supply Reserve Capacity—Spinning, Load Following (Tertiary Balancing) | Operational | 1973 | [237] | |
| Castaic Pumped-Storage Plant | Open-loop Pumped Hydro Storage | Pyramid Lake, California United States | 1,247,000 kW | Ancillary service | Electric Energy Time Shift, Electric Supply Reserve Capacity - Spinning | Operational | 1973 | [237] | |
| Green Mountain Energy Storage - NextEra | Lithium-ion Battery | Somerset County, Pennsylvania United States | 10,400 kW | Ancillary service | Frequency Regulation, Renewables Energy Time Shift | Operational | 2015 | [237] | |
| STMicroelectronics UPS System - S&C Electric | Lead-acid Battery | Phoenix, Arizona United States | 10,000 kW | Ancillary service | Grid-Connected Commercial (Reliability & Quality) | Operational | 2000 | [237] | |
| Kaheawa Wind Power Project II - Younicos | Advanced Lead-acid Battery | Maalaea, Hawaii United States | 10,000 kW | Ancillary service | Electric Supply Reserve Capacity—Spinning, Frequency Regulation, Ramping, Renewables Capacity Firming, Renewables Energy Time Shift | Operational | 2012 | [237] | |
| Auwahi Wind Farm | Lithium-ion Battery | Kula, Hawaii United States | 11,000 kW | Ancillary service | Ramping | Operational | 2012 | [237] | |
| Red Hook (Brooklyn, NY) - NY Prize Microgrid | Electro-chemical | Red Hook, Brooklyn, New York United States | 10,000 kW | Ancillary service | Electric Energy Time Shift, Microgrid Capability, Renewables Energy Time Shift | Announced | 2015 | [237] | |
| Tucson Electric Power (TEP) - NextEra | Lithium Nickel Manganese Cobalt Battery | Tucson, Arizona United States | 10,000 kW | Ancillary service | Demand Response, Electric Bill Management, Electric Bill Management with Renewables, Ramping, Renewables Capacity Firming, Resiliency, Transmission upgrades due to solar | Contracted | 2016 | [237] | |
| Kings County Energy Storage - PG&E Henrietta Substation | Zinc Air Battery | Kings County, California United States | 10,000 kW | Ancillary service | Distribution upgrade due to solar Electric Energy Time Shift Ramping Renewables Capacity Firming Renewables Energy Time Shift | Contracted | 2020 | [237] | |
| McIntosh CAES plant | CAES | Alabama, USA | 110 MW | Ancillary service | load management, spinning reserve, load following, and intermediate power generation | Operational | 1991 | [238,239] | |
| 20 MW Flywheel Energy Storage Plant | Flywheel | Stephentown, New York, USA | 20 MW | Ancillary service | Frequency regulations, and voltage regulation | Operational | 2014 | [238,240] | |
| Distributed SMES and Power Quality Industrial Voltage Regulator | Distributed SMES | Wisconsin, USA | 800 kW | Ancillary service | Grid and voltage stabilization | Retired | 2000–2003 | [238,241] | |
| Metlakatla Battery Energy Storage System | VRLA battery | Alaska, USA | 1 MW | Ancillary service | Voltage regulation and displacing diesel generation | Operational | 1997 | [238] | |
| Golden Valley Electric Association | NiCd battery | Fairbanks, Alaska, USA | 27 MW | Ancillary service | VAR support, spinning reserve and power system stabilization | Operational | 2003 | [7,238] | |
| AEP DES system at Chemical Station, | NaS battery | N. Charleston, West Virginia, USA | 1 MW | Ancillary services | Substation upgrade deferral, Optimal integration of both central and distributed energy assets. | Operational | 2006 | [238] | |
| Long Island Bus NaS Battery Energy Storage | NaS battery | New York, USA | 1.2 MW | Ancillary services | Load shifting | Operational | 2008 | [238] | |
| Pacificorp Castle Valley | VRB flow battery | Utah, USA | 250 kW | Ancillary services | Distribution line upgrade deferral and voltage support | Operational | 2004 | [238] | |
| Bath County Pumped Storage Station | Open-loop Pumped Hydro Storage | Bath County, Virginia, USA | 2772 MW | Ancillary services | Load levelling and peak shaving | Operational | 1985 | [238] | |
| AES Energy Storage Laurel Mountain Battery Energy Storage | Lithium ion Battery | West Virginia, USA | 32 MW | Wind energy Integration | Frequency regulation and wind energy intermittency mitigation | Operational | 2011 | [7,237] | |
| Norton | CAES | Norton, Ohio, USA | 2700 MW | Ancillary service | Peak shaving and loaf shifting | Under Construction | 2013 | [242] | |
| Wallace Dam Pumped Storage | Open-loop Pumped Hydro Storage | Milledgeville, Georgia United States | 208,000 kW | Ancillary service | Electric Energy Time Shift, Electric Supply Capacity | Operational | 1979 | [237] | |
| Rest of the world | 108 MW/648 MWh sodium-sulfur battery plant | NaS | Abu Dhabi, United Arab Emirates | 108 MW | Ancillary Service | Grid stabilization, frequency regulation, voltage support, Power quality, load shifting and energy arbitrage | Operational | 2019 | [7,243] |
| Tesla 100 MW / 129 MWh Li-ion battery storage project at Hornsdale Wind Farm | Li-ion | South Australia, Australia | 100 MW | Contingency reserves and ancillary services | Frequency regulation, capacity firming | Operational | 2018 | [244] | |
| STEAG’s 90 MW / 120 MWh battery storage project | Li-ion | Germany | 90 MW | Ancillary Service | Frequency regulation | Operational | 2017 | [244] | |
| 38.4 MW / 250 MWh sodium-sulphur battery by Terna | NaS | Italy | 38.4 MW | Ancillary Service | Grid investment deferral, reduced RE curtailment | Operational | 2015 | [244] | |
| Audi e-gas Project | Hydrogen Storage | Werlte, Niedersachsen, Germany | 6000 kW | Ancillary Service | Renewables Energy Time Shift | Operational | 2013 | [237] | |
| Energiepark Mainz | Hydrogen Storage | Mainz, Rheinland-Pfalz Germany | 6000 kW | Ancillary Service | Demand Response, Load Following, (Tertiary Balancing), Ramping, Renewables Capacity Firming, Stationary Transmission/Distribution Upgrade Deferral, Transmission Congestion Relief | Operational | 2015 | [237] | |
| Hydrogenics Power-to-Gas | Hydrogen Storage | Greater Toronto Area, Ontario Canada | 2000 kW | Ancillary Service | Frequency Regulation | Contracted | 2019 | [237] | |
| INGRID Hydrogen Demonstration Project | Hydrogen Storage | Troia, Apulia Region - Foggia Province Italy | 1.2 KW | Ancillary Service | Renewables Capacity Firming Renewables Energy Time Shift Transportation Services | Operational | 2016 | [237,245] | |
| Huntorf | CAES | Breman, Germany | 290 MW | Ancillary Service | Peak shaving, load shifting | Operational | 1973 | [238,242] | |
| Toronto A-CAESFacility | Advanced CAES | Lakeshore Ave Toronto, Ontario, Canada | 660 kW | Ancillary service | Electric Energy Time Shift, Back-up Power | Operational | 2015 | [237,246] | |
| Angas A-CAESProject | Advanced CAES | Callington Rd. Strathalbyn, South Australia, Australia | 5000 kW | Ancillary Service | Load leveling, frequency response, inertia | Under construction | 2020 (will come in service) | [237,246] | |
| Highview’s 5 MW Liquid Air Energy Storage Demonstrator | LAES | Pilsworth Power Plant, Moss Hall Road Bury, Lancashire, United Kingdom | 5000 kW | Ancillary Service | Electric Supply Reserve Capacity - Non-Spinning Frequency Regulation Transmission Congestion Relief Transmission Support Voltage Support | Operational | 2018 | [237] | |
| Kannagawa Pumped Hydro Plant | Open-loop Pumped Hydro Storage | Minamiaiki, Nagano Japan | 1,880,000 kW | Ancillary Service | Black Start, Frequency Regulation, Electric Supply Capacity, Electric Energy Time Shift, Electric Supply Reserve Capacity - Spinning | Operational (Partially) | 2020 (Expected to be fully operational) | [237] | |
| Dniester Pumped Storage Power Station | Open-loop Pumped Hydro Storage | Sokyriany, Chernivtsi Oblast Ukraine | 2,268,000 kW | Ancillary Service | Electric Energy Time Shift, Electric Supply Capacity, Electric Supply Reserve Capacity—Spinning, Frequency Regulation, Load Following (Tertiary Balancing) | Operational | 2009 | [237,238] | |
| Okutataragi Pumped Storage Power Station | Open-loop Pumped Hydro Storage | Kurokawa Reservoir Asago, Hyōgo Japan | 1,932,000 kW | Ancillary Service | Electric Energy Time Shift, Voltage Support, Frequency Regulation | Operational | 1998 | [237,238] | |
| Guangzhou Pumped Storage Power Station | Open-loop Pumped Hydro Storage | Longkou East Road Guangzhou, Guangdong China | 2400 MW | Ancillary Service | Electric Energy Time Shift, Electric Supply Reserve Capacity—Spinning, Frequency Regulation | Operational | 2000 | [237,238] | |
| Huizhou Pumped Storage Power Station | Open-loop Pumped Hydro Storage | Huizhou, Guangdong China | 2,448,000 kW | Ancillary Service | Electric Energy Time Shift, Electric Supply Reserve Capacity—Spinning, Frequency Regulation | Operational | 2011 | [237] | |
| 200 kW flywheel | Flywheel | Dogo Island, Japan | 100 KW | Ancillary Service | Wind energy intermittency reduction | Operational | 2003 | [238] | |
| Sumitomo Densetsu Office Battery System | Vanadium redox flow | Osaka, Japan | 3 MW | Ancillary Service | Peak shaving | Operational | 2000 | [7,238] | |
| Hyundai & Korea Zinc energy storage system | Lithium-ion | Ulsan, South Korea | 150 MW | Ancillary Service | Peak shaving, intermittency reduction, Uninterrupted power supply, backup power | Operational | 2018 | [247,248] | |
| KEPCO Sin-yongin s/s | Lithium Nickel Manganese Cobalt Oxide (Hybrid ESS) | Seoul, South Korea | 24 + 16 = 40 MW | Ancillary Service | Frequency regulation | Operational | 2016 | [249,250] |
| Applications | Required Capacity | Required Response Time | Required Discharge Duration | Remarks | References |
|---|---|---|---|---|---|
| Power quality | ~<1 MW | Milliseconds, <1/4 cycle | Milliseconds to seconds |
| [252,253,254,255,256] |
| Energy management | Large: >100 MW, medium/small: ~1–100 MW, | Minutes | hours–days |
| [257,258,259] |
| Integration with RES for mitigating intermittency | Up to ~20 MW | Up to 1 s, <1 cycle | Minutes to hours |
| [259,260,261,262,263] |
| Integration renewable for back-up | ~100 KW–40 MW | Seconds to minute | Up to days |
| [252,264,265,266] |
| Emergency back-up power | Up to ~1 MW | Milliseconds to minutes | Up to ~24 h |
| [264,267,268] |
| Telecommunications back-up | Up to a few of kW | Milliseconds | Minutes to hours |
| [267,269,270,271] |
| Ramping and load following | MW level (Up to hundreds of MW) | Up to ~1 s | Minutes to a few hours |
| [7,264,272,273] |
| Time shifting | ~1–100 MW and even more | Minutes | ~3–12 h |
| [252,274,275,276] |
| Peak shaving | ~100 Kw–100 MW and even more | Minutes | Hour level, ~<10 h |
| [269,277,278] |
| Load levelling | MW level (Up to several hundreds of MW) | Minutes | ~12 h and even more |
| [279,280,281,282] |
| Seasonal energy storage | 30–500 MW | Minutes | Up to weeks |
| [252,283] |
| Low voltage ridethrough | Normally less than 10 MW | ~Milliseconds | Up to minutes |
| [254,264,284] |
| Transmission and distribution stabilizations | Up to 100 MW | ~Milliseconds, <1/4 cycle | Milliseconds to seconds |
| [252,269,285,286] |
| Black-start | Up to ~40 MW | ~Minutes | Seconds to hours |
| [67,258,287] |
| Voltage regulation and control | Up to a few of MW | Milliseconds | Up to ~minutes |
| [288,289,290] |
| Grid/network fluctuation suppression | Up to MW level | Milliseconds | Up to ~minutes |
| [269,291,292,293] |
| Spinning reserve | Up to MW level | Up to a few seconds | 30 min to a few hours |
| [294,295,296,297] |
| Transportation applications | Up to ~50 kW | Milliseconds–seconds | Seconds to hours |
| [298,299,300,301] |
| End-user electricity service reliability | Up to ~1 MW | Milliseconds, <1/4 cycle |
| [264,269,302] | |
| Motor starting | Up to ~1 MW | Milliseconds–seconds | Seconds to minutes |
| [269] |
| Uninterruptible power supply | Up to ~5 MW | Normally up to seconds | ~10 min to 2 h |
| [303,304,305,306] |
| Transmission upgrade deferral | ~10–100+ MW | ~Minutes |
| [6,307,308] | |
| Standing reserve | Around 1–100 MW | <10 min |
| [302,309,310] |
| Energy Storage Type | Power Quality | Energy Management | Integration with RES for Mitigating Intermittency | Integration with RES for Back-Up | Emergency Back-Up Power | Telecommunications Back-Up | Ramping and Load Following | Time Shifting | Peak Shaving | Load Levelling | Seasonal Energy Storage | Low Voltage Ride-Through | T&D Stability | Black-Start | Voltage Regulation and Control | Grid/Network Fluctuation Suppression | Spinning Reserve | Transportation Applications | End-User Electricity Service Reliability | Motor Starting | Uninterruptible Power Supply | Transmission Upgrade Deferral | Standing Reserve |
|---|---|---|---|---|---|---|---|---|---|---|---|---|---|---|---|---|---|---|---|---|---|---|---|
| PHS | X | *** | X | ** | X | X | X | *** | *** | *** | ** | X | X | * | X | X | X | X | X | X | X | *** | ** |
| CAES | X | *** | X | ** | ** | X | * | *** | *** | *** | * | X | X | *** | X | X | ** | X | X | X | ** | ** | ** |
| LAES | X | ** | X | ** | ** | X | X | ** | *** | ** | ** | X | X | ** | X | X | * | ** | X | X | * | ** | ** |
| Flywheel energy storage | *** | ** | *** | * | *** | ** | * | * | ** | ** | X | *** | *** | X | ** | *** | ** | ** | ** | ** | *** | X | X |
| TES | X | *** | X | * | * | X | X | ** | ** | ** | ** | X | X | ** | X | X | * | X | X | * | * | ** | * |
| SCES | *** | X | *** | * | * | ** | * | * | ** | ** | X | ** | ** | X | ** | *** | X | *** | *** | *** | *** | X | X |
| SMES | *** | X | ** | * | * | * | *** | * | ** | ** | X | ** | *** | X | ** | *** | ** | X | ** | ** | ** | X | X |
| Lead-Acid | *** | *** | *** | *** | *** | *** | *** | *** | *** | *** | X | *** | ** | *** | *** | *** | *** | *** | ** | *** | *** | ** | ** |
| Li-Ion | *** | *** | *** | *** | *** | ** | *** | *** | *** | *** | X | *** | *** | ** | ** | *** | *** | *** | *** | ** | *** | *** | ** |
| Sodium sulfur | * | *** | *** | *** | *** | ** | *** | ** | *** | *** | X | ** | * | *** | ** | ** | ** | * | *** | ** | ** | ** | ** |
| Sodium metal halide | *** | * | *** | *** | *** | ** | * | * | *** | ** | X | ** | * | ** | ** | *** | ** | ** | *** | * | ** | X | * |
| Metal Air | * | * | *** | ** | ** | * | * | * | *** | ** | X | ** | * | * | ** | ** | ** | ** | *** | * | ** | X | * |
| Nickel Cadmium | * | *** | *** | *** | *** | ** | *** | *** | *** | *** | X | ** | * | *** | ** | ** | *** | ** | ** | ** | *** | *** | ** |
| Nickel–metal hydride | * | X | *** | *** | *** | ** | * | * | *** | * | X | ** | * | *** | ** | ** | *** | ** | ** | * | *** | X | * |
| Flow batteries | ** | *** | ** | *** | *** | * | *** | ** | ** | ** | X | ** | ** | *** | *** | *** | ** | X | ** | ** | ** | ** | ** |
| Fuel Cell | * | ** | ** | ** | ** | ** | ** | ** | ** | ** | ** | * | ** | ** | * | * | ** | *** | X | ** | ** | ** | ** |
| Solar Fuels | * | X | * | ** | X | X | * | ** | ** | * | ** | X | X | * | * | * | X | ** | * | ** | * | X | ** |
| Ancillary Services | Load Shifting | |||
|---|---|---|---|---|
| Stability | Availability | Supply Addition | Demand Addition | |
| Trading | Primary frequency control ■ $ avoid cost of ramping portfolio | Trading forecast Meet selling forecast ■ $ avoid penalties for deviations | Trading forecast Meet buying forecast ■ $ avoid penalties for deviations | |
| Secondary frequency control ■ $ avoid cost of ramping portfolio | Trading arbitrage Sell at high prices ■ $ exploit volatility of wholesale prices | Trading arbitrage Buy at low prices ■ $ exploit volatility of wholesale prices | ||
| Tertiary frequency control ■ $ avoid cost of ramping portfolio | ||||
| Production | Primary frequency control ■ $ avoid cost of ramping production | Black start energy ■ $ save investment in black start generator | Schedule stabilization ■ $ avoid cost for ramping up | Schedule stabilization ■ $ avoid cost for ramping down |
| Secondary frequency control ■ $ avoid cost of ramping production | Production forecast ■ $ avoid penalties for production deficit | |||
| Tertiary frequency control ■ $ avoid cost of ramping production | Generation capacity reserve ■ $ save investment in capacity expansion | |||
| Voltage control ■ $ save investment in voltage regulators | ||||
| Transmission & Distribution | Primary frequency control ■ $ avoid cost of control services | Black start energy ■ $ avoid cost of black start service | T&D peak shaving ■ $ save investment in capacity expansion | T&D peak shaving ■ $ save investment in capacity expansion |
| Secondary frequency control ■ $ avoid cost of control services | ||||
| Tertiary frequency control ■ $ avoid cost of control services | ||||
| Voltage control ■ $ save investment in voltage regulators | ||||
| Consumption | Primary frequency control ■ $ avoid cost of ramping consumption | Backup energy ■ $ save investment in black start generator | Consumption peak shaving ■ $ avoid demand changes | Consumption arbitrage ■ $ exploit volatility of consumer prices |
| Secondary frequency control ■ $ avoid cost of ramping consumption | Self-sufficiency ■ $ exploit gap in buying and selling prices | Self-sufficiency ■ $ exploit gap in buying and selling prices | ||
| Tertiary frequency control ■ $ avoid cost of ramping consumption | ||||
| Voltage control ■ $ save investment in voltage regulators | ||||
| Business Models | Market Roles | Mechanical | Thermal | Chemical | ||||||||||||||||||
|---|---|---|---|---|---|---|---|---|---|---|---|---|---|---|---|---|---|---|---|---|---|---|
| Flywheel | Pumped Hydro | CAES | Thermal | Super-capacitor | Batteries | Hydrogen | ||||||||||||||||
| Ancillary Services | □ | $ | ♯ | □ | $ | ♯ | □ | $ | ♯ | □ | $ | ♯ | □ | $ | ♯ | □ | $ | ♯ | □ | $ | ♯ | |
| Primary frequency control | All | ▲ | ▲ | 1 | ▲ | ▲ | 2 | ▲ | ▲ | 4 | ▲ | ▲ | 1 | ▲ | ▲ | 1 | ▲ | ▲ | 6 | ▲ | ▲ | 1 |
| Secondary frequency control | All | ▲ | ▲ | 1 | ▲ | ▲ | 4 | ▲ | ▲ | 6 | ▲ | ▲ | - | ▲ | ▲ | 1 | ▲ | ▲ | 5 | ▲ | ▲ | - |
| Tertiary frequency control | All | ▲ | ▲ | 1 | ▲ | ▲ | 3 | ▲ | ▲ | 7 | ▲ | ▲ | - | ▲ | ▲ | 1 | ▲ | ▲ | 6 | ▲ | ▲ | - |
| Voltage control | Prod., T&D, Cons. | ▲ | ▲ | 1 | ▲ | ▲ | 2 | ▲ | ▲ | 2 | ▲ | ▲ | 1 | ▲ | ▲ | 1 | ▲ | ▲ | 1 | ▲ | ▲ | 1 |
| Black start energy | Production, T&D | ▲ | ▲ | - | ▲ | ▲ | - | ▲ | ▲ | 1 | ▲ | ▲ | - | ▲ | ▲ | - | ▲ | ▲ | - | ▲ | ▲ | - |
| Backup energy | Consumption | ▲ | ▲ | - | ▲ | ▲ | - | ▲ | ▲ | - | ▲ | ▲ | - | ▲ | ▲ | - | ▲ | ▲ | 1 | ▲ | ▲ | - |
| Load Shifting | □ | $ | ♯ | □ | $ | ♯ | □ | $ | ♯ | □ | $ | ♯ | □ | $ | ♯ | □ | $ | ♯ | □ | $ | ♯ | |
| Trading forecast | Trading | ▲ | ▲ | - | ▲ | ▲ | - | ▲ | ▲ | - | ▲ | ▲ | - | ▲ | ▲ | - | ▲ | ▲ | - | ▲ | ▲ | - |
| Trading arbitrage | Trading | ▲ | ▲ | 4 | ▲ | ▲ | 11 | ▲ | ▲ | 14 | ▲ | ▲ | 2 | ▲ | ▲ | 4 | ▲ | ▲ | 12 | ▲ | ▲ | 3 |
| Production forecast | Production | ▲ | ▲ | - | ▲ | ▲ | 1 | ▲ | ▲ | 3 | ▲ | ▲ | - | ▲ | ▲ | - | ▲ | ▲ | 1 | ▲ | ▲ | - |
| Schedule stabilization | Production | ▲ | ▲ | 1 | ▲ | ▲ | 1 | ▲ | ▲ | 1 | ▲ | ▲ | 1 | ▲ | ▲ | 1 | ▲ | ▲ | 1 | ▲ | ▲ | 1 |
| Generation capacity reserves | Production | ▲ | ▲ | 1 | ▲ | ▲ | 5 | ▲ | ▲ | 2 | ▲ | ▲ | 1 | ▲ | ▲ | 1 | ▲ | ▲ | 2 | ▲ | ▲ | 1 |
| T&D peak shaving | T&D | ▲ | ▲ | 2 | ▲ | ▲ | 2 | ▲ | ▲ | 2 | ▲ | ▲ | 2 | ▲ | ▲ | 2 | ▲ | ▲ | 4 | ▲ | ▲ | 3 |
| Consumption peak shaving | Consumption | ▲ | ▲ | 2 | ▲ | ▲ | 2 | ▲ | ▲ | 2 | ▲ | ▲ | 1 | ▲ | ▲ | 2 | ▲ | ▲ | 9 | ▲ | ▲ | 1 |
| Self-sufficiency | Consumption | ▲ | ▲ | 1 | ▲ | ▲ | 2 | ▲ | ▲ | 2 | ▲ | ▲ | 1 | ▲ | ▲ | 1 | ▲ | ▲ | 21 | ▲ | ▲ | 1 |
| Consumption arbitrage | Consumption | ▲ | ▲ | - | ▲ | ▲ | 1 | ▲ | ▲ | 1 | ▲ | ▲ | - | ▲ | ▲ | - | ▲ | ▲ | 9 | ▲ | ▲ | - |
| Region | Act/Bill/Order | Date | Aim | Criteria |
|---|---|---|---|---|
| USA | US Federal Energy Regulatory Commission (FERC), Order 755 [235,318,319] | 2011 |
|
|
| US Federal Energy Regulatory Commission (FERC), Order 784 [235,320] | 2013 |
|
| |
| US Federal Energy Regulatory Commission (FERC), Order 841 [319,321] | 2018 |
|
| |
| California Public Utility Commission (CPUC) bill 2514 [311,322,323] | Placed on 2010 last updated on 2014 |
|
| |
| New York Senate Bill S6599 [311,324] | 2019 |
|
| |
| Massachusetts, bill H.4857 [311,325,326] | 2018 |
|
| |
| Oregon Public Utility Commission (PUC), law HB 2193 [319,327,328,329] | 2015 |
|
| |
| Hawaii public utilities commission, Act 155 (HRS 269-96) [330,331,332] | 2015 |
|
| |
| Senate and General Assembly of the State of New Jersey, Bill A3723 [333,334] |
|
| ||
| Maryland State Senate, Bill HB 650 [311,335] |
|
| ||
| Rest of the World | Electricity Directive and Electricity Regulation (EU) 2019/944 [336,337] | 2019 |
|
|
| Germany, Renewable Energy Act (EEG) [311,338,339] | 2017 |
|
| |
| France, The Energy Transition for Green Growth Act (LTECV) [337] | 2015 |
|
|
| Barriers | Issues | Key Points | Degree of Impact | Potential Solution |
|---|---|---|---|---|
| Regulatory Barriers | Procedural issues |
| Low |
|
| Functional Classification Restriction and cost allocations issues |
| Severe |
| |
| Discrepancies in Rules Across Markets |
| Moderate |
| |
| Economic Barriers | Revenue compensation mechanisms |
| Severe |
|
| Lack of market |
| Severe |
| |
| Lack of Price signals |
| Moderate |
| |
| Utility and developer business model barriers | Utility and developer uncertainty issue |
| Moderate |
|
| Cross cutting barriers | Limited knowledge of energy storage technologies among power system stakeholders |
| Low |
|
| Modeling restrictions and the Lack of modeling Capabilities |
| Moderate |
| |
| Technology Barriers | High technology costs |
| Severe |
|
| Functional Classification & Cost Allocation | Inadequate Compensation Mechanisms | Lack of Available Market | Lack of Price Signals | Utility & Develop Risk & Uncertainty | Limited Knowledge of ES Technologies | Modeling Limitations | High Technology Costs | Discrepancies in Rules Across Markets | |
|---|---|---|---|---|---|---|---|---|---|
| US Federal Energy Regulatory Commission (FERC), Order 755 | ✓ | ||||||||
| US Federal Energy Regulatory Commission (FERC), Order 784 | ✓ | ✓ | ✓ | ✓ | |||||
| US Federal Energy Regulatory Commission (FERC), Order 841 | ✓ | ✓ | |||||||
| California Public Utility Commission (CPUC) bill 2514 | ✓ | ✓ | ✓ | ||||||
| New York Senate Bill S6599 | ✓ | ✓ | ✓ | ✓ | ✓ | ✓ | |||
| Massachusetts, bill H.4857 | ✓ | ✓ | ✓ | ✓ | |||||
| Oregon Public Utility Commission (PUC), law HB 2193 | ✓ | ✓ | ✓ | ✓ | |||||
| Hawaii public utilities commission, Act 155 (HRS 269-96) | ✓ | ||||||||
| Senate and General Assembly of the State of New Jersey, Bill A3723 | ✓ | ✓ | ✓ | ||||||
| Maryland State Senate, Bill HB 650 | ✓ | ✓ | ✓ | ✓ | |||||
| Electricity Directive and Electricity Regulation (EU) 2019/944 | ✓ | ✓ | ✓ | ||||||
| Germany, Renewable Energy Act (EEG) | ✓ | ✓ | ✓ | ||||||
| France, The Energy Transition for Green Growth Act (LTECV) | ✓ | ✓ | ✓ | ✓ |
© 2020 by the authors. Licensee MDPI, Basel, Switzerland. This article is an open access article distributed under the terms and conditions of the Creative Commons Attribution (CC BY) license (http://creativecommons.org/licenses/by/4.0/).
Share and Cite
Hossain, E.; Faruque, H.M.R.; Sunny, M.S.H.; Mohammad, N.; Nawar, N. A Comprehensive Review on Energy Storage Systems: Types, Comparison, Current Scenario, Applications, Barriers, and Potential Solutions, Policies, and Future Prospects. Energies 2020, 13, 3651. https://0-doi-org.brum.beds.ac.uk/10.3390/en13143651
Hossain E, Faruque HMR, Sunny MSH, Mohammad N, Nawar N. A Comprehensive Review on Energy Storage Systems: Types, Comparison, Current Scenario, Applications, Barriers, and Potential Solutions, Policies, and Future Prospects. Energies. 2020; 13(14):3651. https://0-doi-org.brum.beds.ac.uk/10.3390/en13143651
Chicago/Turabian StyleHossain, Eklas, Hossain Mansur Resalat Faruque, Md. Samiul Haque Sunny, Naeem Mohammad, and Nafiu Nawar. 2020. "A Comprehensive Review on Energy Storage Systems: Types, Comparison, Current Scenario, Applications, Barriers, and Potential Solutions, Policies, and Future Prospects" Energies 13, no. 14: 3651. https://0-doi-org.brum.beds.ac.uk/10.3390/en13143651