1. Introduction
Sustainability has become a significant factor in the building sector [
1,
2,
3], integrating such aspects as design, construction, rehabilitation and operation. In the field of building simulations, researchers are looking for new information to obtain a more efficient building depending on the location and its climatology [
4,
5,
6], and thus make energetic savings.
The building sector accounts for a high percentage of electricity consumption in the Dominican Republic [
7], particularly in air conditioning equipment to maintain user comfort. If energy efficiency strategies are not taken into account, the continued increase in the energy consumption of the building sector in the Dominican Republic is one of the factors that could negatively impact the country’s installed electricity capacity. An adequate choice of the conditioning system combined with strategies aimed at reducing thermal gains in both the construction and retrofitting of buildings can give users the desired indoor temperature at a lower cost [
8].
In the latitude of the Dominican Republic (DR), the only valid way to reduce indoor temperature is cool production. So, under these conditions, even the minimum solar gain supposes higher energy consumption. The thermal gain due to incident solar radiation over buildings is the main cause of energy consumption attributable to the conditioning system [
9,
10]. Furthermore, when operating timing is the same as the solar radiation timing, conditioning systems are working incessantly in an attempt to keep the indoor temperature down when the outdoor temperature is higher.
The heat gains from incident solar radiation in buildings are the main cause of energy consumption attributable to air conditioning [
11], particularly during the daytime, when the air conditioning equipment is almost constantly in operation to lower the indoor temperature, as the difference between the outdoor and indoor temperatures is very high, as is the case with the DR. Meteorological data are also critical for proper simulation as they constitute the boundary conditions of the building [
12,
13]. Despite occupancy being an important issue, when different occupancy profiles are used to simulate building energy consumption, the deterministic profiles may not be able to estimate the peak energy consumption when special events occur. Moreover, profiles may overestimate the peak load of spaces in the same system partition as they reach the maximum occupancy simultaneously, which is often not realistic due to the stochastic nature of occupant behavior in buildings [
14]. Therefore, this parameter was not taken into account in this work.
The work presented in this article aims to raise awareness of the thermal impact on buildings in the Dominican Republic with respect to the climatic elements, giving scientific results concerning the issues of the construction itself and the management of the energy consumption. For that purpose, different strategies to achieve efficient buildings are proposed. This study is based on an evaluation using Design Builder, an Energy Plus energy simulation software [
15]. Using a simulated thermal analysis and eight tertiary-level type buildings of the Dominican Republic (office buildings and shops located in different provinces with differences in their climate environment [
16,
17]), the different impacts of temperature, relative exterior humidity and desired comfort inside the building are evaluated in conjunction with the associated power consumption. Thus, the said power consumption can be obtained and maintained during its phase of operation. Another important consideration in the use of this envelope classification methodology is that it is a support for decision-making in the construction of new buildings at the latitude in which the Dominican Republic is located, N 19–0’0” or 70–40’0.01”, in addition to the implementation of strategies in the rehabilitation of existing buildings.
From this situation, the need arises, as well as the obligation, to adopt savings measures related to energy expenditure. Thus, monitoring and simulation are necessary to enable its analysis, evaluating the thermal and electrical behavior of efficient buildings in the tertiary sector in the Dominican Republic.
2. Methodology
2.1. Properties of Building Materials in the Dominican Republic
One of construction’s fundamental historical purposes, particularly as regards housing, is to provide adequate and permanent living conditions with the priority of thermal comfort, a fundamental requirement for human activity [
18].
According to data from the 2013 National Survey of Multiple Purpose Homes (ENHOGAR), prepared by the National Bureau of Statistics (NBS) [
19], the predominant construction materials in the Dominican Republic are concrete blocks to build exterior walls and partitions, zinc or concrete ceilings/roofs and aluminum and glass windows.
The thermal properties to be taken into account for the specific buildings of the DR are shown in
Table 1 [
20].
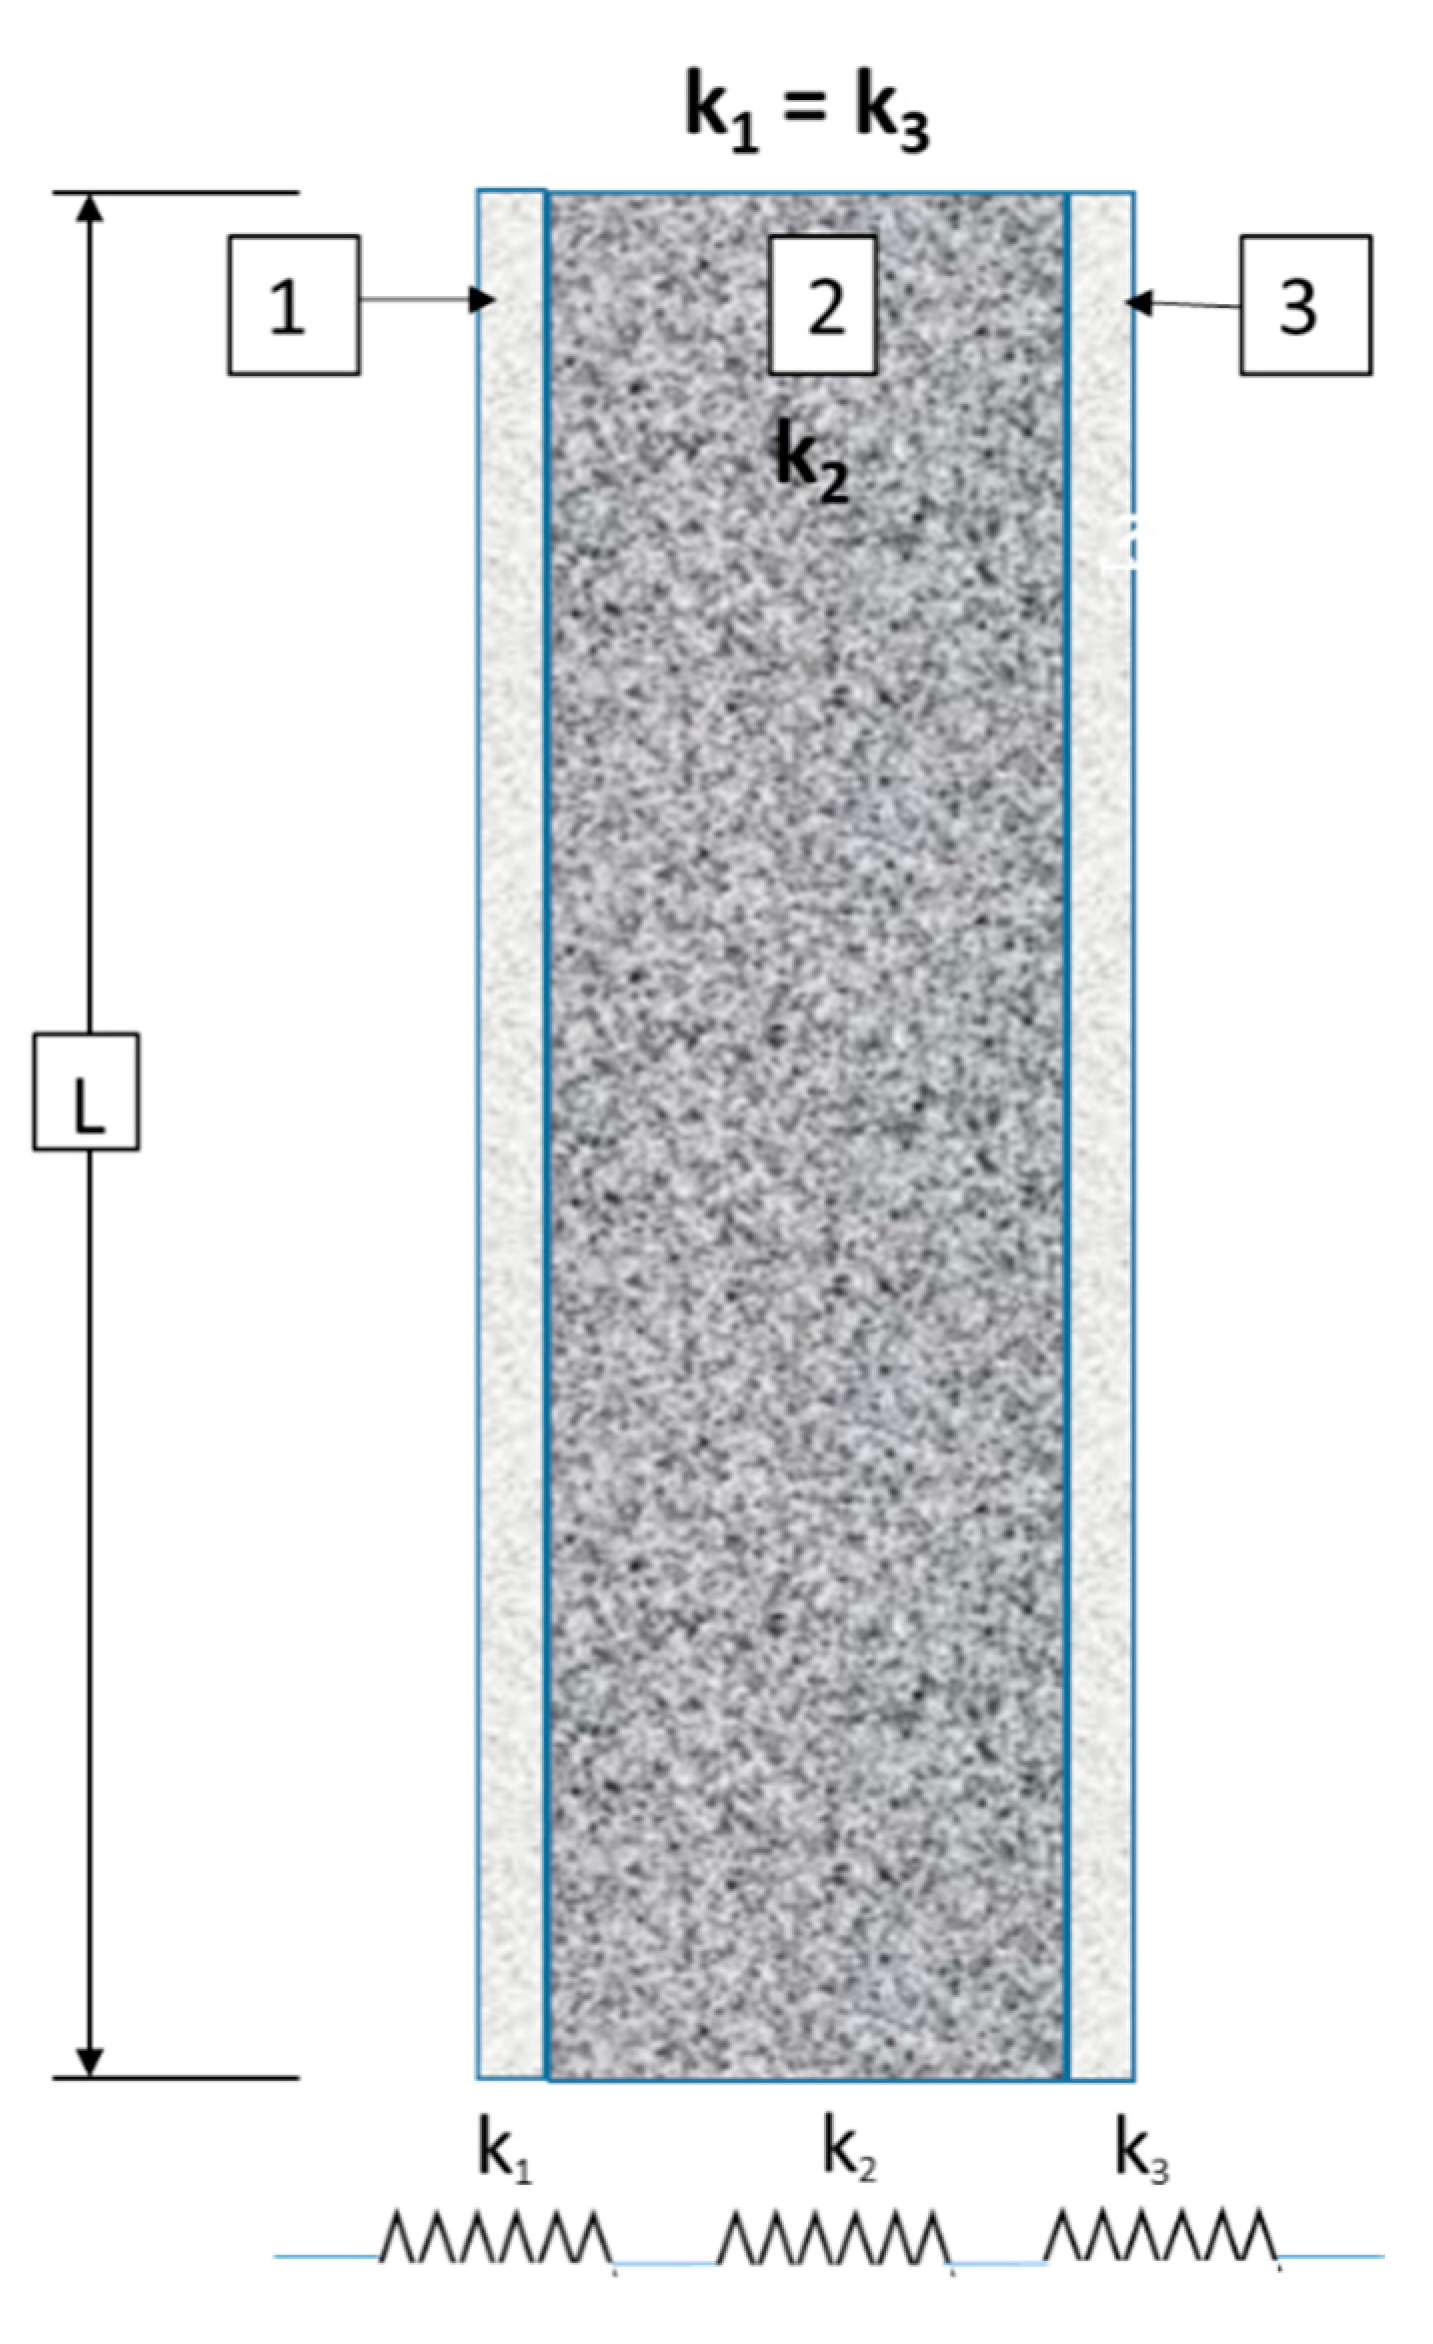
2.1.1. Façade Layout in Tertiary Buildings
In
Figure 1, the layout of a typical façade of the DR’s buildings is shown.
In
Table 2, for each layer of the wall section, there is a description of materials and the thermal properties including the U value.
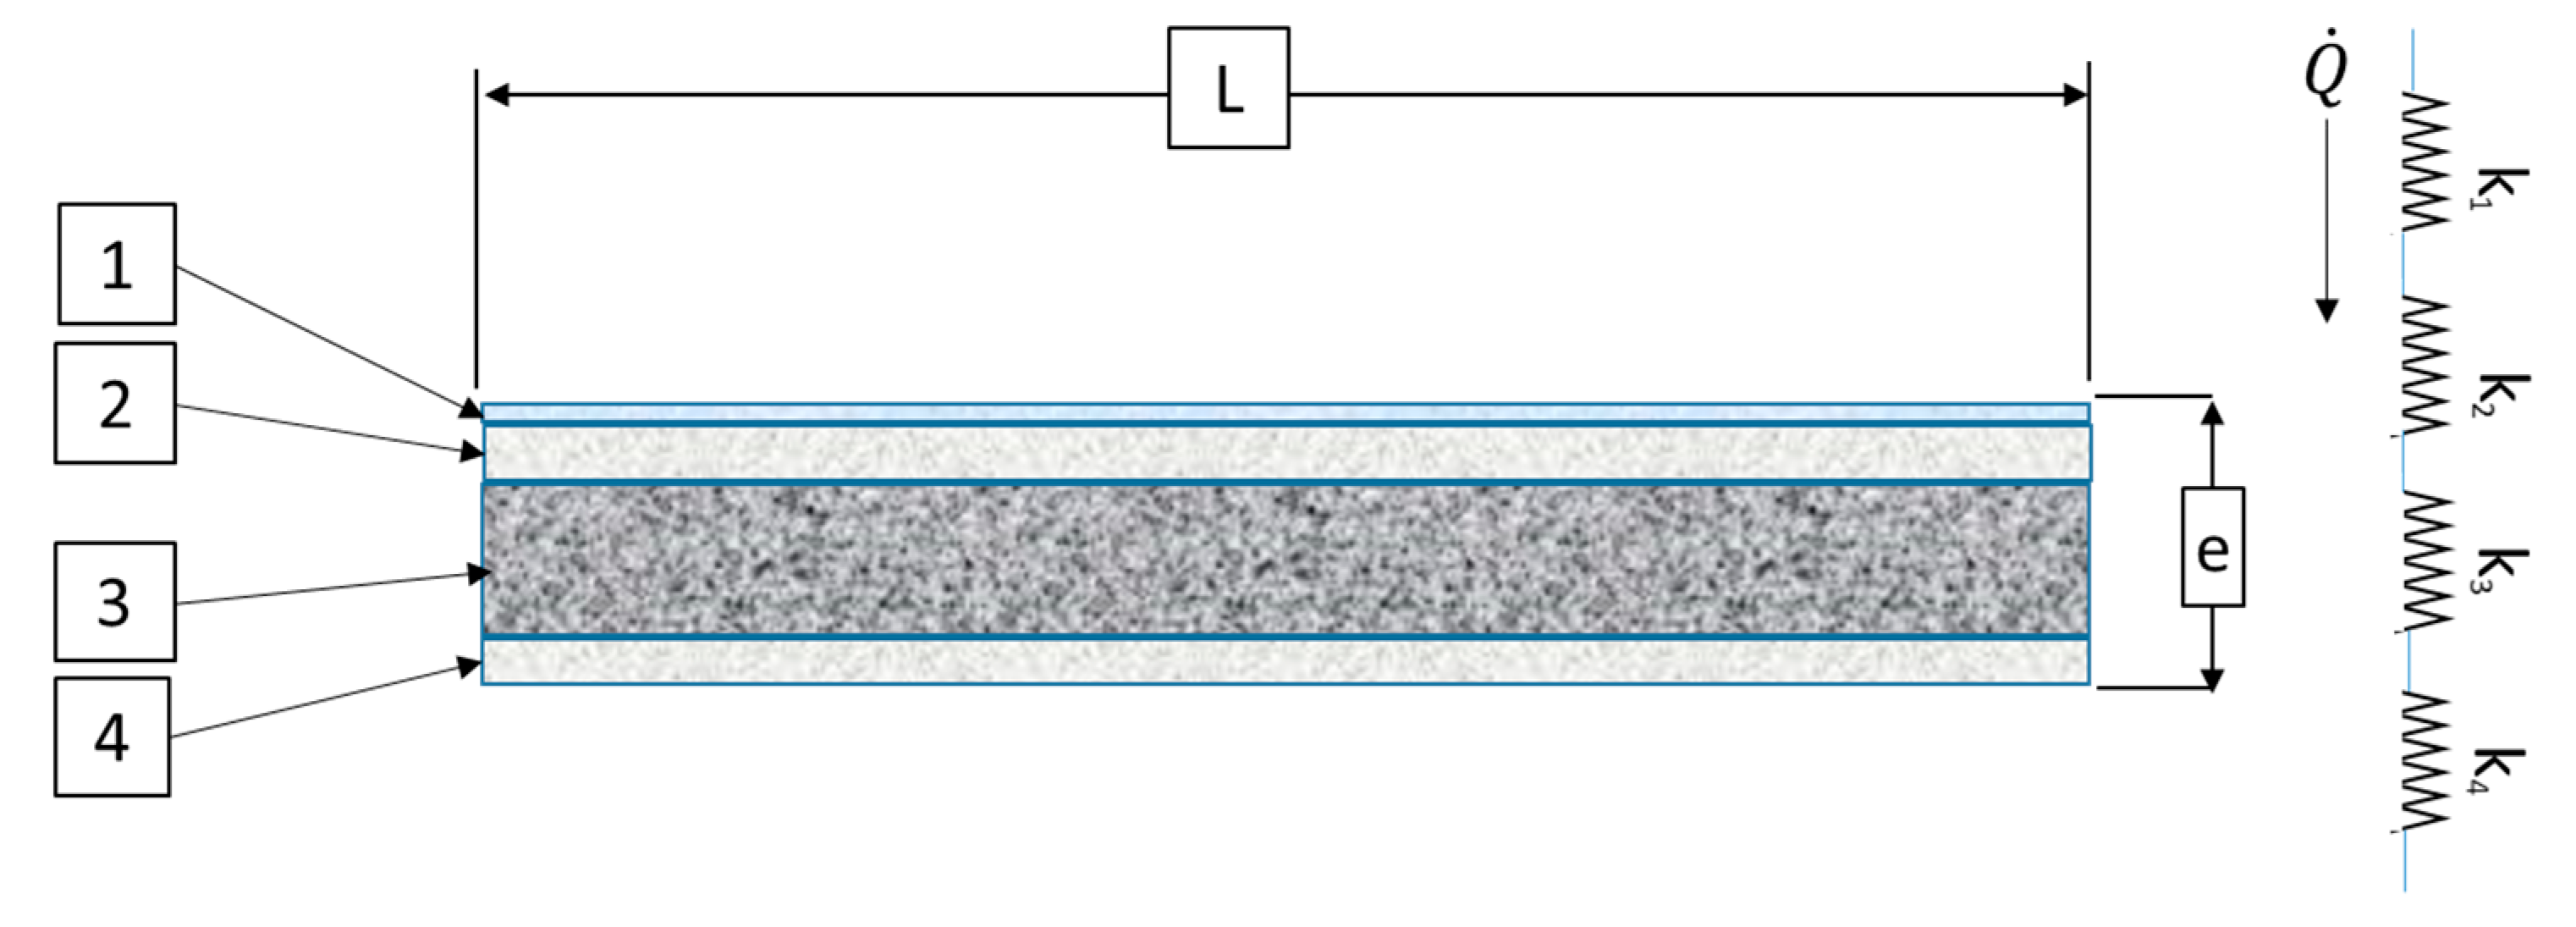
2.1.2. Roof Layout of Tertiary Buildings
In
Figure 2, the most common roof layout used in buildings in the DR is shown.
In
Table 3, the thermal properties of the material of each of the layers of the roof are shown, as well as the U value of the roof.
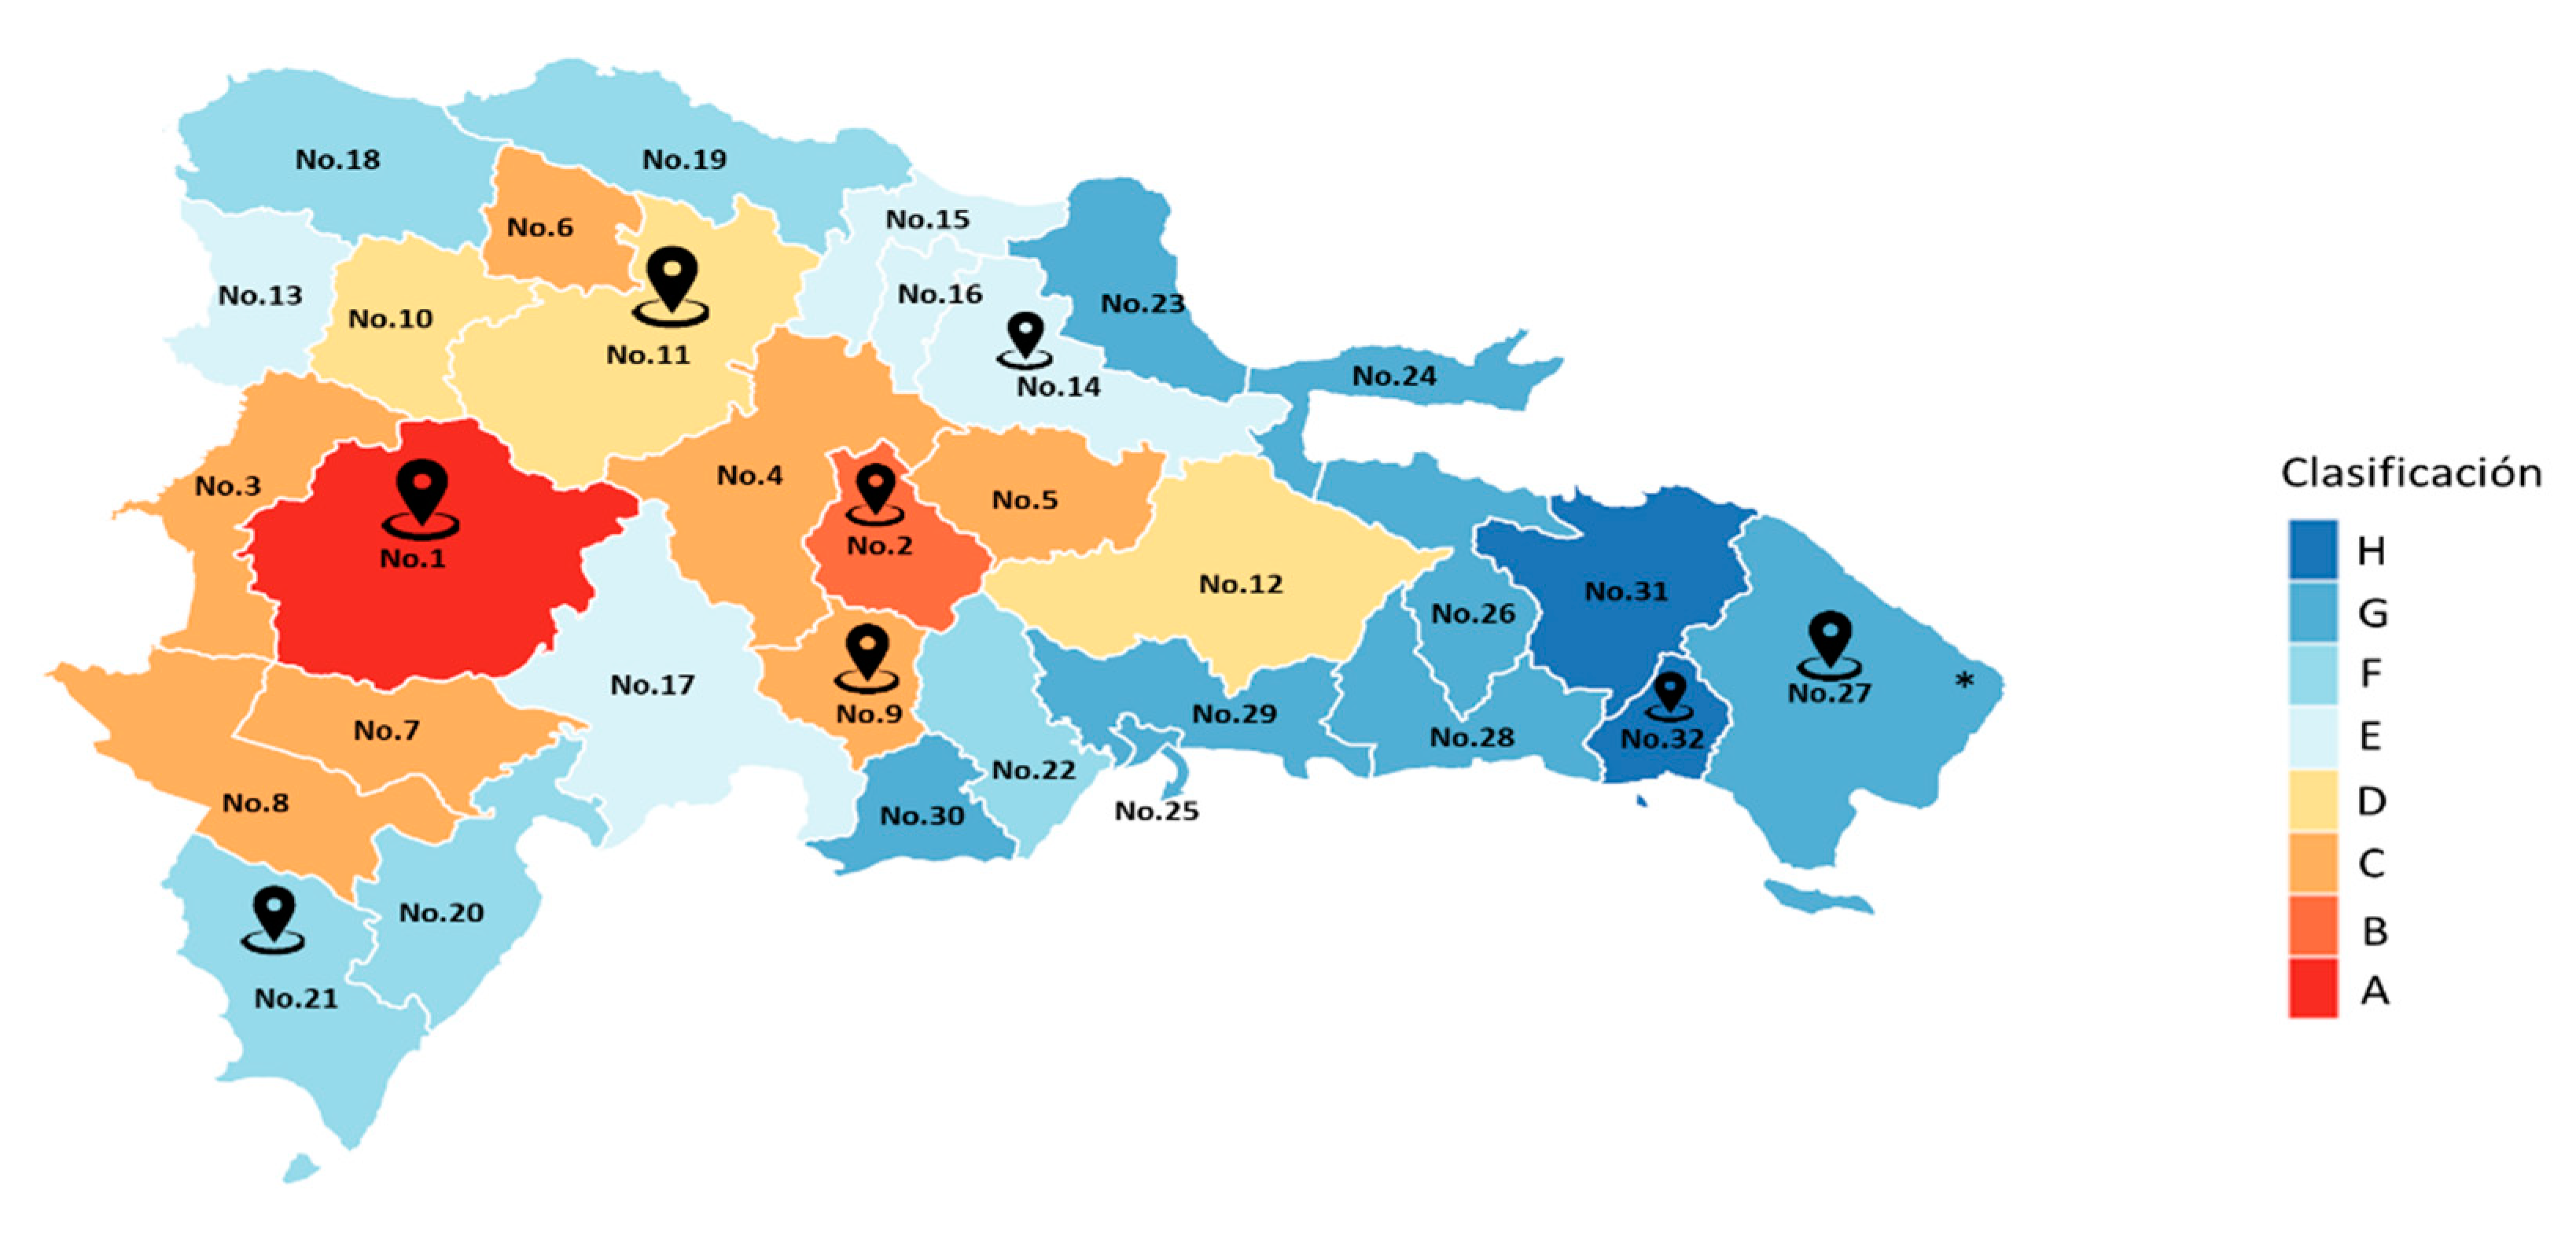
2.2. Choosing Typical Areas for Building Modeling
A grouping study for temperature and relative humidity intervals for the 32 provinces and a point of interest (Punta Cana) [
16] was carried out to choose the province types, making a classification from A to H, as shown in
Table 4. Note: this classification was made to obtain a more centralized view of the results, due to the number of provinces with similarities in the incidence of their outdoor climate.
The distribution of the province types in the case under study is shown in the following map (
Figure 3), identifying the location of the provinces with the order number in
Table 4. The key objective here is to study the behavior of air conditioning equipment in relation to the air temperature differential and daytime heat gains in tertiary-level buildings in the DR.
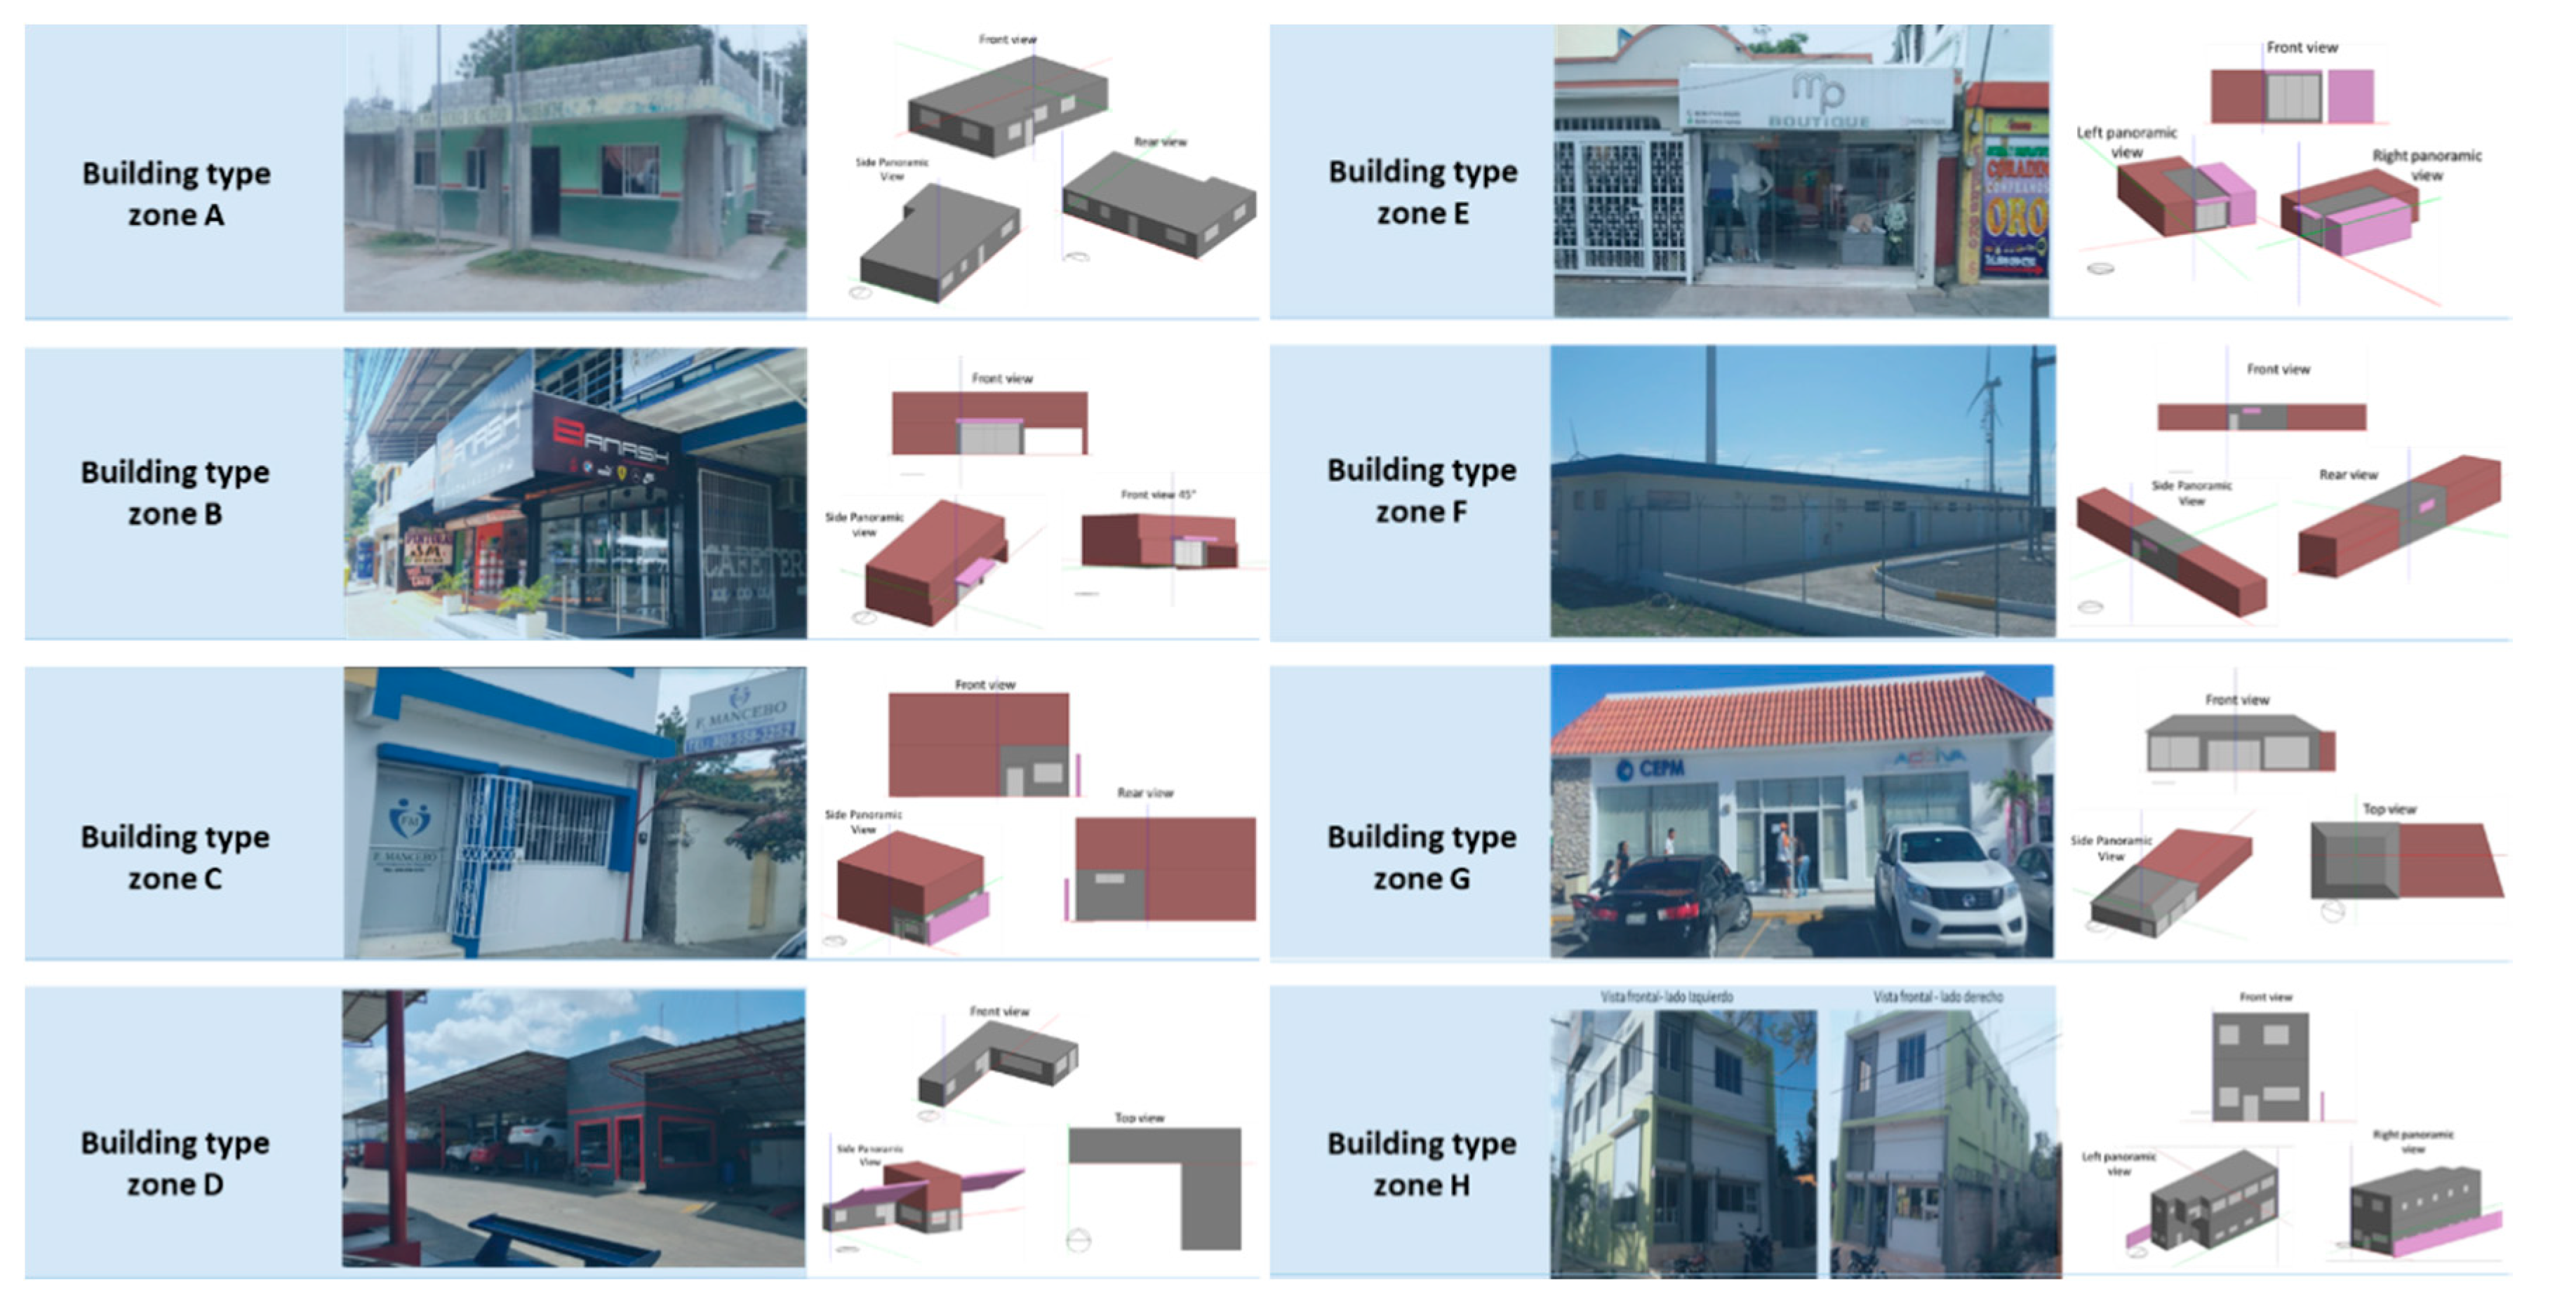
2.3. Visualization and Modeling Process
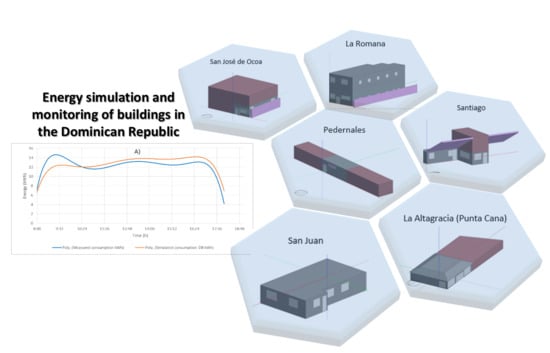
The construction of eight tertiary-level type buildings was carried out using the Design Builder construction engine (see
Figure 4); the construction configuration of these buildings is shown below:
These buildings are located in the areas marked on the map (
Figure 3) and represent the range of building typologies and climatic conditions that impact the said typology in each area.
2.4. Calculation of the Total Thermal Power of Building Types
As the DR does not have a technical building code, research was carried out into the legislation of countries that have a similar climatology to that of the DR, and it was found that the technical building code of Puerto Rico [
21] could be taken into account to fix the thermodynamic parameters for indoor air. Therefore, 23.8 °C as the indoor air temperature and 60% as the indoor air relative humidity were chosen. These parameters, according to verified studies [
16], are those required for a body to be in comfort at the latitude of the DR.
Thus, we have applied the psychrometric methodology, applying it through numerical methods, for the calculation of the overall thermal power in each building that had to be overcome in order to reach the desired temperature and relative humidity.
The relative humidity and air temperature values that were considered significant for each province in particular were used to apply this formula. Using the databases of the National Renewable Energy Laboratory of the Department of Energy of the USA [
22], which stores the climate parameters for the Dominican Republic, we then proceeded to group the relative humidity and air temperature data registered over a five-year period between 8 a.m. and 6 p.m., the timetable established as the working day in the tertiary sector in the DR. We could thus identify, through the absolute frequency method, the value that most affected the said time period, for both relative humidity and air temperature.
2.5. Calculation Method
To obtain a visualization, analysis and simulation of the behavior of thermal energy in the air conditioning equipment, their use and efficiency, the following was taken into account:
In order to obtain results from the building as a whole, as opposed to independent results from each enclosure, we decided to use a 3D simulation format that maintains the thermal properties of the existing materials [
23].
The energy loads, due to use, except those that come from air conditioning equipment, were eliminated to ensure that the thermal and energy parameters of the equipment itself were studied.
For each of the models built, the office use characteristics were assigned by editing only the operating hours of the premises and the metabolic loads according to the average number of people in the premises.
The corresponding weather data in each province, obtained from The National Solar Radiation Database (NSRDB) data viewer [
22], were loaded to calculate the simulation for each model.
Simulation analyses focused the greatest effort on visualizing internal gains for each model and the behavior of the climate control equipment.
2.6. Characterization of Building Types
In order to obtain a more detailed visualization of the envelope of the building types under study, while also being able to apply the same methodology to any building with the same characteristics, a classification was made with relation to the most important details of the envelope.
Table 5 shows the different categories identifying the type of building in order to be able to make decisions concerning improvements applicable to the envelope.
The categories of the construction area and air-conditioned space intervals in this area, the envelope type, construction system, solar protection and the percentage of south facade glazing (orientation that is critical for internal gains through sunlight at this latitude) are presented. All of these categories aim to see how efficiency, in relation to internal heat gains, can impact the building.
The results of the classification for the eight case-type buildings are shown in
Table 6.
2.7. Monitored Building
With the aim of verifying the developed simulation results, the building situated in Punta Cana was monitored using a General Electric brand datalogger with the following technical characteristics [
24,
25]:
Identification of the instrument
Measuring instrument: electricity meter
Brand: General Electric, (Rye Brook, N.Y., USA)
Model/Type: C12SPMDR
Voltage: 120 V/208 V
Maximum intensity: 200 A.
In previous studies of the climate of the Dominican Republic [
16], it was determined that the maximum and minimum temperature of the outside air in Punta Cana is within the range of 24 °C as a minimum and 30 °C as a maximum temperature 95% of the time, so it enables us to extrapolate these values to any time and time of year by assessing the outdoor conditions in this location.
The building is equipped with a chiller unit of the brand Technology in Global Mechanics (TGM), model TCV4060A This unit operates on a steam compression cycle using R-22 as the refrigerant. The evaporator is placed on the celling and the condensing unit is on the roof.
The evaporation capacity of the unit is 17.58 kW and the SEER (Seasonal Energy Efficiency Ratio) is 10. The compressor of this unit has a 31 A RLA (Running Load Amps) and a 142 a LRA (Locked Rotor Amps). The unit is designed to work between 1.03 MPa and 2.76 MPa.3.
3. Results
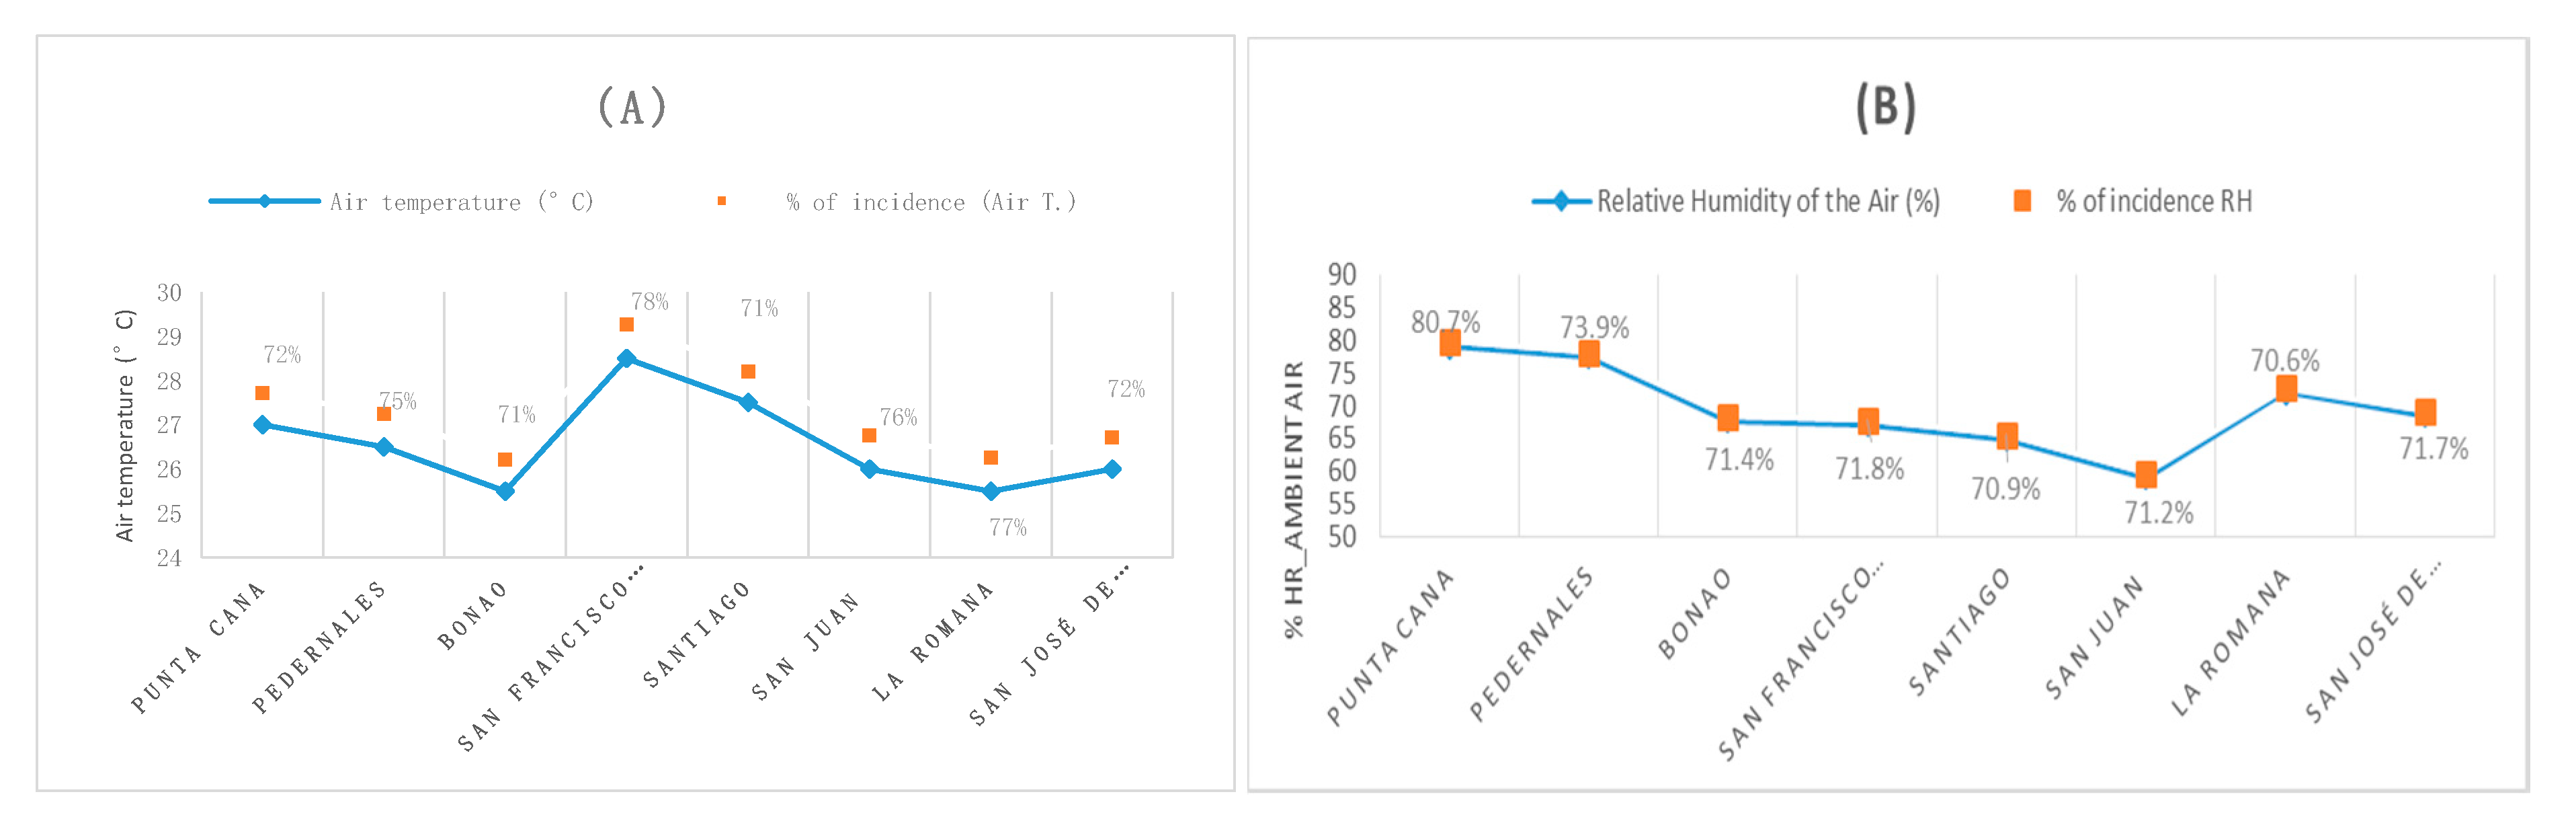
3.1. Results of the Mathematical Analysis (Psychrometrics)
Figure 5A shows the significant temperature results for each province where the case-type buildings are located, while 5B shows the results of the percentage of significant relative humidity for the said buildings, and both indicate the percentage of coincidence to be able to call it meaningful or not.
With the results obtained and shown in
Figure 3, the total thermal power in each of the standard buildings was calculated, where the volume of the room in which the air conditioning equipment is used was taken into account for this calculation in order to achieve the set point temperature and humidity (23.8 °C and 60%). For the building types of La Romana and San Juan, only the partitions (volume of the room) where air conditioning equipment are located were taken into account to perform the calculation of the thermal power.
Table 7 shows the calculated results for the total thermal power of each building type.
When making a comparison of the volume of the premises vs. the calculated thermal power, it can be seen that, in the modeled building type in the Punta Cana and Pedernales provinces, the thermal powers to be overcome have a high percentage with respect to the construction dimension of these buildings. This is due to the percentage of relative air humidity.
Controlling the percentage of humidity against the thermal sensation, so that a body feels thermally comfortable, plays a very important role, in addition to that of reducing the temperature. This factor is the second element that we must consider when carrying out studies of air conditioning in buildings.
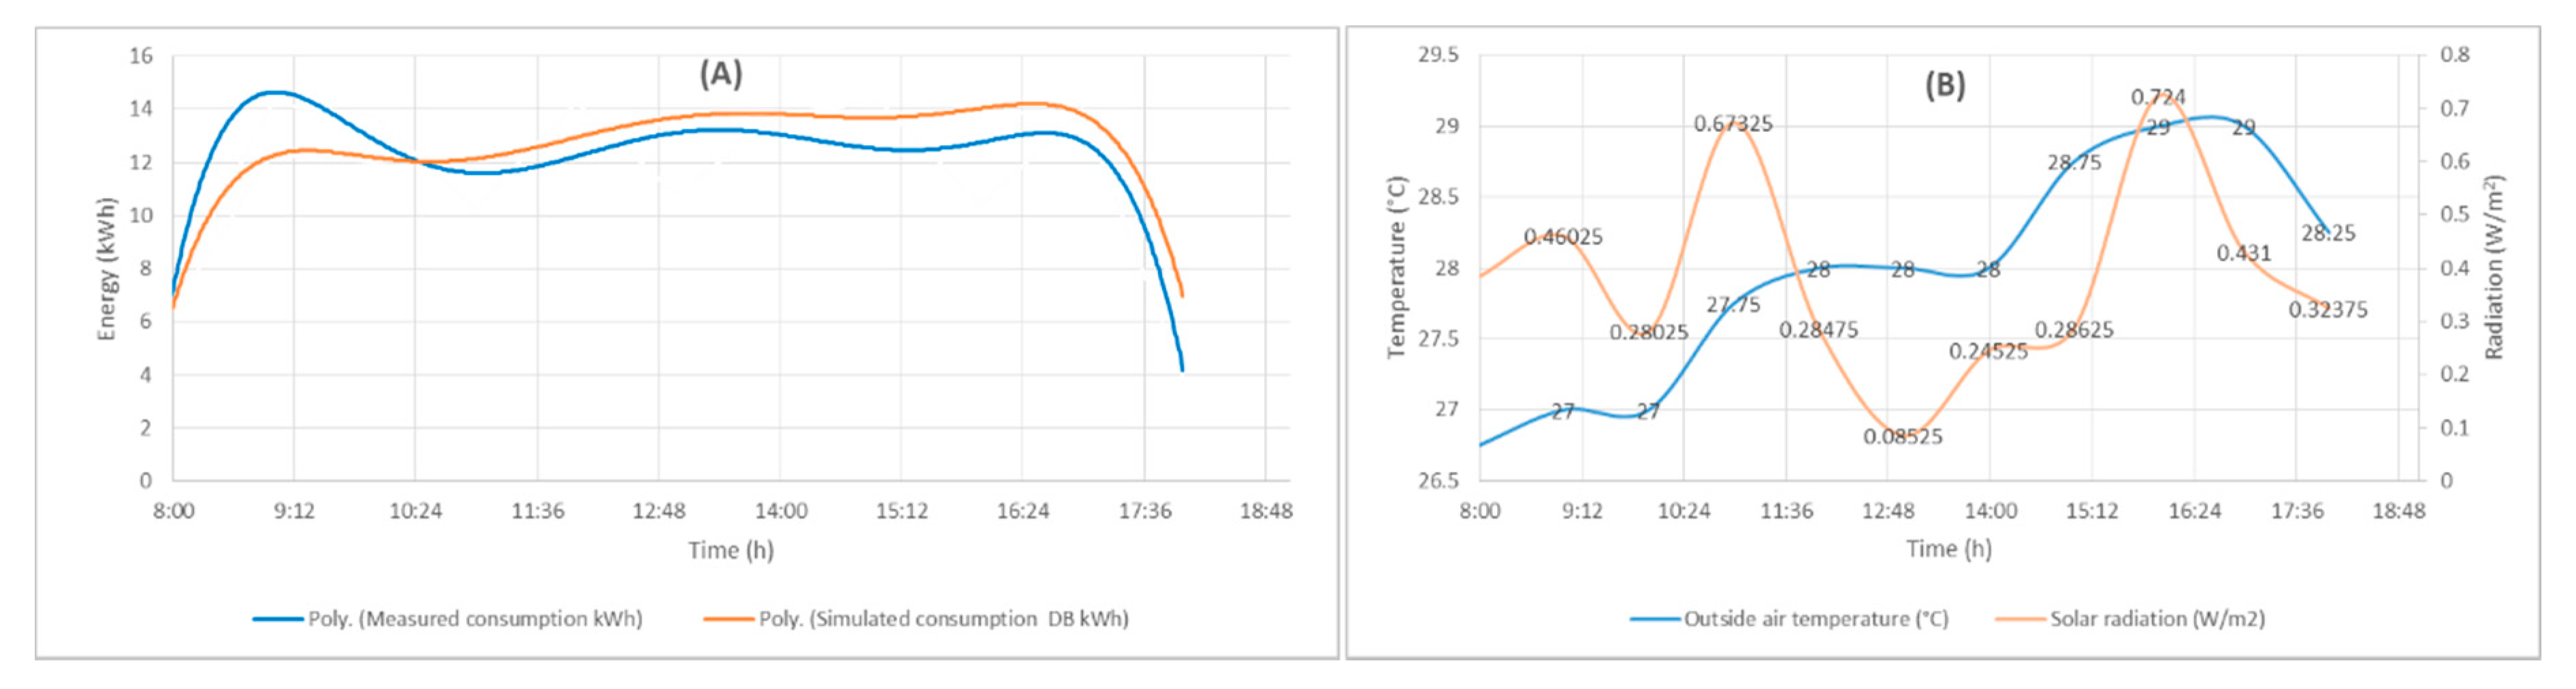
3.2. Analysis of the Simulation Results
Analysis of the energy consumed in the monitoring of a building type vs. its simulation.
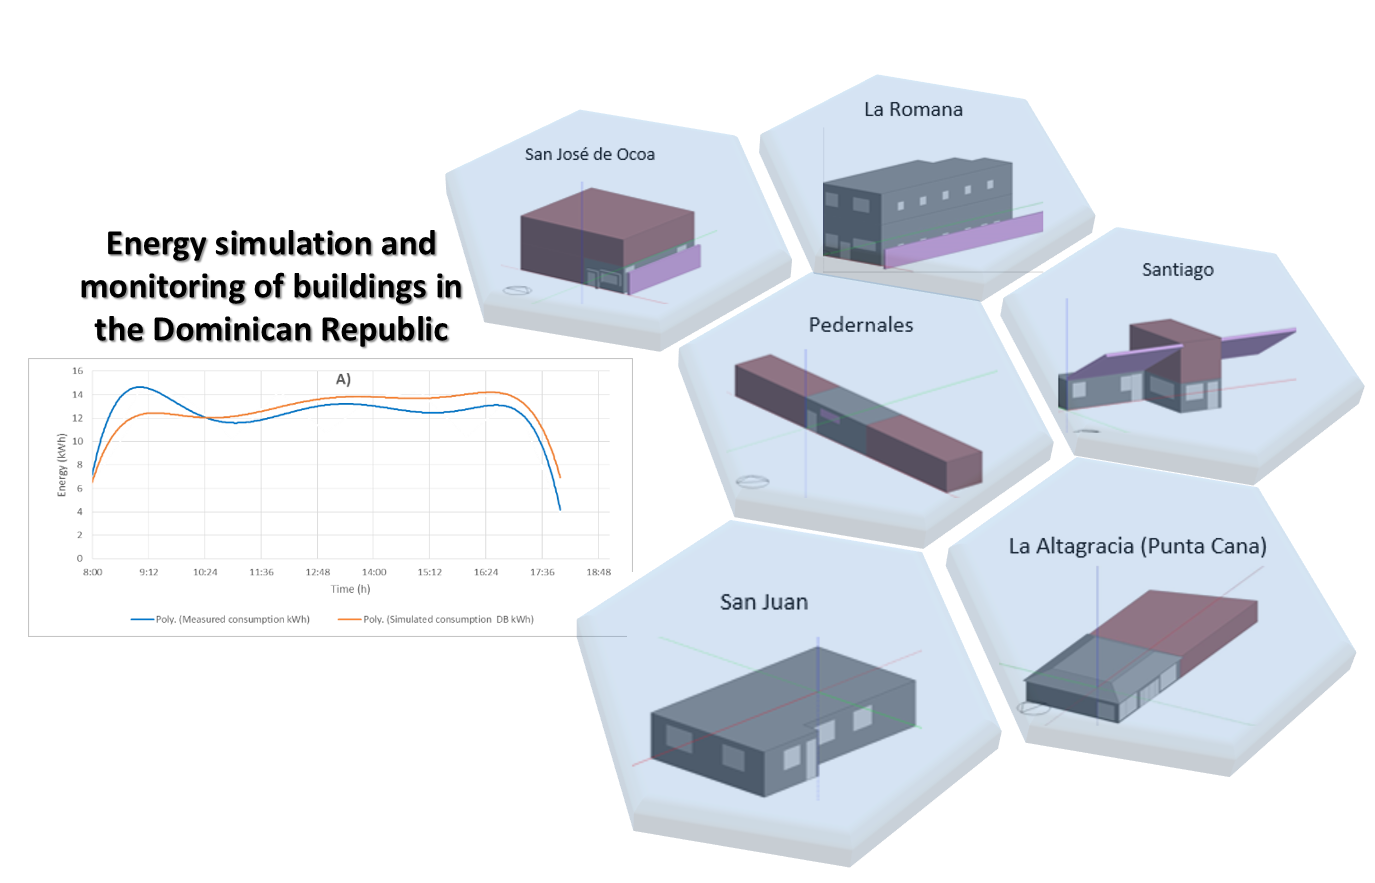
To demonstrate the necessary behavior of a building to maintain it in conditions of thermal comfort (23 ºC indoor temperature and 60% relative humidity), the simulation was run in the Design Builder (DB) of the model located in the province of La Altagracia (Punta Cana), where the 63,303 kJ steam compression air conditioning equipment was created in the detailed DB module, yielding the results shown in
Figure 6A,B.
The monitoring of the energy consumption of the air conditioner was carried out in the operational range of the office studied (8:00–18:00), in which a General Electric (GE) datalogger was installed, yielding kWh information with intervals of 30 minutes and, similarly, the results of the DB simulation were consulted for comparison.
Figure 6A shows that the simulated consumption vs. the monitored consumption had the same trend, and the final result of the consumption on the standard day was 131 kWh in the simulated and 129.2 kWh in the monitoring. We can therefore confirm that the model is properly adjusted and improvements can be made to the building to visualize its behavior.
Figure 6B shows the temperature behavior (°C) and solar radiation (W/m
2) of the simulated and monitored day type. This was performed in order to relate the on–off switch of the air conditioning equipment’s compressor. It can be seen that, although the radiation decreased at this point, the air temperature due to the convective effect was maintained over the hours 12:00–14:00.
4. Conclusions
For buildings that use air conditioning equipment by steam compression to maintain user comfort during daytime hours, this study shows that it is necessary to implement strategies linked to avoiding the increase in the thermal load due to gains as the result of solar radiation in order to achieve the highest performance.
Energy simulation programs demonstrate reliability with a low percentage of error when making decisions in the implementation of improvements to achieve energy efficiency. One of the buildings in a climatic zone of the Dominican Republic was first monitored and then simulated. These results show a similar trend in consumption between the monitored building and its simulation. Future research will monitor the other buildings identified in the other province types of each climatic zone. Then, after adjusting the simulation, different energy strategies could be implemented to adapt each building area so that it can function as a guide to the rehabilitation and construction of buildings in the Dominican Republic.
The importance of significant temperatures and their percentage of incidence could give future research the necessary guidance in choosing the length of time a building should be monitored for analysis and decision-making.
Thermo-energetic results were obtained from eight building types of the tertiary sector in the DR. The energy consumption associated to the air conditioning systems makes up 40.12% of the total energy consumption in this sector [
10]. The study focused on analyzing the consumption of electricity from air conditioning with regard to the climate in which the buildings are situated. The results showed the differences that exist in the specific thermal potential of the different climatic zones.
Such a classification enables us to identify the type of surrounding that is desirable to study, both for new buildings and the rehabilitation of existing ones, providing the parameters that influence the consumption of energy in buildings of the Dominican Republic so as to be able to make the best decisions at the time of intervening in this sector.
It is possible to simulate and monitor a building type of the Dominican Republic, managing to fit the model simulated in Design Builder with regard to the real, monitored values of the energy consumed in the building. It is, then also possible to introduce strategies, first simulated and then implemented in situ, to demonstrate the potential of the simulation hardware in the building sector of the Dominican Republic.

 ,
, 


