1. Introduction
In order to limit global warming to well below two degrees Celsius, critical actions are needed to reduce greenhouse gas (GHG) emissions [
1]. The European Union (EU) aims to mitigate GHG emissions by at least 80% by 2050 relative to 1990 levels. One of the EU strategies is the progressive transformation from a fossil-based to a renewable-based energy system. In this context, at urban scale where up to 80% of the global energy is consumed [
2], the electrification of the energy demand would help to reduce GHG emissions in both building and transport sectors [
3].
Focusing on the building sector, in particular space heating, recent studies show that almost 90% of the final energy consumption in Germany can be attributable to the provision of useful heat, with similar results in Italy [
4,
5]. At the same time, the heat supply at household level is still primarily based on fossil fuels (natural gas, heating oil), while renewable energies account for only 13% of the final energy consumption in the German heating sector [
6].
Due to the ongoing expansion of renewable energies (RES), especially wind and solar power, the primary energy and CO
2 intensity of electricity generation could be expected to reach values close to carbon-neutrality [
7]. With this background, diverse authors [
8,
9] have pointed out the potential contribution of low carbon electricity on decarbonizing the heating sector. In this direction, the 2012/27 European Energy Efficiency Directive [
10], enacted in favor of the residential energy consumption from renewable energy sources, arousing considerably interest in Heat Pumps (HPs) as an alternative option for space heating in buildings. This interest is mainly due to the proven high efficiency of HPs compared with fossil fuel heating systems for the production of heat [
11]. However, three main obstacles are present to the high replicability of this solution:
The electricity prices are around twice as high as natural gas or oil prices, being even three or more times higher in some markets according to the International Energy Agency (IEA) [
12]. Therefore, new electric tariffs should be set up to promote the use of the heat pumps. These tariffs will enable implicit demand response strategies and a more efficient energy consumption. Similar tariffs have already been set up in Italy, France and Finland [
13,
14,
15].
The characteristics of the different electric mixes per country. In 2016, fossil fuels (i.e., coal, natural gas and oil) were responsible for 43% of the electricity generation in the EU. However, this value varies from country-to-country: in Finland 19% of the electricity is produced from fossil fuels whereas in Estonia it represents the 85% of the total production. Therefore, countries with high electricity production from fossil fuels will have electric mixes with high primary energy factors (PEF) and GHG emission coefficient (GHGC). This fact suggests that, in some countries, the use of high-efficiency natural gas boilers could be a better approach to reduce the GHG compared to the electricity consumption of a heat pump.
The performance of HPs at low temperature environments. In these cases, the performance of air source HPs is often affected by problems such as large compression ratios, low heat production and frosting [
16,
17]. Thus, the lower performance of the HPs in low temperatures would lead to a higher energy consumption and therefore less competitive system compared to conventional technologies.
Several studies have been carried out where HPs and fossil fuel heating systems are analyzed. Ala et al. [
18] examined the performance of an air-to-air HP under different operating condition both energy- and economic-wise as an alternative to domestic gas boilers. The costs for the heating system installation and electricity and/or gas bills were combined with the benefits with special emphasis in new tariffs and tax credit programs. However, this study does not take into account the carbon footprint of both technologies and is only limited to the Italian context. Furthermore, the estimation of primary energy savings performed in [
19], show that if 25% of the Italian dwelling surface is heated by heat pumps a reduction of 1.7 Mt of carbon emissions can be achieved by 2024.
Replacing coal boiler heating systems with CO
2 heat pump systems is economically and environmentally feasible in China according to [
20]. Zhang et al. [
21] presented a plausible pathway to help in the decarbonization of the heating sector of Beijing. Authors suggest that if all the proposed targets are met, the total CO
2 emissions of the city will be 21% lower in 2030.
Jarre et al. [
22] proposed a calculation method to obtain the hourly primary energy factor of the electricity supplied by the power grid. Result show that due to the low electricity primary energy factors obtained and the high COP of the heat pumps, in all the considered cases the HPs provide potential primary energy savings compared to natural gas boilers.
Bergamini et al. [
23] analyzed the thermodynamic competitiveness of a high temperature vapor compression heat pump to substitute conventional boilers. The paper shows that achieving very high temperatures could be challenging with the actual available technologies. Nonetheless, with future technological developments, this type of heat pump has a favorable potential to substitute those devices using the working fluid R718.
After reviewing the state-of-the-art, it is possible to point out that most of the previous works are based on specific examples considering either a single climate or a single heating system. Moreover, they do not analyze multiple dimensions for the comparison of electric and non-electric heating technologies.
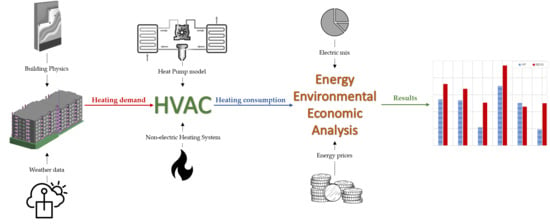
This article analyses air-to-air HP as an alternative to non-electric heating systems from and energetic, environmental and economic perspective. The study was run on a multifamily residential building in six different European countries to account for dissimilar outdoor conditions and electric mixes. The aim of this comprehensive paper is to identify plausible heating production strategies which will rump up the decarbonization of Europe in the short term. Additionally, this will help to secure sustainable energy at an effective cost considering stricter technical standards. The mentioned goals were set up based on the following dimensions: technical, energy intensity, carbon footprint and economical.
To make a comprehensive study that can be applied to the different regions in Europe, six countries with different energy mixes, relying in different non-electric heating systems (NEHS) and with different climates were selected: Estonia, Finland, Greece, Serbia, Spain, UK. These selection covers Nordic, Mediterranean, south continental and oceanic climates. Moreover, their energy mixes go from a coal presence of 78% (Estonia) to 6.7% (UK). Regarding the NEHS, they go from district heating in Finland and Estonia to Oil boilers in Greece.
In order to characterize, assess and compare the performance of a HP and the NEHS of each of the selected countries, a proper physical model of a HP was developed to be simulated through Engineering Equations Solver (EES). To feed the model, an important effort to use real data from open sources was carried out. In the case of the climatic data, the weather database Copernicus was used [
24]. In addition, the physical characteristics of the building typologies and the specific characteristics of the countries’ electric mixes were estimated from open data as it is explained below.
The paper is structured in four sections, starting with this introductory
Section 1.
Section 2 presents the used methodology.
Section 3 contains the results from the economic, energetic and environmental analysis. Finally, in
Section 4 the conclusions are presented.
2. Methodology
To evaluate the suitability of HPs versus NEHS within the tertiary sector, energy, economic and environmental factors should be considered. The analysis of the mentioned factors involves a detailed estimation of the energy consumption, the energy price for the various energy carriers (gas, electricity, oil or HD) and PEF and GHGC of the different electric mixes and heating systems. Accordingly, a methodology based on the following steps was carried out.
2.1. Heating Demand Calculation
The first step is to estimate the heating demand of the reference building on an hourly basis during the heating period (1 October to 31 March) for the selected countries. The study considered that constant comfort temperature (20 °C) was maintained throughout the heating season, hence when the outdoor temperature is lower than the comfort temperature heating is needed. Moreover, additional terms determining the heating demand are the following:
Heating losses through the building envelope;
Heating losses due to ventilation and infiltrations;
Internal and external gains.
All these terms can be aggregated, as proposed by Izquierdo et al. [
25], in a total heating demand term as follows:
where the heating load (
) is determined by the overall heating transfer coefficient
, the indoor temperature
and the outdoor temperature
).
2.1.1. Estimation of the Overall, Heating Transfer Coefficient
First, the building typology needs to be selected which, in the case of the current study, is a retrofitted large size multi-family residential building described in [
26]. A retrofitted building was selected attending to the premise “energy efficiency first”, where reducing demand (passive strategies) is a priority over reducing consumption (active strategies).
Once the building type is chosen, an exhaustive characterization of the selected set of scenarios must be done. A desktop research is carried out to gather the required data used for the simulation of each scenario. This research is based on the TABULA [
27] and INSPIRE [
28] databases, as proposed in [
26].
Table 1 shows the U values of different building elements selected from the databases for each country. Following this methodology, it is possible to create a virtual archetype of the retrofitted building modifying its characteristics for each of the six selected climates using the data from the references.
To estimate the
of the studied building for each country, the building was simulated with the commercial software DesignBuilder. The worst-case scenario of each climate is simulated where no internal or external gains are considered, and the outdoor temperature is set to the minimum of the year. From the simulation, different
values are obtained, depending on the orientation of the different heating zones of the building. However, for the sake of simplicity, a single
value, averaged over the different zones of the building, is considered for each of the six climates, as shown in
Table 2.
2.1.2. Outdoor Temperature
On the other hand, to obtain the hourly
throughout the heating season climatic data coming from the open source Copernicus was used. The Copernicus Open Access Hub (previously known as Sentinels Scientific Data Hub) provides complete, free and open access to the climatic data from a family of dedicated satellites: Sentinel-1, Sentinel-2, Sentinel-3 and Sentinel-5P. These data are accurate and updated continuously, thus providing reliable and updated data. To represent the country, the climatic values for the capital city of each country were selected, obtaining the values specifically from the Copernicus dataset ERA5 [
29].
Once the overall heating transfer coefficient and the outdoor temperature are obtained, it is possible to calculate the heating demand that needs to be covered by the heating systems under study.
2.2. Heating Systems Models
Once the hourly heating demand is obtained in each country, the energy consumption needs to be calculated. Therefore, both NEHS and HPs must be characterized.
2.2.1. Non-electric Heating System
Regarding the NEHS of the given countries, the most common heating system is selected based on statistical values from [
30]. The most common heating systems of each country are shown in
Table 3 along with their respective energy heating factor, which represents the ratio between the paid energy carrier and the delivered heat.
While district heating provides heat for more than 50% of inhabitants in Estonia, Serbia and Finland [
31], in the UK and Spain a natural gas boiler is used most commonly. In the case of Greece, most households heating demand is covered by oil boilers. For the district heating, the energy heating factor is set to 1—without considering any distribution losses and both boilers are set to the typical efficiency values [
32].
2.2.2. Heat Pump
In order to characterize the hourly performance of the HP under different working outdoor temperatures (for each of the selected countries), a complete model of the system is developed using the EES (Engineering Equation Solver) software. As mentioned in
Section 2.1 the indoor temperature is constant, therefore, the pressure and temperature of the condenser are also constant.
First, an ideal thermodynamic single stage cycle of an air-to-air HP is modeled. Second, the COP of this ideal HP is calculated under the pressure and temperature conditions stablished in the EN 14,825 [
33]. Given that the ideal cycle is far from reality, the ideal COP calculated in this study is modified to obtain a more realistic value taking into account the following criteria:
The working performance of the compressor is not isentropic and its efficiency is highly dependent on the pressure ratio between the inlet and outlet of the compressor. In order to express the influence of the isentropic efficiency, the relation established by [
34] is applied;
During the real cycle, the heat exchange in both condenser and evaporator is not 100% efficient and there are thermal losses during the process. There are also pressure and heat losses along the pipe circuit. Therefore, a corrective factor is added to the model, calculated from the comparison of the previously calculated ideal COP with several commercial HPs [
35,
36,
37,
38,
39,
40,
41,
42];
Finally, commercial HPs are tested under controlled conditions (EN 14,825) to calculate their performance. These conditions cannot be fully replicated in real installations at homes because of practical issues, such as the topology of refrigerant distribution between the evaporator and the condenser (outdoor and indoor units). Manufacturers typically indicate the COP for a 5 m pipe length of refrigerant distribution, while domestic installations may require 10–15 m, so technical data books for installers provide a capacity correction [
43]. For the present model, an average capacity correction of 90% was considered.
Applying the considerations explained before to the ideal model of the HP at different operation conditions, the following polynomial regression of the COP is obtained, as a function of
for an air-to-air HP with R32 working fluid:
2.3. Economic Analysis
After studying different electricity tariffs [
44] the economic analysis is performed using a Real Time Price (RTP) tariff. Since energy retailers may offer different tariffs for each user, it is decided to compose a synthetic electricity tariff based on both a static and a dynamic element.
Static element: The static part of the synthetic tariff considered for the analysis are average values of the electricity (all taxes and levies included) for households consumers for 2018 provided by EUROSTAT [
45].
Dynamic element: The hourly variation of the cost of each electric kWh is given by the hourly variation of the wholesale electricity market of each country. These evolution on price is open data and can be consulted in each Power Exchanges: OMIE [
46] in Spain, Nord Pool [
47] in Finland and Estonia, HEnEX [
48] in Greece, EPEX SPOT [
49] in the UK and SEEPEX [
50] in Serbia. This hourly variation was normalized using the average price provided by Eurostat for electricity consumption in households. The evolution of the estimated prices for each country is summarized in
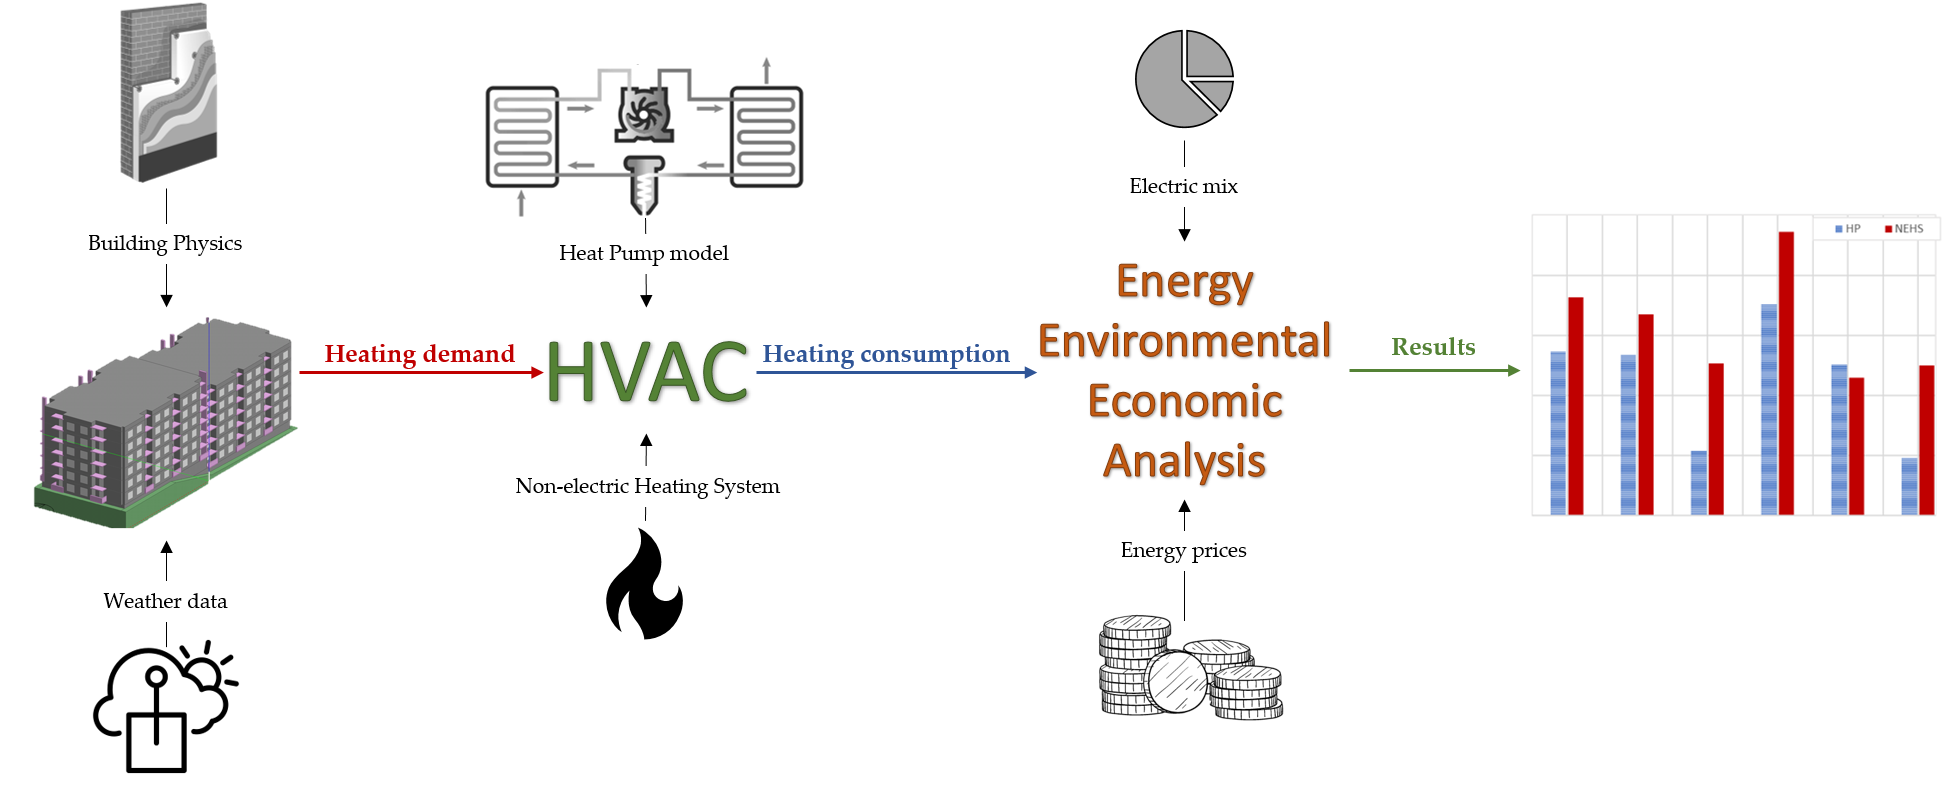
Figure 1.
In
Figure 1 it can be observed the variety on the electric kWh per country, where Spain is paying approximately double than Estonia and triple than Serbia.
On the other hand, even though fuel and district heating prices may vary throughout time [
51], retailers do not offer RTP tariffs for domestic consumer, therefore a fixed price is used based on the average values available for households consumers for 2018 provided by EUROSTAT [
45] in the case of the natural gas; the district heating tariffs are taken from [
52] for Estonia, [
53] for Serbia and [
54] for the case of Finland; the price of the oil in Greece is taken from [
55]. These prices are used for the comparison with the synthetic electricity tariff along with a fixed electric price based on the static element presented above.
2.4. Energy Analysis
In order to compare the energetic impact of the heating provided by HP and NEHS, the total primary energy consumption of both technologies must be assessed. The Energy Performance of Buildings Directive (EPBD) [
56] defines the primary energy as the energy that has not been subjected to any conversion on transformation process.
Under this context, the method for calculating the PEF for fuels is straightforward, while the calculation of PEF for the electricity is more complex because different energy sources and generation technologies are involved and therefore the individual PEF of all the energy sources involved in the energy mix needs to be determined before calculating the global PEF of each national energy mix. After evaluating different calculation methods [
57,
58], the “Physical content method” is chosen based on the definition that primary energy is “equivalent at the first point downstream in the production process for which multiple energy uses are practical” [
59]. Additionally, in the case of the power plants, a conversion efficiency is added [
60], results are shown in
Table 4.
Once the individual PEFs are obtained, an extensive desktop research was carried out on the different electric mixes of the European countries selected for the present study. The calculation of the PEF of each energy mix is based on a simple static approach, using the annual share of each energy carrier on the overall electric mix and the individual PEF of each energy carrier. The electric mix of each of the six countries studied comes from the “energy statistical country datasheets” published by the open source EUROSTAT [
61].
The PEF of the NEHS is based on the same approach using the physical content method and adding a conversion efficiency for the different boilers. For both countries with DH in particular, this factor was taken from [
31].
Table 5 summarizes the PEF obtained for the different countries, where it can be observed the significant difference on this factor for the different countries, from a very low primary energy network in Greece to a high PEF in Estonia and Serbia.
The high presence of coal power plants in Estonia (78%) and Serbia (70%), with low efficiency, implies that these mixes have a higher PEF that the non-electric heating systems based on fossil fuels.
2.5. Environmental Analysis
The environmental analysis for the electricity and the NEHS GHGC followed the same methodology as the energy analysis applying the GHGC from [
62]. In the case of the DH from Finland and Estonia the reference values are taken from [
63,
64] respectively.
Table 6 summarizes the GHGC obtained for the different countries.
In those countries with high presence of fossil fuel plants in the national electricity mix, the GHGC is higher that the NEHS based on fossil fuels. Additionally, in the case of Finland, nuclear power has an intensive presence in the electricity production with 33% of share; the high PEF and low GHGC assigned by the bibliography to the nuclear power makes Finland one of the countries with the highest global PEF whereas its GHGC is the lowest considered.
3. Results and Discussions
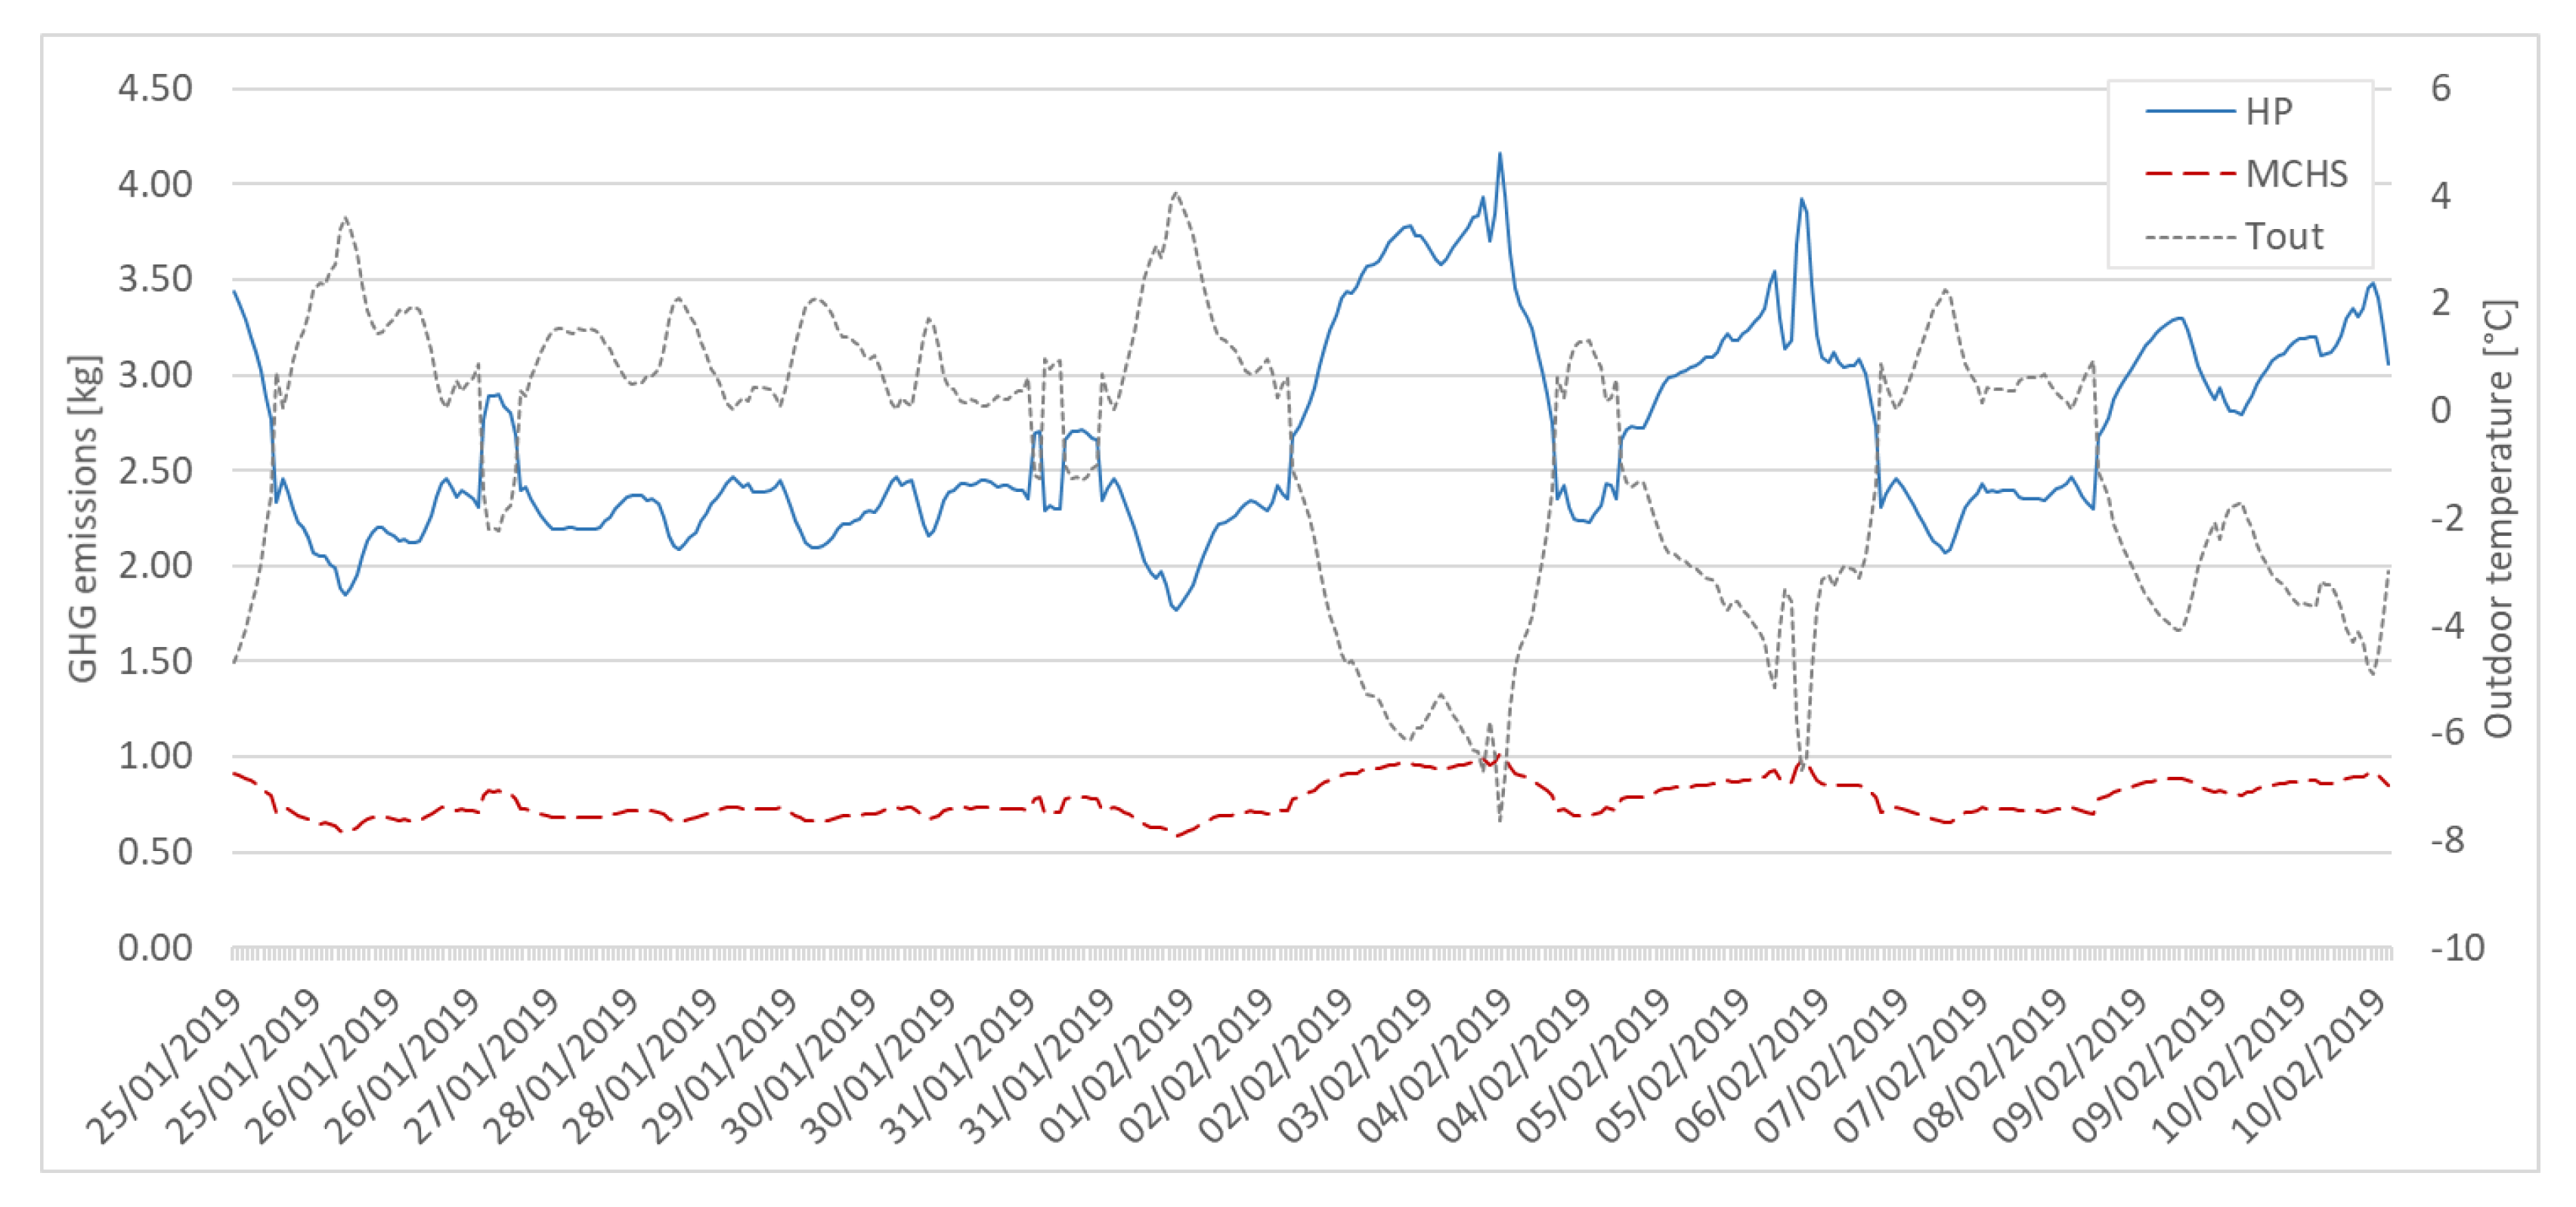
In the present section, the energy, economic and environmental analysis of the proposed configurations are discussed based on the simulation results. In this study, the effects of the energy carriers’ prices, PEF and GHGC are examined for the heating period in the simulated building. The results obtained for all the locations analyzed are shown for the entire heating season. However, two weeks-time span is also displayed to make the data fluctuation clearer. Estonia conditions from 25/01/19 to 10/02/19 are selected for this purpose.
3.1. Technological Analysis.
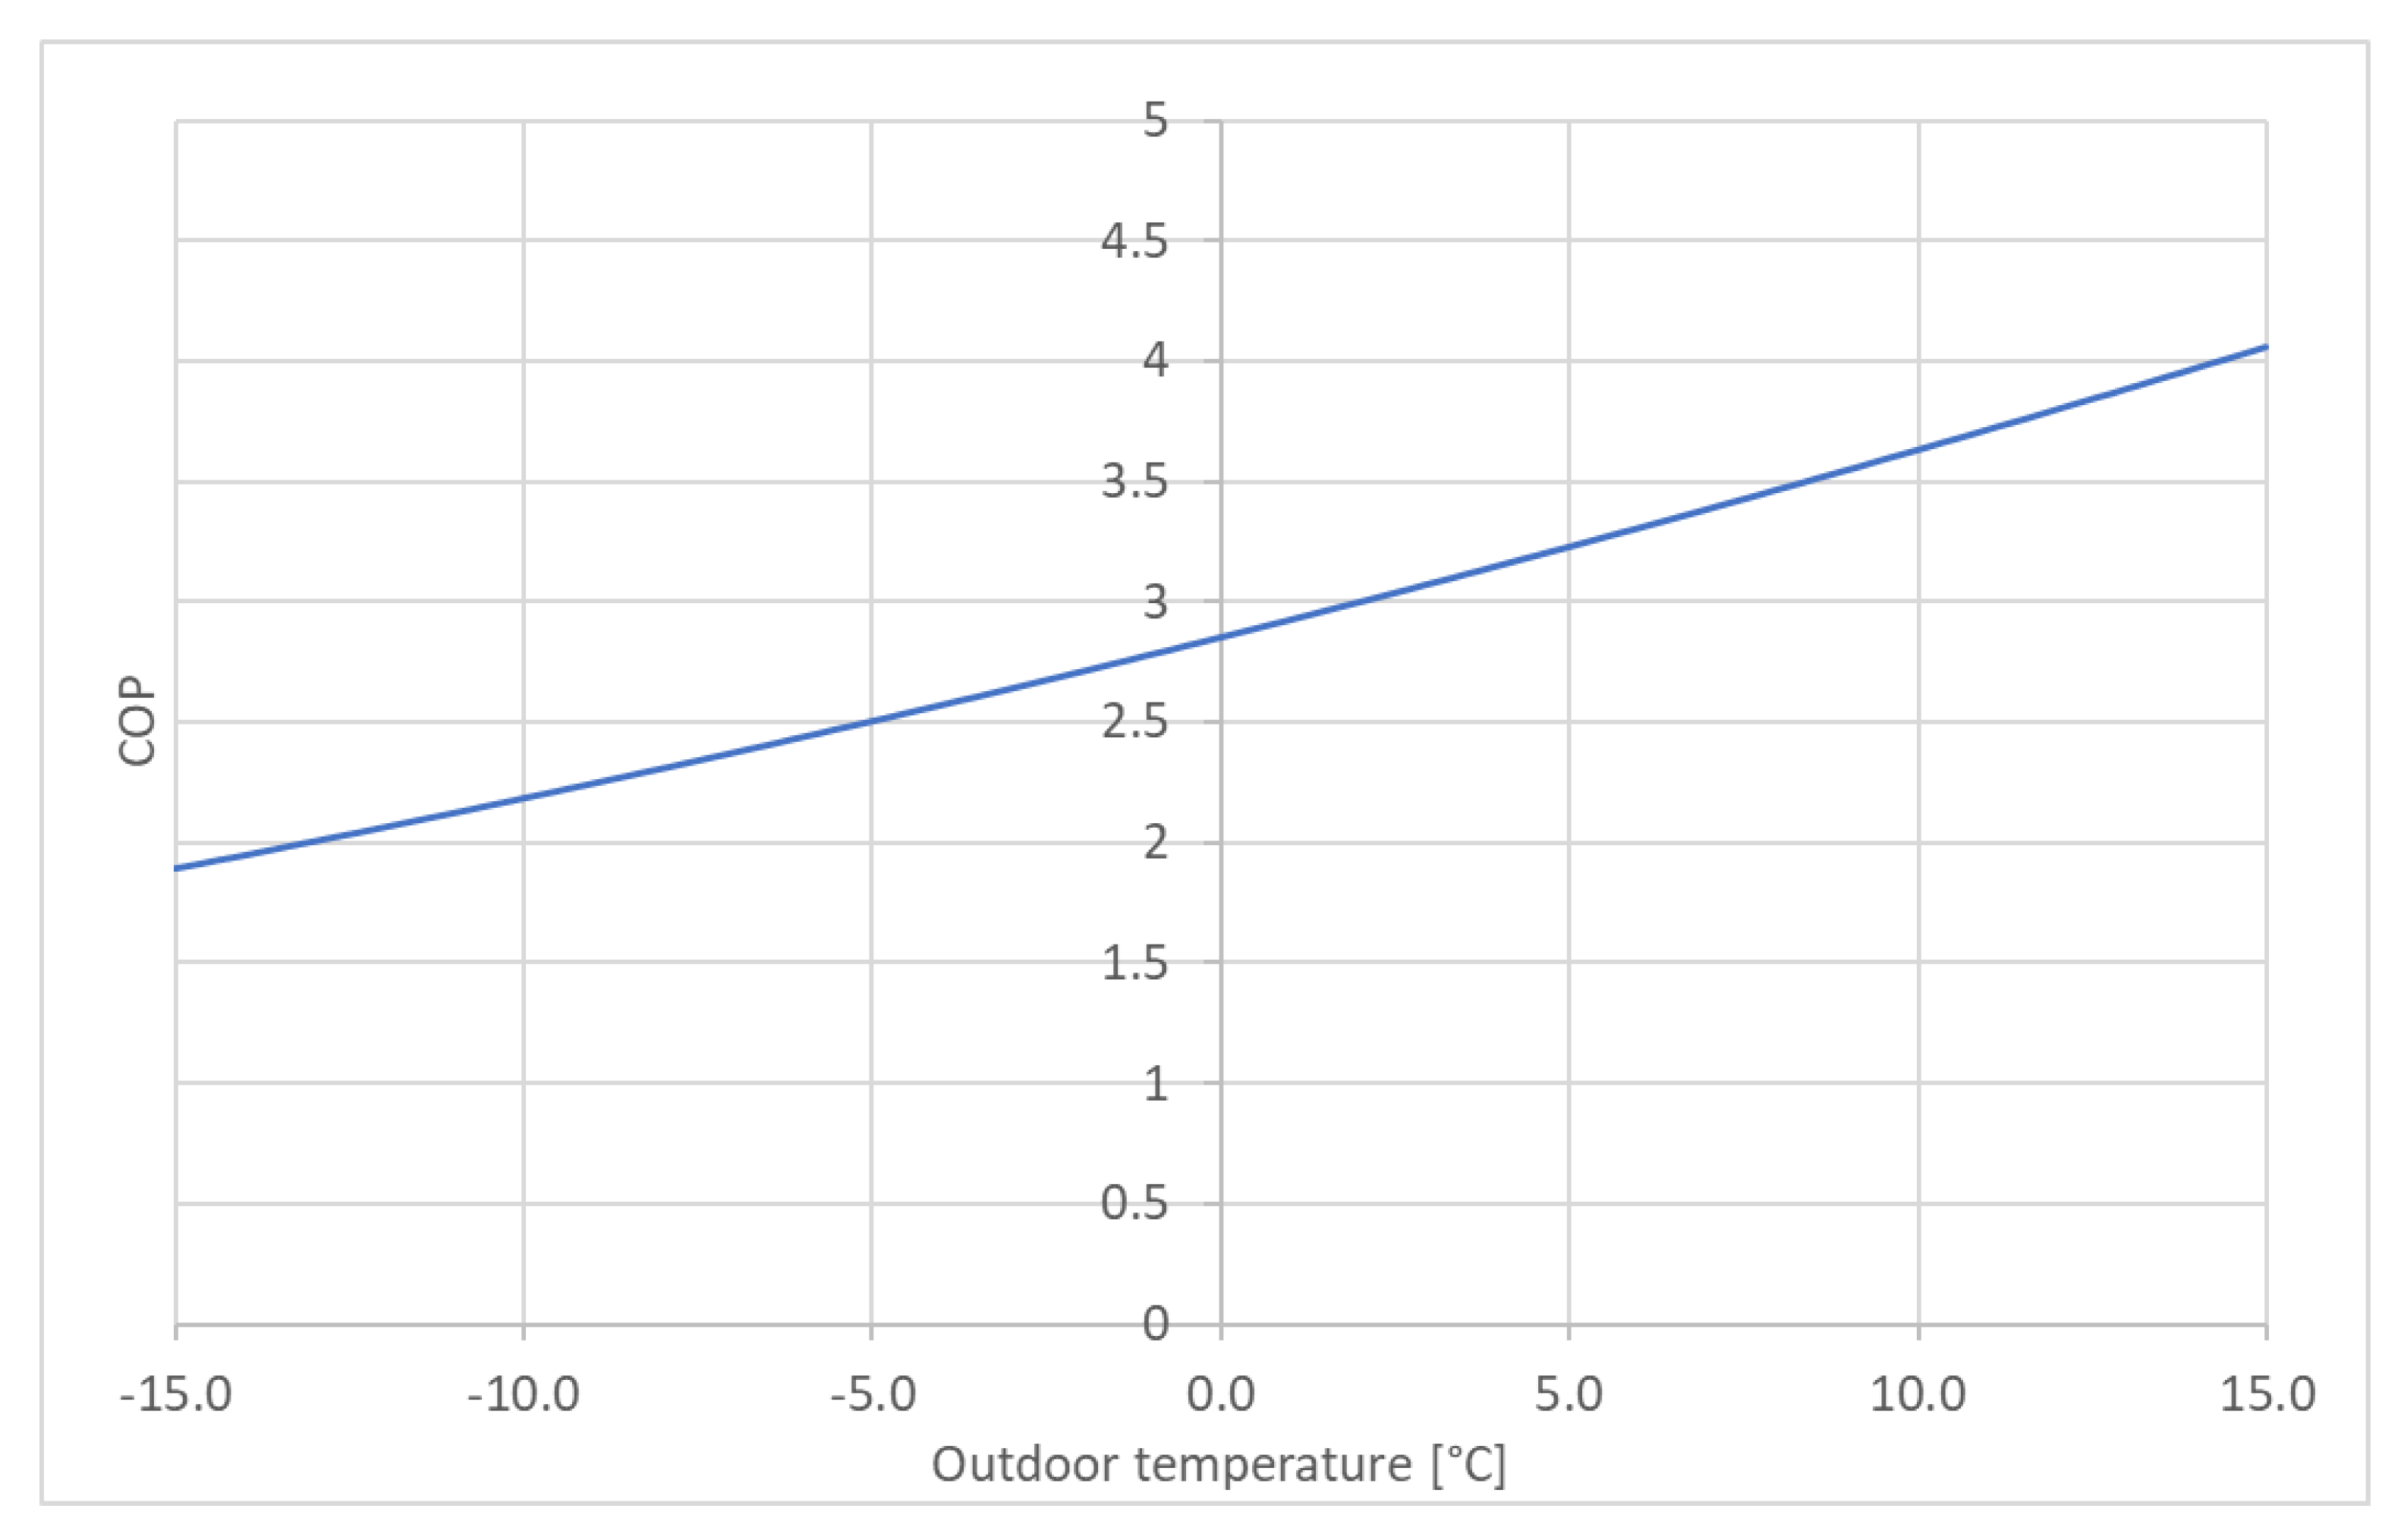
In the following picture it can be observed the COP of the HP at different outdoor temperatures.
Figure 2 shows the values of COP for the range between the maximum and minimum temperature occurred in the six countries under study in the heating period.
In figure it can be observed the dependence of the COP of the HPs vs. the outdoor temperature. The minimum value is at –15 °C, with a value of 1.9, whereas the maximum performance occurs at the maximum temperature studied, this is, COP = 4.1 at
= 15 °C. It should be noted that the results obtained by the polynomial regression are similar to the ones obtained in different experimental studies in the literature [
65,
66]. Thus, it can be concluded that such approximation is suitable to estimate the COP for different outdoor temperatures.
3.2. Economic Analysis.
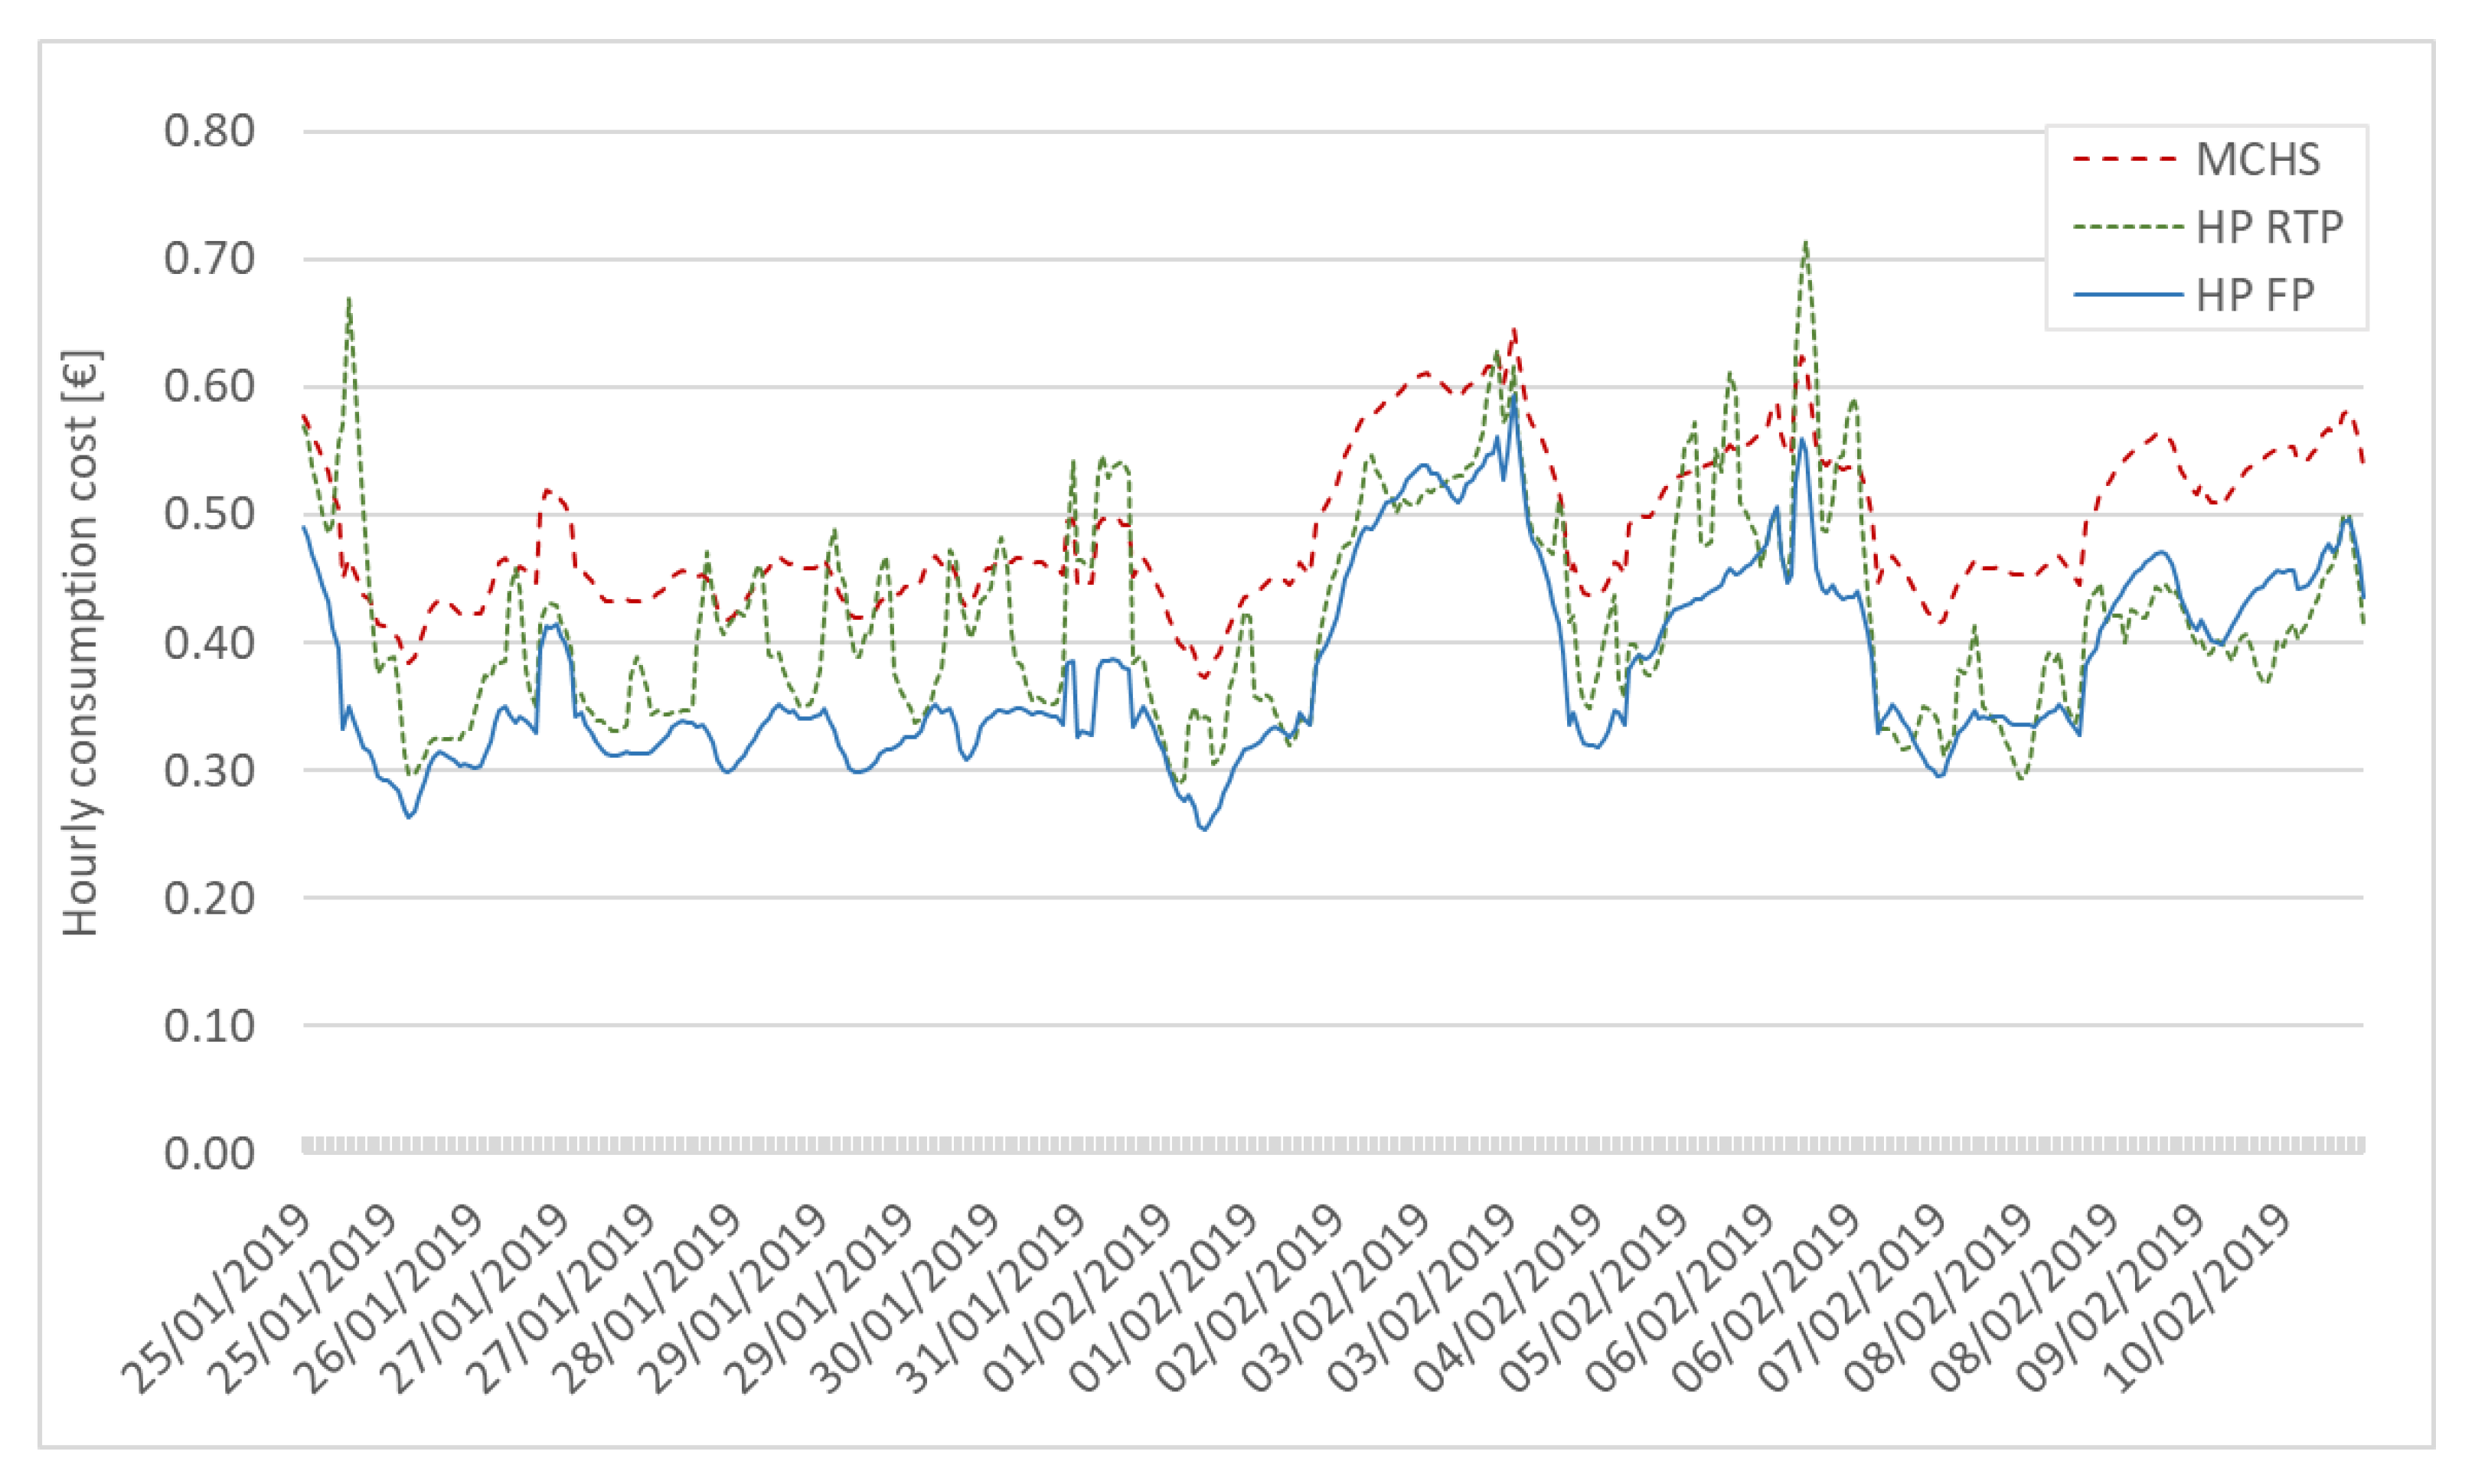
In this section, the economic analysis of the different heating technologies studied is presented, evaluating the costs to cover the heating demand for the considered period. As an example of the multiple country analysis,
Figure 3 shows the dynamic behavior of the cost required to cover the heating demand for Estonia. This figure includes three concepts:
Hourly cost for the district heating as NEHS;
hourly cost for HP at fixed price (HP FP);
hourly cost for HP at real time price tariffs (HP RTP).
The costs depend fundamentally on the outdoor temperature through the heating demand and the COP of the HP. In the case of HP RTP, the hourly cost is also directly influenced by the changing price. It can be observed that the global cost for NEHS is higher for Estonia.
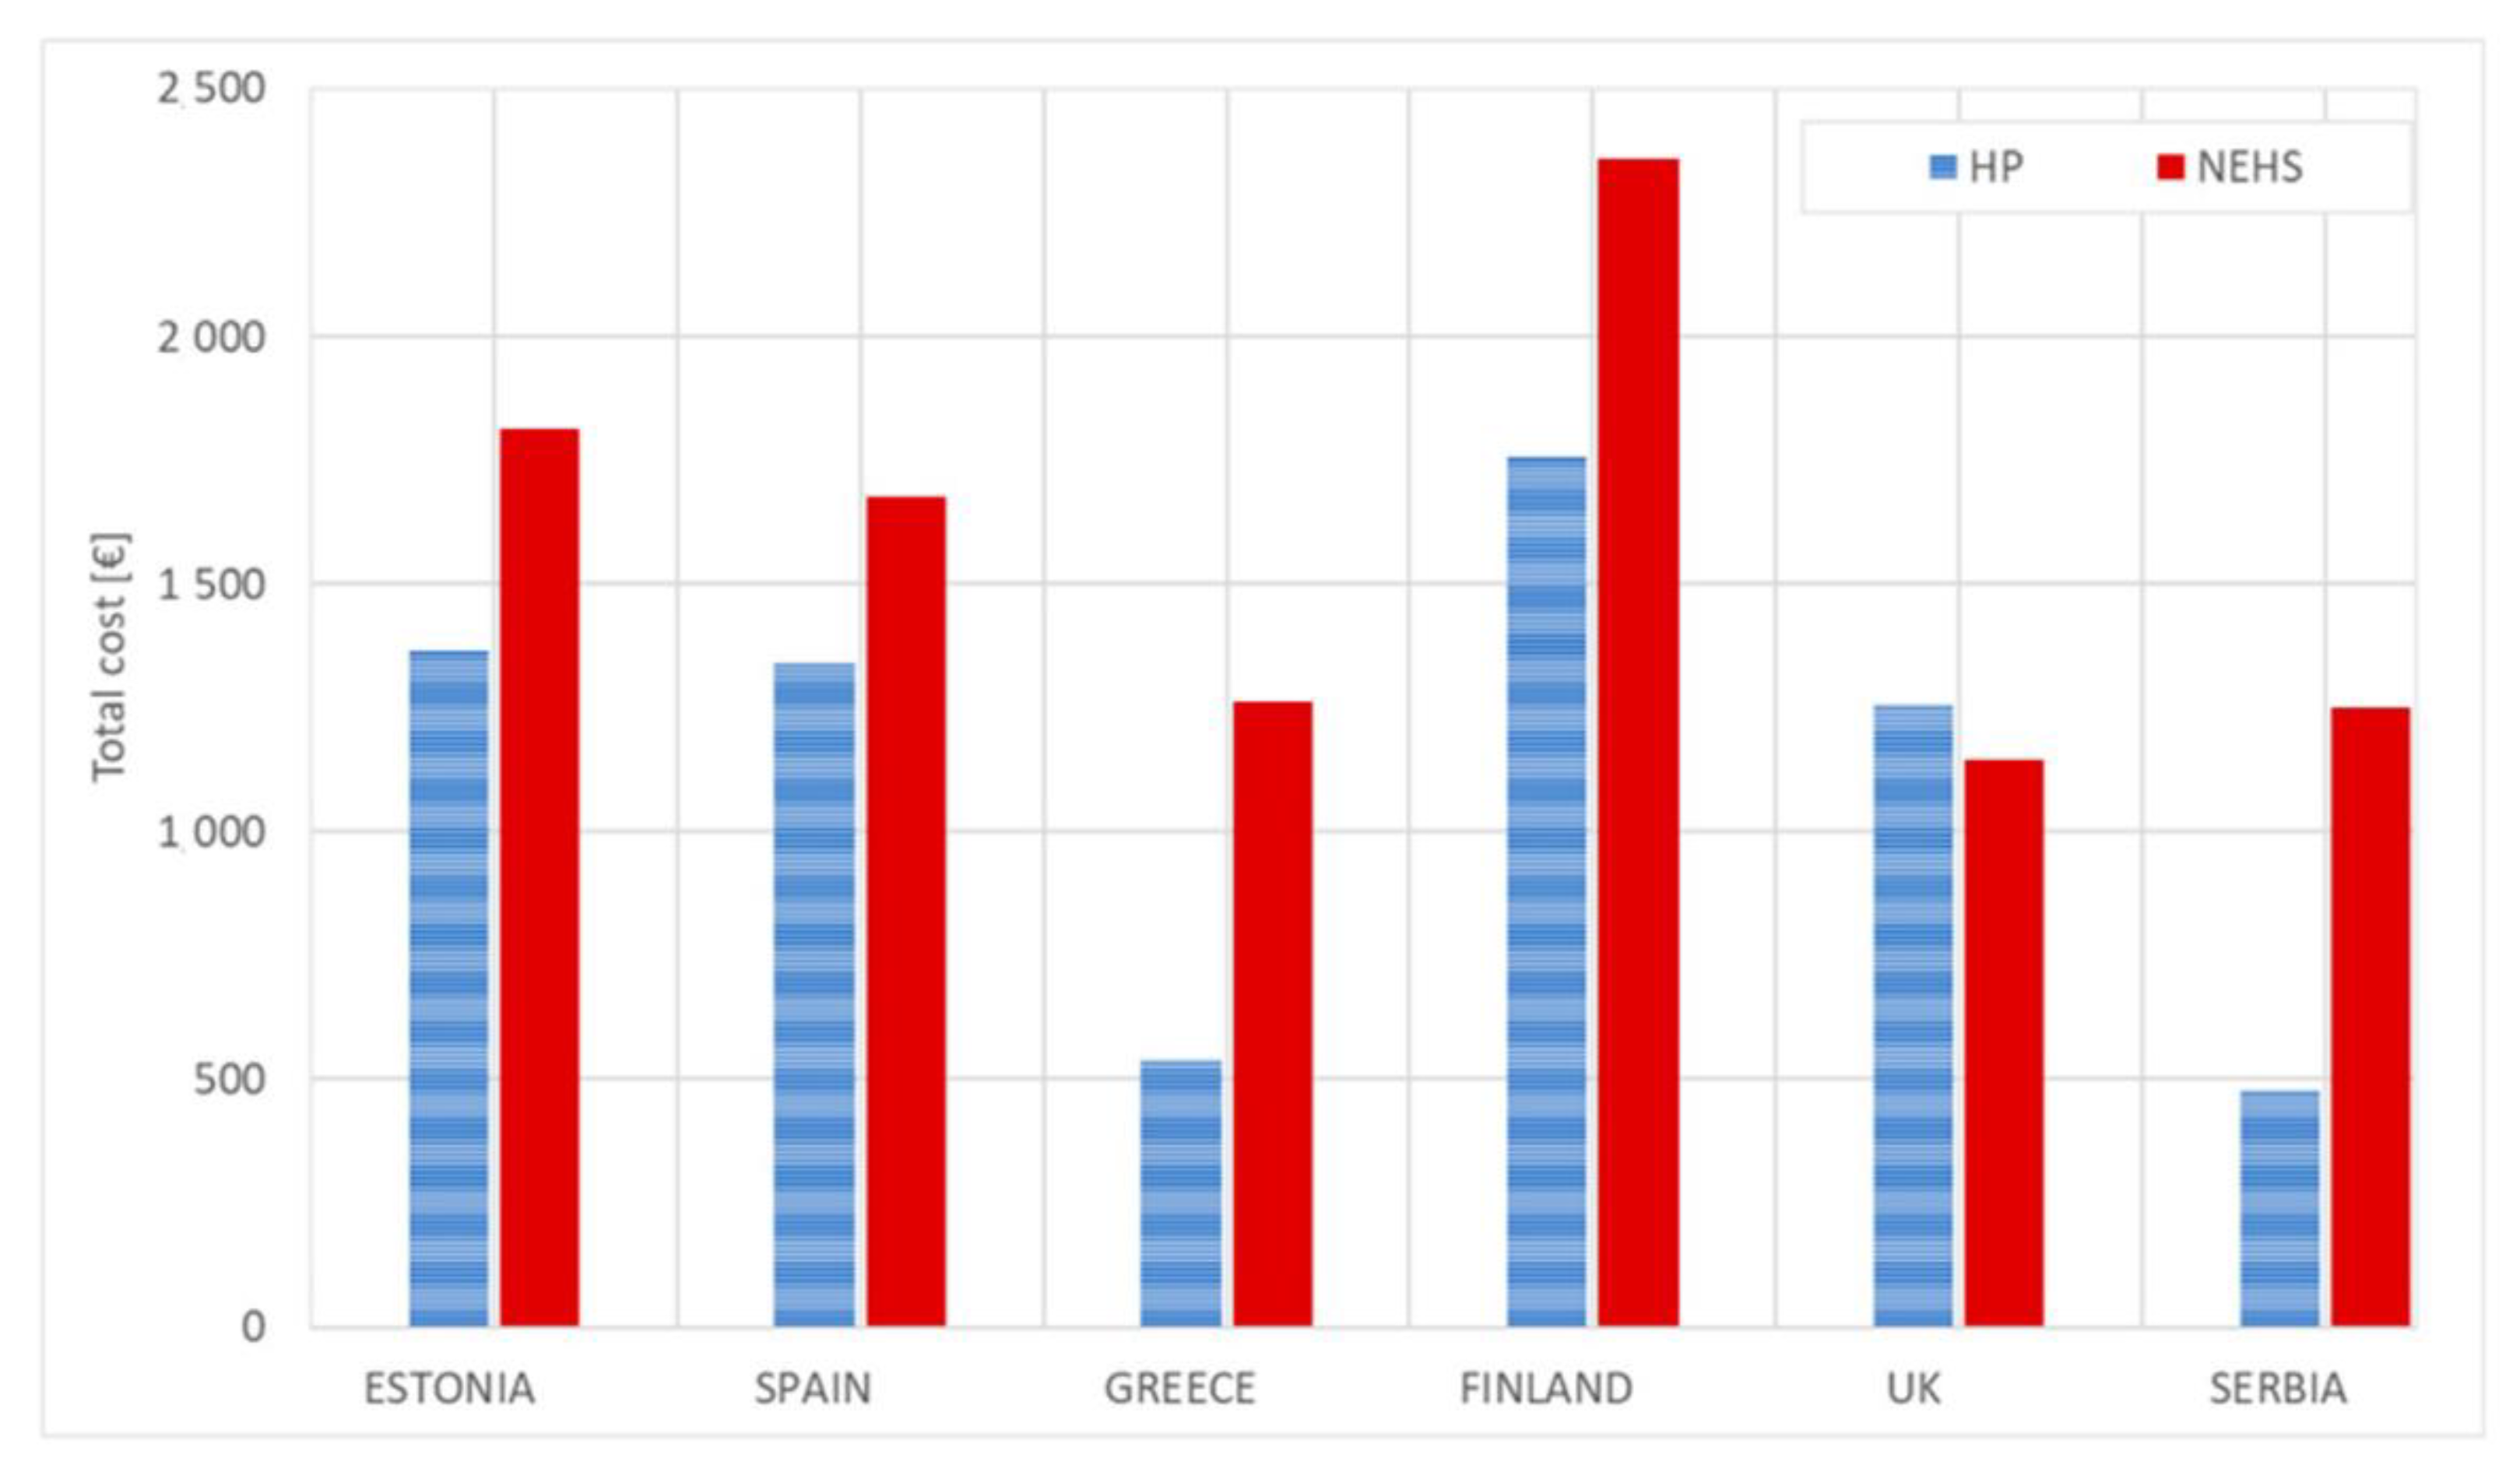
Furthermore,
Figure 4 shows the total costs required to cover the heating demand of the six months for both technologies, HP and the NEHS of each country for a 80 m
2 dwelling. Since the RTP is made based on the mean annual price used for the flat tariff, the total costs of the heating period studied are almost the same with both tariffs.
Greece and Serbia are the countries where the costs required to cover the heating demand with HPs are lower, around 500 €, while NEHS required over 1200 € to cover the same demand. This is because of the mild winter of Serbia and Greece; the higher temperatures lower the heating demand and better COPs are obtained. On the other hand, Finland is the country where the costs required to cover the heating demand with HP are higher, above 1600 €, while NEHS required over 2300 € to cover the same demand. UK is the only country where it is more expensive to cover the heating demand with the HP, being almost 100 € over the cost of the NEHS, a natural gas boiler in this case.
3.3. Energy Analysis
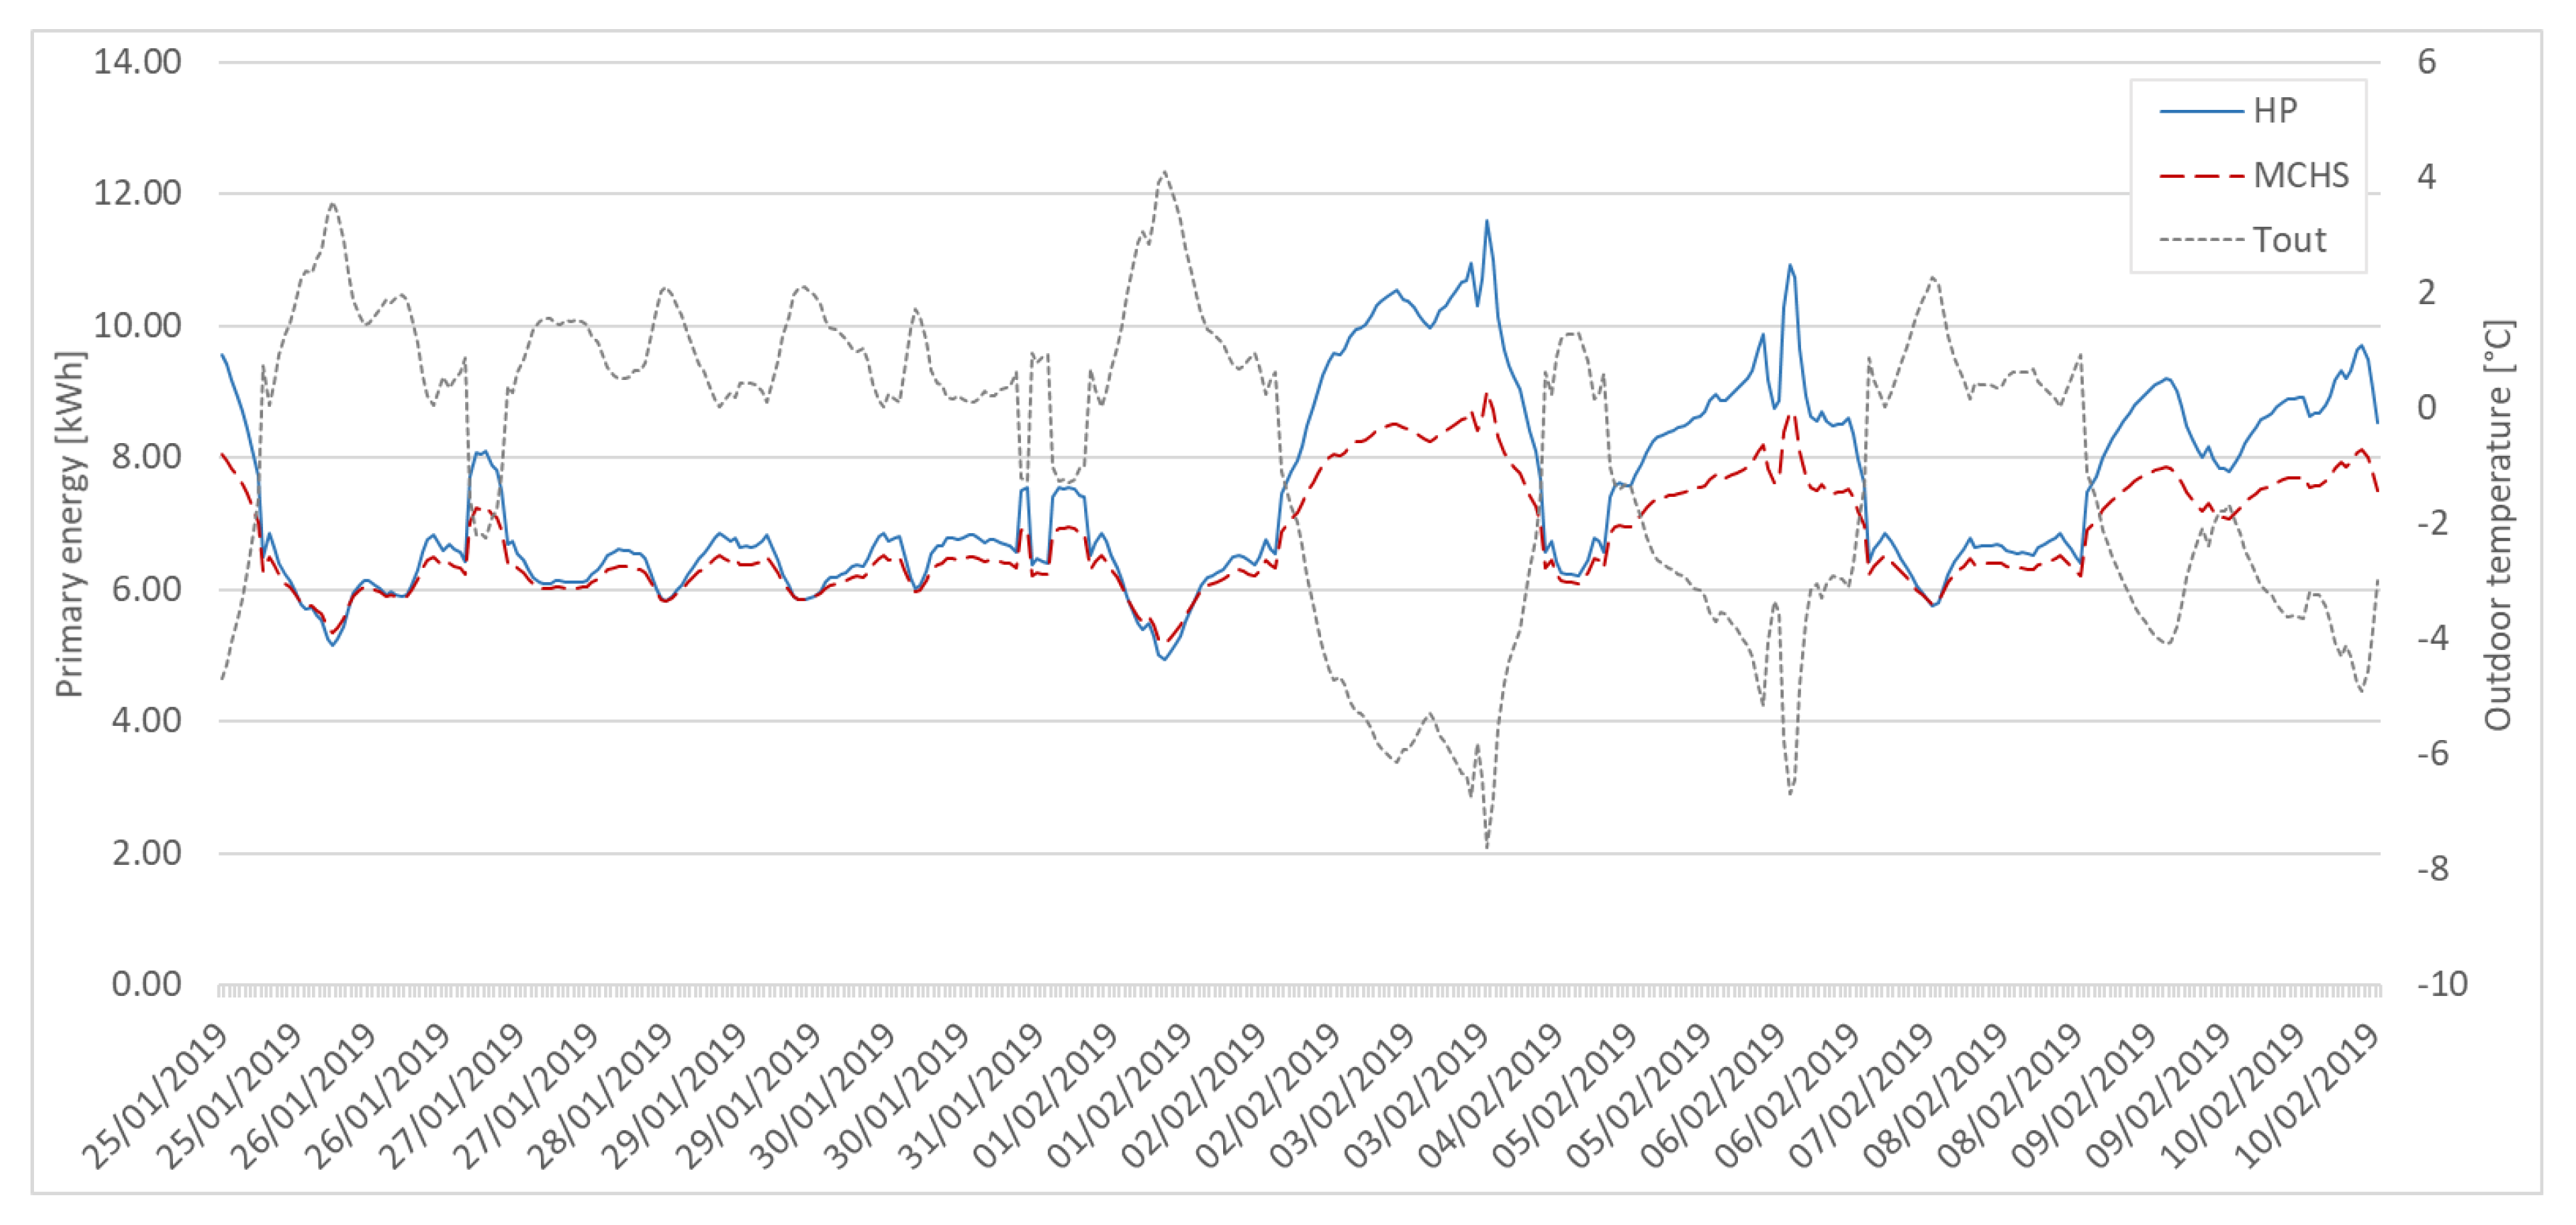
This section presents the analysis of the primary energy consumed by the different heating technologies to cover the heating demand for the considered period. The energy analysis shows when is more convenient to cover the heating demand with each system in terms of primary energy. As an example,
Figure 5 shows the primary energy required to cover the demand in Estonia from 25/01/2019 to 10/02/2019 for both technologies, NEHS (DH in this case) and HP, vs. the outdoor temperature. It can be observed a high influence of the outdoor temperature: at low temperatures, the HP has lower COP and therefore higher primary energy consumption; at high temperatures the HP has a higher COP and the difference on the primary energy intensity decreases between both technologies.
In the case of Estonia, the high PEF of the electricity mix implies that a high COP of HP compared to NEHS does not outweighs the high intensity on the fossil fuels of the mix. Only when the outdoor temperature is over 2 °C is more convenient to use HP.
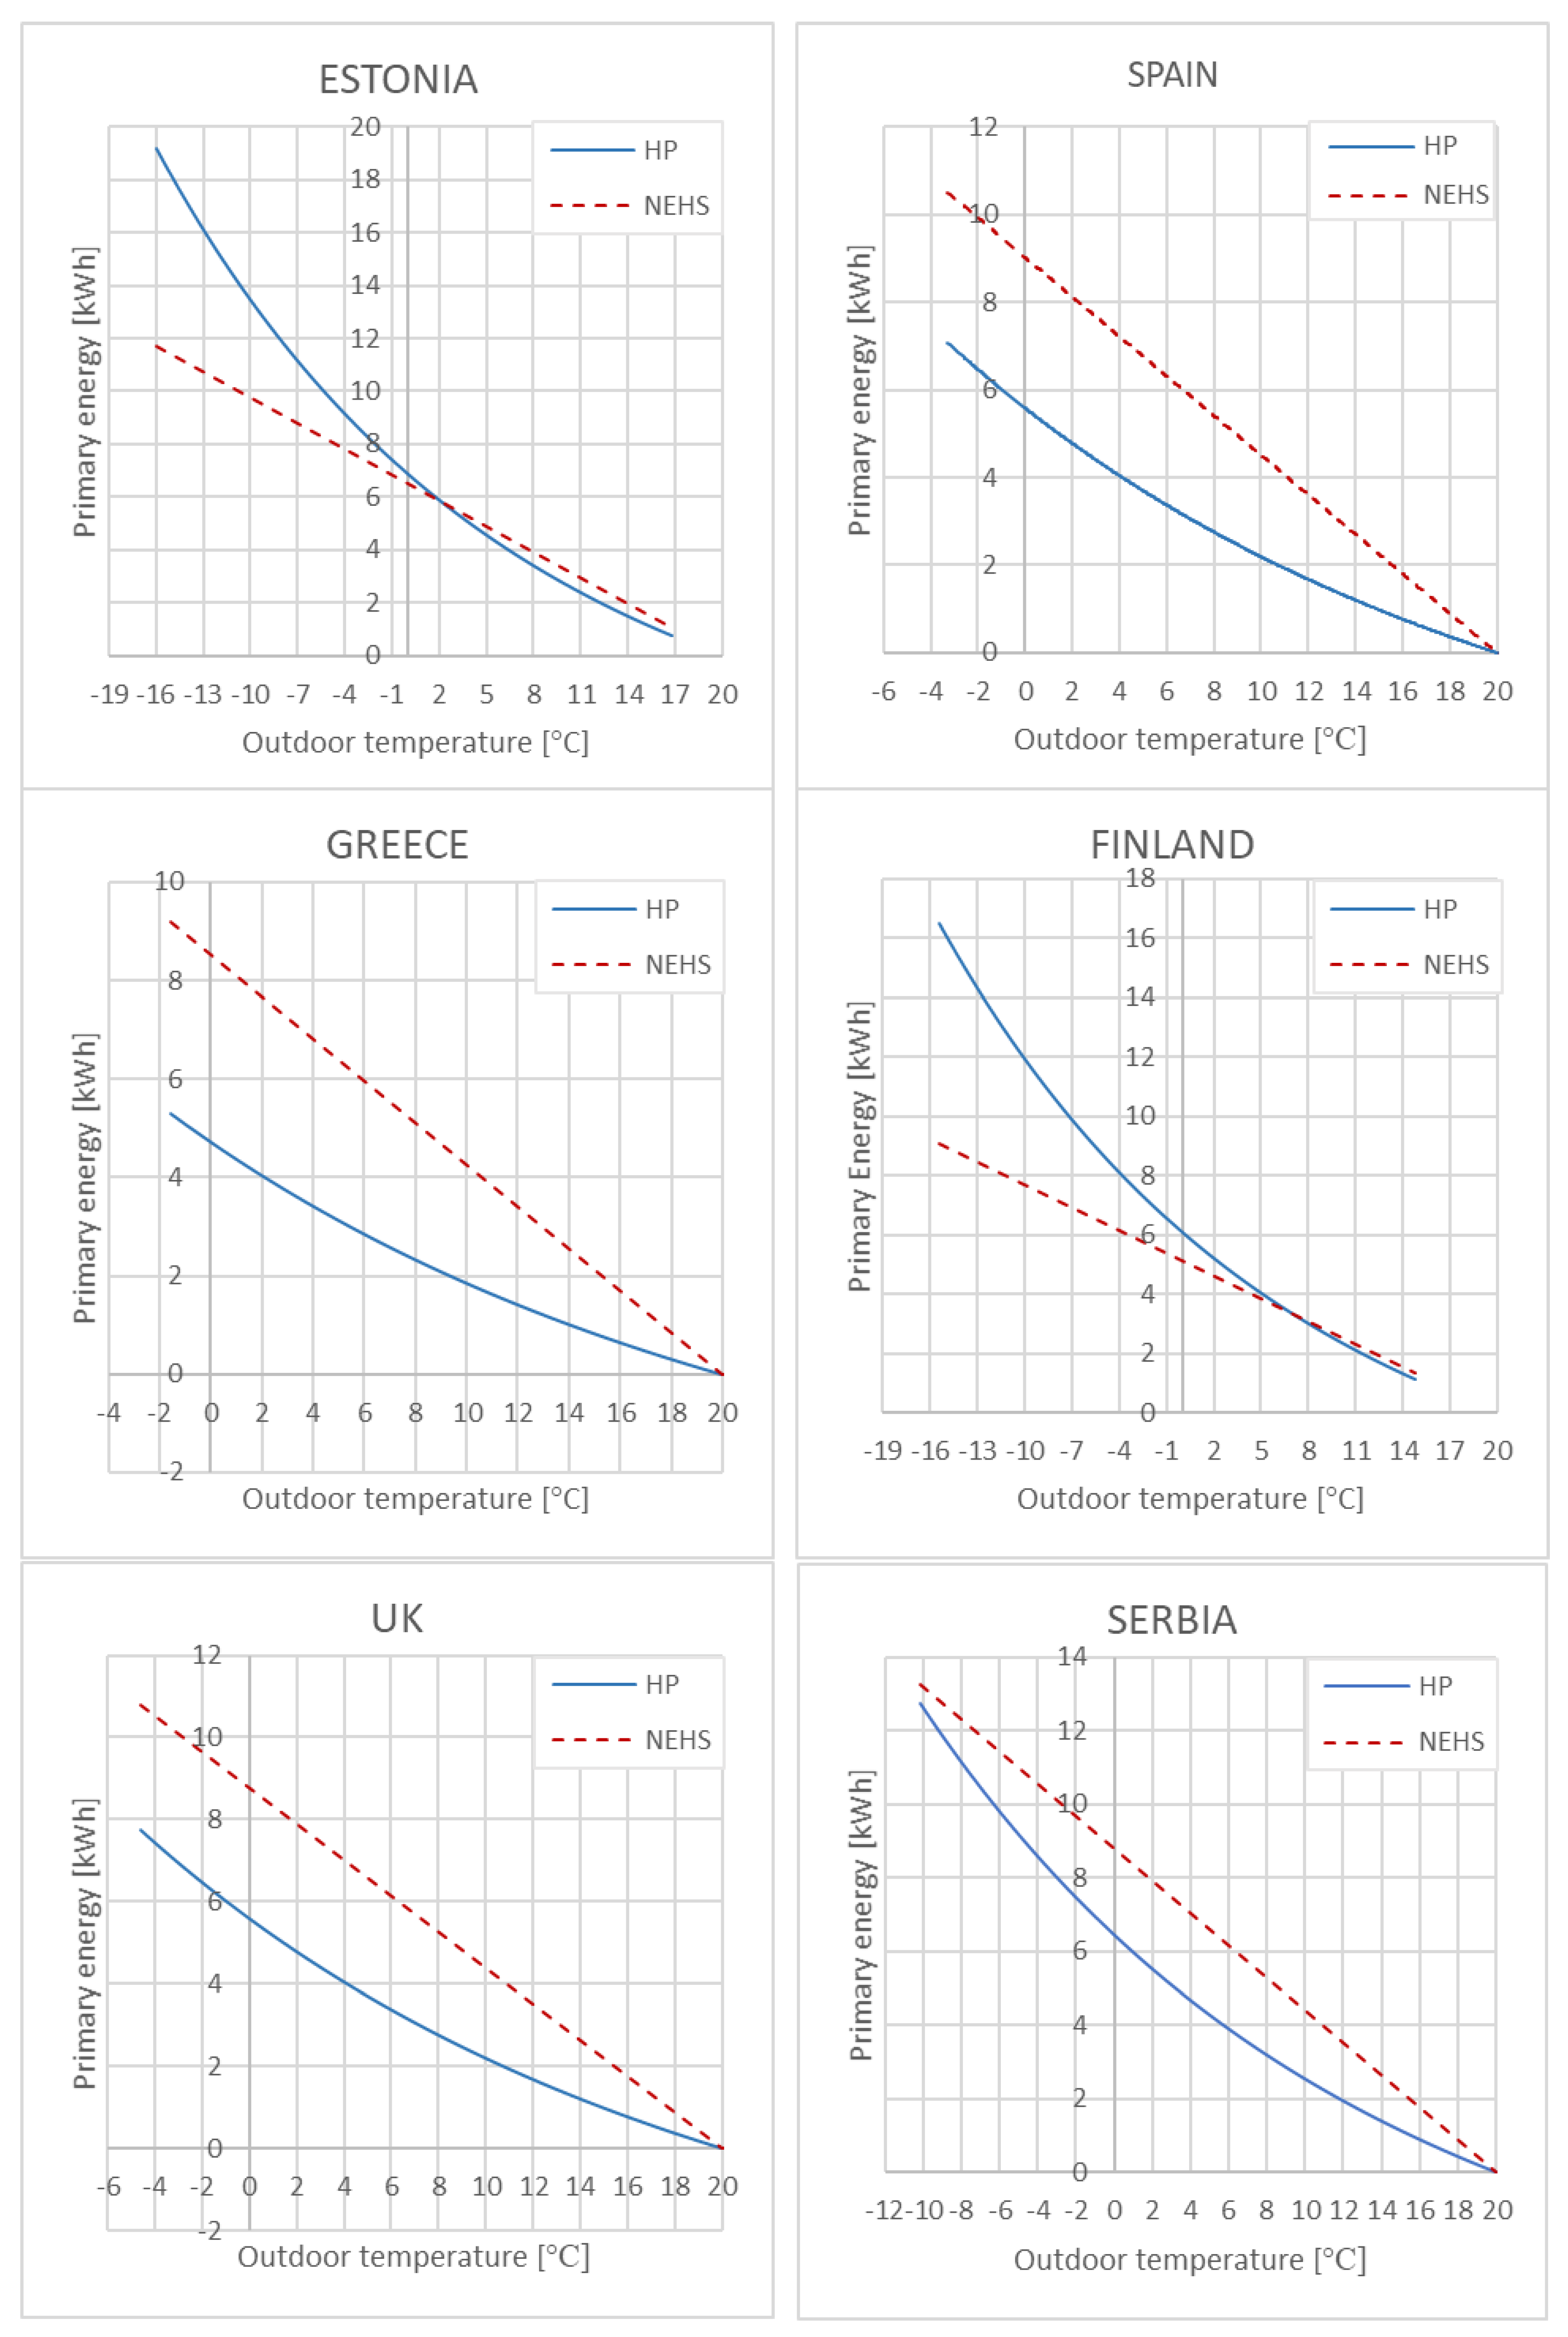
Figure 6 analyses the primary energy intensity versus the outdoor temperature to cover the heating demand of the building. It can be observed that for most temperatures the high COP of HP outweighs the higher PEF of the national mixes. Even in low PEF electricity mixes, with temperatures below 0 °C (Finland), the drop of COP of the HP still does not make the NEHS better in terms of primary energy. Only at a temperature below 12 °C the low COP makes the NEHS a better option. It can also be seen that with high PEF national mixes, the HP is only a better option in terms of primary energy at certain temperatures: above 2 °C in Estonia and above 5 °C in Finland.
Table 7 summarizes the total primary energy calculated per country and technology for the period considered in the study for an 80 m
2 dwelling.
Finland, due to the severity of its winter, is the country with the highest consumption of primary energy for the NEHS. However, despite the high PEF of the national mix, the primary energy consumption of the HP is 30% lower than the one required by the NEHS to cover the same heating demand. This is especially relevant due to the typical low temperatures experienced in Finland during winter. In the case of Estonia, the above-mentioned facts result in a higher consumption of the HP compared to NEHS.
Furthermore, the analysis of the data included in
Table 7 shows the better performance of DH in comparison with the other technologies in terms of PEF. The relevant presence of HP and other efficient technologies within DH make these technologies as a very competitive option with PEF below 1, even below renewable energies’ PEF.
3.4. Environmental Analysis
In this section, it is presented the analysis of the GHG emitted by the different heating technologies to cover the heating demand for the considered period. This analysis evaluates at what times is more convenient to cover the demand with HP vs. NEHS in terms of GHG emissions.
Figure 7 shows the GHG emitted to cover the heating demand versus outdoor temperature in Estonia from the 25/01/2019 to the 10/02/2019 for both technologies, NEHS (DH in this case) and HP. It can be observed the high influence of the outdoor temperature: at low temperature, the HP has lower COP and therefore higher GHG emissions. At high temperature, higher COP and the difference on the emissions intensity decreases between both two technologies. In the case of Estonia with a fossil fuel-based electricity and a very efficient DH, even when the performance of the HP is high, the electricity generates twice the emissions of the NEHS.
Moreover,
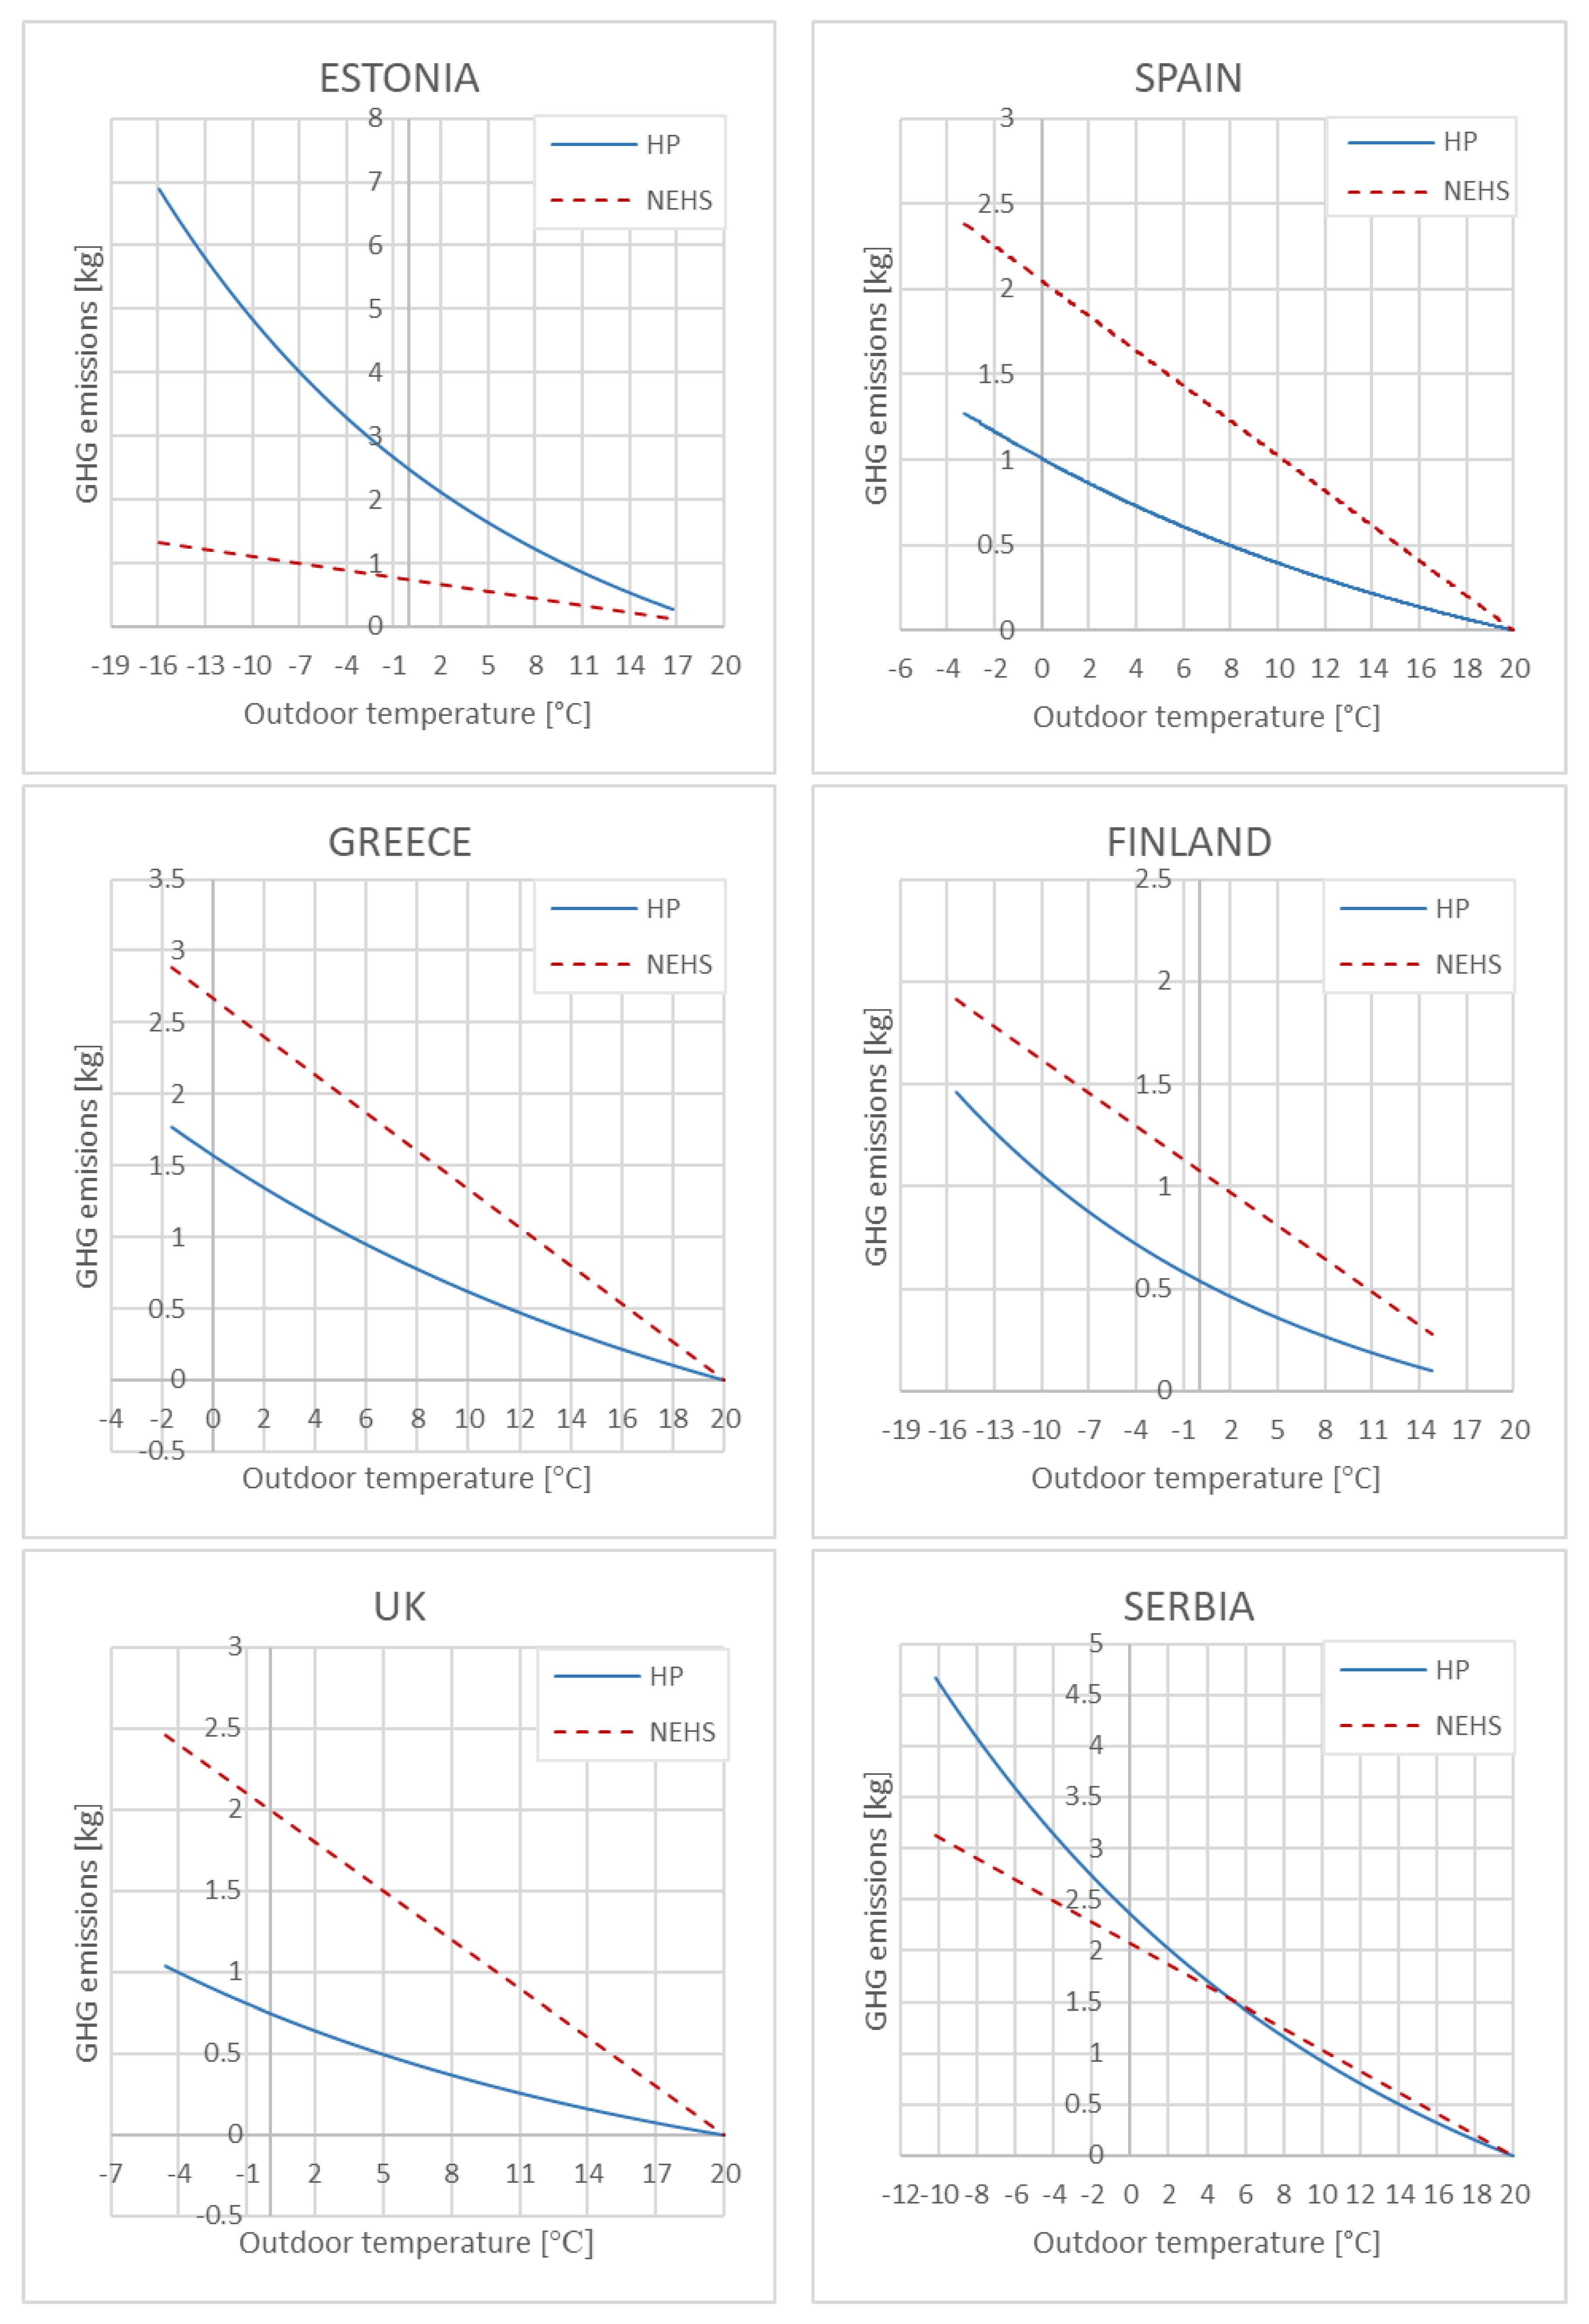
Figure 8 includes the environmental analysis per country of GHG intensity versus the outdoor temperature.
It can be observed that, for most temperatures, the high COP of HPs outweighs the higher GHGC of the national mixes. In the case of Estonia, where the GHGC of the national mix is over 9 times higher than the GHGC of NEHS, the increase of COP even at high temperatures still does not make HPs more competitive than the NEHS. Similar comment applies to Serbia, where the HP is only a better option GHG wise at temperatures above 5 °C.
Table 8 summarizes the total GHG emissions calculated per country and technology for the period considered in the study for an 80 m
2 dwelling.
Finland, due to the severity of its winter, is the country with the highest GHG emissions for the NEHS even considering its low GHGC. However, the low GHGC of the national mix makes the GHG emissions of the HPs 70% than those required by the NEHS to cover the same heating demand. In the case of Estonia and Serbia, the above-mentioned facts result in higher emissions of HP compared to NEHS.
4. Conclusions
This paper provides an extensive analysis of air-to-air heat pumps (HP) as an alternative to non-electric heating systems (NEHS) in the context of the decarbonization of Europe. This assessment includes economic, energetic and environmental factors within six European countries with different heating needs, electric mixes and climatic conditions.
First, a reference building was selected and modeled for the six countries considered, what allowed to estimate the overall heating transfer coefficient and therefore the hourly heating demand for six months (1 October to 31 March). Open data from the Copernicus database was used for real data on outdoor temperatures for the calculation.
Second, both the NEHS and the HP were characterized. Regarding the first one, a representative system was considered for each country, selected as the most common heating system of the given countries, whereas a detailed EES model was developed for the second one. This model provided the correlation between HP performance and the outdoor temperature. Third, an extensive research was performed to calculate economic tariffs for the different countries and heating systems based on available open data. Finally, these tariffs together with the hourly heating demand and the function COP(Tout) allowed the comparison of NEHS and HP from an economic point of view. Similar efforts were devoted to obtaining the primary energy factor (PEF) and the greenhouse gas coefficient (GHGC) for all the countries considered, being these factors the basis for the energy and environmental analysis.
The study shows that HPs have higher overall efficiencies compared with NEHS at any outdoor temperature, with a maximum COP of 4.2 for the period and climates studied. However, and in spite of the higher COP of HPs—it is cheaper to cover the heating demand of the reference building with NEHS for all the countries considered, but UK. The better performance of the HP does not outweigh the higher cost of electricity over fossil fuel costs. In those countries where the use of HPs for household heating purposes is more efficient than NEHS, the high price of the kWh advises against its use.
In terms of primary energy, a national electricity mix with high PEF entails that the highest COP of HPs compared to NEHS does not outweighs the high intensity on fossil fuels of the mix. Only the increase of the HP’s COP at high outdoor temperatures makes the use of HPs more convenient. Contrarily, a national mix with low PEF makes the primary energy consumption of the HP lower than those required by the NEHS to cover the same heating demand. Regarding the environmental analysis of GHG intensity versus outdoor temperature per country, it is shown that, for most temperatures, the highest COP of HP outweighs the highest GHGC of the national mixes as opposed the most common systems. In the case of high intense mixes on fossil fuels (Estonia and Serbia), the increase of COP even at high temperatures still does not make the HP less carbon intensive than NEHS.
Relevant conclusions were also obtained regarding the use of open data. The extensive desktop research on the different electric mixes of the European countries selected for the present study were based on the “energy statistical country datasheets” published by the open source Eurostat in order to obtain the PEF and GHGC according to 2015 values. The lack of reliable and updated open data limits the scope of the study since the last years achievements in terms of reducing the GHG impact of the electricity mixes are not taken into account. Therefore, ad hoc PEF and GHGC were calculated by the authors. The use of open weather databases can be used as an example of best practice: the database Copernicus allows to have reliable and updated data on outdoor temperatures. An effort to increase the number and quality of open data sources is mandatory for proper studies. Updated values are necessary for effective energy policies and decision-makers.
Furthermore, the present study suggests as conclusion that, although HP are considered as key elements for the decarbonization of Europe due to its high COP, at the moment, its use could be negative in those countries where the presence of fossil fuel-based technologies is relevant on the national electric mix. The high COP of HP does not outweigh the high PEF and GHGC of these mixes. Hence, the promotion of initiatives for energy efficiency and development of renewable sources should be mandatory in order to reduce these factors in the electric mix of each country.
Regarding future studies and policies, the high dependence of the COP with the outdoor temperature suggests that been able to choose the best heating technology in an hourly basis could be beneficial. These hourly decisions could be applied based on an energetic, environmental or economic approach; or combining the three of them. To enforce and replicate the replacement of NEHS by HP throughout Europe and make this a feasible alternative from an economic perspective, it is necessary to align tariffs and costs with the rational use of resources. Therefore, it is recommended to legislate in order not to damage the use of electricity for thermal purposes when this option is more carbon neutral.

 ,
, 


