Video Analysis of Pedestrian Movement (VAPM) under Different Lighting Conditions—Method Exploration


1
Environmental Psychology, Department of Architecture and Built Environment, LTH, Lund University, Box 118, SE-221 00 Lund, Sweden
2
Transport & Roads, Department of Technology & Society, LTH, Lund University, Box 118, SE-221 00 Lund, Sweden
3
Center for Mathematical Sciences, LTH, Lund University, Box 118, SE-221 00 Lund, Sweden
*
Author to whom correspondence should be addressed.
Energies 2020, 13(16), 4141; https://0-doi-org.brum.beds.ac.uk/10.3390/en13164141
Submission received: 31 May 2020
/
Revised: 31 July 2020
/
Accepted: 6 August 2020
/
Published: 11 August 2020
(This article belongs to the Special Issue Smart City Lighting Systems)
Abstract
:When daylight hours are limited, pedestrians are dependent on appropriate outdoor lighting. Although new city lighting applications must consider both energy usage and pedestrian responses, current methods used to capture pedestrian walking behaviour during dark conditions in real settings are limited. This study reports on the development and evaluation of a video-based method that analyses pedestrians’ microscopic movements (VAPM—video analysis of pedestrian movements), including placement and speed, in an artificially lit outdoor environment. In a field study utilising between-subjects design, 62 pedestrians walked along the same path under two different lighting applications. VAPM accurately discriminated pedestrians’ microscopic movements in the two lighting applications. By incorporating methodological triangulation, VAPM successfully complemented observer-based assessments of pedestrians’ perceptions and evaluations of the two lighting applications. It is suggested that in evaluations of pedestrian responses to city lighting applications, observer-based assessments could be successfully combined with an analysis of actual pedestrian movement while walking in the lit environment. However, prior to employing a large-scale application of VAPM, the methodology needs to be further adapted for use with drones and integration into smart city lighting systems.
1. Introduction
Cities should provide access to safe, affordable, accessible and sustainable transport systems for all citizens [1]. Outdoor lighting, therefore, is important for people’s use of urban spaces, especially for pedestrians at northern latitudes, where the number of daylight hours is limited during the winter. Previous research suggests that ambient light influences people’s walking, both their choice of travel mode and route. Analyses of pedestrian count data show that at the same time of day, more people walk during daylight hours than when it is dark, and more people walk on footpaths after dark when the paths are artificially lit [2,3]. Moreover, there seems to be a need for a certain level of illuminance to attract people to walk when it is dark [4,5]. Experimental studies based on simulated environments suggest that different lighting applications, as well as illuminance levels, may fundamentally change people’s impressions of public urban outdoor spaces [6,7,8,9].
Energy efficiency in the built environment can make significant contributions to a more sustainable society and is important to meet goals related to climate change, energy security, energy poverty and environmental degradation [10,11]. Annual energy use by outdoor lighting is estimated at about 218 TWh globally, but there is potential for saving between 30–50% of this energy use [12] by updating the design of existing outdoor lighting installations and utilising more energy-efficient light sources [13]. However, new lighting applications must carefully consider both energy usage and the pedestrians’ experiences [14].
The International Commission on Illumination offers design guidance for pedestrian lighting, but it is primarily from the perspective of motor traffic, with the main objective of making pedestrians visible to drivers [15]. Recently, attention has been drawn to the need for adequate methods to evaluate outdoor lighting for pedestrians, including the detection of obstacles and recognition of other people and a more general feeling of reassurance in urban environments [16].
From a psychological viewpoint, theories of human–environment interaction postulate that in the transaction between people and their physical environment, the environment’s perceived features may impede or support certain behaviours [17,18]. This also applies to the understanding of people’s walking habits in urban environments [19]. Therefore, the evaluation of lighting applications is challenging, considering the complexity of human interaction with lighting and the lit environment; for an overview of this issue, see [20]. Drawing on a user perspective on the built environment, researchers have proposed that outdoor lighting applications should include three overarching categories of human responses, which involve different but interlinked psychological processes: pedestrian perception, evaluation and behaviour in the lit environment [21]. Perceptual responses include outcomes of how light hinders or facilitates the perceptual processes of seeing, such as the experience of brightness, glare, contrasts, colour identification, obstacle detection and recognition of other people (e.g., [22,23,24,25]). Evaluative responses correspond to the perceived qualities of the environment and may include the perceived qualities of light, such as perceived brightness or strength quality, perceived hedonic tone or comfort quality [14,26], environmental configuration, restorative qualities [27,28], and perceived possibilities for prospect and refuge in the environment, suggested to be associated with the feeling of safety or reassurance [29,30], as well as affective outcomes, including emotional states related to the individual’s level of arousal and pleasure [31] or specific feelings [32]. Behavioural responses correspond to not only choosing to walk in a certain environment but also the performance of walking behaviour. Despite increasing interest in understanding pedestrian perspectives on lighting, the methods available to systematically assess pedestrians’ responses in real settings are limited, especially for walking behaviour [21]. This paper presents a pilot study of video analysis of pedestrian movements (VAPM) as a method of collecting data related to pedestrian trajectories and assessing walking behaviour.
2. Previous Research
Whereas user evaluations of pedestrian perception and evaluation of outdoor lighting and lit environments in the field often are based on self-reports by means of so-called observer-based environmental assessments [14], the traditional approach to capturing people’s behaviour in field studies is observation. This is done either directly by on-site observation or indirectly by analysing filmed sequences [33]. However, published studies of pedestrian walking behaviour under different lighting applications are rare. Existing studies are largely limited to either assessing pedestrian flow under different artificial lighting applications (e.g., [5,34,35]) or analysing pedestrians’ crossing behaviour and modelling it from a traffic safety perspective (e.g., [36]). Hence, more fine-tuned observational methods of evaluating pedestrian movement behaviour are required. A qualitative study revealed the complex interplay between outdoor lighting, greenery, the presence of other people, prospect–refuge, perceived safety and walking [30]. Similarly, an observational study showed that students’ choices of walking routes and placement along the path while walking differed between the day- and night-time. These changes were most prominent along routes where the environmental context did not support prospect–refuge variables, suggesting an interaction between lighting conditions and other features of the built environment [37]. Markvica and colleagues [38] observed pedestrian placement on pedestrian paths, noting whether pedestrians walked along the exterior wall of the house, in the middle of the path, or along the edge of the path, and whether there was at least one change in the path guide under different outdoor lighting applications. Pedestrians tended to vary their placement and change their path more with a fluorescent tube luminaire (FTL) light source than with a light-emitting diode (LED) light source, which was explained by improved visual accessibility with the LED light sources providing a better-illuminated environment. Mattsson and colleagues [39] introduced the observation of pedestrians with visual impairments during a walk-along approach where the observer followed the pedestrian’s movement step-by-step for orientation and the detection of critical features in the environment under different outdoor lighting applications. This approach allowed for a very detailed understanding of pedestrian movement, including placement along the path in relation to, for example, built features, greenery, and the presence of obstacles. The walk-along approach is, however, time-consuming and site-specific, making it unsuitable for large samples and comparisons of pedestrian movement between paths.
Another feature of pedestrian movement is walking speed. Laboratory studies suggest that higher levels of illuminance are associated with a decreased need for directing one’s gaze towards the ground [40] and increased walking speed [41,42]. Moreover, walking speed is influenced by the overall layout of the urban environment, such as its walkability and permeability [43]. Franěk [44,45] showed that certain environmental characteristics in the urban environment could affect pedestrian speed. People walked faster when walking in areas with traffic, noise and no greenery than in calm, green areas, revealing more positive emotions towards the green sections [44]. Pedestrians also tended to speed up in places with a lack of visual openness [45]. Willis and colleagues [46] surveyed pedestrians’ movement behaviour during daylight hours in urban environments using a covert video-based technique. Unsurprisingly, it was found that most of the pedestrians walked on the pavement, but over half of the walkers occupied the edge of the total available space. There was, however, no relationship between walking speed and positioning on the pavement. Another study found that the presence of other people affects walking speed but not the trajectory of movement [47]; however, this study did not examine differences between light and dark environmental conditions and did not address the role of artificial lighting.
The body of research on this topic suggests that a number of aspects, such as route choice, placement, walking speed and positioning in relation to other known and unknown pedestrians, could be taken into consideration in evaluations of energy-efficient outdoor lighting for pedestrians. Extracting this kind of microscopic data on pedestrian movement behaviour, as well as road users, in general, is a relatively common method used in urban traffic studies and has been achieved via simple, semi-automated [48,49] or fully automated [50,51] tools. Theoretically, with proper camera calibration and sufficient video resolution, very accurate measurements of road users’ positions and speeds are possible [52]. However, semi-automated tools require considerable manual labour, thus limiting the feasibility of collecting large amounts of data. However, the performance of automated tools varies substantially from site to site and is sensitive to various factors, including lighting and weather conditions, camera perspectives, and traffic density. Recently, significant improvements in automated detection and tracking have been achieved with the introduction of convolutional neural networks (CNNs). This approach requires training examples to tune the set of learnable parameters in a CNN. Tuning utilises numerical optimisation [53,54,55,56] to obtain a set of CNN parameters appropriate for detecting objects represented in the training dataset.
3. Study Aim
This study aimed to, first, further develop and adapt an existing video technology to measure microscopic movement, including placement and speed, in the walking behaviour of pedestrians in artificially lit outdoor environments. The study’s second aim was to use this technology in the user evaluation of two outdoor lighting conditions along the same pedestrian path, specifically to determine whether the technology could discriminate between walking behaviour in two different outdoor lighting applications and identify associations between pedestrians’ self-reported perceptions and evaluations of the light, the lit environment, and walking behaviour.
4. Study Site
The study site was a mixed walking/bicycle path located in the outskirts of Malmö (Figure 1), a city in southern Sweden with a population of approximately 315,000. The site was chosen based on the criteria that it should be both suitable for technological development and allow for an on-site evaluation of pedestrians’ responses to outdoor lighting.
The path chosen is completely traffic-separated and surrounded by green areas and fenced paddocks. The path connects a shopping/business district and railway station with adjacent residential areas. The studied section was about 130 m long and included both a relatively straight and open section and a turn with some trees and bushes along the path).
The section was originally artificially lit with lighting application I (light source: Philips SGS-203 50 Watt SON-T, high pressure sodium (HPS) manufacturer Philips, Eindhoven, the Netherlands), correlated colour temperature (CCT): 1882, colour rendering index (CRI): 6.5, scotopic/photopic-ratio (S/P): 0.50, light poles: 3.8 m high with a distance of 33 m), which was later changed to lighting application II (light source: Philips P17 Master City White CDO/ET 50W/828, ceramic metal halide (CMH), manufacturer Philips, Eindhoven, the Netherlands, correlated colour temperature (CCT): 2815, colour rendering index (CRI): 89, scotopic/photopic-ratio (S/P): 1.25, light poles: 4.5 m high with a distance of 16.5 m). The spectral power distributions are given in Figure 2 and Figure 3.
Horizontal illuminance was measured by a Hagner Screen Master. In lighting application I, horizontal illuminance varied between 1 lx in the middle and 35 lx close to the lamp posts. The Swedish road and street lighting standard [57] set the minimum mean horizontal illuminance for a pedestrian pathway through a residential area or adjacent to a district city centre at Ē > 10 lx and pedestrian pathways in adjacent to a residential area at Ē > 7.5 lx. In lighting application II, dark patches between lamp posts were reduced due to the shorter distance between lamp posts. The measurements varied between 10 lx in the middle and 63 lx close to lamp posts (Figure 4).
5. VAPM—Method Development and Adaptation
5.1. Cameras and Installations
Axis F34 (https://www.axis.com/se/sv/products/axis-f34) cameras with F1015 (https://www.axis.com/se/sv/products/axis-f1015) sensor units were used in the study. Each camera consisted of the main unit, which performed the recording function, and several sensor units (i.e., lenses) connected via 12 m-long cables. Advantages of this two-step design are as follows: (i) the actual sensors are quite small and light-weight, thus requiring no bulky equipment for installation; (ii) the main unit handles all the recordings from sensors installed on the same pole, limiting the number of cables required for power supply and time synchronisation.
The cameras were mounted on existing lampposts and oriented to provide overlap between viewing areas. Due to obstruction caused by vegetation, it was necessary to install an additional temporary pole in the turn area (Figure 5). A total of 12 cameras were installed, although only data from 10 cameras with overlapping views were used during the analysis stage.
The number of available lamp posts was quite low, which provided very unfavourable perspectives for the cameras. Therefore, a simple “extension” was designed that placed the cameras about 1 m above the lamps. An example of a camera view is given in Figure 6.
5.2. Camera Calibration Model
The crucial step before taking measurements from a video is camera calibration, which involves defining a model that relates the coordinates (xw, yw, zw) of a position at point A in the world to its representation a (xi, yi) in the camera image. We used a Tsai model [58]; it utilises linear equations based on the radial alignment constraint and a second-order radial term to account for lens distortion.
The parameters of a calibration model utilising a fixed-mounted camera are usually estimated from a set of points with known coordinates in an image and in the 3D-world. The calibration points were marked on both path edges at an interval of about 4 m. The point positions were measured using a high-precision Global Navigation Satellite Systems (GNSS) receiver (Leica GX1230 GG). Calibration model parameters were established with the help of T-Analyst, a custom software package [59].
5.3. T-Analyst—Semi-Automated Video Processing Software
Video data were also analysed using T-Analyst [59] (Figure 7). This tool is specifically designed for the semi-automated processing of videos taken from stationary cameras for the purpose of traffic analysis. T-Analyst allows users to browse a video clip frame-by-frame, manually marking the position of road users in the images by placing a wire-frame model onto the road user, and calculating speed profiles and other indicators. It is also capable of utilising video from several cameras, which was crucial in this study.
Once all the cameras were time synchronised and calibrated, it was possible to track pedestrians along the route, “passing” them from one camera to another. Generally, the camera to which the pedestrian was closest was used for tracking, as it would provide the best possible accuracy (due to higher resolution of the object). In areas where the participant was equally distant from both cameras, an attempt was made to match the wire-frame model over the person in both camera views.
5.4. Trajectory Data Post-Processing
The trajectories did not start and end at exactly the same locations; moreover, the number of trajectory points depended on the walking speed of the pedestrian. Prior to comparing the trajectories, they had to be “normalised” so that the total number of points and relationship of an individual point to the actual location would be the same for all trajectories. We will explain the normalisation procedure by using an example of a lateral position of the pedestrian during passage.
First, the left and right sides of the path, clearly seen in the image shown in Figure 6, were annotated with a set of points located every 1–2 m. Based on this annotation, the position of the middle line of the path was calculated and then represented by 100 equally-distributed points. These points were further used to describe the longitudinal position of the pedestrian along the path (Figure 8).
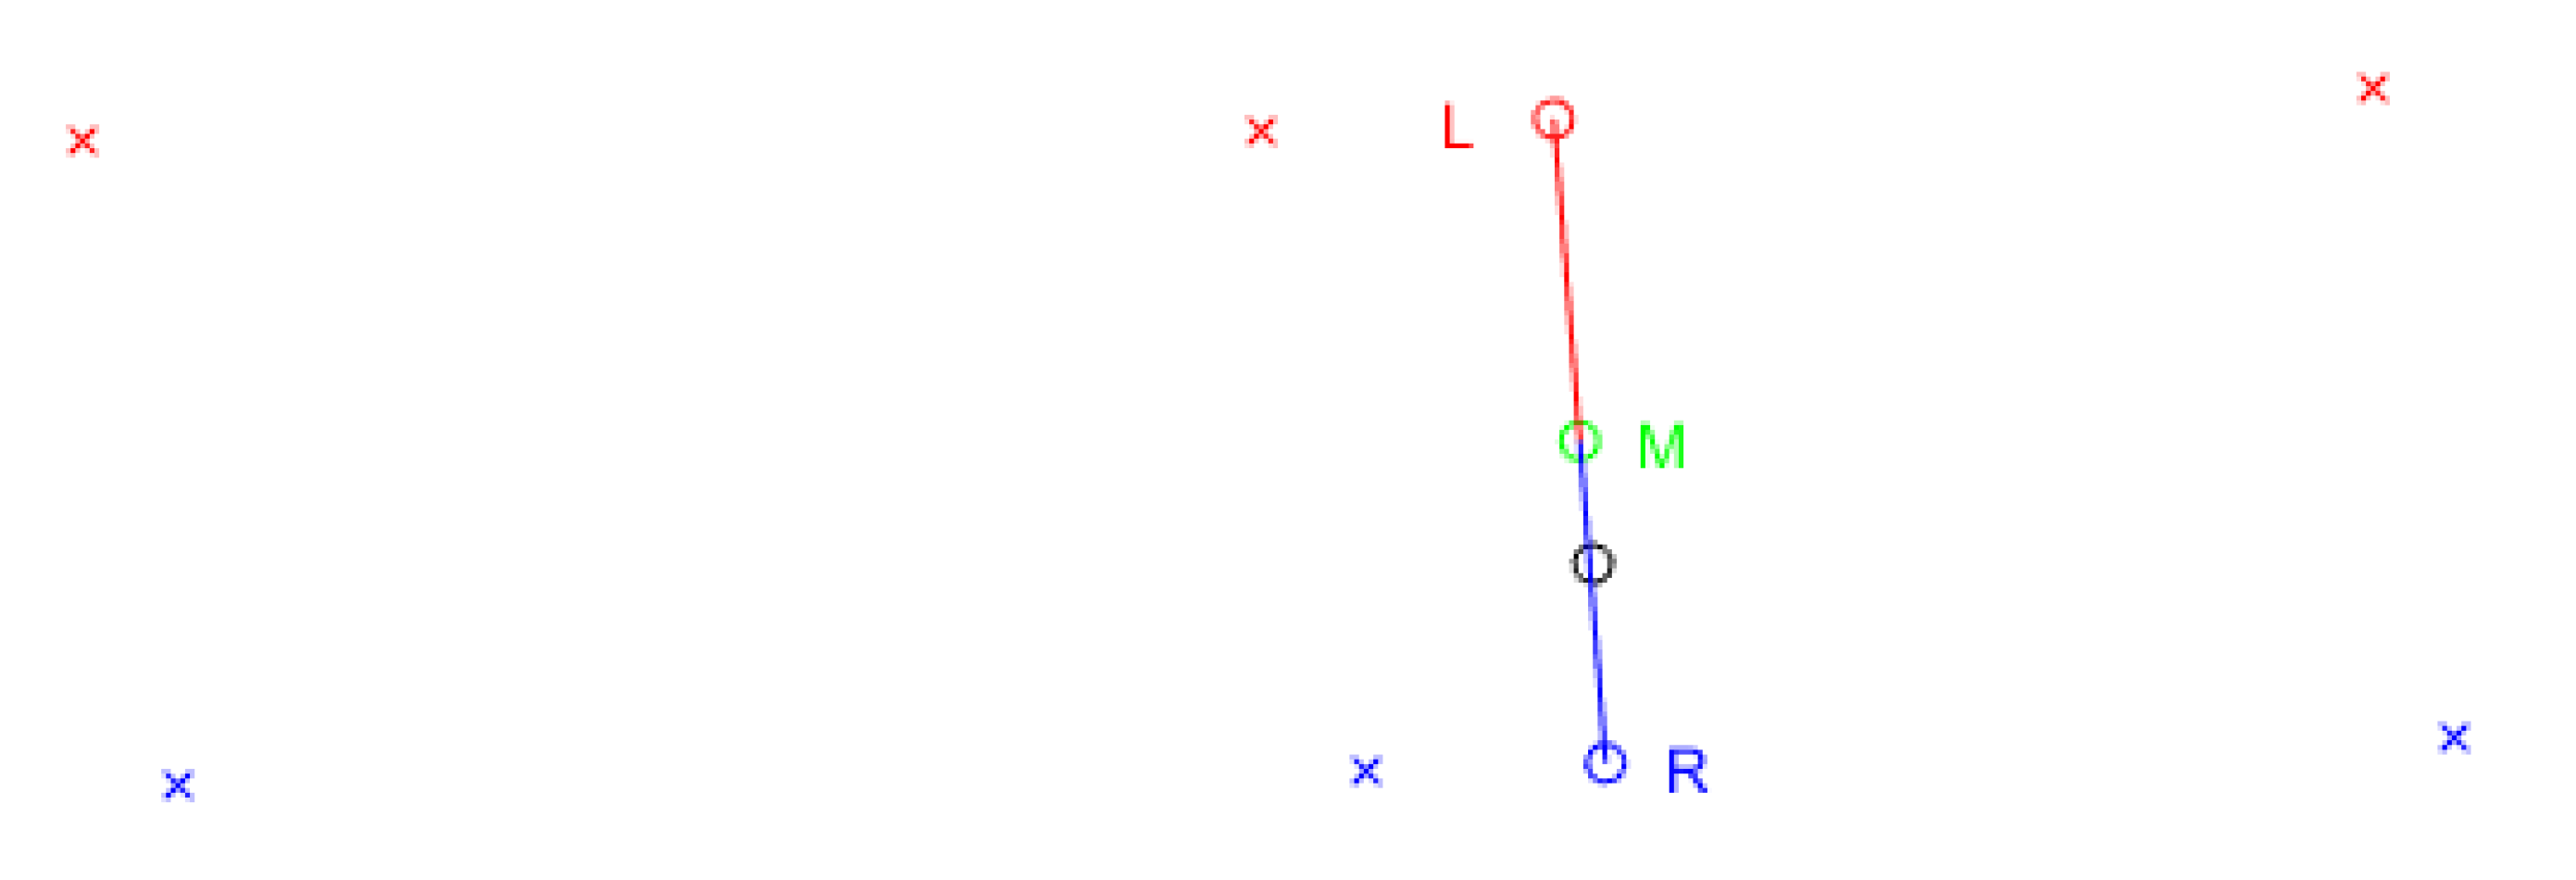
All the original trajectories were reduced to 100 points, each chosen as the closest to one of the 100 reference points on the middle line. Since the distance between adjacent points in the original trajectory did not exceed 10–15 cm, the error introduced by choosing the closest point rather than using more advanced interpolations was judged as acceptable. The pedestrian’s lateral position was described in relation to the left and right borders of the sidewalk (Figure 9). Let R be the closest point from the pedestrian position (black point) to any line segment connecting the border points on the right side. Similarly, let L be the closest point on the left side. Let M (the green point) be the midpoint of the segment connecting R and L. Now, the lateral position of the pedestrian can be measured as a score, mapped to range [−1, +1] if you are on the sidewalk, where −1 corresponds to the left border of the sidewalk (point L), while +1 corresponds to the right border (point R), and 0 indicates the middle of the sidewalk (point M).
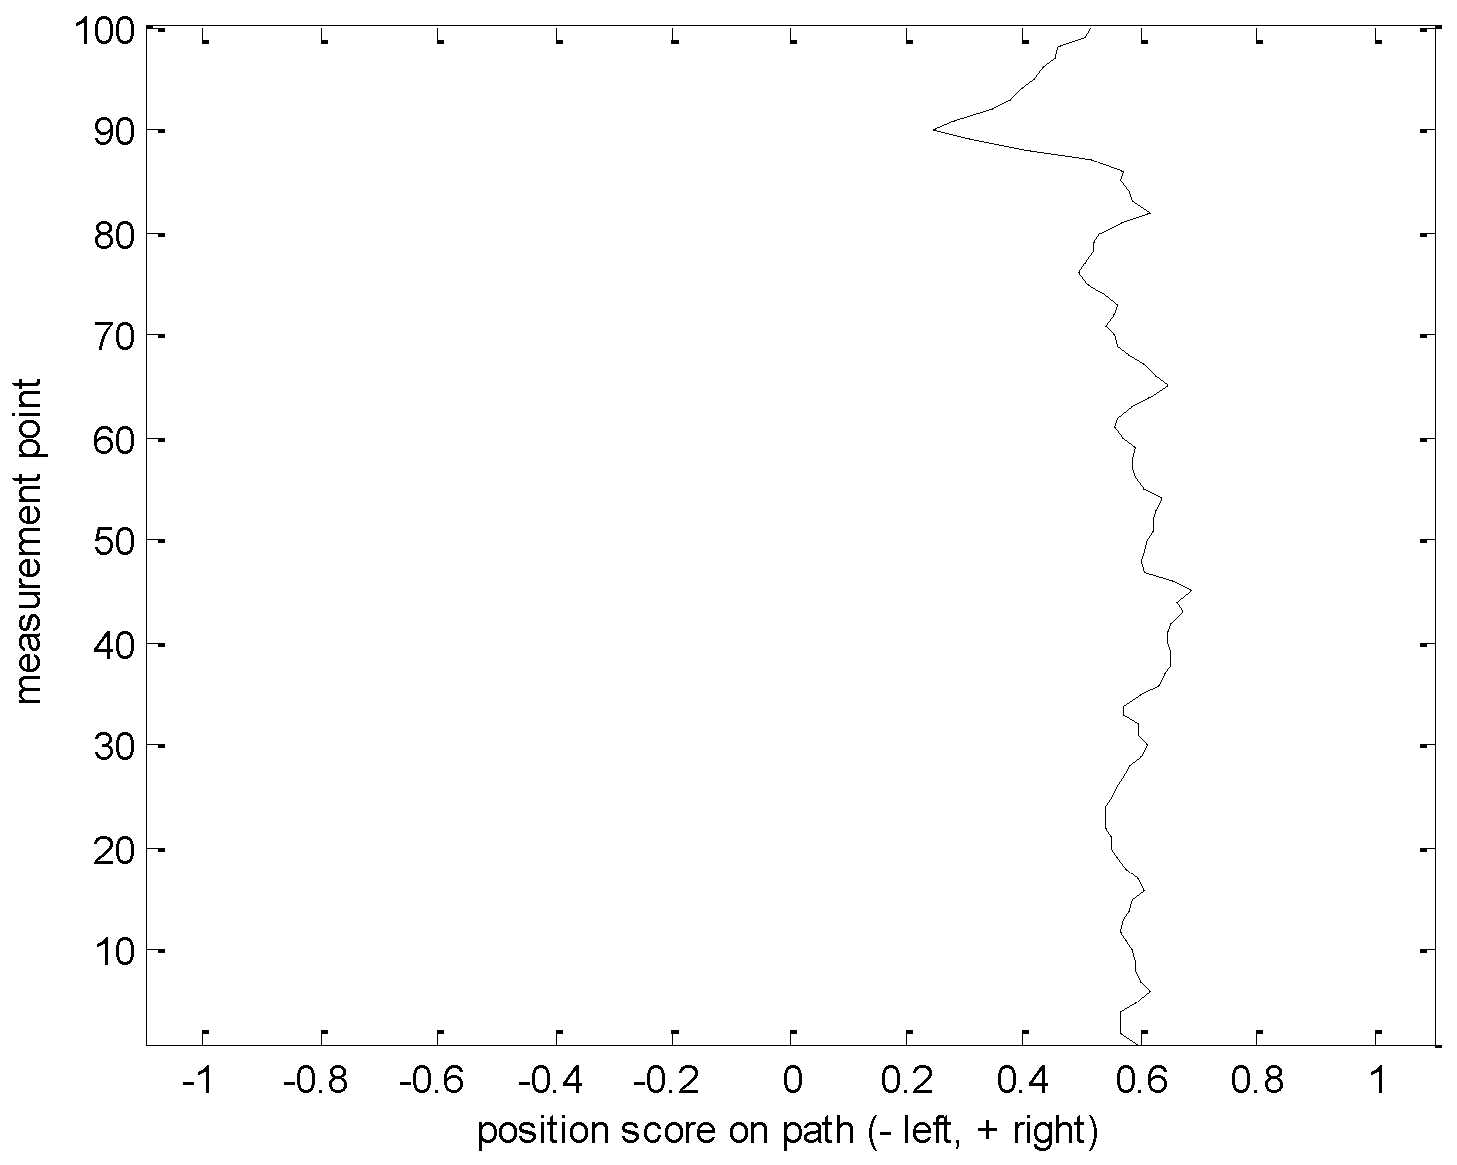
Figure 10 presents a visualised lateral position score along the entire passage of a single pedestrian. Note how the position is drawn towards the middle of the sidewalk in the region of 85 to 95. This corresponds to the actual turn of the sidewalk and the pedestrian “cutting the corner”.
6. User Evaluation of Two Lighting Applications
The ultimate aim of VAPM methodology is to relate microscopic pedestrian movement to observer-based assessments by study participants. Consequently, a field study was designed to evaluate the two lighting applications along the above-described path. In line with previous research, these assessments included pedestrians’ perceptions and evaluations of the light and the lit environment, as well as their behavioural intention of walking along the path and the newly developed measures of walking speed and placement.
6.1. Participants
The field study included 62 participants (52% females and 48% males, aged 18–34 years, m age = 25 years) with self-reported good health and eyesight in daylight conditions (after correction). Half of the group (N = 29, 44% female, 55% male, 18–33 years, m age 24 years) walked the path under the original lighting conditions (application I), and the other half (N = 33, 58% female, 42% male, 18–34 years, m age = 26 years) under the new lighting solution (application II).
6.2. Evaluation Procedure
Participants were recruited via advertisements posted on university campus. They were invited to participate in research on new methods in the study of outdoor lighting for pedestrians. Data were collected after sunset (approximately 7–8 pm) in October and November, in groups of approximately 10 people at a time. Temperatures varied from 0–10 °C, and there was no heavy precipitation. The study was conducted in accordance with the rules and regulations established by the Ethics Committee of the Swedish Research Council and the Declaration of Helsinki. Upon arrival, participants were informed about the study aim, that their participation was voluntary, and that they could withdraw at any time without any negative consequences. They also signed an informed consent form.
The study design was based on the technique of structured walks [60], which has been used previously to assess pedestrians’ experience of outdoor lighting applications [61]. With the objective of establishing a common anchoring point for the assessments made by participants in the two groups, as well as identify differences in affective experience and perceived lighting qualities between the two groups, at the meeting point, participants were asked to rate their anticipated affective experience of walking in this environment and the perceived lighting quality. This point had the same lighting conditions throughout the study period. The participants were then invited to walk the path individually while wearing signs with a number on their front and back to facilitate identifying each participant in the camera recordings. Participants were instructed to walk along the path at their normal walking pace, stopping once they saw a clearly marked sign saying, “end of path”. The participants’ walks were recorded by video cameras set up along the path and analysed as described in Section 5.4. The walk was followed by another questionnaire and a short group discussion led by the test leader to elaborate, in greater detail, on the experience of walking along the path, especially in relation to lighting conditions. This part of the study lasted approximately one hour. Participants were paid SEK 300 and reimbursed for their travel expenses to and from the data-collection site.
6.3. Observer-Based Assessments
The questionnaire primarily included previously published observer-based assessments. The participants assessed their perception of the light and the lit environment via several items, including the following two questions: “How well do you see in this light?” (rated from 1 = very poorly to 7 = very well), and “Did you find it difficult to see at any part of the path?” (1 = no, 2 = yes). On the second question, a blank space was provided for participants to identify which part of the path. Participants also rated perceived visual accessibility by responding, on a five-point Likert scale (1 = does not correspond at all, to 5 = totally corresponds), to the following statements: “I would have been able to (a) detect objects on the ground, (b) read a street sign, and (c) recognise people’s faces”. The mean score of the scale was calculated, and the scale’s internal consistency was evaluated using Cronbach’s alpha (α = 0.86). Perceived outdoor lighting quality (POLQ) was assessed using 10 rating scales. The assessment consists of two indices: perceived strength quality (PSQ; subdued–brilliant; strong–weak; dark–light; unfocused–focused; clear–drab; Cronbach’s alpha = 0.85) and perceived comfort quality (PCQ; hard–soft; warm–cool; natural–unnatural, glaring–shaded; mild–sharp; Cronbach’s alpha = 0.83), rated on a seven-point graded scale with italicised items reversed prior to calculating indices [14]. Additionally, 34 adjectives were provided to participants, who were instructed to circle three adjectives corresponding most closely to their perception of the light.
The participants’ evaluations of the light and the lit environment were assessed as an affective experience, captured by two complementary instruments. The first instrument is an affect grid that allows a single-item simultaneous rating of valence and arousal; it was developed for rapid and repeated measures in experimental situations [62]. The affect grid was translated into Swedish, modified into a 5 × 5 grid ranging vertically from low to high arousal and horizontally from low to high valence, and adapted to field experiments [60]. The second instrument is the Swedish short measure of core affect; it includes two composite rating scales of valence, ranging from low (i.e., sad, depressed, or displeased) to high (i.e., glad, happy, or pleased), and arousal, ranging from low (i.e., dull, passive, or sleepy) to high (i.e., peppy, active, or awake) [63]. Five-point Likert scales were used for both types of assessments (1 = low valence/arousal, 5 = high valence/arousal). The two different measures showed satisfactory to high internal reliability (Pearson r = 0.90 for valence and 0.77 for arousal). Averaged indices were, therefore, created for valence and arousal. Perceived danger was assessed by five items rated on a five-point Likert scale: “I don’t mind walking alone along this path”; “I prefer to avoid walking along this path”; “I feel uneasy along this path”; “I want to hurry through this path”; “I think this path is unpleasant” [30,61] (1 = totally agree, 5 = totally disagree). Internal reliability was high (Cronbach’s alpha = 0.92), and the responses were averaged into an index ranging from 1 (low danger) to 5 (high danger). Two separate items were used to assess participants’ evaluation of prospect (i.e., “I had a good overview of the surroundings of the path”) and escape (i.e., “I could easily have fled from the path”). Both items were rated on a five-point Likert scale (1 = totally agree, 5 = totally disagree).
Intention to choose to walk and intention to avoid walking the path were assessed by the following question: “What would you do if this route was in the direction towards one of your destinations within the next week?” Participants rated the extent to which they would particularly choose to walk the route and particularly avoid walking the route (1 = no, definitely not; 5 = yes definitely).
6.4. Statistical Analysis of Observer-Based Assessments
After frequency analyses showing distribution and measures of central tendencies and dispersion, most variables were considered appropriate for parametric analysis. No anchoring effects were identified, and the observer-based assessments between the two groups were considered comparable. Univariate analyses of variance were employed to identify differences between the two lighting applications. All data were analysed using SPSS version 22, and the level of significance was set at p = 0.05.
7. Results
7.1. Trajectory Analysis of Two Lighting Applications
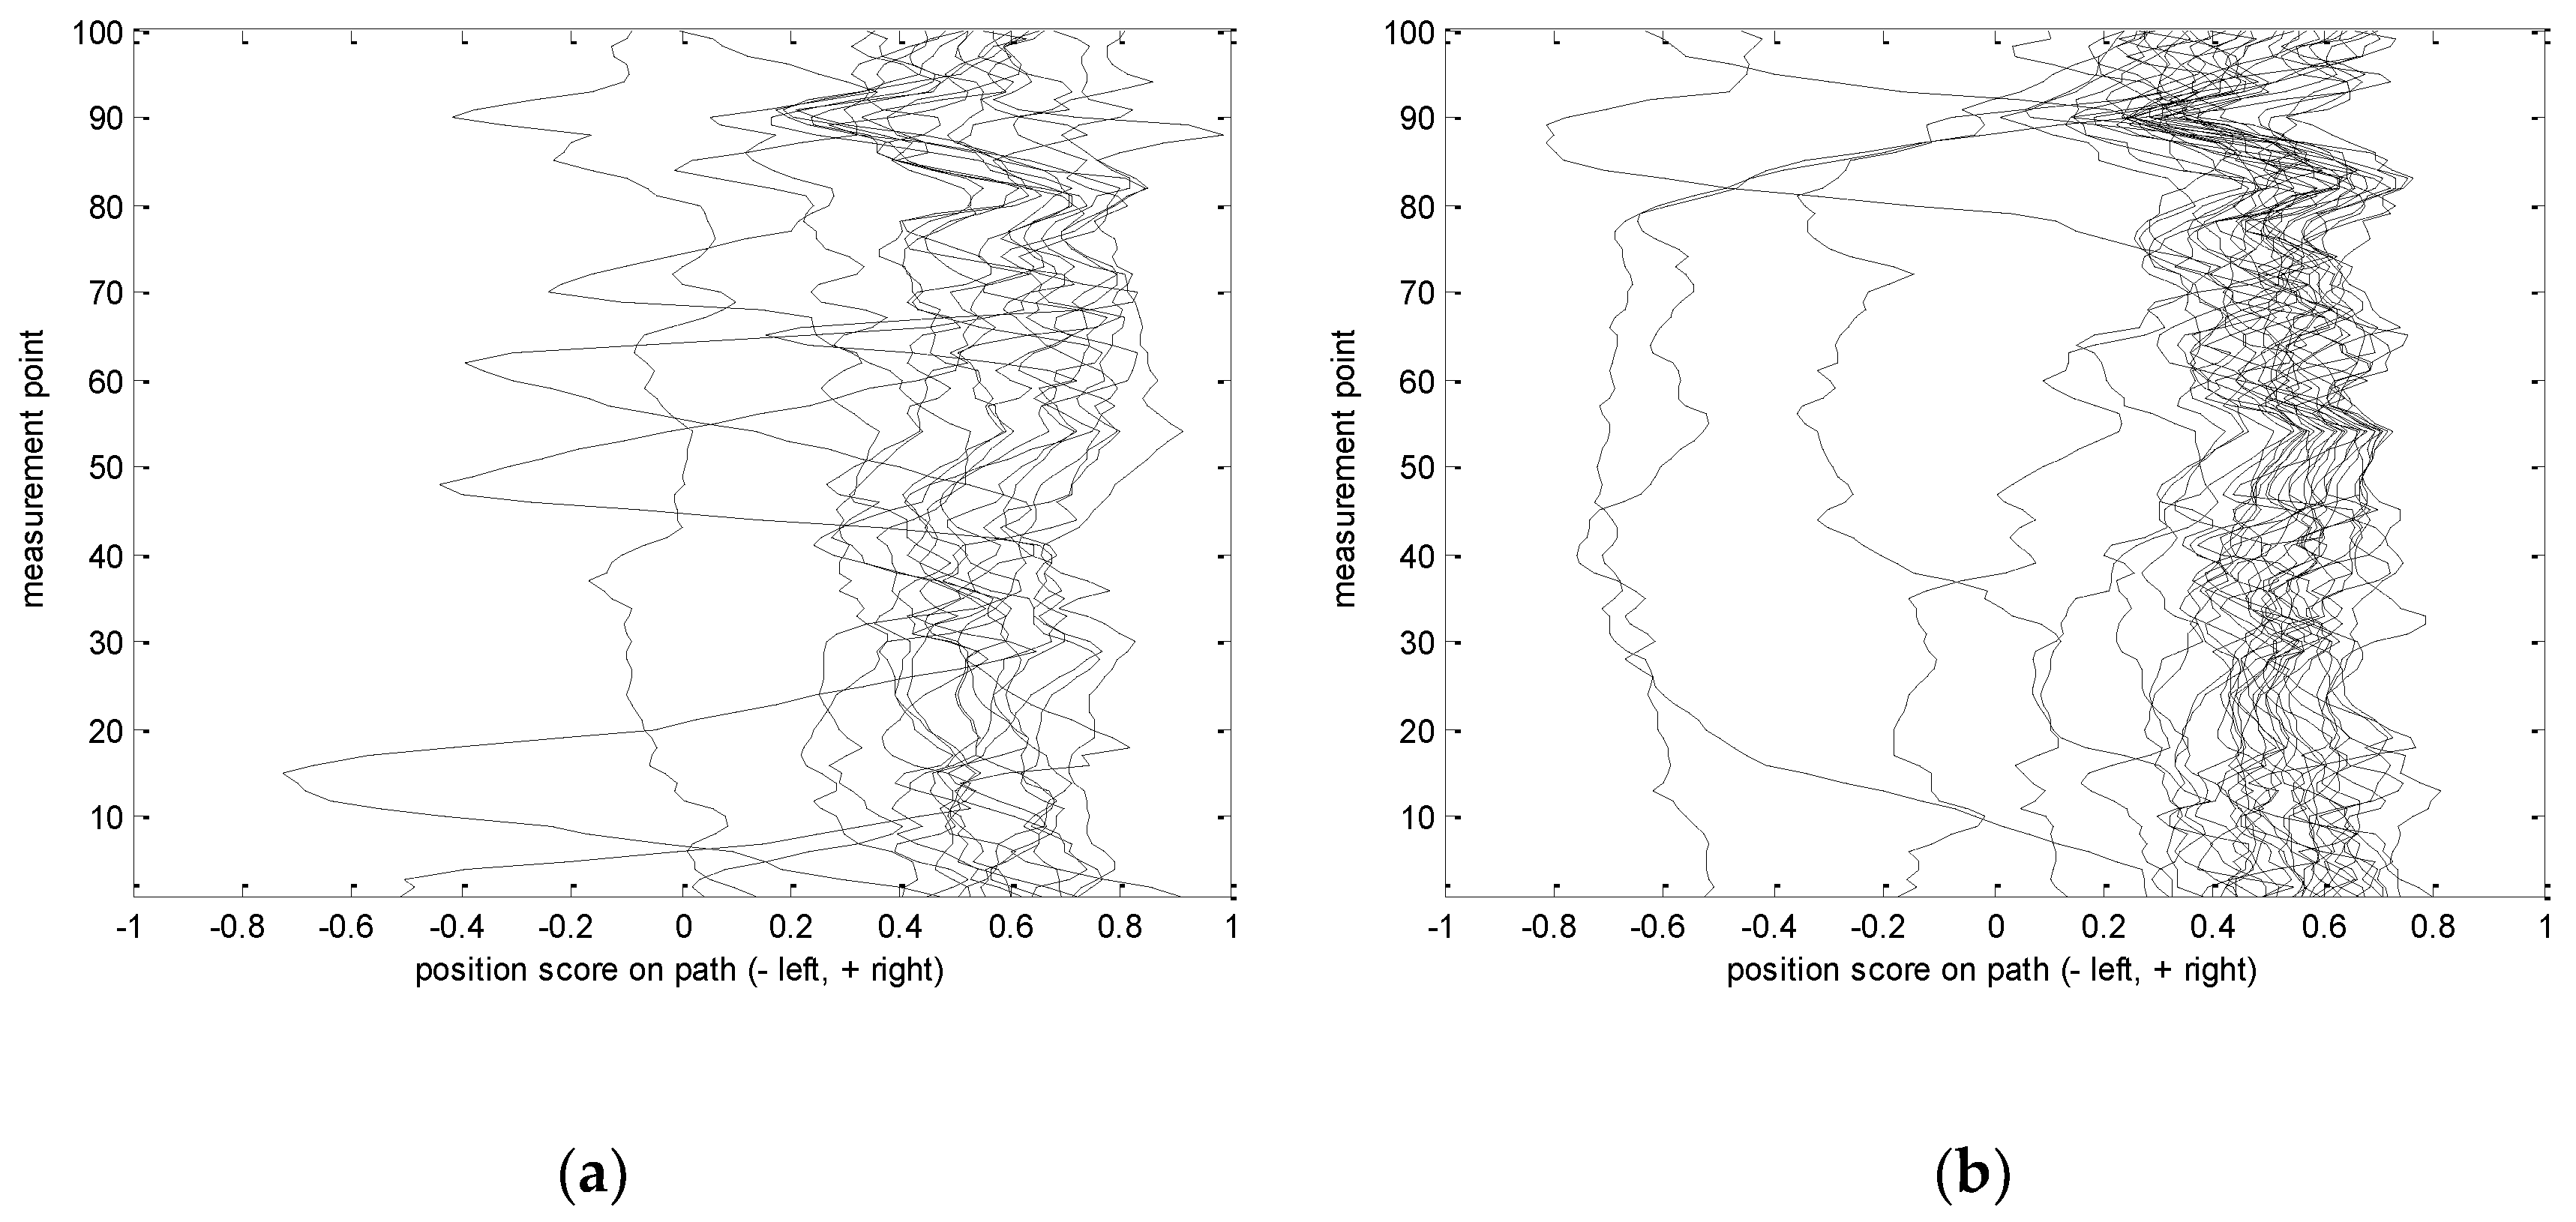
Figure 11 presents all the normalised trajectories of participants in the lighting application I and lighting application II experiments. Note how easily “deviations” from the majority of trajectories can be visually distinguished for further examination.
For example, Figure 12 shows an unusual “hook” to the left made by the pedestrian at the beginning of the path. Closer examination of the video reveals that there was an encounter with other pedestrians travelling in the opposite direction who were walking along the left-hand side of the path and, thus, blocked the participant’s way.
Figure 13 shows another atypical situation. Unlike most of the other participants, this participant kept to the left side of the path along the entire passage. At the very end, however, he encountered another pedestrian in the meeting direction who was walking on the right-hand side, which forced the participant to move to his right.
Figure 14 presents the aggregated (average) lateral position of all participants in lighting applications I and II. Note how the average path for lighting application II is systematically closer to the centre line compared to application I (in 95 points out of 100), although the difference, in absolute terms, is quite small. Aggregated indicators (e.g., integrated discrepancy) that compare individual trajectories with the “average” allows the detection of “deviant” cases in a more systematic manner.
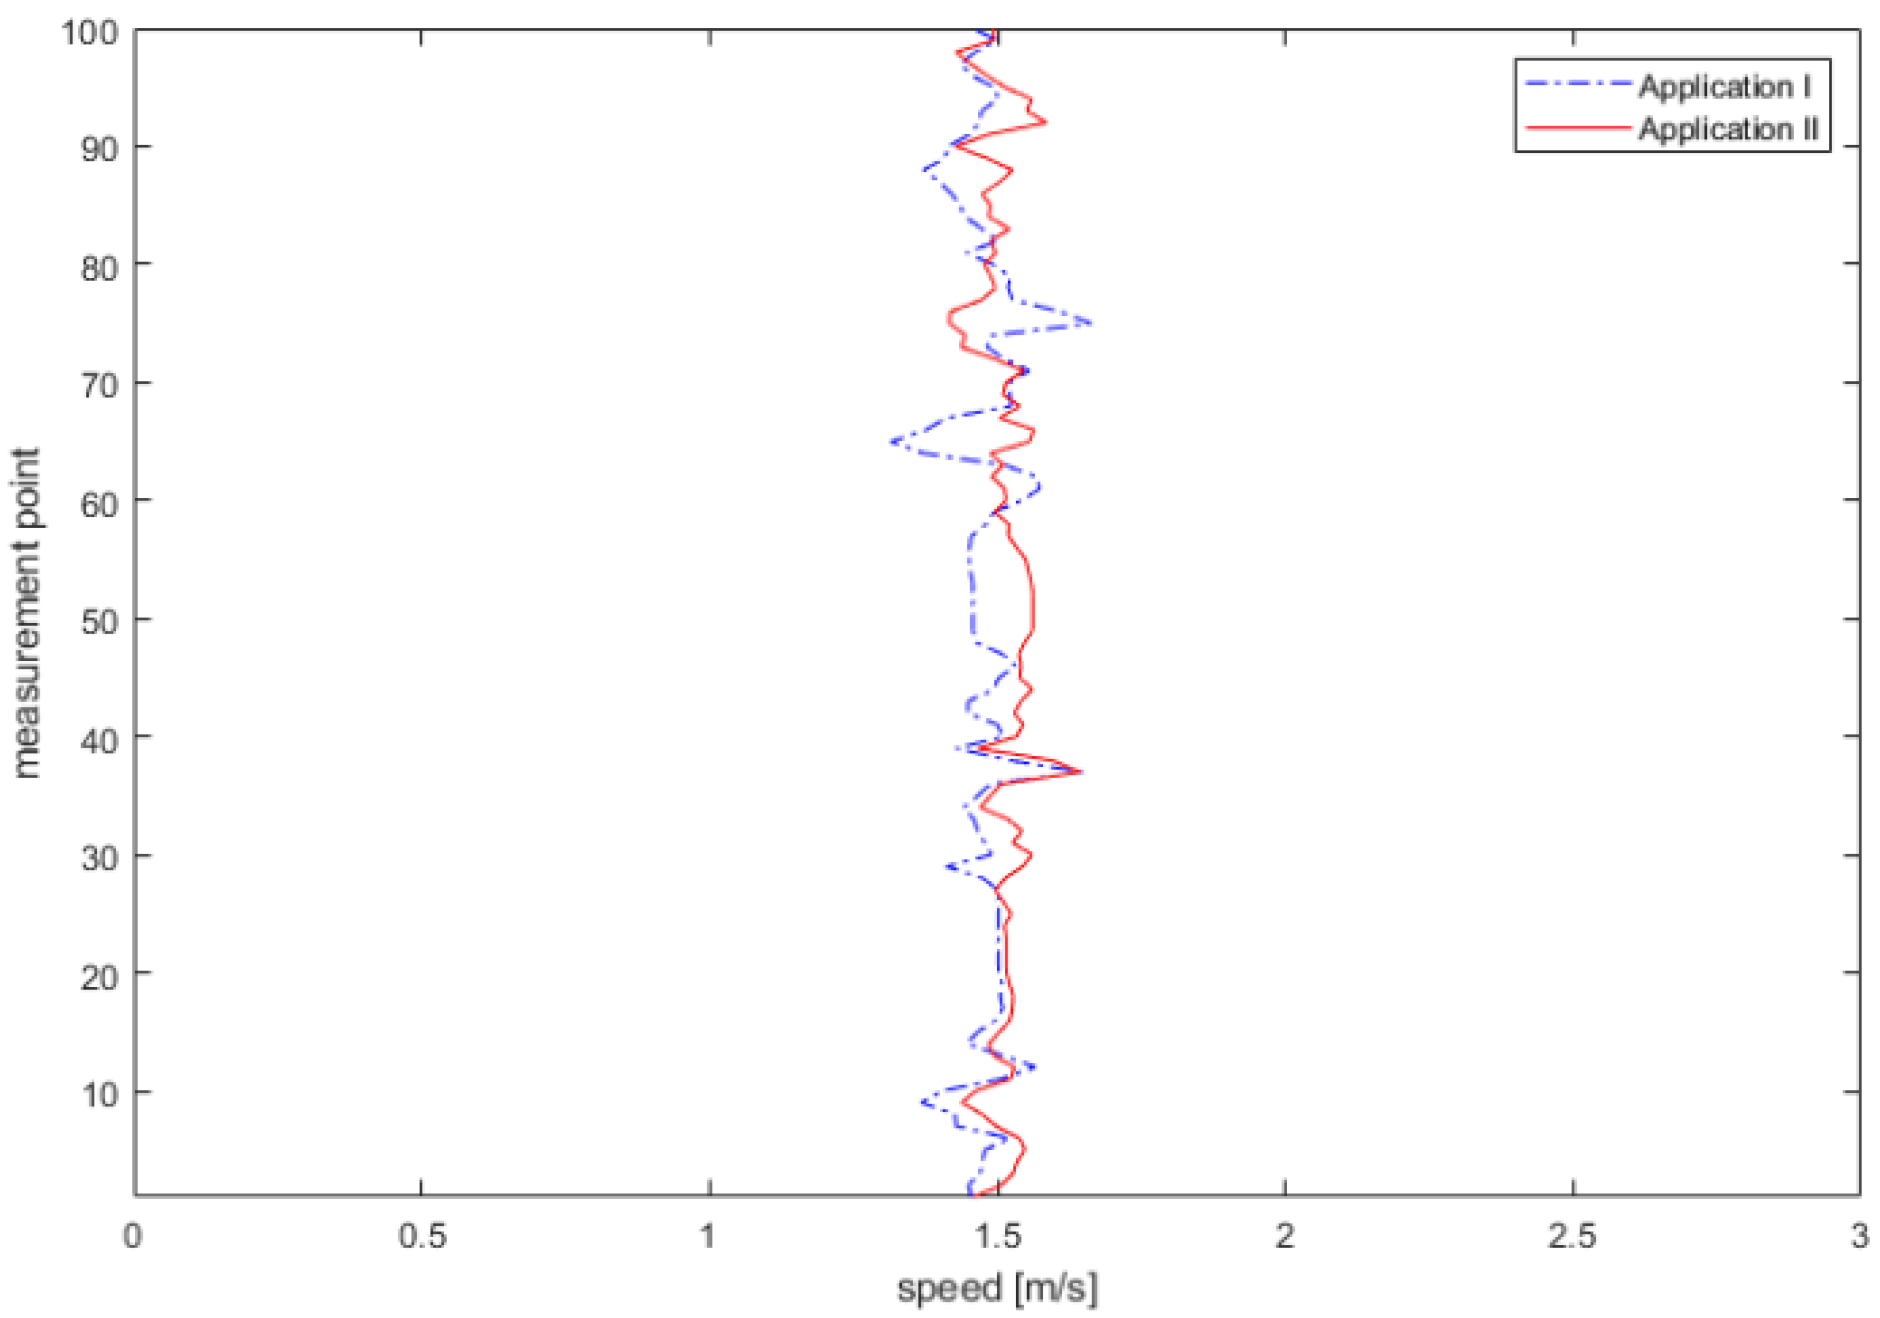
Figure 15 shows the average speeds of participants in lighting applications I and II. The mean speed significantly differed along the straight part of the path, which is between measurement points 0 and 70. The group of participants in lighting application I walked slower than the group of participants in lighting application II (application I: mean speed = 1.19, SD = 0.39; application II: mean speed = 1.51, SD = 0.14 F (1, 60) = 18.98, p < 0.001; partial eta-squared = 0.24).
7.2. Observer-Based Assessments
In the observer-based assessments of users’ perceptions of lighting conditions, participants assessed lighting application I as providing better visibility than lighting application II. In lighting application I, 69% of participants reported decreased visibility in parts of the path, compared to 12% in lighting application II. The difference is statistically significant (Chi-squared = 21.02, p < 0.001). Participants stated that it was dark between the light sources and in the curve (measurement points 70–100 along the path). Some participants mentioned that visibility was poor, as they experienced glare right under the light sources, and others reported that it was difficult to see other pedestrians, as they could just see their silhouette because the light was much stronger behind the person. Significant differences were identified for the question about how well one could see (Table 1). The most frequent adjectives circled to describe lighting application I were pleasant, glaring, reduced and spread, whereas none of the participants described it to be flickering, bright or mild. For lighting application II, the most frequent adjectives were good, cold, light, sharp and glaring. None of the participants experienced lighting application II as reduced, diffuse, bad, flickering, coloured, bright, drab, dark, unpleasant, weak, varied or warm (Figure 16).
Concerning the participants’ observer-based assessments of the lighting conditions, both perceived strength quality (PSQ) and perceived comfort quality (PCQ) differed significantly. Lighting application I was assessed as providing lower PSQ but higher PCQ than lighting application II (Table 1). The affective experience of the path did not significantly differ between lighting applications I and II, in neither valence nor arousal. In perceived danger of walking alone along the path, lighting application I tended to be assessed higher than lighting application II. A similar tendency was identified in the assessment of prospect of the path, but not in the possibilities for escape (Table 1).
There were no significant differences in the participants’ behavioural intention to walk along the path. However, the open-ended follow-up question revealed that reasons for avoiding the path differed somewhat between the two lighting applications. In lighting application I, the participants stressed that the path was dark, whereas, in lighting application II, it was noted that the surroundings were too dark.
The brief group discussion confirmed the differences identified in the questionnaire. In all discussions, mixed opinions were expressed as to what extent one would be willing to walk along the path alone; however, in lighting application I, participants stressed that the path, as such, was considered unsafe. The following are excerpts from group discussions illustrating a general feeling of being unsafe in application I:
- “Not sure the feeling of being unsafe was more about the lighting or the surrounding environment. I think it was the environment in general.”
- “I had the feeling it was deserted o this route, not safe to walk here (I did not have a positive feeling).”
The uneven lighting with dark spots between light sources was pointed out, and the curve with surrounding bushes being too dark was mentioned repeatedly. The following are excerpts from group discussions referring to the uneven distribution of light in lighting application I:
- “A feeling of being unsafe between lamps, particularly in the corner.”
- “A pretty neutral path, but some spots were either too dark (dangerous) or too bright.”
- “It is difficult to see what is around the corner (makes it difficult to see).”
- “Yes, this because of the brightness (brightest lamp) and then darkness immediately after.”
In lighting application II, the main issue raised during the discussions was that the path was well-lit, but the surroundings were perceived as dark. This was attributed to the relatively short distance between light sources in this lighting application. In comparison to discussions about application I, no one mentioned the curve as dark. Excerpts from group discussions describing the path as well-lit in lighting application II are as follows:
- “It was very dark around, even if in the path it was lit.”
- “Not a very pleasant area, but the lighting was quite good.”
- “It was hard to see outside of the route (the lamp spots). It was so bright that one could not see well the surroundings well.”
However, some of the participants described that they experienced the light as too bright or glaring, which interfered with their walking trajectory. Excerpts from group discussions describing the light as bright and glaring in lighting application II are as follows:
- “These lamps are quite sharp; it is good that there is so much light, for safety, but it is too bright in the end.”
- “I felt that when I passed under the light poles, I always had to look down; otherwise, it gave me a bad feeling, of glaring light.”
- “I always tried to stay on the left side, as I always do so, I avoided being totally under the light poles.”
7.3. Correlations between VAPM and Observer-Based Assessments
The mean speed of the whole path was positively correlated with observer-based assessments of visual accessibility (Pearson r = 0.28, p = 0.03) and arousal (Pearson r = 0.41, p = 0.001). The mean speed of the straight part of the path was also positively correlated with the visual accessibility (Pearson r = 0.40, p = 0.001), and the experienced visibility (Pearson r = 0.40, p < 0.001), and PSQ (Pearson r = 0.38, p = 0.002). Furthermore, the mean speed of the curve was negatively associated with visual accessibility (Pearson r = 0.26, p = 0.04). No significant correlations were identified between the mean value of the participants’ placements along the path and observer-based assessments.
8. Discussion
8.1. General Applicability of VAPM Methodology
The large-scale introduction of energy-efficient outdoor lighting applications for all citizens calls for a broad range of methods by which pedestrians’ perceptions and evaluations of, as well as behaviour in, the lit environment can be assessed systematically [21]. The development of video analysis of pedestrian movement (VAPM) has demonstrated great potential in capturing pedestrian walking behaviour under different lighting applications, and it goes beyond pedestrian flow and route choices. Importantly, VAPM could be applied in real settings and follow pedestrians during dark hours, thereby serving as a complement to laboratory studies of walking behaviour. The VAPM allows for the systematic observation and detailed analysis of microscopic movement, including placement and speed, while pedestrians are walking. The VAPM also has the potential to identify pedestrians’ microscopic movements in relation to the environmental context, such as the effective path width, obstacles, and the social context, including the presence of other road users. The comparison of microscopic movement between two lighting applications installed along the same path suggests that the VAPM can capture differences in pedestrians’ microscopic movements in response to the level of illuminance and the distribution of light. Such knowledge could facilitate choosing outdoor lighting applications that are both energy-efficient and adapted to people’s needs while walking in urban environments after sunset. The VAPM can also provide input for the calibration of simulation models of pedestrian behaviour, particularly in relation to ambient light variables, which are seldom used as model input, mainly due to the lack of adequate models and data to study such relationships.
8.2. The Contribution of VAPM in the Evaluation of User Responses to Outdoor Lighting for Pedestrians
Evaluations of outdoor lighting applications for pedestrians should, preferably, be based on methodological triangulation by combining photometric measurements with pedestrians’ experiences of the environment. Observer-based assessments performed on-site are useful to understand how light and the lit environment are perceived and evaluated. However, capturing pedestrians’ place-specific walking behaviour has been difficult. In comparing the two lighting applications in the small field study, results from previous studies using observer-based assessments were confirmed. Lighting application I, which has a lower level of illuminance than lighting application II, was considered to produce lower visibility, as well as provide for less visual accessibility and perceived strength of the light (PSQ) [14,21,64]. Lighting application I had a spectral power distribution more towards the higher end of visible light—yellow and red—when compared to the spectral power distribution of lighting application II, which had a peak in the blue-green spectrum. This difference may explain why lighting application I was considered to have a higher perceived comfort quality (PCQ) than lighting application II [14]. However, no significant differences in affective experience or the perceived danger of the environment were identified. One reason might be that in both of the lighting applications, the distribution of light was not experienced as optimal [65,66]. In application I, the light was perceived as pleasant and spread out, but the light in application II was assessed as good, cold, light and sharp. Group discussions revealed that the perceptions associated with application II also meant that the surroundings were experienced as relatively darker under lighting application II. The low and diffuse light in application I may have contributed to feelings of being unsafe, and the sharp contrast between the path and the surroundings may have contributed to similar feelings in application II.
Introducing VAPM further nuanced the understanding of the consequences of how the path was lit, showing that the participants’ mean speed significantly differed along the straight part of the path between the two lighting applications. This result is in line with previous results from a full-scale laboratory, where higher lux levels were associated with faster speed [42], and it is consistent with mean speed being correlated with visual accessibility and perceived strength quality. Another interpretation is that the surroundings were perceived as relatively darker, likely making it more difficult to discern environmental features. Previous research on walking speed during daytime hours proposes that walking speed increases when the surroundings are less interesting and pleasurable, whereas walking speed decreases in calm and green spaces [44,45]. These results point to the importance of looking into pedestrians’ microscopic movements in relation to their surroundings. The modest correlation between mean speed and arousal is likely an effect of the physical activity—in this case, walking. The analyses of individual participants’ placement showed that the VAPM could detect deviations in walking trajectories, and Figure 14 shows that participants tended to move towards the middle of the path under Lighting Application II. However, the average placement did not significantly differ between the two applications. Using on-site observations Markvica and colleagues [39] found differences in changes in placement in response to different lighting conditions. Further data from the VAPM would be needed to draw conclusions regarding placement.
8.3. VAPM in Practice
The market has experienced the rapid introduction of new light sources. Lighting applications with light-emitting diodes (LEDs) have immense potential in regulating the level of illuminance, as well as the direction and colour of light, and could contribute to reductions in energy use for outdoor lighting. However, LED light sources also fundamentally change the experience of the lit urban environment. This explorative study suggests that when new lighting applications are installed, knowledge of pedestrians’ microscopic movement, as captured by VAPM, could be valuable to ensure that the artificial light supports pedestrians by allowing a comfortable speed and choosing a safe placement. This is relevant in the development of inclusive urban settings during dark hours, especially in relation to traffic safety issues. However, more research is needed to gain a deeper understanding of the potential of VAPM to capture differences between different socio-demographic groups of pedestrians and in different settings. Future studies should aim for larger and more heterogeneous samples, including children and elderly participants. It would also be valuable to look into gender differences in pedestrians’ microscopic movement, as women’s perceived safety might be more sensitive to insufficiently lit urban settings. Such analyses would need other data collection procedures than structured walks with experimenters on-site, as their presence might dampen the perceived danger.
Pedestrian single accidents (falls) are the main cause of pedestrian injuries, as they are 30-times more likely to be injured due to falls than in collisions with motor vehicles [67]. One of the major contributing factors is uneven pavement [68], a problem that can be aggravated by insufficient outdoor lighting. While it is well-known that walking and cycling are very different transport modes and should have a separate infrastructure, in reality, the constraints of space in urban environments often force pedestrians and cyclists to co-exist on narrow paths. Accidents between pedestrians and cyclists are not unusual, including those resulting in serious injury and fatal outcomes [69]. Outdoor lighting could be an additional factor that affects interactions between the two transport modes, such as when insufficient or uneven light “forces” both pedestrians and cyclists to use only part of the available space. Such microscopic differences in movement might be difficult to capture with observer-based assessments. The field study did not allow for an in-depth analysis of interactions between pedestrians or between pedestrians and cyclists. This is an aspect that should be investigated further. In traffic safety research, various indicators, such as time-to-collision and post-encroachment time, are used to describe temporal–spatial relations between road users on a conflicting course. In pedestrian modelling, the “social force” concept is widely used [70]. Introducing similar indicators could provide a more versatile description of pedestrians’ interactions in different settings and help determine how they are affected by outdoor lighting.
In the present exploratory approach, a camera-based system mounted on top of a lamp post was tested for VAPM. It should be noted that the methodology, as such, was investigated, but the setup time and cost-benefits were not addressed. The costs and benefits of introducing VAPM at a larger scale in urban planning remain to be analysed, but first, some improvements in the technology could be suggested. In a follow-up study, video recordings from drones were tested with promising preliminary results and significant reductions in the labour input required for data collection. An alternative option could be integrating VAPM into the modern “smart-city” concept with many cameras and other sensors being installed to monitor and control traffic and other activities in urban spaces.
8.4. VAPM, Legal Issues and the Need for Further Development
One limitation of VAPM in its present form is that the use of video recordings in public spaces are often subject to regulations designed to protect personal data. Obtaining the necessary permissions, or proving that permissions are not required, can take a considerable amount of time and effort, and some restrictions might not be possible to resolve. A potential workaround is to use thermal video instead of the traditional RGB format. While it is not possible to recognise faces, the persons’ silhouettes are still readily visible, which allows the extraction of their positions via the same method used in this paper. Unfortunately, thermal cameras are considerably more expensive than RGBs, which may limit the number of cameras available and, ultimately, the length of a section that can be studied. Another possible option is to use video from airborne vehicles (i.e., drones) from significant heights so that the nearly vertical perspective and distance (the legal flying height limit in Sweden is currently 120 m) make it impossible to see faces or distinguish any other personal features. Another advantage is that the entire section, filmed with 12 cameras in this study, can be covered with just one drone-based recording, which significantly reduces the amount of post-processing work required before extracting trajectories. The future may bring even better technical solutions for smart city applications, such as more integrated sensors mounted on lamp posts or recharging stations for drones on top of lamp posts, for the task at hand. In such future scenarios, the fully automated analysis might be a direction well suited for rapid and better-founded data collection and statistical analysis prior to undertaking urban design efforts, as well as pedestrian traffic planning.
Collecting data on walking behaviour in traffic environments is not a simple task. Although the list of parameters that describe behaviour can be very long, many of them are difficult to measure. Thus far, using human observers has been the most common practice in both environmental psychology and traffic safety studies. However, many limitations are associated with this approach, including decreasing attention as the observer becomes fatigued, high costs (which seriously limit the length of the observation time), risk of subjective judgements, possible effects on road users’ behaviour when they find themselves being observed, and problems with finding a position for the observer so that his or her vision is not obscured. The VAPM, to some extent, overcomes these common problems in field studies.
The manual processing of data used in this study provided very accurate data on pedestrian movement. However, the labour intensity of such an approach seriously limits how much data can be feasibly produced. While the analysis was based on fewer than a hundred passages, thousands might be necessary to cover the variation in behaviour and adaptations to the ambient conditions, such as precipitation, fog, wind, and twilight vs. complete darkness. This stresses the need for further automation of the tracking of pedestrians using cognitive vision tools. Such tools are available (e.g., [71,72]), yet their accuracy and performance still need improvement.
9. Conclusions
In an era when energy efficiency, in general, and sustainable modes of transport, in particular, are promoted, it has become critically important to consider that outdoor lighting supports pedestrian needs. This study showed that it was possible for video analysis of pedestrian movement (VAPM) to capture pedestrians’ microscopic movement on artificially lit paths. The explorative field study suggests that efforts to evaluate pedestrian responses to outdoor lighting applications, in addition to observer-based assessments of pedestrian perception, and the evaluation of light and lit environments could include the analysis of pedestrian placement and walking speed as well. These variables revealed behavioural responses to the lit environment associated with self-reported visibility conditions. In turn, these variables might also have implications for reassurance or perceived danger, as well as traffic safety, aspects that may eventually have consequences for public acceptance of new lighting technology in the urban environment. Although the VAPM approach seems promising, it requires further testing in research on different groups of pedestrians and in a variety of settings before generalisable conclusions can be drawn regarding associations between lighting characteristics and pedestrians’ microscopic movement. Moreover, VAPM methodology needs to be further adapted to include the use of drones and integration in smart city lighting systems before it becomes time and cost-efficient enough to allow for large-scale use of VAPM in lighting design and urban planning.
Author Contributions
Funding acquisition, conceptualization, methodology, formal analysis, investigation, and data curation were performed by all co-authors; writing—original draft preparation M.J. and A.L.; writing—review and editing, M.N.; visualization, M.N.; project administration, M.J. All authors have read and agreed to the published version of the manuscript.
Funding
This research was funded by the Swedish Energy Agency, grant number 2014-002581.
Acknowledgments
The authors would like to thank Inês Ferreira, Hampus Norén, Johan Rahm and Carl Johnsson who essentially facilitated the on-site data collection. The authors would also like to express their gratitude to the City of Malmö that made the study possible and all participants who shared their experiences with us.
Conflicts of Interest
The authors declare no conflict of interest.
References
- United Nations. Transforming Our World: The 2030 Agenda for Sustainable Development; United Nations: Bruxelles, Belgium, 2015. [Google Scholar]
- Uttley, J.; Fotios, S. Using the daylight savings clock change to show ambient light conditions significantly influence active travel. J. Environ. Psychol. 2017, 53, 1–10. [Google Scholar] [CrossRef]
- Fotios, S.; Uttley, J.; Fox, S. A whole-year approach showing that ambient light level influences walking and cycling. Light. Res. Technol. 2017, 51, 55–64. [Google Scholar] [CrossRef]
- Davoodian, N.; Mansouri, A.A. Does street lighting affect pedestrian behaviour at night? In Proceedings of the CIE 2016—Lighting Quality and Energy Efficiency, Melbourne, Australia, 3–5 March 2016. [Google Scholar]
- Unwin, J.; Symonds, P.; Laike, T. Does Lighting Affect Pedestrian Flows? A Pilot Study in Lund, Market Harborough and Dublin. In Proceedings of the Lux Europa, Ljubljana, Slovenia, 18–20 September 2017; pp. 245–250. [Google Scholar]
- Davoodian, N. Visual saliency of urban objects at night: Impact of the density of background light patterns. Leukos 2011, 8, 137–152. [Google Scholar] [CrossRef]
- Boosma, C.; Steg, L. Feeling safe in the dark: Examining the effect of entrapment, lighting levels, and gender on feelings of safety and lighting policy acceptability. Environ. Behav. 2014, 46, 193–212. [Google Scholar] [CrossRef]
- van Rijswijk, L. Shedding Light on Safety Perceptions. Environmental Information Processing and the Role of Lighting. Ph.D. Thesis, Technical University of Eindhoven, Eindhoven, The Netherlands, 2015. [Google Scholar]
- Nasar, J.L.; Bokharaie, S. Impressions of lighting in public squares after dark. Environ. Behav. 2017, 49, 227–254. [Google Scholar] [CrossRef]
- GEA. Global Assessment—Toward a Sustainable Future; Cambridge University Press: Cambridge, UK; New York, NY, USA; The International Institute for Applied System Analysis: Laxenburg, Austria, 2012. [Google Scholar]
- IEA International Energy Agency. Energy Efficiency 2018—Analysis and Outlooks 2040; IEA: Paris, France, 2018. [Google Scholar]
- Waide, P.; Tanishima, S. Light’s Labour’s Lost: Policies for Energy-efficient Lighting; IEA/OECD: Paris, France, 2006. [Google Scholar]
- Boyce, P.; Fotios, S.; Richards, M. Road lighting and energy saving. Light. Res. Technol. 2009, 41, 245–260. [Google Scholar] [CrossRef]
- Johansson, M.; Pedersen, E.; Maleetipwan-Mattsson, P.; Kuhn, L.; Laike, T. Perceived outdoor lighting quality (POLQ): A lighting assessment tool. J. Environ. Psychol. 2014, 39, 14–21. [Google Scholar] [CrossRef]
- CIE. Lighting of Roads for Motor and Pedestrian Traffic; CIE: Austria, Vienna, 2010. [Google Scholar]
- CIE. Lighting for Pedestrian: A summary of Empirical Data; CIE: Austria, Vienna, 2019. [Google Scholar]
- Craik, K.H.; Feimer, N.R. Environmental assessment. In Handbook of Environmental Psychology; Stokols, D., Altman, I., Eds.; Wiley: NewYork, NY, USA, 1987; pp. 891–918. [Google Scholar]
- Küller, R. Environmental assessment from a neuropsychological perspective. In Environment, Cognition and Action; Gärling, T., Evans, G.W., Eds.; Oxford University Press: New York, NY, USA, 1991; pp. 78–95. [Google Scholar]
- Nasar, J.L. Assessing Perceptions of Environments for Active Living. Am. J. Prev. Med. 2008, 34, 357–363. [Google Scholar] [CrossRef]
- De Kort, Y.A.W. Tutorial: Theoretical Considerations When Planning Research on Human Factors in Lighting. Leukos 2019, 15, 85–96. [Google Scholar] [CrossRef] [Green Version]
- Rahm, J.; Johansson, M. Assessing the pedestrian response to urban outdoor lighting: A full-scale laboratory study. PLoS ONE 2018, 13, e0204638. [Google Scholar] [CrossRef] [Green Version]
- Rea, M.; Radetsky, L.; Bullough, J.D. Toward a model of outdoor lighting scene brightness. Light Res. Technol. 2010, 43, 7–30. [Google Scholar] [CrossRef]
- Fotios, S.; Cheal, C. Using obstacle detection to identify appropriate illuminances for lighting in residential roads. Light. Res. Technol. 2012, 45, 362–376. [Google Scholar] [CrossRef] [Green Version]
- Davoudian, N.; Raynham, P.; Barrett, E. Disability glare: A study in simulated road lighting conditions. Light. Res. Technol. 2013, 46, 695–705. [Google Scholar] [CrossRef] [Green Version]
- Fotios, S.; Johansson, M. Appraising the intention of other people: Ecological validity and procedures for investigating effects of lighting for pedestrians. Light. Res. Technol. 2017, 51, 111–130. [Google Scholar] [CrossRef] [Green Version]
- Kuller, R.; Wetterberg, L. The subterranean work environment: Impact on well-being and health. Environ. Int. 1996, 22, 33–52. [Google Scholar] [CrossRef]
- Nikunen, H.J.; Korpela, K. Restorative Lighting Environments-Does the Focus of Light Have an Effect on Restorative Experiences? J. Light Vis. Environ. 2009, 33, 37–45. [Google Scholar] [CrossRef]
- Nikunen, H.; Puolakka, M.; Rantakallio, A.; Korpela, K.; Halonen, L. Perceived restorativeness and walkway lighting in near-home environments. Light. Res. Technol. 2013, 46, 308–328. [Google Scholar] [CrossRef]
- Blöbaum, A.; Hunecke, M. Perceived danger in urban public space. The impacts of physical features and personal factors. Environ. Behav. 2005, 37, 465–486. [Google Scholar] [CrossRef]
- Rahm, J.; Sternudd, C.; Johansson, M. “In the evening, I don’t walk in the park”: The interplay between street lighting and greenery in perceived safety. Urban Des. Int. 2020. [Google Scholar] [CrossRef]
- Hanyu, K. Visual properties and affective appraisals in residential areas after dark. J. Environ. Psychol. 1997, 17, 301–315. [Google Scholar] [CrossRef]
- Cortés, A.B.C.; Morales, L.E.F. Emotions and the Urban Lighting Environment. SAGE Open 2016, 6, 1–8. [Google Scholar]
- Robson, C. Real World Research; John Wiley Sons Ltd.: Hoboken, NJ, USA, 2011. [Google Scholar]
- Herbert, D.; Davidson, N. Modifying the built environment: The impact of improved street lighting. Geoforum 1994, 25, 339–350. [Google Scholar] [CrossRef]
- Painter, K. The influence of street lighting improvements on crime, fear and pedestrian street use, after dark. Landsc. Urban Plan. 1996, 35, 193–201. [Google Scholar] [CrossRef]
- Hariyono, J.; Jo, K.-H. Detection of pedestrian crossing road: A study on pedestrian pose recognition. Neurocomputing 2017, 234, 144–153. [Google Scholar] [CrossRef]
- Fisher, B.S.; Nasar, J.L. Fear of Crime in Relation to Three Exterior Site Features. Environ. Behav. 1992, 24, 35–65. [Google Scholar] [CrossRef]
- Markvica, K.; Richter, G.; Lenz, G. Impact of urban street lighting on road users’ perception of public space and mobility behavior. Build. Environ. 2019, 154, 32–43. [Google Scholar] [CrossRef]
- Maleetipwan-Mattsson, P.; Johansson, M.; Almén, M.; Laike, T.; Marcheschi, E.; Ståhl, A. Improved Usability of Pedestrian Environments After Dark for People with Vision Impairment: An Intervention Study. Sustainability 2020, 12, 1096. [Google Scholar] [CrossRef] [Green Version]
- Itoh, N. Visual guidance of walking: Effects of illumination level and edge emphasis. Gerontechnology 2006, 5, 246–252. [Google Scholar] [CrossRef]
- Choi, J.-S.; Kang, D.-W.; Shin, Y.-H.; Tack, G.-R. Differences in gait pattern between the elderly and the young during level walking under low illumination. Acta Bioeng. Biomech. 2014, 16, 3–9. [Google Scholar]
- Pedersen, E.; Johansson, M. Dynamic pedestrian lighting: Effects on walking speed, legibility and environmental perception. Light. Res. Technol. 2016, 50, 522–536. [Google Scholar] [CrossRef]
- Finnis, K.K.; Walton, D. Field observations to determine the influence of population size, location and individual factors on pedestrian walking speeds. Ergonomics 2008, 51, 827–842. [Google Scholar] [CrossRef] [PubMed]
- Franěk, M. The effect of urban vegetation and traffic intensity on walking speed. Recent Res. Eng. Mech. Urban Nav. Transp. Tour. 2012, 163–166. Available online: http://www.researchgate.net/profile/Marek_Franek/publication/268201382_The_effect_of_urban_vegetation_and_traffic_intensity_on_walking_speed/links/547b57b30cf205d16881c490/The-effect-of-urban-vegetation-and-traffic-intensity-on-walking-speed.pdf (accessed on 1 July 2019).
- Franěk, M. Pedestrian walking speed as a response to environmental properties. Adv. Environ. Sci. Sustain. 2012, 87–90. Available online: http://www.wseas.us/e-library/conferences/2012/Sliema/NACGURES/NACGURES-12.pdf (accessed on 1 July 2019).
- Willis, A.; Gjersoe, N.; Havard, C.; Kerridge, J.; Kukla, R. Human movement behaviour in urban spaces: Implications for the design and modelling of effective pedestrian environments. Environ. Plan. B Plan. Des. 2004, 31, 805–828. [Google Scholar] [CrossRef] [Green Version]
- Jazwinski, C.H.; Walcheski, C.H. At the Mall With Children: Group Size and Pedestrian Economy of Movement. Environ. Behav. 2011, 43, 363–386. [Google Scholar] [CrossRef]
- Andersson, J. Image Processing for Analysis of Road User Behaviour—A Trajectory Based Solution, Bulletin 212; Lund Institute of Technology, Department of Technology and Society, Traffic Engineering. 2000. Available online: https://lup.lub.lu.se/search/publication/627183 (accessed on 1 July 2019).
- Høye, A.; Laureshyn, A.; Vaa, T. Evaluering av et Fotgjengeraktivert Varslingssystem i Gangfelt: “SeeMe”; Rapport 1496/2016; TØI Institute of Transport Economics/Norwegian Centre for Transport Research: Oslo, Norway, 2016. [Google Scholar]
- Tageldin, A.; Sayed, T. Developing evasive action-based indicators for identifying pedestrian conflicts in less organized traffic environments. J. Adv. Transp. 2016, 50, 1193–1208. [Google Scholar] [CrossRef]
- Ismail, K.; Sayed, T.; Saunier, N. Automated Analysis of Pedestrian–Vehicle Conflicts. Transp. Res. Rec. J. Transp. Res. Board 2010, 2198, 52–64. [Google Scholar] [CrossRef]
- Laureshyn, A.; Nilsson, M. How accurately can we measure from video? Practical considerations and enhancement of the camera calibration procedure. Transp. Res. Rec. 2018, 2672, 24–33. [Google Scholar] [CrossRef]
- Kingma, D.P.; Ba, J. Adam: A Method for Stochastic Optimization. In Proceedings of the 3rd International Conference on Learning Representations, San Diego, CA, USA, 7–9 May 2015. [Google Scholar]
- Bottou, L.; Curtis, F.; Nocedal, J. Optimization Methods for Large-Scale Machine Learning. SIAM Rev. 2018, 60, 223–311. [Google Scholar] [CrossRef]
- Bottou, L.; Bousquet, O. The Tradeoffs of Large Scale Learning. In Optimization for Machine Learning; Sra, S., Nowozin, S., Wright, S.J., Eds.; MIT Press: Cambridge, MA, USA, 2011; pp. 351–368. [Google Scholar]
- Zhang, S.; Yang, J.; Schiele, B. Occluded Pedestrian Detection Through Guided Attention in CNNs. In Proceedings of the IEEE Conference on Computer Vision and Pattern Recognition (CVPR), Salt Lake City, UT, USA, 18–23 June 2018; Available online: https://openaccess.thecvf.com/content_cvpr_2018/papers/Zhang_Occluded_Pedestrian_Detection_CVPR_2018_paper.pdf (accessed on 15 January 2020).
- Trafikverket [Swedish Transport Administration]. Vägbelysningshandboken [Street Lighting Guide]; Trafikverket: Borlänge, Sweden, 2014. [Google Scholar]
- Tsai, R.Y. An Efficient and Accurate Camera Calibration Technique for 3D Machine Vision. In Proceedings of the IEEE Conference on Computer Vision and Pattern Recognition, Miami Beach, FL, USA, 22–26 June 1986. [Google Scholar]
- T-Analyst. Semi-Automated Video Processing. Available online: https://bitbucket.org/TrafficAndRoads/tanalyst/wiki/Manual (accessed on 15 January 2020).
- Johansson, M.; Sternudd, C.; Karrholm, M. Perceived urban design qualities and affective experiences of walking. J. Urban Des. 2016, 21, 256–275. [Google Scholar] [CrossRef]
- Rahm, J. Urban Outdoor Lighting: Pedestrian Perception, Evaluation and Behaviour in the Lit Environment. Ph.D. Thesis, Lund University, Lund, Sweden, 2019. [Google Scholar]
- Russell, J.A.; Weiss, A.; Mendelsohn, G.A. Affect Grid: A Single-Item Scale of Pleasure and Arousal. J. Personal. Soc. Psychol. 1989, 57, 493–502. [Google Scholar] [CrossRef]
- Västfjäll, D.; Gärling, T. Validation of a Swedish short self-report measure of core affect. Scand. J. Psychol. 2007, 48, 233–238. [Google Scholar] [CrossRef] [PubMed]
- Johansson, M.; Rosén, M.; Küller, R. Individual factors influencing the assessment of the outdoor lighting of an urban footpath. Light. Res. Technol. 2010, 43, 31–43. [Google Scholar] [CrossRef]
- Knight, C. Field surveys investigating the effect of lamp spectrum on the perception of safety and comfort at night. Lighting Res. Technol. 2010, 42, 313–330. [Google Scholar] [CrossRef]
- Haans, A.; De Kort, Y.A.W. Light distribution in dynamic street lighting: Two experimental studies on its effects on perceived safety, prospect, concealment, and escape. J. Environ. Psychol. 2012, 32, 342–352. [Google Scholar] [CrossRef]
- Berntman, M. Fotgängares Olyckor och Skador i Trafikmiljö med Fokus på Fallolyckor; Lund University Publications: Lund, Sweden, 2015. [Google Scholar]
- Arvidsson, A.K. Krav för att Förhindra Fallolyckor—Tekniska Egenskapskrav för Gator och Vägar; VTI Rapport 932; Swedish National Road and Transport Research Institute: Linköping, Sweden, 2017. [Google Scholar]
- Van Der Horst, A.R.A.; De Goede, M.; De Hair-Buijssen, S.; Methorst, R. Traffic conflicts on bicycle paths: A systematic observation of behaviour from video. Accid. Anal. Prev. 2014, 62, 358–368. [Google Scholar] [CrossRef]
- Helbing, D.; Molnár, P. Social force model for pedestrian dynamics. Phys. Rev. E 1995, 51, 4282–4286. [Google Scholar] [CrossRef] [Green Version]
- Jensen, M.B.; Ahrnbom, M.; Kruithof, M.; Åström, K.; Nilsson, M.; Ardö, H.; Laureshyn, A.; Johnsson, C.; Moeslund, T.B. A Framework for Automated Analysis of Surrogate Measures of Safety from Video using Deep Learning Techniques. In Proceedings of the Transportation Research Board (TRB) 98th Annual Meeting 2019, Washington, DC, USA, 13–17 January 2019. [Google Scholar]
- Fu, T.; Stipancic, J.; Zangenehpour, S.; Miranda-Moreno, L.; Saunier, N. Automatic Traffic Data Collection under Varying Lighting and Temperature Conditions in Multimodal Environments: Thermal versus Visible Spectrum Video-Based Systems. J. Adv. Transp. 2017, 2017, 1–15. [Google Scholar] [CrossRef]
Figure 1.
The layout of the study site.

Figure 2.
Spectral power distribution for lighting application I.

Figure 3.
Spectral power distribution for lighting application II.

Figure 4.
Illuminance (lx) measured horizontally in the walking direction on the straight part of the path at ground level, from lamp post 1 to the middle of posts 1 and 2; lighting application I (left); lighting application II (right). The black dots illustrate the location of lamp posts.
Figure 4.
Illuminance (lx) measured horizontally in the walking direction on the straight part of the path at ground level, from lamp post 1 to the middle of posts 1 and 2; lighting application I (left); lighting application II (right). The black dots illustrate the location of lamp posts.

Figure 5.
Locations of lamp posts (dots) and the direction of camera views in lighting application I. The red dots indicate the locations of lamp posts, and the yellow dot is the additional pole (with no lamps on it) installed in the turn.
Figure 5.
Locations of lamp posts (dots) and the direction of camera views in lighting application I. The red dots indicate the locations of lamp posts, and the yellow dot is the additional pole (with no lamps on it) installed in the turn.

Figure 6.
A sample frame illustrating camera perspectives.

Figure 7.
Screenshot of the T-Analyst software [7].
Figure 7.
Screenshot of the T-Analyst software [7].

Figure 8.
One hundred normalised midpoints used to describe the longitudinal position of a pedestrian.
Figure 8.
One hundred normalised midpoints used to describe the longitudinal position of a pedestrian.

Figure 9.
Scoring the lateral position of a pedestrian in relation to the sidewalk borders.

Figure 10.
Example of pedestrian path decisions.

Figure 11.
Lateral position of participants in lighting application I (a) and lighting application II (b).
Figure 11.
Lateral position of participants in lighting application I (a) and lighting application II (b).

Figure 12.
An example of a “deviant” placement of the pedestrian on the path. The red circle shows a “hook” to the left in the region of 10–30.
Figure 12.
An example of a “deviant” placement of the pedestrian on the path. The red circle shows a “hook” to the left in the region of 10–30.

Figure 13.
Another example of “deviant” behaviour; the participant keeps to the left until encountering another pedestrian. The red circle shows a “hook” to the right in the region of 75–90.
Figure 13.
Another example of “deviant” behaviour; the participant keeps to the left until encountering another pedestrian. The red circle shows a “hook” to the right in the region of 75–90.

Figure 14.
Average placement of participant walking in lighting application I (blue) and lighting application II (red).
Figure 14.
Average placement of participant walking in lighting application I (blue) and lighting application II (red).

Figure 15.
Average speed of groups in lighting applications I (blue) and II (red).

Figure 16.
Participants’ description of their perception of the lighting conditions. Percentage of participants who circled each adjective.
Figure 16.
Participants’ description of their perception of the lighting conditions. Percentage of participants who circled each adjective.


Table 1.
Observer-based environmental assessments of lighting applications I and II, divided into assessments of perception, evaluation and behavioural intention.
Table 1.
Observer-based environmental assessments of lighting applications I and II, divided into assessments of perception, evaluation and behavioural intention.
| Variable | Lighting Application I | Lighting Application II | ANOVA | Significance | |||
|---|---|---|---|---|---|---|---|
| M | SD | M | SD | F (1, 60) | p | Partial eta-squared | |
| Perception | |||||||
| See well | 4.27 | 1.51 | 6.00 | 0.93 | 29.99 | <0.001 | 0.33 |
| Visual accessibility | 3.12 | 0.96 | 4.29 | 0.71 | 30.13 | <0.001 | 0.33 |
| Evaluation | |||||||
| PSQ | 4.04 | 1.07 | 5.45 | 0.85 | 33.37 | <0.001 | 0.36 |
| PCQ | 3.97 | 1.12 | 3.03 | 1.23 | 9.78 | =0.003 | 0.14 |
| Affective responses | |||||||
| Valence | 3.10 | 1.18 | 3.45 | 0.93 | 1.78 | n.s. | - |
| Arousal | 3.43 | 1.07 | 3.51 | 0.96 | 0.10 | n.s. | - |
| Perceived danger | 2.77 | 1.25 | 2.23 | 1.10 | 3.05 | =0.086 | 0.05 |
| Prospect | 2.48 | 1.12 | 3.00 | 1.17 | 3.13 | =0.082 | 0.05 |
| Escape | 2.20 | 1.26 | 2.51 | 1.27 | 0.91 | n.s. | - |
| Behaviour | |||||||
| Intention to choose | 3.41 | 1.32 | 3.63 | 1.16 | 0.49 | n.s. | - |
| Intention to avoid | 2.86 | 1.22 | 2.45 | 1.17 | 1.80 | n.s. | - |
M = mean, SD = standard deviation.
© 2020 by the authors. Licensee MDPI, Basel, Switzerland. This article is an open access article distributed under the terms and conditions of the Creative Commons Attribution (CC BY) license (http://creativecommons.org/licenses/by/4.0/).
Share and Cite
MDPI and ACS Style
Johansson, M.; Laureshyn, A.; Nilsson, M. Video Analysis of Pedestrian Movement (VAPM) under Different Lighting Conditions—Method Exploration. Energies 2020, 13, 4141. https://0-doi-org.brum.beds.ac.uk/10.3390/en13164141
AMA Style
Johansson M, Laureshyn A, Nilsson M. Video Analysis of Pedestrian Movement (VAPM) under Different Lighting Conditions—Method Exploration. Energies. 2020; 13(16):4141. https://0-doi-org.brum.beds.ac.uk/10.3390/en13164141
Chicago/Turabian StyleJohansson, Maria, Aliaksei Laureshyn, and Mikael Nilsson. 2020. "Video Analysis of Pedestrian Movement (VAPM) under Different Lighting Conditions—Method Exploration" Energies 13, no. 16: 4141. https://0-doi-org.brum.beds.ac.uk/10.3390/en13164141
Note that from the first issue of 2016, this journal uses article numbers instead of page numbers. See further details here.