Article

Development and Experimental Study of the First Stage in a Two-Stage Water-Flooded Single-Screw Compressor Unit for Polyethylene Terephthalate Bottle Blowing System

1
Department of Power and Electrical Engineering, Northwest A&F University, No.3 Taicheng Road, Yangling 712100, China
2
Key Laboratory of Agricultural Soil and Water Engineering in Arid and Semiarid Areas, Ministry of Education, Northwest A&F University, Yangling 712100, China
3
Institute of Water Resources and Hydro-Electing Engineering, Xi’an University of Technology, No.5 South Jinhua Road, Xi’an 710048, China
4
School of Energy and Power Engineering, Xi’an Jiaotong University, No.28, Xianning West Road, Xi’an 710049, China
*
Author to whom correspondence should be addressed.
Submission received: 7 July 2020 / Revised: 2 August 2020 / Accepted: 13 August 2020 / Published: 16 August 2020

Abstract

:
The oil-free compressor is a key component in fabricating polyethylene terephthalate (PET) bottles for beverages and water. At present, the main compressor type used for blowing PET bottles is the reciprocating compressor. However, compared to screw compressors, reciprocating compressors have shortcomings of high energy consumption and too many consumable parts. Many manufacturers of PET bottles in Asia are seeking to replace reciprocating compressors with screw compressors, as we know. Screw compressors can be classified as single-screw compressors (SSC) and twin-screw compressors. Since the load in a twin-screw compressor is far larger than that in an SSC, SSCs are more suitable for being developed for high-pressure applications such as PET bottle blowing. This paper presents a performance study on an oil-free single-screw compressor as the first stage of the PET compressor unit. A 5.4 m3·min−1 prototype and its test rig were developed. The thermophysical process of the moist air is theoretically analyzed. The pressure loss on the flow path and the influence of the important parameters are experimentally investigated. It is found that water vapor cannot be separated during the adiabatic compression process. The results also show that the pressure loss from the discharging duct to the check valve accounts for the largest percentage of the total pressure loss. The experimental results further show that the discharge capacity and shaft power increase almost linearly with the motor speed. The efficiency declines with increasing injected water temperature. The discharge capacity and shaft power all increase with the injected water flowrate, and an optimum flowrate is found to ensure a highest isentropic efficiency. With the increase in discharge pressure, the discharge capacity decreases, and the shaft power increases. The isentropic efficiency is found to have its maximum value at a certain discharge pressure.

Graphical Abstract

1. Introduction

Polyethylene terephthalate (PET) is widely used in the stretch blow molding process for packaging applications [1], such as beverage bottles and mineral water bottles. Two-stage stretch-blow molding (SBM) is the most popular process for fabricating PET bottles. In the first step, the preform is heated by infrared heaters and softened. In the second step, the preform is placed in the blow-molding machine, stretched longitudinally by a cylindrical rod, and blown by oil-free compressed air [2]. The air pressure ranges from 2.5 MPa~5 MPa (pressure ratio 25~50), since the bottles have different sizes and thicknesses.
Air compressors with comparatively high discharge pressure are the key equipment for the SBM process. At present, multi-stage reciprocating compressors or screw-reciprocating tandem compressors are the main types of compressor unit adopted in SBM. However, compared to the screw compressors, the reciprocating compressors have the downsides of huge space occupation, high energy consumption, low single stage pressure ratio, more consumable parts and shorter maintenance cycle. Frequent replacement of the consumable parts leads to big challenges with respect to the requirement for continuous air consumption. Therefore, there is urgent demand to substitute the existing compressor units with two-stage screw compressor units without reciprocating compressors.
Several studies have been published on two-stage dry-screw compressors. Andres presented a computational fluid dynamics (CFD) model to simulate a two-stage screw compressor provided by Sullair, which has a final discharge pressure of 7.98 bar. The model allows a direct coupling of the two stages without specifying the boundary conditions at the interstage [3]. Zlatanovic investigated the desuperheating process through liquid injection in an ammonia refrigeration system with two-stage screw compressors, which has a total pressure ratio of 22 [4]. Liu presented a mathematical model of a two-stage oil-free screw compressor, analyzed how the interstage pressure was built, and developed a prototype with a total pressure of 9 bar [5]. Screw compressors mainly include twin-screw compressors and single-screw compressors (SSCs). The screw compressors mentioned in references [3,4,5] are all twin-screw compressors. However, little research on oil-free twin-screw compressors has been reported in higher pressure ratio applications such as PET. Compared to twin-screw compressors, SSCs have an excellent force characteristic, since the axial force and the radial force applied on the screw rotor are all completely balanced [6]. The force applied on the gate-rotor in the SSC is far smaller than that applied on the twin-screw rotor [7]. The advantage of fine mechanical properties makes the SSC much easier to develop into a comparatively high discharge pressure compressor unit.
SSCs have a wide range of applications in industry. Lu et al. manufactured a mini SSC with a refrigerating capacity of 2.02 kW to cool CPUs [8]. Li et al. simulated a new natural gas liquefaction process, designed and tested an SSC for the process, and conducted performance testing to investigate the optimum oil-gas ratio and motor speed [9,10]. Yang et al. investigated the SSC performance in a mechanical vapor recompression system with different amounts of injected water [11]. Ziviani presented a mechanistic model for calculating the sealing lines, groove volume curves, and other geometric features for an expander design in the organic Rankine cycle [12]. Wu et al. proposed a model for high-speed SSC working for fuel cells on vehicles, and calculated the properties of compressed air, volume efficiency and energy dissipation at different speeds [13].
Meshing pair profile (MPP) is one of the key technologies of the SSC. A large volume of research has been published regarding the MPP and the corresponding manufacturing method. Yang et al. established a mathematical model to describe CC type, PP type and PC type MMPs, calculated the meshing lines and analyzed the contact stress, and manufactured PP type and PC type meshing pairs by rapid prototyping and five-axis CNC milling [14,15,16,17]. Based on the original single straight line type (SSLT) MPP, Feng and Xu proposed a new multi straight lines type (MSLT) MPP, enabling the enveloping straight lines to mesh with the screw groove flank alternately, helping to reduce meshing line wear [18]. Furthermore, by combining the advantages of the MSLT and another original single column type (SCT) MMP, Feng, Wu and Liu invented another multi column type (MCT) MPP, put forward corresponding machining method of milling process at multi tool locations, and developed special machines for processing MCT [19,20,21,22]. To increase the capacity of the SSC without rotor enlargement, Takanori et al. developed a fan-shaped tooth profile and achieved a 30% increase in capacity [23]. In order to disperse the contact area to the maximum on the tooth flank, Wu et al. designed a curved flank that could be elliptical, hyperbolic, involute or other curves [24]. Minikaev et al. established a system of differential equations to describe the contour of the meshing surface, and modeled a no-gap meshing pair by computer calculations and Boolean operations [25]. In order to overcome the limitation caused by manufacturability and accuracy, Ziviani et al. put forward a new design methodology that cancels the upper and lower meshing surfaces to avoid interference with the groove flanks, and manufactured a sample meshing pair by 3D printing [26].
Along with the development of the MPPs, several studies have been conducted on the performance of MPPs, especially with respect to their tribological characteristics. Li and Wang studied the dry friction resistance of different MPPs by calculating friction angle and Hertz contact stress and testing wear loss by an eccentric wheel [27,28]. The results showed that the MCT had the best wear resistance, and SSLT had a poor performance. However, since the meshing pair are lubricated by an abundant volume of injected liquid, the lubrication performance investigations are more significant. Post and Zwaans researched hydrodynamic lubrication in the meshing pair gaps and calculated the oil film pressure by the finite method [29]. Huang et al. optimized the SCT and applied it to an oil-flooded prototype [30]. Li et al. designed a modeling experiment to verify the hydrodynamic phenomenon and compared the lubrication performance between SSLT and MCT, indicating that the MCT had the ability to keep full fluid film on both sides of the tooth [31,32].
Several studies have been published on the thermodynamic characteristics of the SSCs. In the refrigeration area, Wang et al. investigated the heat transfer area influenced by the main geometric characteristics, proposed a model to calculate the heat transfer between the gas and the oil film adhering on the working chamber wall based on an assumption of poor oil atomization, studied the leakage properties and provided optimized design proposals for high volumetric efficiency, presented an injection model, and analyzed the relationship between the performance parameters of the compressor and the injection hole design parameters [33,34,35,36,37]. Based on the exergy theory, Wu et al. studied shaft power wastage, classifying it into four components: irreversible heat transfer, adiabatic throttling, mixing of two flows, and heat dissipated to the environment, indicating that the exergy loss decreased with increasing rotating speed [38]. Li et al. analyzed the thermal process of an oil-flooded SSC using natural gas liquefaction and tested its main energy efficiency indices [9,10]. It can be seen that the published studies related to the thermodynamic performance of SSCs are mostly focused on the refrigeration SSC and the oil-flooded SSC.
However, few investigations have been reported on the thermodynamic performance of the water-flooded SSC, especially experimental studies. In this paper, a dehumidifying model is established to analyze the particular problem of the water-flooded air SSC, which is the impact of moist air on compressor performance. A prototype is developed using a water-flooded SSC as the first stage of the PET compressor and its system. The pressure loss information of the whole flow path is tested. The effects of motor speed, injected water temperature, injected water flowrate and the discharge pressure on SSC performance are experimentally investigated. The obtained results may be valuable for developing two-stage SSC units for PET.

2. Theoretical Analysis

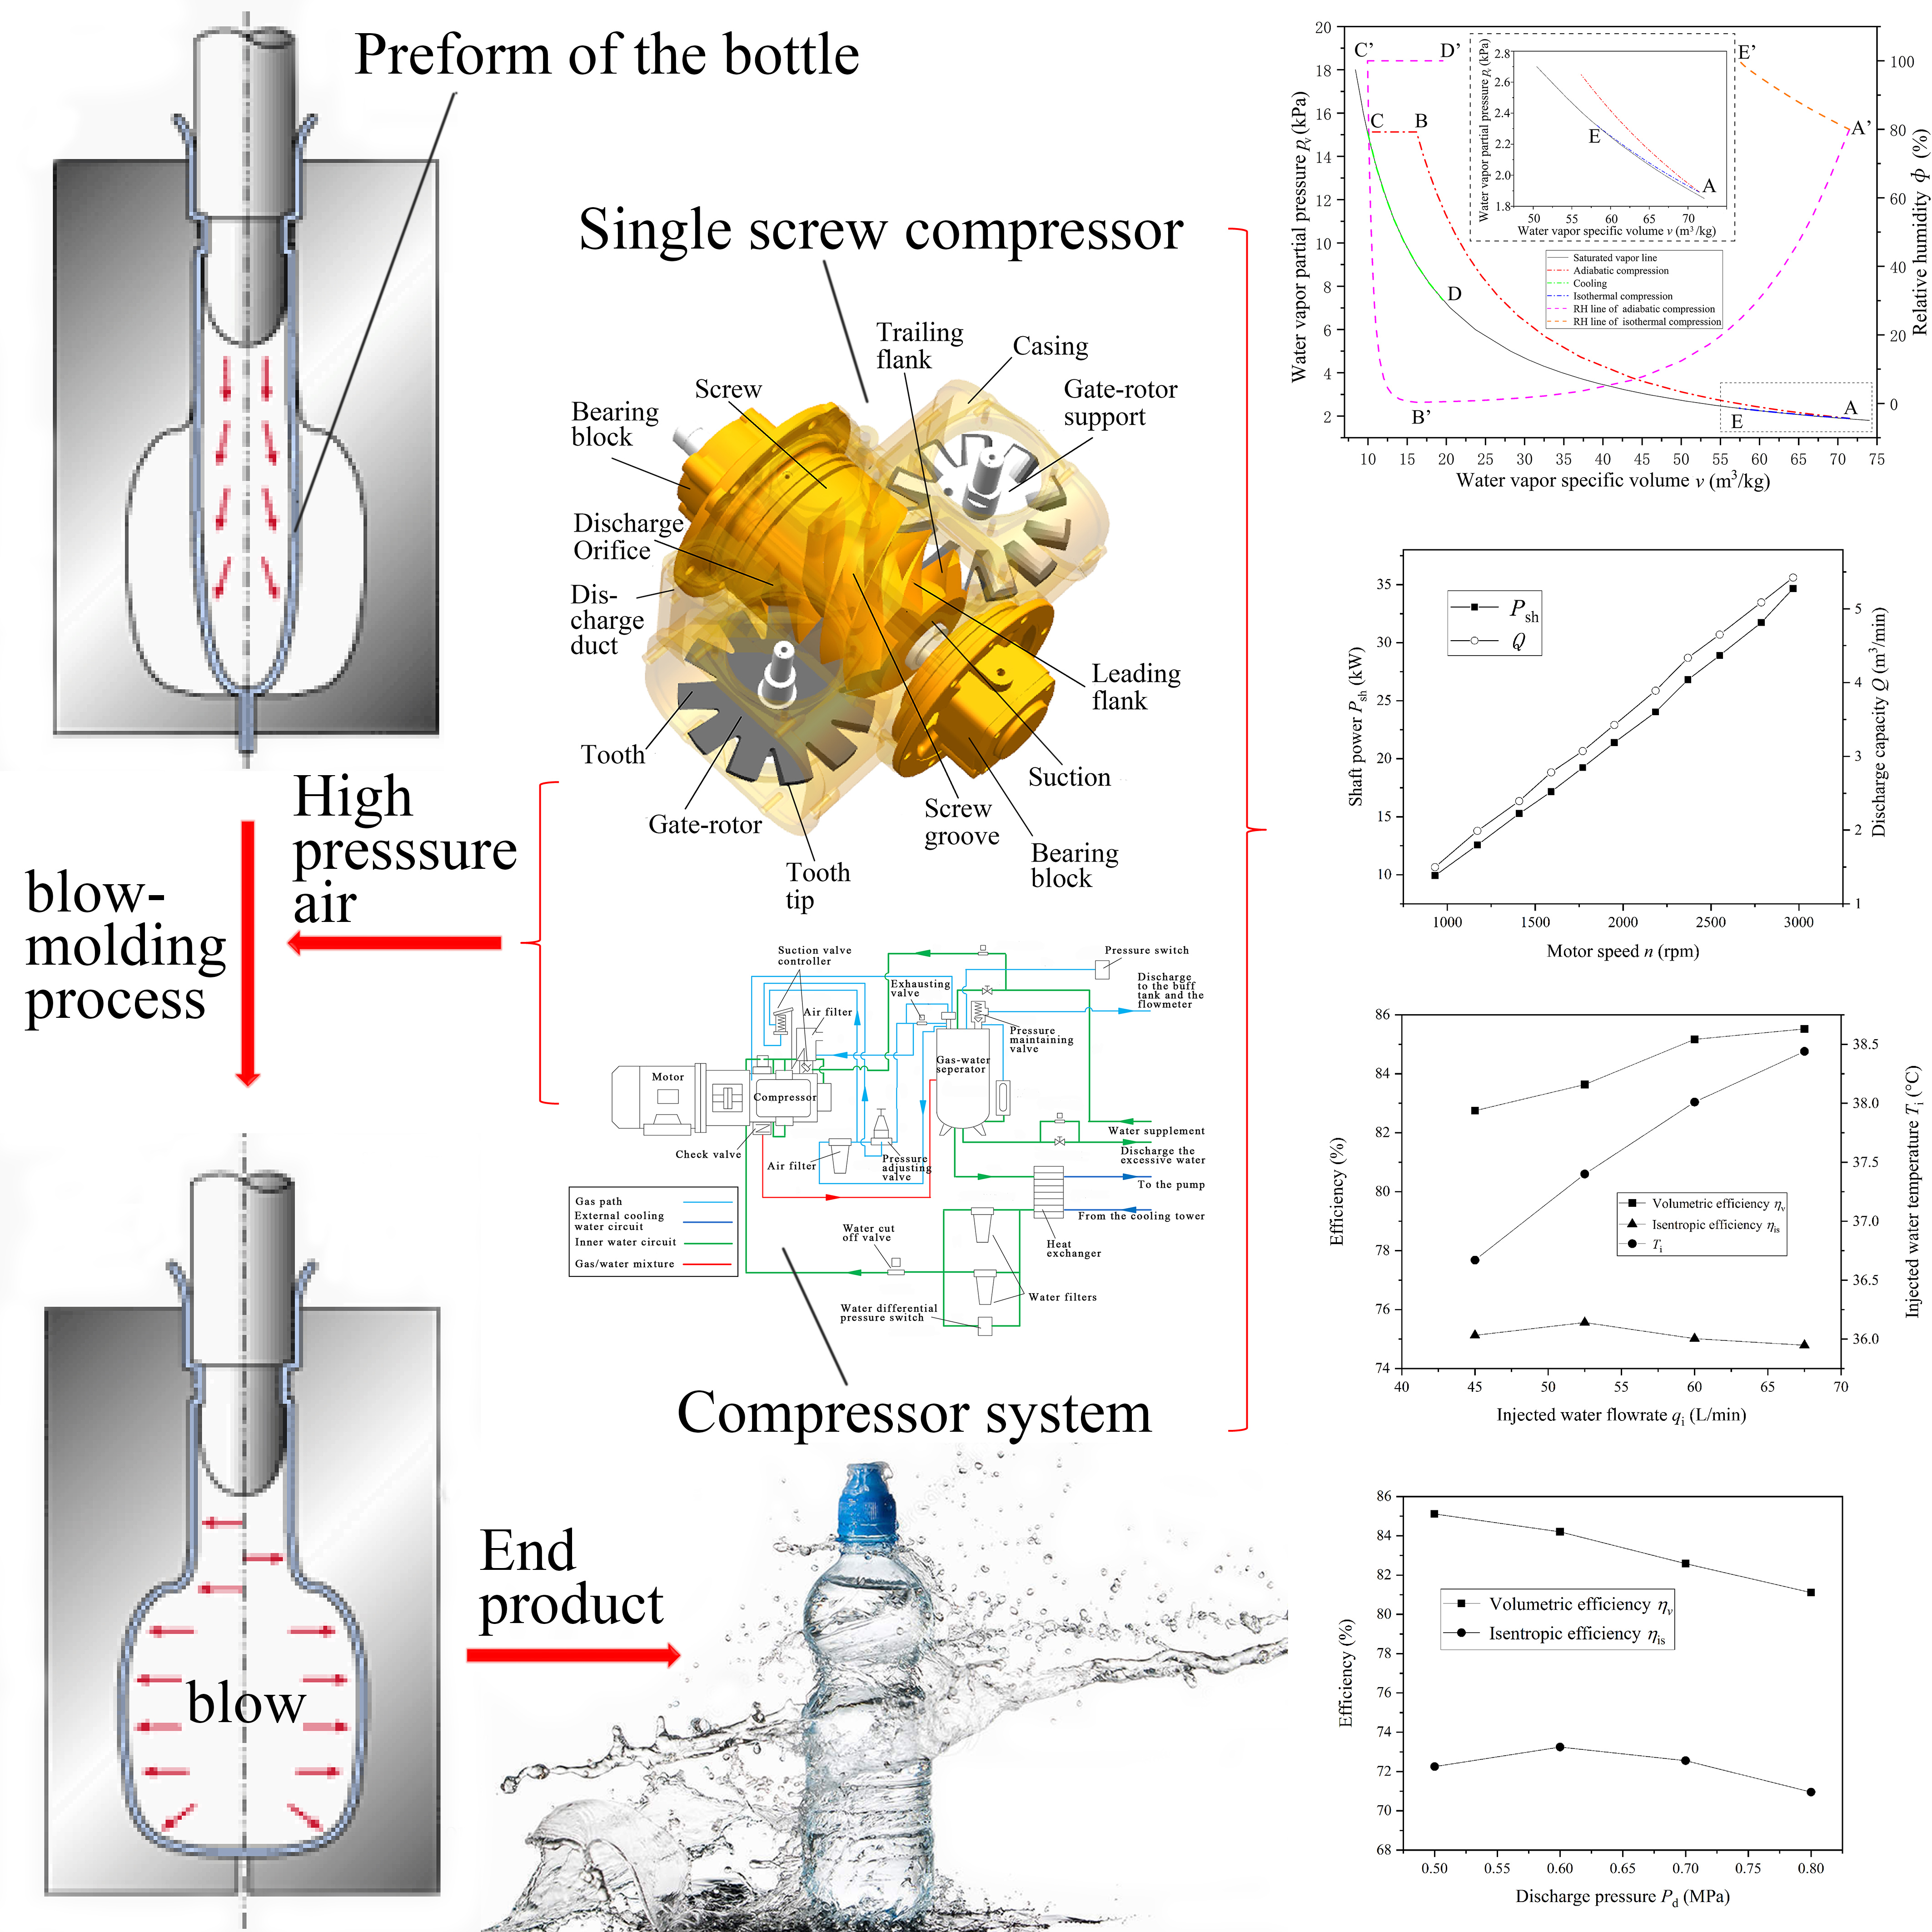
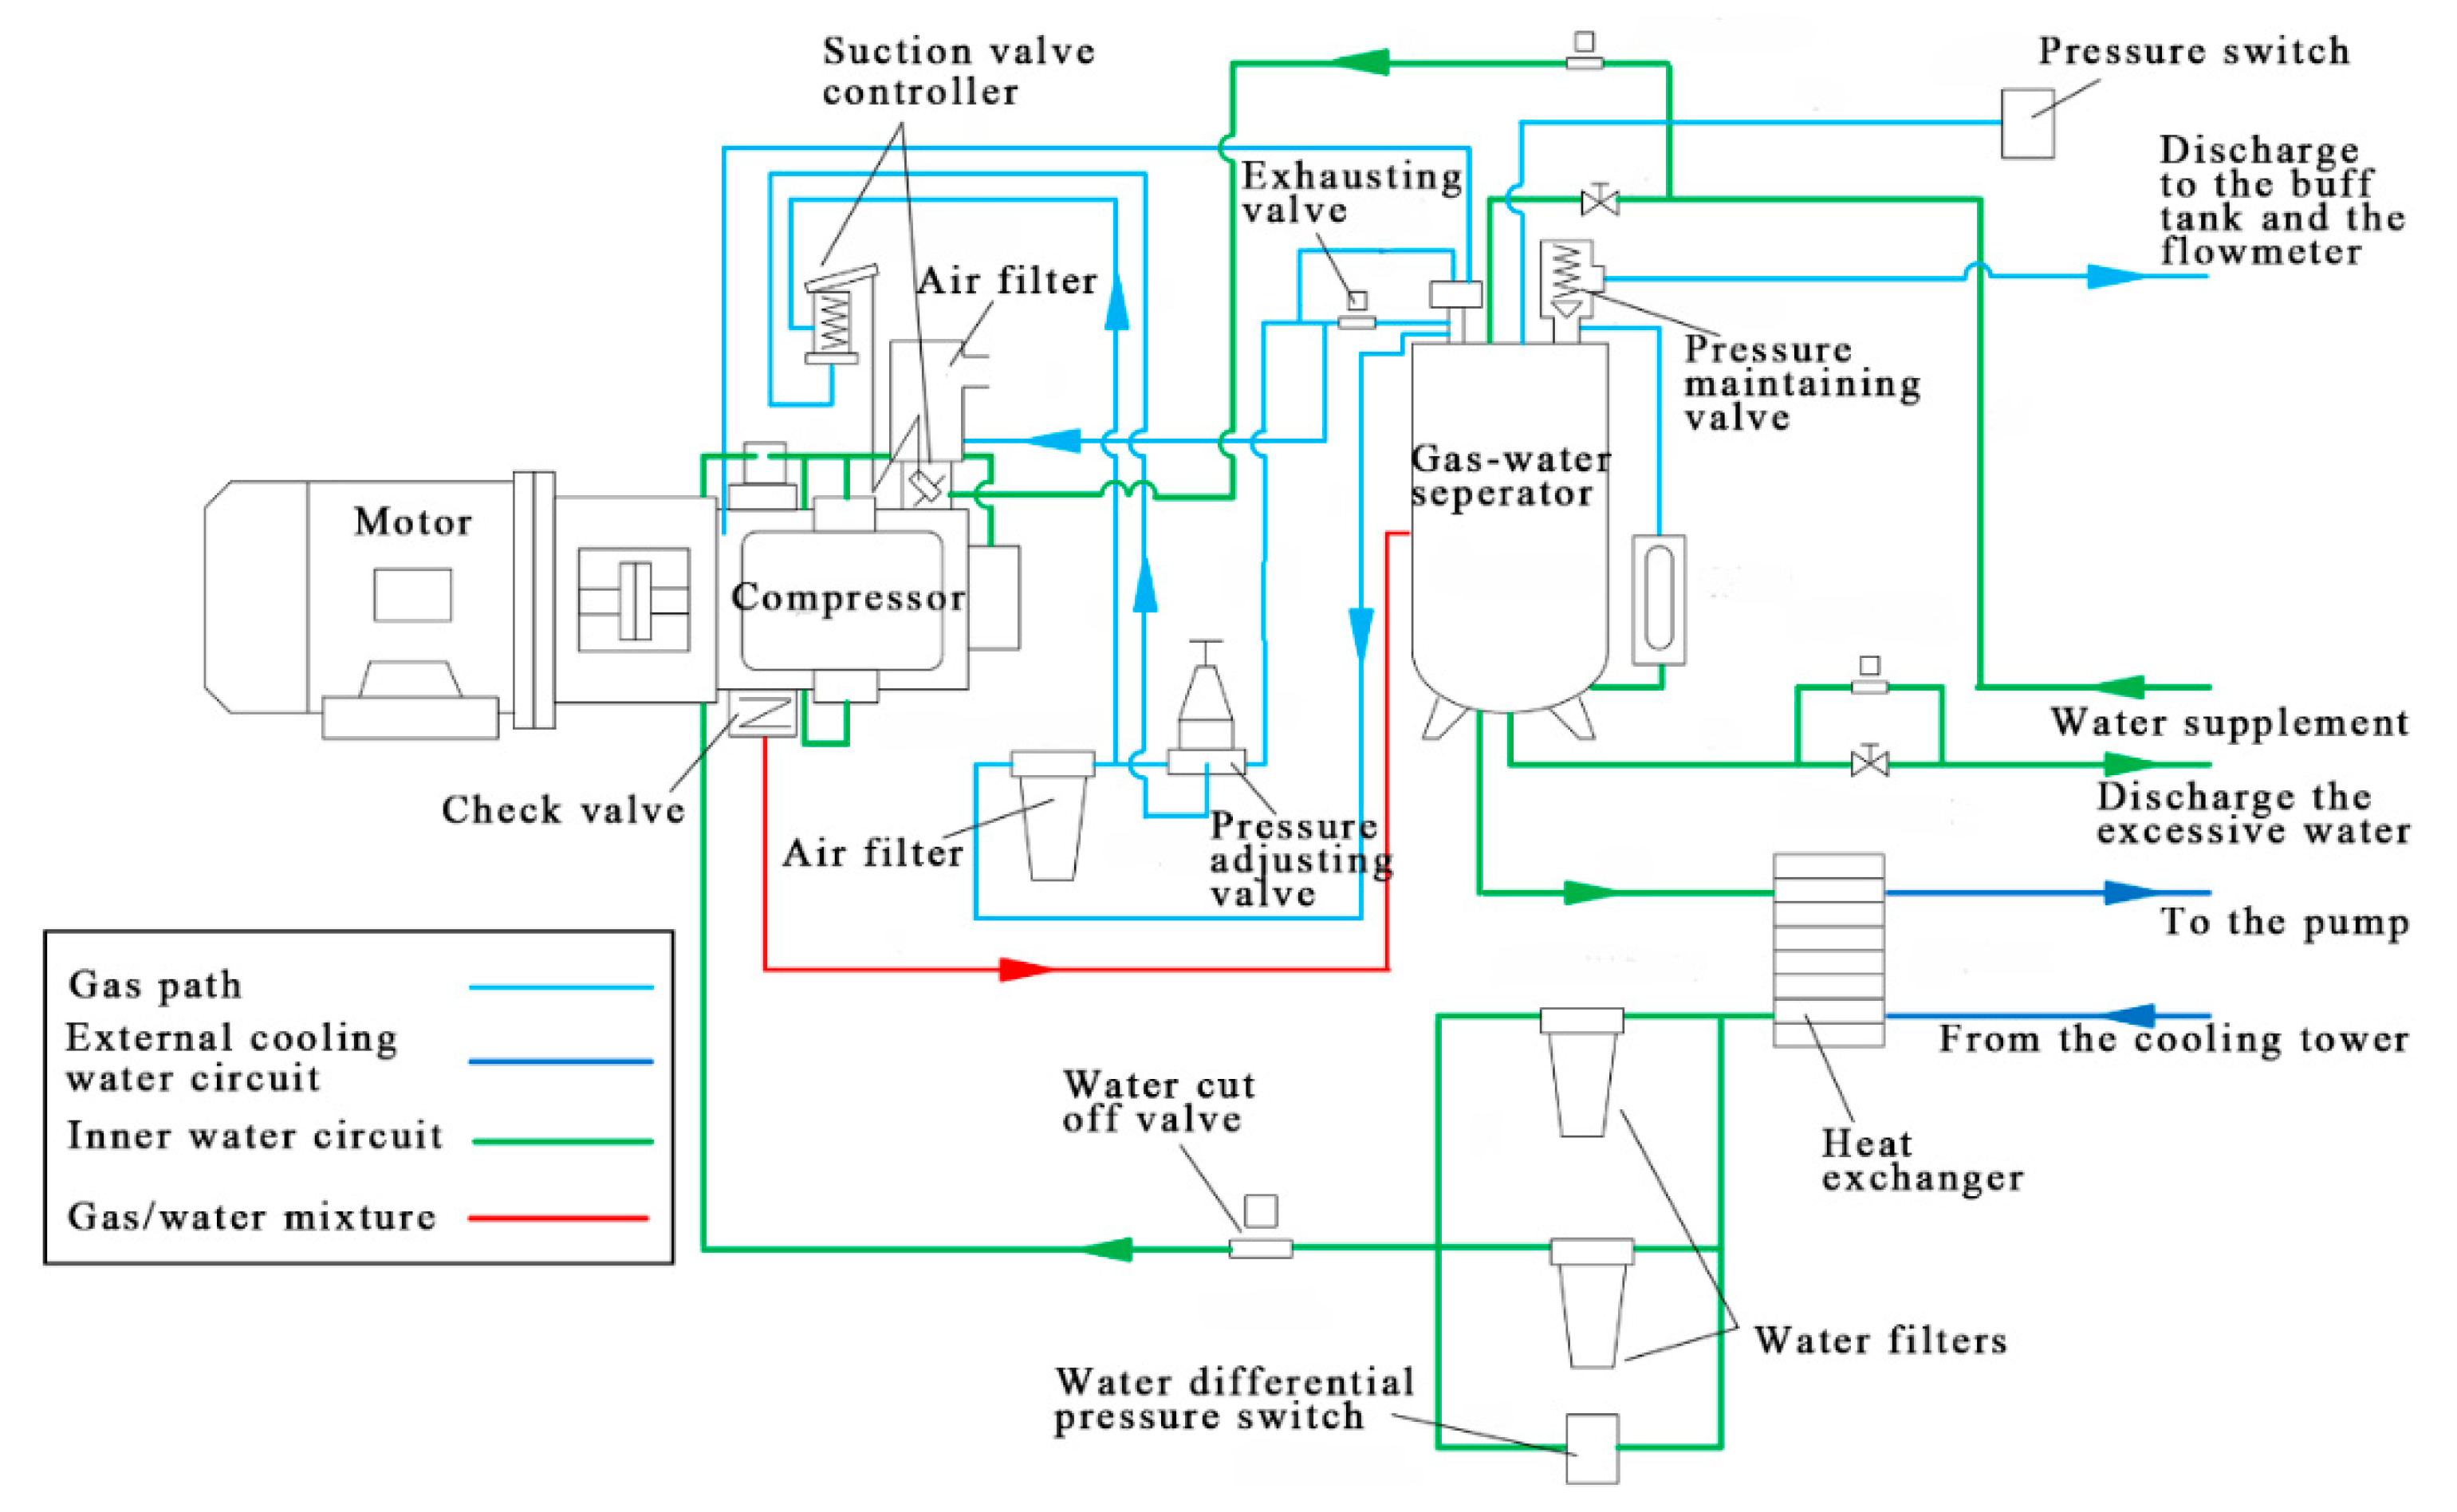
2.1. Working Principle of the SSC and Its Experimental System

The 3D structure of the SSC is shown in Figure 1. The SSC is mainly composed of a cylindrical screw rotor, a pair of planar gate-rotors, a casing, and two bearing blockings at both ends of the casing. The two gate-rotors are central symmetric about the screw axis. The screw and a gate-rotor on either side constitute a meshing pair. When the SSC operates, the screw is driven by the motor and rotates the two gate-rotors at opposite directions. Air is suctioned into the casing through the filter and unloading valve. As the gate-rotor tooth meshes into the screw groove, the screw groove, the tooth and the inner surface of the casing enclose a working chamber which is filled with air from the suction chamber of the casing. Water is injected into the chamber from the water injection hole drilled on the casing to cool the gas, seal the gaps of the chamber and lubricate the meshing pair. With further rotation, the chamber decreases and the gas trapped in it is compressed. The gas pressure rises until the chamber connects the radial exhaust orifice on the casing. The exhaust process expires as the tooth meshes out of the groove completely.
The experimental system is designed and shown in Figure 2. After flowing through the discharge ducts casted on the casing, the mixture of air and water is discharged to the separator through the discharge pipe. By centrifugal separation, the air is separated from the water. Water is stored at the bottom of the separator and pumped to the compressor by pressure difference between the separator and the suction chamber of the casing. Before being re-injected to the compressor, the water is cooled and filtered in the heat exchanger and water filters. Since the compressed air produced by the water-flooded SSC has a relative lower temperature than that delivered by the oil-flooded machines, the air separated in the separator can be discharged to the user directly without cooling.

2.2. The Thermophysical Process of Water Vapor in Moist Air and Its Effect on the Discharge Capacity

The suctioned gas is often moist air which is composed of dry air and superheat water vapor. The dehumidifying phenomenon may occur with the pressure increasement or the cooling process. A significant difference between oil-flooded machines and water-flooded machines is that the dehumidifying phenomenon is strictly prohibited in oil-flooded compressors, since the water separated from the moist air can emulsify the oil and cause serious damage. Therefore, discharge temperature Td should be higher than the saturated temperature corresponding to the partial pressure of the water vapor under discharge condition.
For the water-flooded SSC, the lower limitation of Td does not make any sense, because the water separated from moist air joins the injected water and becomes part of it. Although cooling water is injected into the working chamber, the compression process of the air in the working chamber can still be viewed as an adiabatic process, since the high speed of the screw compressors and air is cooled by the injected water after the adiabatic process in the following exhaust passage of the compressor [39]. Therefore, the thermophysical process of the water vapor can be divided into two parts. The first process is the compression of the water vapor and the second one is the cooling process of the water vapor by the injected water. Since the mass fraction of the water vapor in the moist air is very small (about 1% under 70% relative humidity and 20 °C), it is assumed that the water vapor can achieve thermal equilibrium with dry air at any time in the compressor. Therefore, it has the same temperature rise process as dry air and can be given by:
T ( θ gr ) = T 0 ( p ( θ gr ) p 0 ) k k 1
where T is the temperature of the air; θgr is the gate-rotor rotating angle; T0 is the suction temperature; p is the air pressure; p0 is the suction pressure; and k is the adiabatic index. The relative humidity φ of the compressing moist air can be given by:
ϕ = d p ( 0.622 + d ) p sa ( T )
where d is the humidity content; and psa is the saturated pressure of the water vapor and is only decided by the vapor temperature. Whether the dehumidifying phenomenon occurs in the compression process can be judged by Equation (2). The partial pressure of vapor pv in the compression process can be calculated by:
p v = ϕ p sa
In the cooling process, the vapor is cooled under a constant pressure. Whether the dehumidifying phenomenon occurs in the cooling process can be judged by:
T d < T dew
where Td is the discharge temperature; and Tdew is the dew point temperature under the discharge pressure.
In general, whether the dehumidifying phenomenon occurs in the compressor can be judged by the equations given in Appendix A. The equations for calculating the dehumidifying quantity can also be found in Appendix A.

2.3. The Pressure Loss in the Flow Path

As the fluid flows from the suction end to the discharge end of the system, the pressure loss emerges everywhere in the flow path. Pressure loss leads to additional energy consumption and reduce the efficiency. However, pressure loss is inevitable and can only be reduced. The study on pressure loss helps to optimize the flow path and raise the efficiency. Two types of pressure loss are included in the total pressure loss δp:
δ p = δ p r + δ p l
where the δpr is the route pressure loss; the δpl is the local pressure loss. δpr and δpl are expressed in Appendix A.
However, the pressure loss in the compressor system is difficult to calculate since the complicated flow path and the route resistance coefficient λ and the local resistance coefficient ζ cannot be given precisely. Therefore, in this paper, the main pressure losses are obtained by experiment. It is worth mentioning that the discharge capacity Qt is influenced by the suction pressure loss δps. If there is no δps, Qt rises to Qi:
Q i = Q t λ p = Q t ( 1 δ p s p 0 )
where λp is the pressure coefficient.

2.4. The Main Performance Indices

The main performance parameters include discharge capacity Q, volumetric efficiency ηv and isentropic efficiency ηis. These indices are all expressed in the Appendix A.

3. Prototype Development and Data Measurement

The main geometric parameters of the prototype are shown in Figure 3 and listed in Table 1.
The casing is mainly composed of cylinder, gate-rotor chamber, suction chamber, and exhaust passage. It was whole casted in brass and further processed at a machining center. The screw was casted in tin bronze using a novel method and further milling cut by a 6-axis special milling machine. The screw and its shaft are supported by a double row angular contact ball bearing and a cylindrical roller bearing. The bearings are well sealed by mechanical sealings to mutually isolate the bearing grease and the water in the casing cavity. This ensures that the produced air is oil free and the bearings have a long service life. The PEEK gate-rotor blanks were ground by a 6-axis special grinding machine. The gate-rotor and its shaft are supported by water-lubricated sliding bearings. The milling machine and the grinding machine are shown in Reference [9]. The MCT MPP is adopted to achieve a high thermodynamic and hydrodynamic performance. The fabricated casing, gate-rotor and screw rotor are shown in Figure 4. After assembly, the compressor was installed in the system as shown in Figure 2.
The whole system is well instrumented to investigate the performance of the water-flooded SSC. The directly measured parameters mainly include air temperatures and pressures at key points along the flow path, such as suction, discharge, inner pressure of the pressure vessels, quantity of water injected, and torque. The function and accuracy of the measurement instruments used for the parameters above are listed in Table 2.
The tested discharge capacity Qt and the shaft power Psh are expressed in Appendix A.
Since Qt and Psh are measured indirectly, errors in directly measured parameters will be transmitted to the measurement result. This leads to uncertainty of the Qt and Psh values. The error transfer relationship is given by [40]:
Δ r = [ i = 1 n ( r j i Δ j i ) 2 ] 0.5
where Δr is the absolute accuracy of the indirectly measured parameter r, ji is the directly measured parameter for calculating r, and Δji is the uncertainty of ji. The total relative accuracy of the test result is calculated by:
δ r = Δ r r × 100 %
According to Equations (7), (8), (A14) and (A15), and the data listed in Table 2, the total relative accuracies of Qt and Psh were calculated and were equal to 1.87% and 0.22%, respectively.

4. Results and Discussion

All the calculated and tested results are based on the prototype.

4.1. The Thermophysical Process of Water Vapor in Moist Air

The thermophysical process of water vapor in moist air during compression is calculated and shown in Figure 5. The black solid line is the saturated water vapor line. The suction state (Point A) is set to 1 atm, 20 °C and 80% RH. As the compression process is adiabatic, the pressure increasing process of the water vapor is calculated and shown as the curve AB in the red line. When the total pressure of the moist air increases from 1 atm to 8 atm, it can be observed that the partial pressure of water vapor raises from 1.89 kPa to15.13 kPa, and the water vapor specific volume v decreases from 71.48 m3·kg−1 to 16.19 m3·kg−1. Although the vapor pressure increases, RH φ drops from 80% to 0.33% (Curve A’B’) instead of increasing. This is because the psa(T) increases faster than the total pressure p in Equation (2). Therefore, in an adiabatic compression, no dehumidifying process will occur. In the following exhaust passage, moist air is cooled, and the water vapor is first cooled to the dew point C of 170 °C at 0.8 MPa along the straight line of BC, while the RH φ increases rapidly to 100% (Curve B’C’). Water vapor is further cooled to point D along the saturated water vapor line. The dehumidifying process takes place on the CD curve, and the RH remains constant at 100% during this process (Curve C’D’). Point D is the discharge state of the compressor system. The temperature of Point D is often limited to less than 60 °C. Here the discharge temperature is set to 40 °C.
The isothermal compression process is also calculated for comparison. It can be observed that this compression process (Curve AE) is too close to the saturated water vapor line. Therefore, a local enlarged view (inside the broken line) of the area around Curve AE is also shown in Figure 5, the blue line AE represents the pressure increasing process of the water vapor in an isothermal compression. As the suctioned air is compressed to 8 atm, the partial pressure of water vapor increases from 1.89 kPa to 2.36 kPa, and φ goes up to 100% from 80% (Curve A’E’). This process is very different from that of the adiabatic process. The main reason for this difference is that the psa(T) does not increase in an isothermal process while the total pressure p increases throughout the compression process in Equation (2). Actually, as the total pressure p increases to 1.25 atm, the water vapor pressure reaches the saturated state of 2.36 kPa. In the process from 1.25 atm to 8 atm, the water vapor pressure does not increase any more since the temperature is constant and the RH φ can only stay at 100% at Point E. From 1.25 atm to 8 atm, the dehumidifying process is ongoing at point E in order to maintain constant water pressure.
The influence of suction state (φ0 and T0) on the dehumidifying process is investigated and shown in Figure 6 and Figure 7. In Figure 6, suction temperature is fixed at 20 °C. The effects of suction RH φ0 on dehumidifying mass flowrate Qm,w and discharge capacity loss Qv,l are shown in Figure 6a,b, respectively. It can be observed that if φ0 is lower than a certain value, there is no dehumidifying water. This certain value is defined as critical suction RH φcr. The φcr are 53.3%, 45.7%, 39.9% and 35.5% under discharge pressures of 0.6 MPa, 0.7 MPa, 0.8 MPa and 0.9 MPa, respectively. It can be deduced that φcr decreases with the increasement of discharge pressure. As φ0 > φcr, Qm,w and Qv,l increase linearly with suction RH φ0 and also increase with discharge pressure pd. As φ0 = 90%, Qm,w is 0.035 kg·min−1, 0.042 kg·min−1, 0.047 kg·min−1 and 0.051 kg·min−1 under pd of 0.6 MPa, 0.7 MPa, 0.8 MPa and 0.9 MPa, respectively, while Qv,l is 0.046 m3·min−1, 0.056 m3·min−1, 0.063 m3·min−1 and 0.068 m3·min−1.
In Figure 7, φ0 is fixed at 80%. The effects of suction temperature T0 on Qm,w and Qv,l are shown in Figure 7a,b, respectively. It can be observed that Qm,w and Qv,l increase rapidly with T0. Under a pd of 0.8 MPa, the total increment of Qv,l from 5 °C to 45 °C is 0.22 m3·min−1. However, the increment of Qv,l from 40 °C to 45 °C is 0.06 m3·min−1, which is 27.2% of the total increment. This is mainly because the saturated water vapor pressure increases rapidly with the temperature. At a certain suction temperature, Qm,w and Qv,l also increase with pd. Under the condition that T0 = 35 °C and pd = 0.8 MPa, Qm,w is equal to 0.089 kg·min−1, which means that 128 kg of water is separated from the wet air in the compressor system per day. This is a far greater amount than the water taken by the discharged air for a 5.4 m3·min−1 machine. Therefore, in the hot and moist days, the SSC has no need for replenishing water as usual. On the contrary, the extra water should be drained in a timely fashion to maintain a reasonable water level in the compressor system.

4.2. The Pressure Loss

The suction pressure loss is tested by a U-tube pressure gauge filled with water. A hole is drilled on the side cover of the SSC. The suction chamber of the SSC is inside of the side cover. The U-tube is installed between the atmosphere and the hole. The pressure loss data is recorded every day and is shown in Figure 8. It can be observed that the suction pressure loss δps of a newly installed air filter is 172 mmH2O. δps increases along with the running time since dust were accumulated on the filter. At a running time of 2018 h, δps reaches 256 mmH2O. The pressure coefficient λp is also calculated and is shown in Figure 8. It can be seen that along with the increase of λp, λp decreased from 0.983 to 0.974 until 2018 h.
To obtain the pressure loss information on the flow path of the SSC system, pressure transducers and gauges were placed at some key points of the SSC system. Point 1 is the discharging duct casted on the casing; point 2 is the position after the discharge check valve; point 3 is the position just before the separator; point 4 is at the outlet of the SSC system. The pressure at point 4 is the back pressure of the SSC system. The points’ positions are shown in Figure 2. The pressure loss information is tested under back pressure of 0.7 MPa and 0.8 MPa, respectively, and the tested results can be seen in Figure 9. Under 0.7 MPa, pressure at points 1, 2, 3, and 4 are 0.76 MPa, 0.716 MPa, 0.71 MPa and 0.7 MPa. Therefore, the total pressure loss δp1–4 is 0.06 MPa. δp1–4 is composed of δp1–2, δp2–3, δp3–4, which are 0.044 MPa, 0.006 MPa, 0.01 MPa respectively. Under 0.8 MPa, pressure at points 1, 2, 3, and 4 are 0.855 MPa, 0.819 MPa, 0.815 MPa and 0.8 MPa. δp1–4, δp1–2, δp2–3, δp3–4 are 0.055 MPa, 0.036 MPa, 0.004 MPa and 0.015 MPa, respectively. It can be observed that δp1–2 has the largest proportion in δp1-4. This is mainly caused by the narrow, twisty discharging duct and check valve. On the other hand, the inner surface of the discharging duct is casted and relatively rough. Pressure loss causes extra power consumption and low efficiency. Therefore, optimizing the duct could be very significant for enhancing the efficiency of the SSC.

4.3. Effect of Rotation Speed on the Compressor Performance

Speed regulation is the main regulating method for discharge capacity. The motor speed is regulated by a frequency converter. Figure 10 shows the variations of the discharge capacity Q and shaft power Psh at different rotating speed. It can be found that the discharge capacity Q almost increases linearly with the motor speed, since the gas discharged in each screw rotation is nearly constant. Under a higher relative speed, less water is injected into the working chamber because of the shorter injection time for each chamber. This will lead to more leakage. However, meanwhile, the gas leaking time decreases. Thus, the discharge capacity Q can basically maintain a linear relation with the motor speed. It can be observed that the shaft power Psh also has a roughly linear relation with the motor speed. It can be inferred from this linear increase that the cooling effect is not significant during the compression process as mentioned before. Under a lower relative speed, more water is injected into the working chamber. This enables a longer heat transfer time between gas and water, which should make the compression process to get closer to the isothermal process. As the motor speed increases, the compression process should approach the adiabatic process and consume more power. Furthermore, the shaft power ought to be increased linearly with the discharge capacity and hence the motor speed. Therefore, it is expected that the shaft power will increase nonlinearly with the motor speed. However, the experiment does not show the nonlinear increase and indicated that the injected water has little cooling impact on the gas during the compression process across the studied motor speed range. At the full speed of the motor, Q and Psh reach 5.424 m3·min−1 and 34.66 kW, respectively.

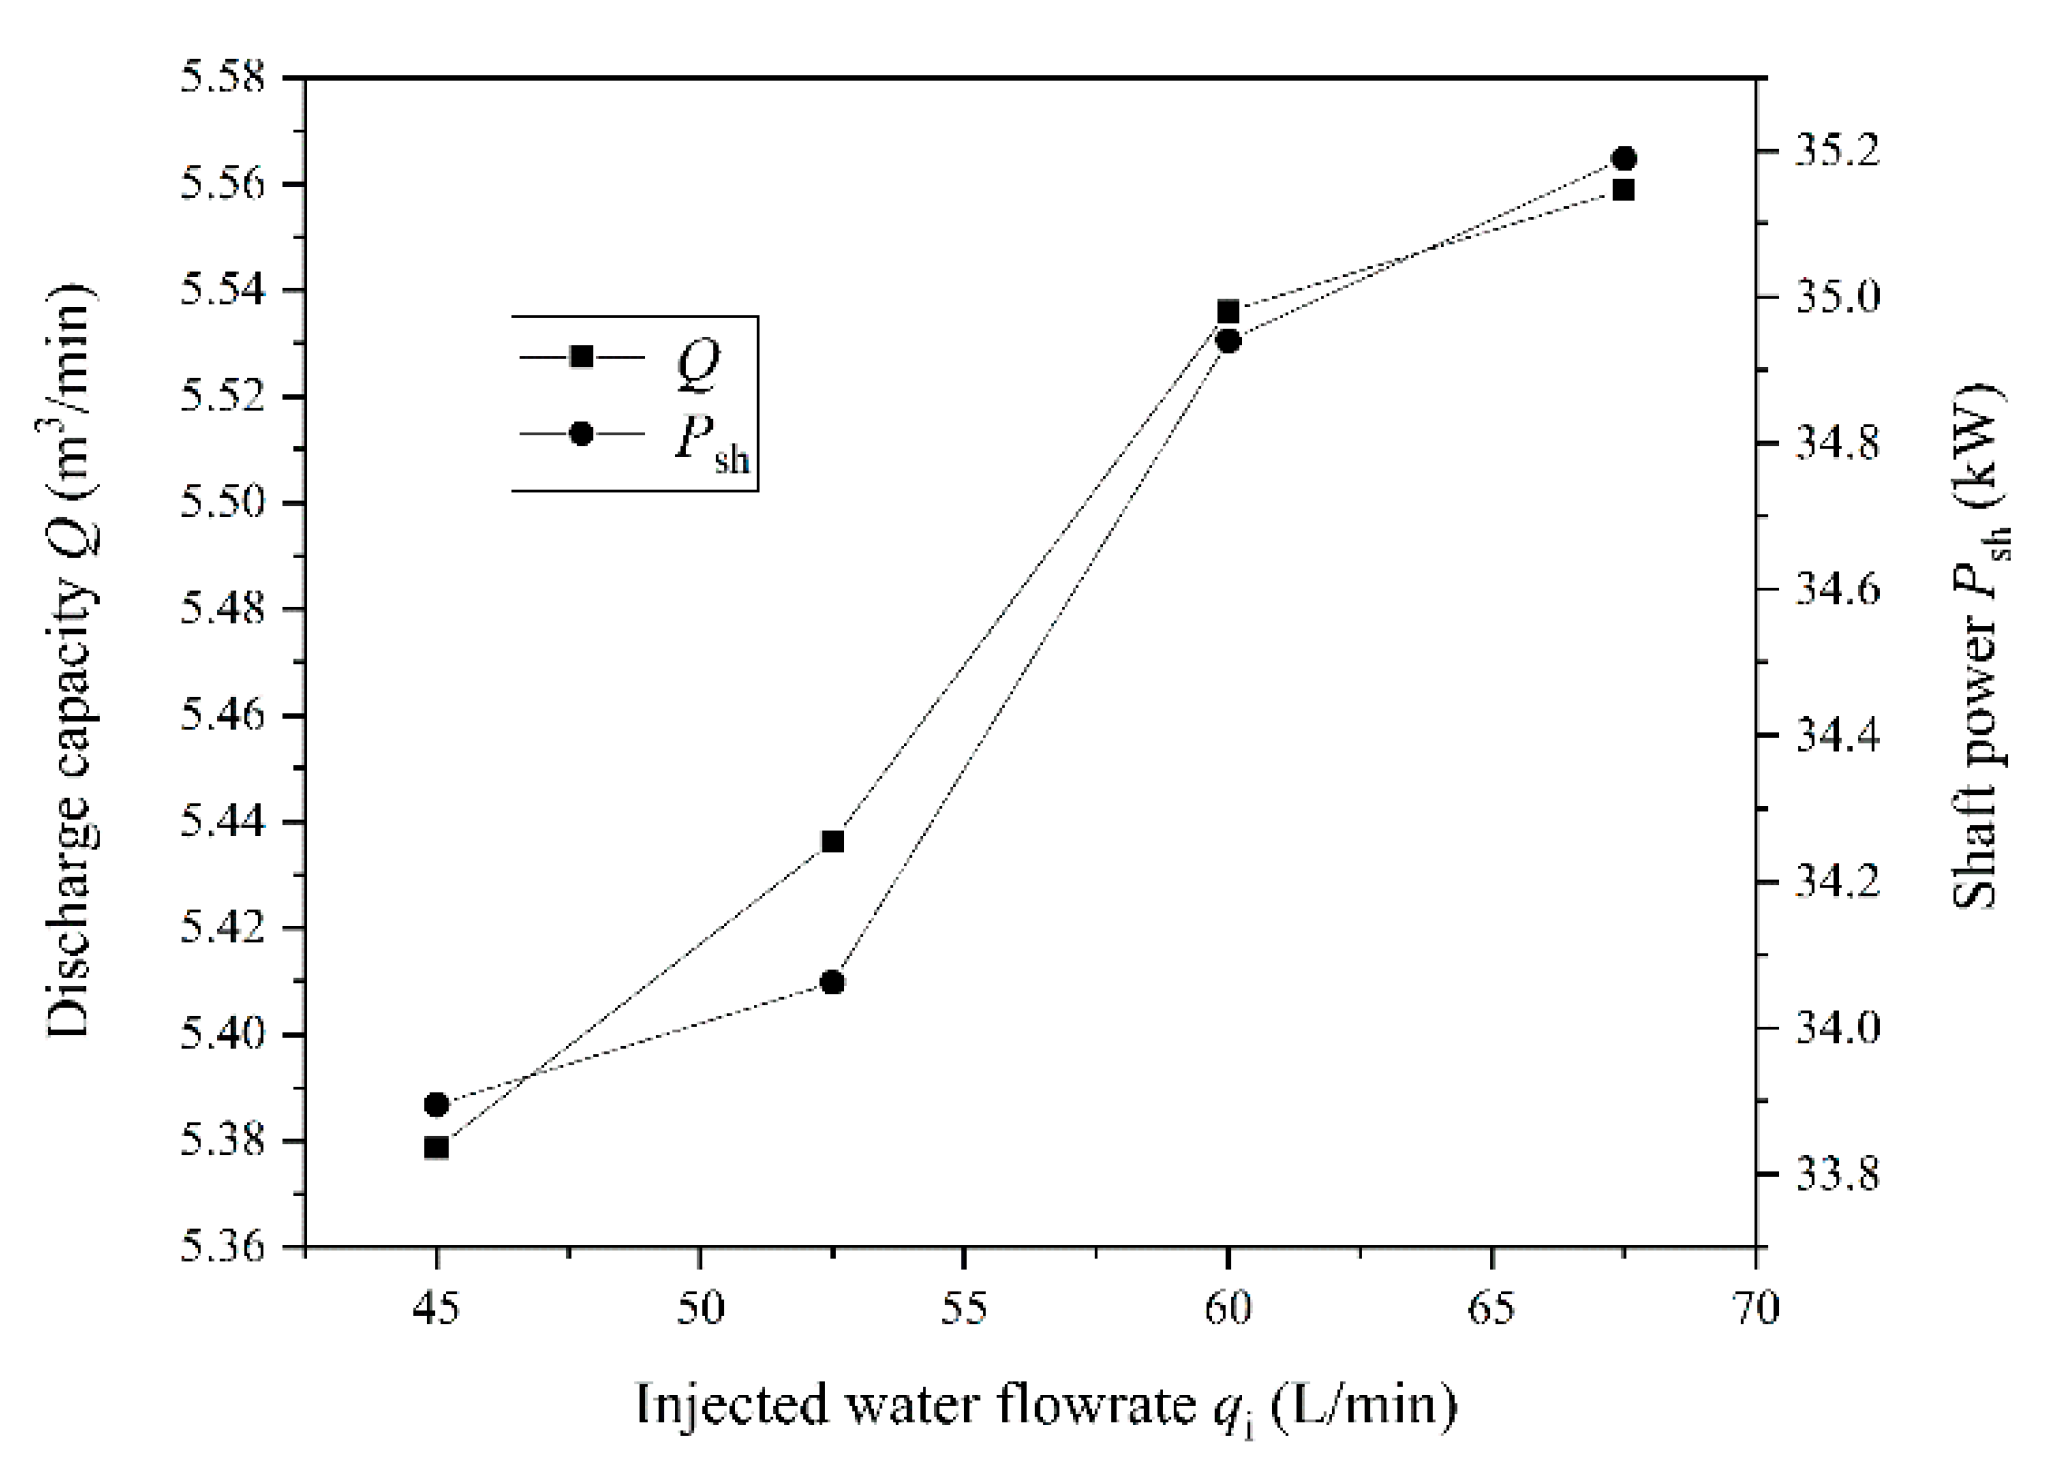
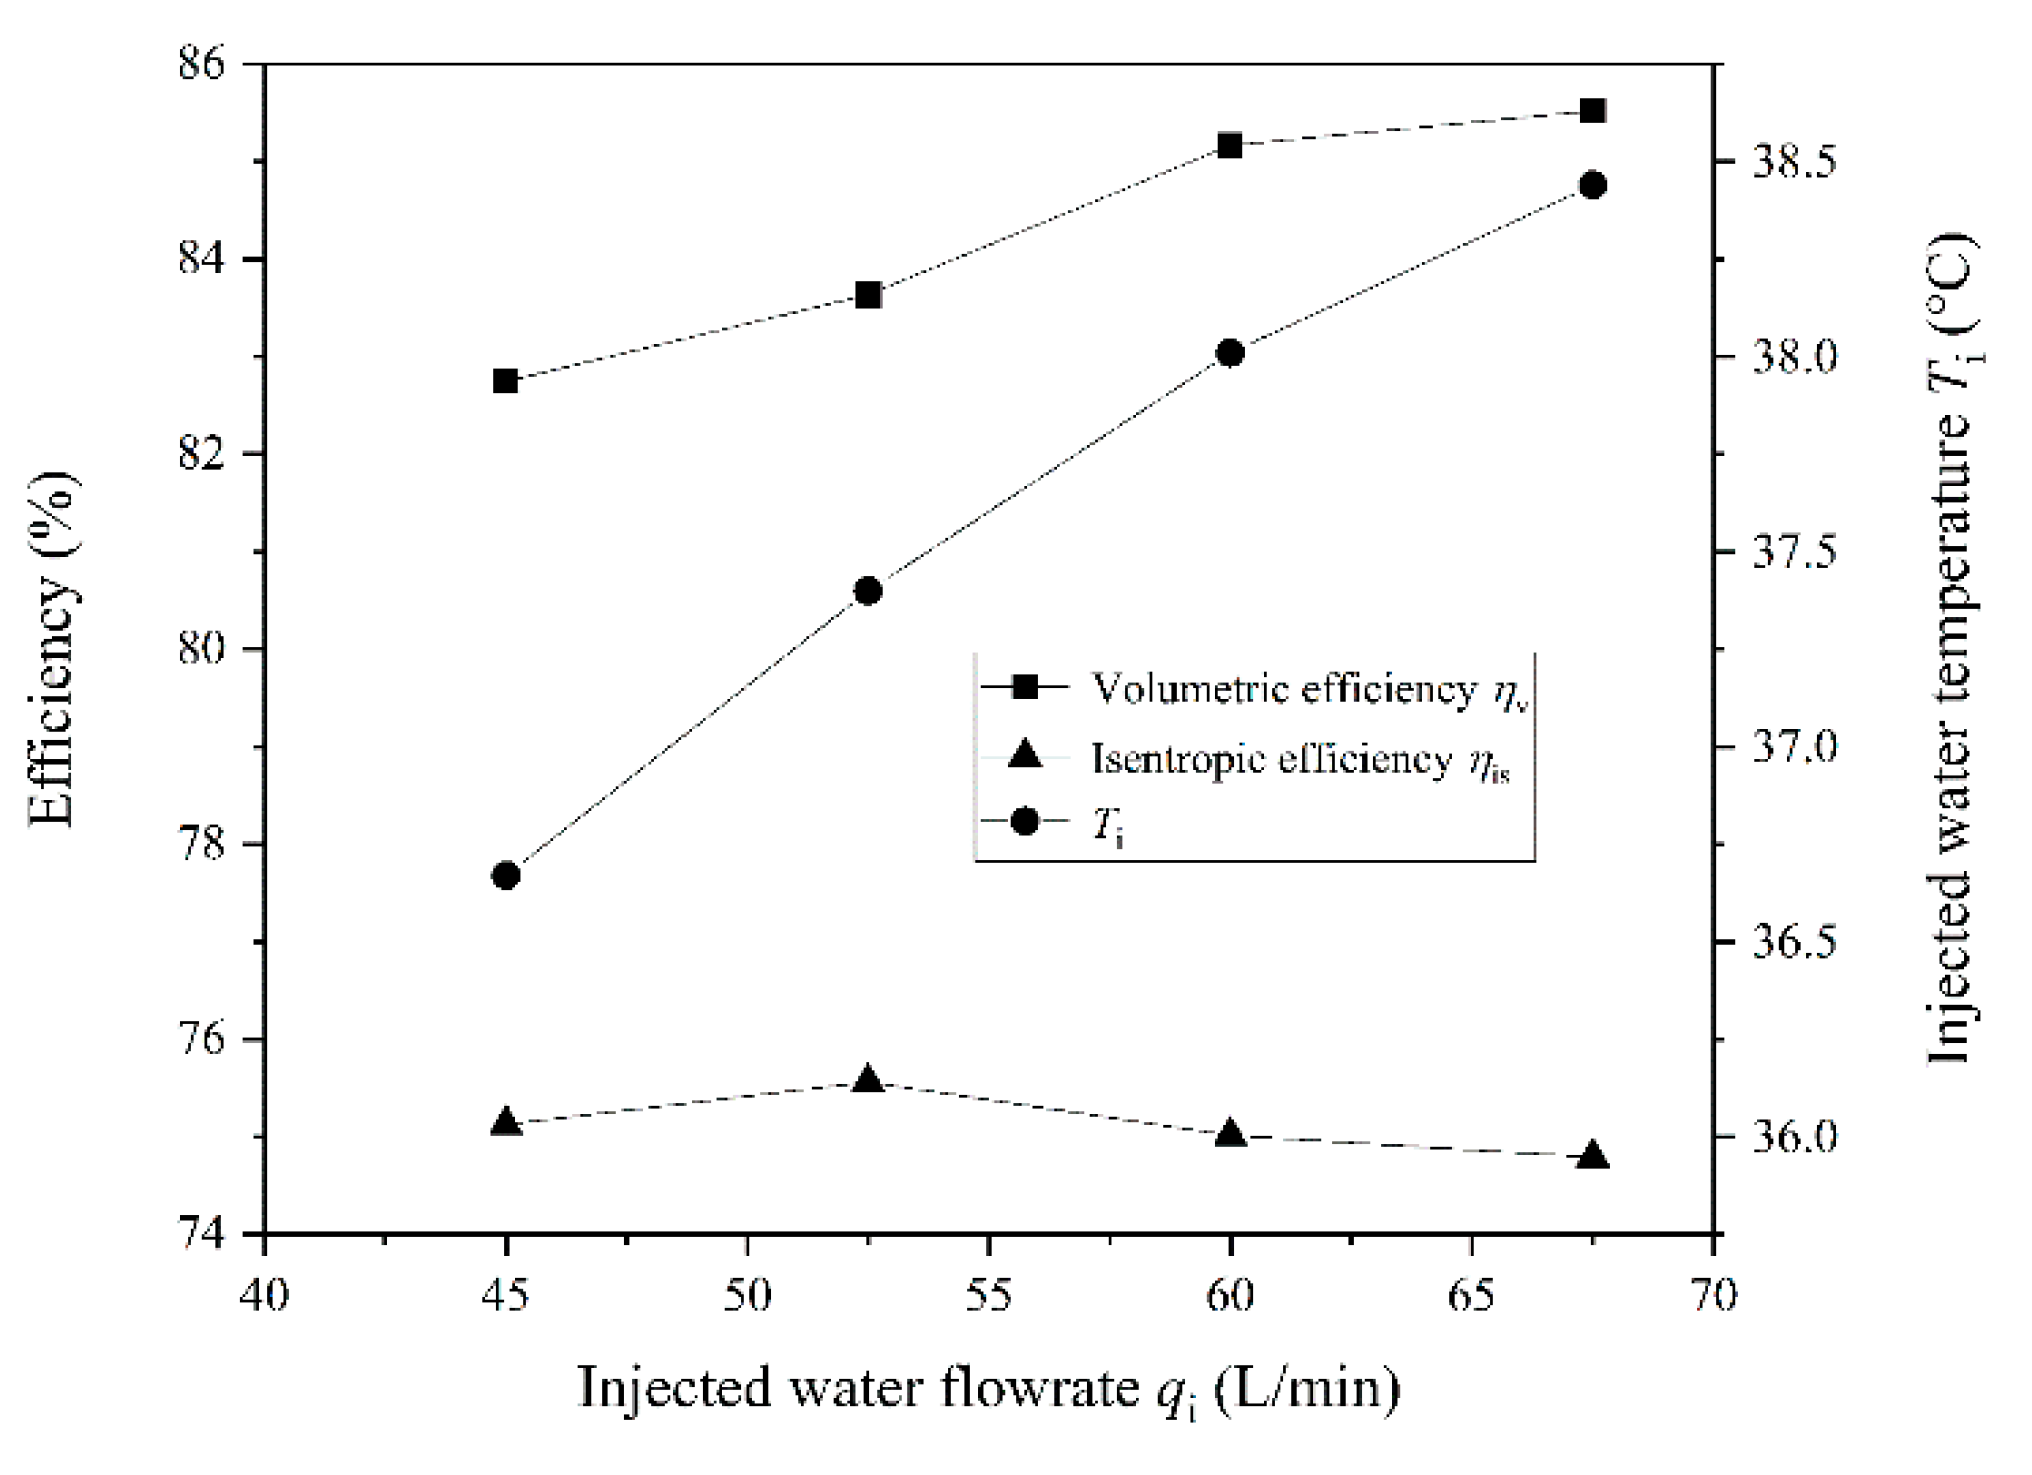
4.4. Effect of Injected Water Parameters on the Compressor Performance

The effect of the injected water temperature Ti on the compressor performance is investigated. After absorbing the compression heat in the compressor and being separated in the separator, the injected water is cooled in the heat exchanger by the water circulated in the pump, cooling tower and heat exchanger outside the compressor system. Therefore, by regulating the flowrate of the pump, the heat transfer between the internal water cycle and the external water cycle is changed and the injected water temperature Ti can be adjusted. The motor rotation speed is 2950 rpm, the injected water flowrate is 55 L·min−1 and the back pressure is 0.7 MPa, the test results are presented in Figure 11.
As the pump flowrate was regulated from its maximum to its minimum, Ti varies from 37.6 °C to 45.4 °C. With the increase of the injected water temperature Ti, the volumetric efficiency ηv decreases from 85.17% to 81.97%, a drop of 3.76%. This is mainly because the gaps of the working chamber increase in pace with Ti growth. In addition, the water viscosity reduces as Ti increases. These two combined effects increase the gas leakage from working chamber to outside and further lead to the decline of the volumetric efficiency ηv. Meanwhile, the isentropic efficiency ηis decreases from 75.01% to 72.49% and the drop reaches 3.36%, It can be observed that reducing the injected water temperature Ti can improve the efficiencies effectively. Therefore, sufficient cooling capacity of external water cycle and heat transfer capacity in the heat exchanger are both very important for the improvement of efficiency.
The impact of the injected water flowrate qi on the compressor performance is also investigated. By adjusting the valve installed on the pipe connecting the separator and the SSC, the flowrate of the injected water can be regulated. The motor rotation speed is 2950 rpm and the back pressure is 0.7 MPa; the test results are presented in Figure 12 and Figure 13.
As can be seen from Figure 12, the discharge capacity Q increases with the increase of injected water flowrate qi. Since water is injected after the working chamber is closed, the amount of suctioned gas is not influenced by qi. The increase of qi reduces the gas leakage from the gaps. However, it can be seen from Figure 13, the injected water temperature Ti increases with the increase of qi, which will lead to enlargement of the gaps. The effects of increased water and enlarged gaps on Q are contrary. It can be deduced that in the studied range, the increased water amount has more significant impact than the enlarged gaps since Q increases continuously from 5.378 m3·min−1 to 5.559 m3·min−1 as qi increases from 45 L·min−1 to 67.5 L·min−1. The shaft power Psh also increases with the increase of qi (see Figure 12). This can be explained by a combination of two reasons. One is that the indicated power Pin is proportional to discharge capacity Q, and Q is in direct ratio with qi. The other is that more injected water leads to more shear loss and more ‘pump power’ which raise the injected water pressure from the suction pressure to the discharge pressure. Therefore, the shaft power increases from 33.89 kW to 35.18 kW as qi increases from 45 L·min−1 to 67.5 L·min−1. The shaft power consumption increment is 1.29 kW. The ‘pump power’ increment can be easily calculated by (pd-pi) δqi and is equal to 0.26 kW.
As shown in Figure 13, the volumetric efficiency ηv increases from 82.7% to 85.5% as qi increases from 45 L·min−1 to 67.5 L·min−1. ηv has the same growth trend and reason as Q. The isentropic efficiency ηis firstly increases from 75.1% to 75.6% and then decreases to 74.8%. According to Equation (A12), the isentropic power Pis increases when Q increases. Q increases with the increase of injected water flowrate qi, as analyzed above. Hence, Pis increases as qi rises. However, the shaft power also increases when qi rises, as mentioned above. According to Equation (A13), the numerator and the denominator all increase with qi. Therefore, there is an optimum value of qi to achieve the highest ηis. The test results show that 52.5 L·min−1 is the optimum value among the four injected water flowrates for the prototype, which is a little less than 1% of Q. It is noteworthy that the influence of the injected water flowrate on the compressor performance is not a single effect, because the injected water temperature cannot be kept constant. It can be observed that the injected water temperature Ti also increases as qi increases. Since the cooling capacity for the external water cycle can be viewed as constant, larger values of qi will lead to smaller differential temperatures of the internal water cycle and an increase of Ti.

4.5. Effect of Discharge Pressure on Compressor Performance

For different industrial applications, the requirements for the gas pressure will be different. Therefore, it is necessary to investigate the performance of the SSC system under different back pressures. By adjusting the valve after the air buff tank, the discharge pressure pd (back pressure) is regulated. The test results are presented in Figure 14 and Figure 15.
Compared to centrifugal compressors, screw compressors have a far smaller variation of Q when pd changes. As seen from Figure 14, it can be observed that the discharge capacity Q decreases from 5.532 m3·min−1 to 5.272 m3·min−1 as pd increases from 0.5 MPa to 0.8 MPa (gauge pressure). Two opposite factors result in a discharge capacity decline of 4.7%. As pd increases, the inner leakage is enhanced, since the differential pressure increases. This will lead to more inner cycle and less discharged gas. Furthermore, the injected water flowrate increases, since the differential pressure increases. This is expected to reduce the gas leakage. However, the increased injected water is shown to have less impact on Q than the differential pressure. The shaft power Psh increases from 30.02 kW to 37.29 kW when pd increases from 0.5 MPa to 0.8 MPa. The increment of Psh can be attributed to three factors. The first one is that the indicated power Pi increases with the pressure ratio exponentially according to Equation (A12). The second one is the increased injected water caused by the increasing pressure difference. More water consumes more shaft power for pumping and shearing. The third is the additional power loss caused by the inequality between the inner pressure ratio and the external pressure ratio. The additional power loss firstly decreases and then increases when pd increases from 0.5 MPa to 0.8 MPa. The minimum value of the additional power loss is obtained when the inner pressure ratio is equal to the external pressure ratio.
As shown in Figure 15, the volumetric efficiency ηv decreases from 85.1% to 81.1% as pd increases from 0.5 MPa to 0.8 Mpa. It has the same variation trend and variation reasons with the discharge capacity Q. It can be observed that the isentropic efficiency ηis firstly increases from 72.3% to 73.2% and then decreases to 68.6%. The shaft power increases with pd, as analyzed in Figure 14. According to Equation (A12), the isentropic power increases exponentially when pd increases. The maximum value of ηis appears under the pd of 0.6 MPa.

5. Conclusions

To study the two-stage water-flooded SSC compressor unit for PET bottle blowing, a water-flooded single-screw compressor prototype with a multi-column type meshing pair profile was developed, and the compressor system was built. The prototype was designed as the first stage of a 5.4 m3·min−1 PET compressor. The thermophysical process of water vapor in moist air was modeled and analyzed. The impact of key factors on compressor performance was experimentally studied under a wide range of working conditions. The following conclusions can be made:
(1)
In an adiabatic compression process, the RH φ drops quickly and no dehumidifying process occurs. Liquid water is separated from the moist air only during the following cooling process. Compared to the adiabatic process, φ increases continuously in an isothermal compression process, and the dehumidifying process starts when φ reaches 100%. Usually, the moist air gets saturated and dehumidifies before the isothermal compression process is finished. It is observed in an adiabatic process that a critical suction RH φcr exists, which decreases with the increase of discharge pressure. The dehumidifying water increases linearly with suction RH φ0 after φcr at a constant suction temperature T0, and also increases exponentially with T0 at a constant φ0.
(2)
For the air filter, the pressure loss increases continuously during the running time. The pressure coefficient λp decreased from 0.983 to 0.974 after an endurance test. The total pressure loss of the whole discharging path reached 8.6% of the back pressure (0.7 MPa). The maximum pressure loss took place on the path from the discharging duct to the discharge check valve. Optimizing the discharging duct on the casing could effectively improve the efficiency.
(3)
Both discharge capacity and shaft power increase almost linearly across the studied motor speed range. Although water has a large specific heat capacity, the cooling effect is not significant during the compression process, and the actual compression process approaches an adiabatic process.
(4)
As the injected temperature increases from 37.6 °C to 45.4 °C, the volumetric efficiency and the isentropic efficiency declined by 3.76% and 3.36%, respectively. Both discharge capacity and shaft power increase with injected water flowrate. However, there is an optimal injected flowrate of 52.5 L·min−1 to achieve the highest isentropic efficiency.
(5)
As the discharge pressure increased from 0.5 MPa to 0.8 MPa, the shaft power increased by 24.2% and the discharge capacity decreased by 4.7%. Under a discharge pressure of 0.6 MPa, the isentropic efficiency reaches its highest value of 73.2%.
The obtained results can lay a foundation for the development of the two-stage SSC unit for PET bottles blowing. The proposed method for calculating the thermophysical process is able to solve the dehumidifying mass flowrate for each stage or the whole unit under different weather conditions. This is significant for designing the water supply, separation and drainage systems for PET compressor units and analyzing their performance variation. The pressure loss information could contribute to optimizing the flow path of PET compressor units and setting the allowable flow velocities. The results related to motor speed are conducive to devising the logics of the converter during the air displacement adjustment for blowing bottles. The optimized injected parameters can keep the first stage of the SSC unit working in a high efficiency range. The interstage pressure between the two stages is just the back pressure of the first stage. Therefore, the results associated with the discharge pressure are helpful for analyzing the influence of the interstage pressure on the first stage.

Author Contributions

Conceptualization and Methodology, T.L.; Formal analysis, Y.W. and R.H.; Investigation, Y.W. and Q.F.; Resources: Q.F.; Project administration and Supervision, D.C.; Funding acquisition, T.L., X.M. and R.H.; Data curation, T.L. and R.H.; Software, X.M.; Validation and Writing (original draft), T.L.; Writing (review & editing), T.L. and D.C. All authors have read and agreed to the published version of the manuscript.

Funding

This research was funded by the Fundamental Research Funds for the Central Universities (Grant No. 2452017319), Science and Technology Project of Shaanxi Provincial Water Resources Department (Grant No. 2019slkj-17), the National Natural Science Foundation of China (Grant No. 51909222), the National Natural Science Foundation of China (Grant No. 51706179).

Conflicts of Interest

The authors declare no conflict of interest.

Appendix A

Appendix A.1. Judgement of the Dehumidifying Process Occurrence

ϕ 0 p s a ( T 0 ) × p d p 0 > p s a ( T d i s )
where φ0 is the RH under suction state; pd is the discharge pressure of the compressor.
If the left item of Equation (A1) is larger than the right item, the dehumidifying phenomenon occurs and the dehumidifying quality dq for 1 kg dry air can be expressed by:
d q = 0.622 ( ϕ 0 p s a ( T 0 ) p 0 ϕ 0 p s a ( T 0 ) p s a ( T d i s ) p d p s a ( T d i s ) )

Appendix A.2. Calculation of the Dehumidifying Quantity

The mass flow of the dry air Qm,da is given by:
Q m , d a = ρ 0 Q ( 1 ϕ 0 p s a ( T 0 ) p 0 )
where ρ0 is the density of the suction air; Q is the discharge capacity of the SSC. Therefore, the dehumidifying mass flowrate Qm,w is:
Q m , w = Q m , d a d q
The loss volume flowrate Qv,l converted by the dehumidifying mass flowrate can be calculated by:
Q v , l = Q ϕ 0 p s a ( T 0 ) p 0 d q d 0
where d0 is the humidity ratio of suction air and is given by:
d 0 = 0.622 ϕ 0 p s a ( T 0 ) p 0 ϕ 0 p s a ( T 0 )

Appendix A.3. Route Pressure Loss δpr and Local Pressure Loss δpl

The route pressure loss δpr is given by:
δ p r = ρ λ l d v f 2 2
where λ is the route resistance coefficient, which is related to the Re number and relative roughness; l is the length of the flow path; d is the hydraulic diameter of the flow path; vf is the flow velocity.
The local pressure loss δpl can be expressed by:
δ p l = ρ ζ v f 2 2
where ζ is the local resistance coefficient, which is related to the shape of the local mutation.

Appendix A.4. The Main Performance Indices

The tested discharge capacity Qt should be modified by Qv,l, and the discharge capacity Q should be:
Q = Q t + Q v , l
The volumetric efficiency ηv of the compressor system is defined as the ratio of the discharge capacity to the theoretical volume flowrate Qth.
η v = Q Q th
where
Q th = 2 n z V t
where n is the speed of the motor; z is the number of screw grooves; and Vt is the maximum volume of the working chamber.
The isentropic compression power Pis can be calculated by:
P is = k k 1 p 0 Q ( ( p d p 0 ) k 1 k 1 )
The isentropic efficiency ηis is expressed as:
η is = P is P sh
where Psh is the input shaft power of compressor.

Appendix A.5. The Tested Discharge Capacity Qt and the Shaft Power Psh

Discharge capacity is tested by a nozzle flowmeter:
Q t = 3536.36 × 10 6 c d 2 T 0 H P 0 T 1
where c is the nozzle coefficient; d is the diameter of the nozzle; H is the differential pressure of the nozzle; and T1 is the gas temperature before the nozzle.
The shaft power Psh is tested by the torque-speed sensor indirectly:
P sh = T sh ω = T sh n 9549
where ω is the angular velocity of the screw shaft; and Tsh is the input torque on the screw shaft.

References

  1. Mir, H.; Thibault, F.; Diraddo, R. Modelling behaviour of PET for stretch and micro-blow moulding applications using an elasto-visco-plastic material model. Int. Polym. Process. 2011, 26, 173–181. [Google Scholar] [CrossRef]
  2. Bordival, M.; Schmidt, F.M.; le Maoult, Y.; Velay, V. Optimization of preform temperature distribution for the stretch-blow molding of PET bottles: Infrared heating and blowing modeling. Polym. Eng. Sci. 2009, 49, 783–793. [Google Scholar] [CrossRef] [Green Version]
  3. Andres, R.; Hesse, J.; Hetze, F.; Low, D. Cfd simulation of a two stage twin screw compressor including leakage flows and comparison with experimental data. In Proceedings of the 24th International Compressor Engineering Conference, West Lafayette, IN, USA, 18–19 September 2018. Paper No. 012018. [Google Scholar]
  4. Zlatanovic, I.; Rudonja, N. Experimental evaluation of desuperheating and oil cooling process through liquid injection in two-staged ammonia refrigeration systems with screw compressors. Appl. Therm. Eng. 2012, 40, 201–215. [Google Scholar] [CrossRef]
  5. Liu, G.B.; Yang, Q.C.; Zhao, Y.Y.; Wang, L.; Li, L.S. Analysis of performance of two-stage screw compressor under various operating conditions. Proc. Inst. Mech. Eng. Part A J. Power Energy 2016, 230, 660–668. [Google Scholar] [CrossRef]
  6. Li, T.; Wang, Z.L.; Huang, R.; Wu, W.F.; Feng, Q.K. Theoretical analysis of loads on the gate rotor bearings in the single screw compressor. In Proceedings of the 8th International Conference on Compressors and Their Systems, London, UK, 9–10 September 2013; pp. 219–225. [Google Scholar]
  7. Yu, Y.Z. Who is better, the twin screw compressor or the single screw compressor? Compress. Technol. 2003, 6, 1–4. (In Chinese) [Google Scholar]
  8. Lu, Y.W.; Wu, Y.T.; Ma, C.F.; Mu, X.Y. The manufacture and performance test of a mini-type single screw compressor. In Proceedings of the ASME 2012 6th International Conference on Energy Sustainability, Sandiego, CA, USA, 23 July 2012; pp. 1295–1302. [Google Scholar]
  9. Li, Y.; Xie, G.N.; Bengt, S.D.; Lu, Y.W.; Wu, Y.T.; Jiang, Q. Performance study on a single-screw compressor for a portable natural gas liquefaction process. Energy 2018, 148, 1032–1045. [Google Scholar] [CrossRef]
  10. Li, Y.; Lu, Y.W.; Wu, Y.T.; Bengt, S.D.; Xie, G.N. The energy performance of a single-screw compressor for natural gas liquefaction process: Effects of the lubricating oil flow rate. Int. J. Energy Res. 2019, 43, 1494–1504. [Google Scholar] [CrossRef]
  11. Yang, J.L.; Zhang, C.; Zhang, Z.T.; Yang, L.W.; Ling, W.Y. Study on mechanical vapor recompression system with wet compression single screw compressor. Appl. Therm. Eng. 2016, 103, 205–211. [Google Scholar] [CrossRef]
  12. Ziviani, D.; Goeghegan, P.J.; Groll, E.A. Performance evaluation of a novel single-screw compressor and expander design. In Proceedings of the 11th International Conference on Compressors and Their Systems, London, UK, 9–11 September 2019. Paper No. 012074. [Google Scholar]
  13. Wu, Z.Y.; Tao, G.L. Simulation of high speed single screw compressor in fuel cell. J. Zhejiang Univ. (Eng. Sci.) 2006, 40, 309–312. [Google Scholar]
  14. Yang, S.C.; Huang, T.H.; Lai, C.H. Modeling and manufacture of a PC-type single-screw compressor rotor. Arab. J. Sci. Eng. 2014, 39, 4221–4229. [Google Scholar] [CrossRef]
  15. Yang, S.C. A mathematical model of a cc-type single-screw compressor. Proc. Inst. Mech. Eng. Part C J. Mech. Eng. Sci. 2004, 218, 437–448. [Google Scholar] [CrossRef]
  16. Yang, S.C. Profile generation and analysis for a PP-type single-screw compressor. Int. J. Adv. Manuf. Technol. 2006, 30, 789–796. [Google Scholar] [CrossRef]
  17. Yang, S.C.; Liang, T.L. Modeling and manufacturing of PP-type single screw compressor. Trans. Can. Soc. Mech. Eng. 2007, 31, 219–234. [Google Scholar]
  18. Xu, J.; Feng, Q.K.; Wu, W.F. A new single screw compressor with profiles enveloped by multi-straight lines. In Proceedings of the 22nd International Congress of Refrigeration, Beijing, China, 21–26 August 2007; pp. 1–6. [Google Scholar]
  19. Wu, W.F.; Feng, Q.K. A multicolumn envelope meshing pair for single screw compressors. J. Mech. Des. 2009, 131, 0745051. [Google Scholar] [CrossRef]
  20. Wu, W.F.; Feng, Q.K. Column envelope meshing pair and its design method for single screw compressors. J. Zhejiang Univ. Sci. A 2009, 10, 31–36. [Google Scholar] [CrossRef]
  21. Wu, W.F.; Li, J.; Feng, Q.K. Simulation of the surface profile of the groove bottom enveloped by milling cutters in single screw compressors. CAD Comput. Aided Des. 2011, 43, 67–71. [Google Scholar] [CrossRef]
  22. Liu, F.L.; Feng, J.H.; Xie, J.; Feng, Q.K. A synergy-column envelope meshing pair profile for single screw compressors. Proc. Inst. Mech. Eng. Part C J. Mech. Eng. Sci. 2019, 233, 1383–1391. [Google Scholar] [CrossRef]
  23. Murono, T.; Ueno, H.; Ohtsuka, K.; Takahashi, T.; Susa, T. Development of single screw compressor using new tooth profile. In Proceedings of the International Conference on Compressors and Their Systems, London, UK, 10–12 September 2007; pp. 183–191. [Google Scholar]
  24. Wu, W.F.; Hao, X.Q.; He, Z.L.; Li, J. Design of the curved flank for the star-wheel tooth in single screw compressors. J. Mech. Des. 2014, 136, 051006. [Google Scholar] [CrossRef]
  25. Minikaev, A.F.; Yerezhep, D.; Pronin, V.A. Using computer modeling methods to develop the screw single-rotary compressor working bodies profiles. In Proceedings of the 2018 International Russian Automation Conference, Sochi, RU, USA, 9–16 September 2018. Paper No. 8501830. [Google Scholar]
  26. Ziviani, D.; Goeghegan, P.J.; Groll, E.A. Novel approach to single-screw compressors and expanders design. In Proceedings of the International Conference on Screw Machines, Dortmund, Germany, 18–19 September 2018. Paper No. 012011. [Google Scholar]
  27. Li, J.; Feng, Q.K.; Liu, F.L.; Wu, W.F. Experimental studies of the tooth wear resistance with different profiles in single screw compressor. Tribol. Int. 2013, 57, 210–215. [Google Scholar] [CrossRef]
  28. Wang, Z.L.; Wang, H.; Wang, J.; Li, Q.; Feng, Q.K. Theoretical study on wear characteristics of single screw refrigeration compressor with multicolumn envelope meshing pair. Int. J. Refrig. 2019, 102, 1–11. [Google Scholar] [CrossRef]
  29. Post, W. De Hydrodynamische Filmsmering in Een Glovoide Worm Compressor. Ph.D. Thesis, Eindhoven Unversity of Technology, Eindhoven, The Netherlands, 1983. [Google Scholar]
  30. Huang, R.; Li, T.; Yu, X.L.; Liu, F.L.; Feng, Q.K. An optimization of the star-wheel profile in a single screw compressor. Proc. Inst. Mech. Eng. Part A J. Power Energy 2015, 229, 139–150. [Google Scholar] [CrossRef]
  31. Li, T.; Liu, Z.; Huang, R.; Liu, F.L.; Feng, Q.K.; Yu, X.L. Research of the hydrodynamic lubrication characteristics of different MPPs in water-flooded single screw compressors. Proc. Inst. Mech. Eng. Part A J. Power Energy 2016, 230, 247–259. [Google Scholar] [CrossRef]
  32. Li, T.; Huang, R.; Feng, Q.K.; Wu, W.F.; Liu, F.L.; Yu, X.L. Hydrodynamic Lubricating Characteristics of Water Flooded Single Screw Compressors Based on Two Types of MPP. Proc. Inst. Mech. Eng. Part J J. Eng. Tribol. 2016, 230, 1092–1106. [Google Scholar] [CrossRef]
  33. Wang, Z.L.; Liu, Z.; Wang, H.; Wang, J.; Feng, Q.K.; Li, Q. Geometric characteristics analysis for inner surface of working chamber in single screw compressor with multicolumn envelope meshing pair. Int. J. Refrig. 2019, 108, 347–357. [Google Scholar] [CrossRef]
  34. Wang, Z.L.; Wang, H.; Wang, Z.M.; Li, Q.; Feng, Q.K. Theoretical study on heat transfer characteristics of single screw refrigeration compressor with Multicolumn envelope meshing pair. Appl. Therm. Eng. 2020, 166, 114635. [Google Scholar] [CrossRef]
  35. Wang, Z.L.; Wang, H.; Qu, Y.; Jiang, W.C.; Feng, Q.K. Optimization study on multicolumn envelope meshing pair of single screw compressor based on leakage characteristics. Int. J. Refrig. 2018, 92, 113–124. [Google Scholar] [CrossRef]
  36. Wang, Z.L.; Shen, Y.F.; Wang, Z.B.; Wang, J.; Jiang, W.C.; Li, Q. Theoretical research and optimization analysis for the injection process of the single screw refrigeration compressor. Int. J. Refrig. 2018, 88, 91–101. [Google Scholar] [CrossRef]
  37. Wang, Z.L.; Wang, Z.B.; Wang, J.; Jiang, W.C.; Feng, Q.K. Theoretical and experimental study on thermodynamic performance of single screw refrigeration compressor with Multicolumn Envelope Meshing Pair. Appl. Therm. Eng. 2016, 103, 139–149. [Google Scholar] [CrossRef]
  38. Wu, Z.Y.; Tao, G.L.; Liu, H. Study on usage efficiency of single screw compressor’s shaft power based on exergy analysis method. China Mech. Eng. 2006, 17, 1003–1006. [Google Scholar]
  39. Xing, Z.W. Screw Compressor—Theory, Design and Application; China Machine Press: Beijing, China, 2000. (In Chinese) [Google Scholar]
  40. National Technical Committee 145 on Compressor of Standardization Administration of China. GB/T 15487–1995. In Methods of Flow Measurement for Displacement Compressor; Standards Press of China: Beijing, China, 1995. (In Chinese) [Google Scholar]
Figure 1. A schematic view of a SSC.
Energies 13 04232 g001
Figure 2. Schematic drawing of the experimental system.
Energies 13 04232 g002
Figure 3. The basic geometric parameters of a meshing pair.
Energies 13 04232 g003
Figure 4. The fabricated SSC: (a) casing and gate-rotor; (b) screw rotor.
Energies 13 04232 g004
Figure 5. The thermophysical process of water vapor in moist air.
Energies 13 04232 g005
Figure 6. The influence of suction relative humidity on the dehumidifying process: (a) dehumidifying mass flow; (b) loss of discharge capacity.
Energies 13 04232 g006
Figure 7. The influence of suction temperature on the dehumidifying process: (a) dehumidifying mass flow; (b) loss of discharge capacity.
Energies 13 04232 g007
Figure 8. The pressure loss of the air filter and the pressure coefficient.
Energies 13 04232 g008
Figure 9. The pressure information of the key points on the discharge flow path.
Energies 13 04232 g009
Figure 10. The compressor performance under different motor speed.
Energies 13 04232 g010
Figure 11. Compressor efficiencies under different injected water temperature.
Energies 13 04232 g011
Figure 12. Compressor performance under different injected water flowrates.
Energies 13 04232 g012
Figure 13. Compressor efficiencies under different injected water flowrates.
Energies 13 04232 g013
Figure 14. The compressor performance under different discharge pressures.
Energies 13 04232 g014
Figure 15. The compressor efficiencies under different discharge pressures.
Energies 13 04232 g015
Table 1. Main parameters of the prototype.
ParameterValueParameterValue
Rated motor power/kW37dsc/mm180
Rated motor speed/r·min−12950dgr/mm193
Q/m3·min−15.4b/mm28
Water injection flowrate/L·min−152.5A/mm144
Table 2. The function and accuracy of the measurement instrument.
Measurement InstrumentFunctionAccuracy
DYM-3Atmospheric pressure<±100 Pa
U tube pressure gaugeDifferential pressure <±0.4%
Pressure sensorExhaust pressure<±0.25%
Precise pressure gaugeWater and air pressure<±0.4%
Pt 100Temperature<±0.2 °C
JC3 Torque-speed sensorMotor speed<±0.1%
JC3 Torque-speed sensorInput torque<±0.2%
Vortex FlowmeterMeasure the water flowrate<±0.2%

