Windcatcher Louvers to Improve Ventilation Efficiency


1
School of Architecture and Building Science, Chung-Ang University, Seoul 06974, Korea
2
Graduate School, Chung-Ang University, Seoul 06974, Korea
*
Author to whom correspondence should be addressed.
Energies 2020, 13(17), 4459; https://0-doi-org.brum.beds.ac.uk/10.3390/en13174459
Submission received: 13 July 2020
/
Revised: 20 August 2020
/
Accepted: 21 August 2020
/
Published: 28 August 2020
(This article belongs to the Special Issue Smart Built Environment for Health and Comfort with Energy Efficiency)
Abstract
:Windcatcher louvers are designed to capture air flowing outside a building in order to increase its natural ventilation. There are no studies that have designed the shape of the louver to increase the natural ventilation efficiency of the building. This study aimed to conduct a computational fluid dynamics simulation and mock-up test of a Clark Y airfoil-type windcatcher louver designed to increase the natural ventilation in a building. The following test results were obtained. The optimal angle of attack of the airfoil was calculated via a numerical analysis, which demonstrated that the wind speed was at its highest when the angle of attack was 8°; further, flow separation occurred at angles exceeding 8°, at which point the wind speed began to decrease. The results of the mock-up test demonstrated that the time required to reduce the concentration of fine particles in the indoor air was 120 s shorter when the windcatcher was installed than when it was not, which indicating that the time to reduce particles represents a 37.5%reduction. These results can be seen as reducing the energy consumption of ventilation in the building because the natural ventilation efficiency is increased.
1. Introduction
An increasing number of people in the modern world spend as much as 80% of their time indoors; therefore, the quality of the air they breathe should be high [1]. According to the World Health Organization, approximately 40% of the occupants in buildings worldwide experience health problems caused by contaminated indoor air [2] and the National Institute for Occupational Safety and Health in the United States has announced that ‘lack of ventilation’ is responsible for 52% of the contamination found in indoor air [3]. An effective method for improving the air quality in a building is to increase the performance of its ventilation system, which helps dilute the contaminants in indoor air, such as fine particles and bioaerosols, with an inflow of fresh air.
Because natural ventilation in a building is based on the indoor–outdoor pressure differential, wind pressure, and gravity, a high ventilation efficiency is difficult to achieve if there is a neutral zone in which no inflow or outflow of air occurs. However, if a building receives wind from outside or if the difference in the temperature inside and outside the building is large, a high ventilation efficiency can be achieved. In addition, if the windows are not designed to support cross ventilation, the possibility of wind-based ventilation is eliminated, which further decreases the ventilation efficiency [4].
However, the natural ventilation rate (5.14 ACH; air changes per hour) is approximately 40% higher than the ventilation rate of an air conditioning system (3.02 ACH) when the outdoor environment is excellent (pressure differential, wind pressure). Further, when natural ventilation is utilized, building energy can be effectively saved [5]. In other words, applying natural ventilation efficiency enhancement technology to buildings without an external environment is a manner in which building energy can be saved.
Furthermore, poorly designed natural ventilation systems installed in buildings may negatively affect the health of the occupants, due to the accumulation of harmful substances caused by the reduced ventilation efficiency [6]. Therefore, the efficiency of natural ventilation systems should be improved to minimize the potential for health problems.
However, natural ventilation exhibits a limitation of lower efficiency than mechanical ventilation. To compensate for the low efficiency of natural ventilation, mechanical ventilation should be considerably increased, which increases building energy consumption. If the natural ventilation efficiency can be increased to produce an effect similar to that of mechanical ventilation, building energy consumption can be reduced by approximately 30% [7].
An airfoil is a two-dimensional airplane wing-shaped section [8]. While several studies have applied airfoil shapes to automobiles or wind power systems, such architecture is rarely found in real life [9,10,11,12,13]. Examples include a study conducted by Liu et al. who installed a general windcatcher louver on the roof of a building to analyze the corresponding pressure distribution and air currents [14]. Kang and Lee conducted a wind tunnel test and computational fluid dynamics (CFD) analysis of a louver-type vent installed on the roof of a factory building [7]. Chiang et al. conducted a mock-up test and experimented with changing the ventilation flowing into a room by varying the width and length of a horizontal louver mounted in a window [15]. However, thus far, to the best of our knowledge, no study has employed an airfoil louver as a windcatcher.
The effect of applying a simple right-angled louver on natural ventilation and airflow has been studied; however, the effect of an airfoil-shaped louver on the natural ventilation efficiency has not been studied thus far. In other words, this study is the first to utilize an airfoil-shaped louver for improving airflow speed [14,16].
In the current study, the performance of an airfoil-type windcatcher louver designed to increase the efficiency and performance of a natural ventilation system was evaluated. First, the optimal angle of the airfoil was determined via a CFD simulation. Then, a mock-up test was conducted to evaluate the ventilation performance of the louver. A flowchart of the structure of the remainder of the paper is shown in Figure 1.
2. Literature Review
2.1. Windcatcher
Windcatchers are architectural elements that were used in ancient Egypt to naturally ventilate indoor air. These elements are still used in Middle Eastern regions, including the small Arab states of the Persian Gulf, such as Dubai, Pakistan, and Afghanistan. Windcatchers can be categorized as one-directional, two-directional, and multidirectional, depending on the direction used to catch the wind. They can be further categorized based on their design, i.e., whether they utilize descending or ascending air currents. Windcatchers designed to use descending air currents compress the air and lower the room temperature. The top part of the tower is installed in a high place, such as a chimney, and is blocked on all sides but one, which has an open structure to draw in the wind. The wind coming through the open side creates a descending air current that falls toward the room center and cools the room. A few advantages of this approach are that a separate process is not required to cool the incoming air and the cooling efficiency increases with the speed of the descending air current [13,17].
2.2. Airfoil
As shown in Figure 2 [18], an airfoil resembles a two-dimensional section shaped as an airplane wing and has a streamlined shape that includes a round leading-edge and a sharp trailing-edge. The most commonly used airfoils in the United States are those utilized by the National Advisory Committee for Aeronautics (NACA) and Clark Y [19,20,21]; however, other airfoils are also utilized, such as the low-speed ultralight Aircraft (ULM) wing, airliner, propeller blade, and supersonic interceptor shapes, which are depicted in Figure 3 [22,23,24,25,26,27,28,29].
Most existing airfoils help increase the sub-atmospheric pressure by changing the air flow of the leading edge via a slat. In such airfoils, air is blown from the leading edge at high pressure toward the tailing edge along the upper surface until it is drawn into the vent at the corner of the tailing edge. The addition of an air current on the upper surface of the airfoil can increase the sub-atmospheric pressure on the top surface even at low pressures. In contrast, the Co-Flow Jet (CFJ) Airfoil proposed by Lefebvre et al. [30] changed the aerodynamic characteristics of an airfoil without using a slat. This configuration is depicted in Figure 4.
2.3. Clark Y Airfoil
The Clark Y airfoil was designed by Virginius E. Clark in 1922 and is now widely used in the design of general-purpose aircraft as it has a simple design with a flat floor. A Clark Y airfoil has a maximum thickness of 11.7% and a camber of 3.4% at 28% and 42% of the chord length, respectively. The cross section, lift, and drag coefficients of a Clark Y airfoil are shown in Figure 5, and the X and Y coordinates of various points on a Clark Y airfoil are listed in Table 1. Ideally, the blade size, tip speed ratio, etc. of an airfoil should be based on the Reynolds number; however, this is typically neglected and a value of NRe = 100,000 is employed instead. The lift of a blade depends on the angle of attack, which is based on the relative direction of the wind, current length of the blade, and line angle. A Clark Y airfoil achieves its maximum output when the angle of attack is set to 8°, and although the specifics of the various types vary, no significant errors arise if the lift coefficient is set to CL = 1 and the angle of attack is set in the range 4–6° [12]. If the angle of attack exceeds 8°, flow separation may occur along with a rear vortex, which will disrupt the flow of the air current.
The airfoil-type windcatcher evaluated in this study was a Clark Y airfoil designed to be suitable for openings, such as those in windows. The designed airfoil helped increase the size of the sub-atmospheric pressure region by allowing air to be ejected from its top, which then flows along its surface.
3. Simulation
3.1. CFD Analysis Conditions
A CFD analysis using the Star-CCM+ (ver.13.03) software suite developed by CD-Adapco (Melville, NY, USA) was employed to assess the natural ventilation performance of the designed airfoil when used as a windcatcher louver. A K-epsilon model served as a turbulence model as it exhibits a low error rate even for relatively large models due to its support for tetra grids in indoor–outdoor air current analyses [7,14]. The following three-dimensional steady-state incompressible flow equations [15] were used in the analysis:
where x: direction of flow, u: velocity (m/s), ρ: density (kg/m3), k: turbulent flow energy (m2/s2), μ: viscosity coefficient (Pa·s), μeff: the value of effective permeability, Gk: variable by mean velocity, Gb: variable by buoyancy, ε: turbulent kinetic energy dissipation rate (m2/s2) and i, j: vector of flow.
The parameters used in the CFD analysis to determine the changes in the pressure and wind speed around the airfoil are listed in Table 2. The base size of the mesh was set to 0.01 m and the target size was set to 50%, which translates to a minimum step size of 0.005 m and is sufficiently small to accommodate the target model used in the simulation. The grid was configured as a polyhedral mesh to facilitate three-dimensional analyses, and the inlet value was set to 3.6 m/s, which is the average wind speed measured at Seoul in 2017. The ‘K-epsilon Turbulence’ model was used to simulate the vertical louver to analyze the variation in airflow corresponding to the installation angle. The ‘K-omega Turbulence’ model was used to simulate the horizontal louver to analyze the variation in airflow corresponding to the variation in the angle of the Clark Y airfoil louver.
3.2. CFD Modeling
3.2.1. Installation Angle of the Vertical Louver
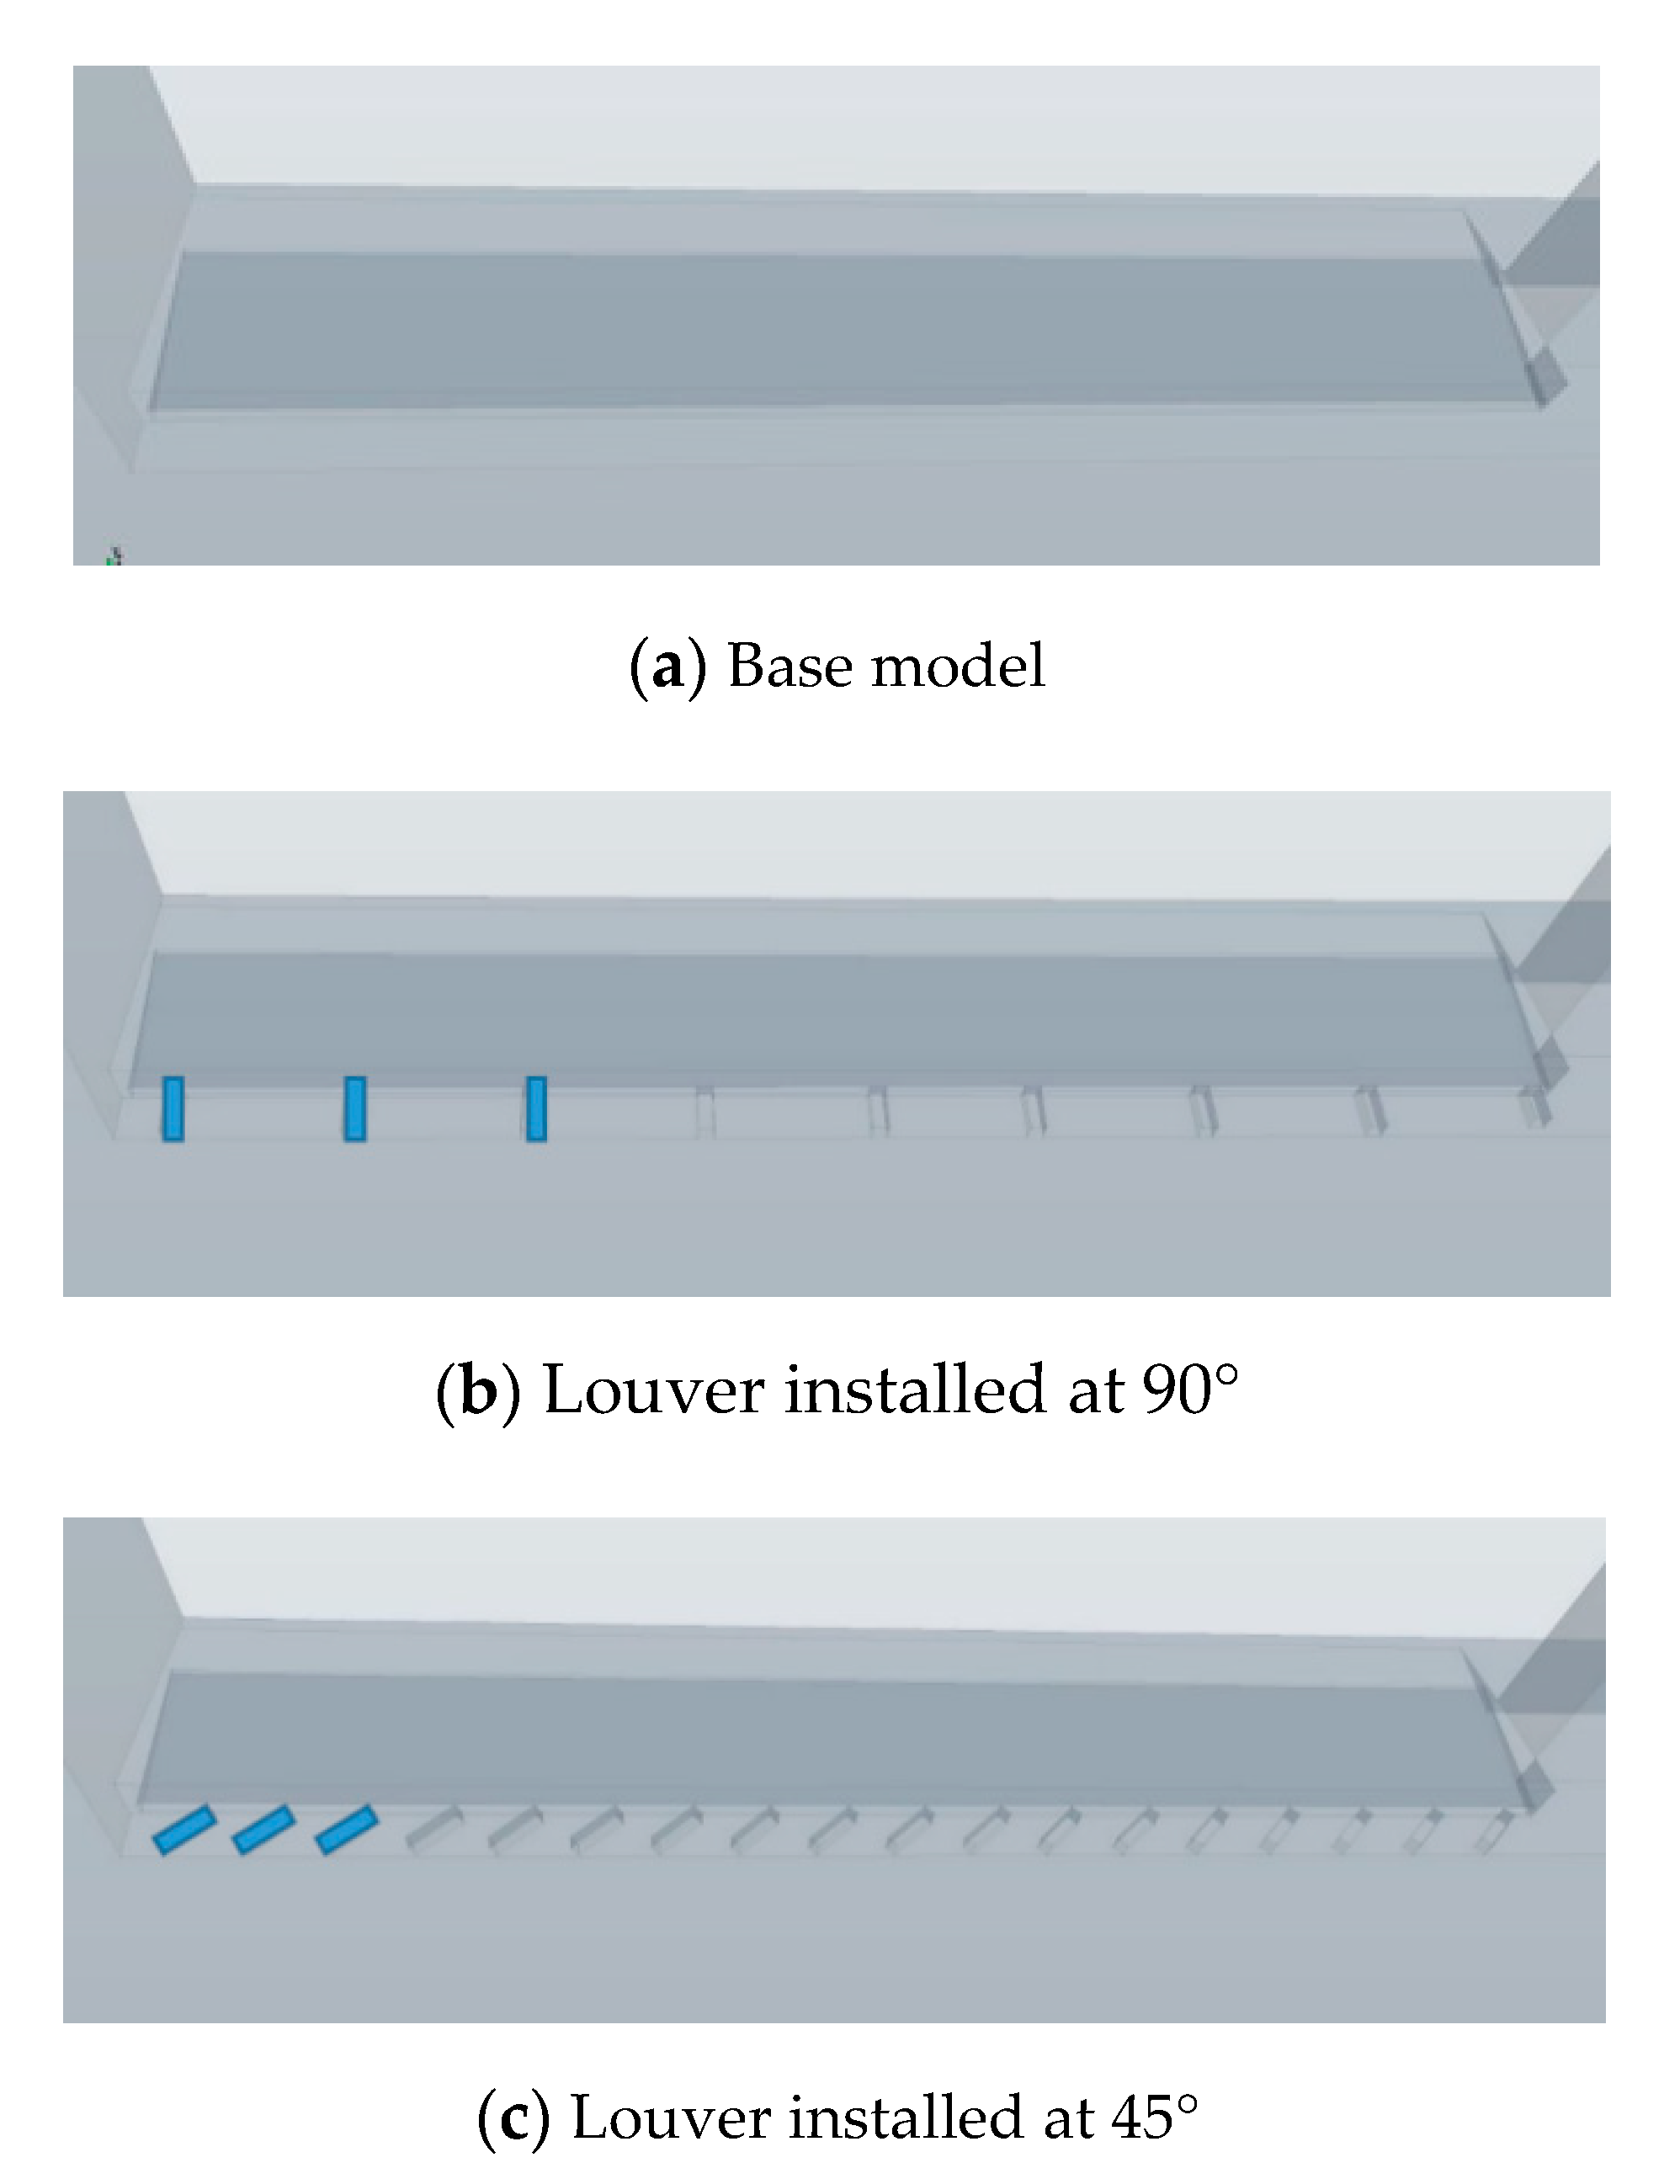
The variation in airflow corresponding to the installation angle of the vertical louver was analyzed. For the angle of the louver, an additional 45° was considered along with the generally installed 90°. Three analyses, including the base model, were conducted. The base model is a general window without louvers. The building model considered for the analyses is shown in Figure 6, and the wind speed was set at 3.6 m/s, the average wind speed in 2018 in Seoul, South Korea. The modeling of the installation angle of the louver is shown in Figure 7.
3.2.2. Clark Y Airfoil Shaped Horizontal Louver
As the CFD analysis was based on the wind speed recorded in Seoul in 2017, the louver was installed with the leading edge facing toward the west, which was the main direction of the wind in 2017, and the length of the cord was set to 220 mm. Even though the characteristics of a Clark Y airfoil vary depending on the shape, performance that is almost optimal can be achieved without a large error if the lift coefficient is CL = 1 and the angle of attack is in the range 4–6° [13]. In the simulation, the angle of attack was set to 0, 1, 2, 4, and 8° for comparison purposes (Figure 8).
A total of 327,841 cells were generated in the meshing phase during modeling. Each cell comprised tetrahedral cells (12), hexahedral cells (5480), wedge cells (210), pyramid cells (8), and polyhedral cells (322,131). Interior faces were generated into 1,878,532 cells, which exhibited triangular (93,022), quadrilateral (567,154), and polygonal (1,218,356) shapes. As shown in Table 3, through the validation function in the Star-CCM+, it was confirmed that more than 99.9% of faces are valid.
4. Mock-Up Test
4.1. Design and Built of the Windcatcher Louver
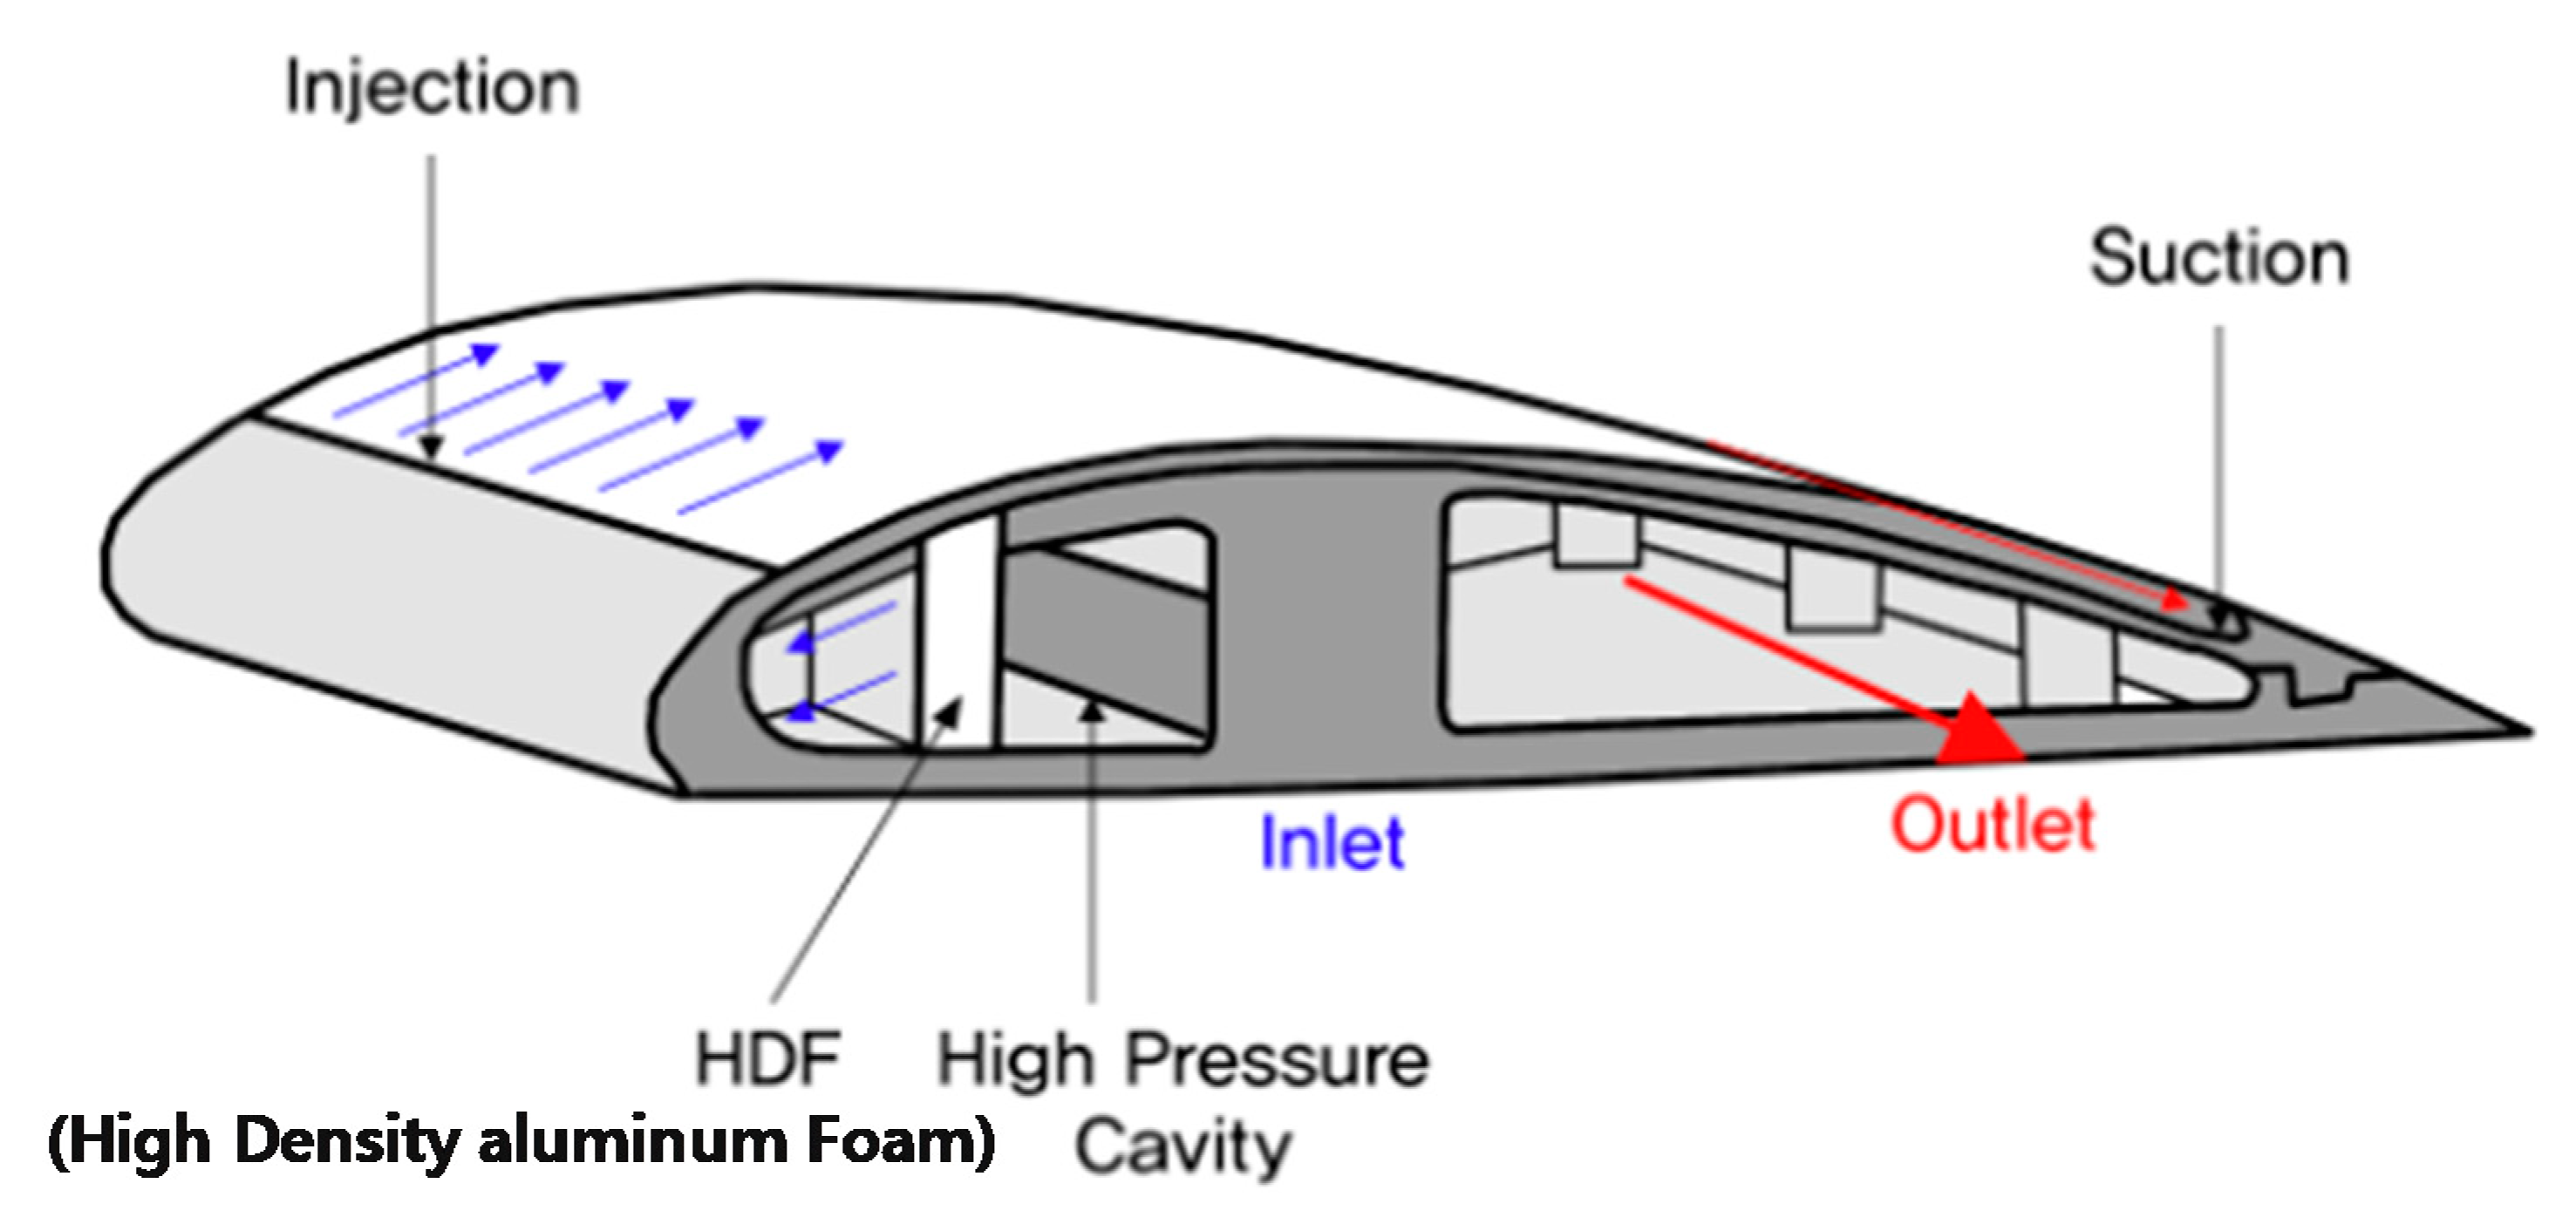
The Clark Y airfoil in this study was a maximum of 1200 mm long, 220 mm wide, and 30 mm high, which allowed it to fit into the window used in the mock-up test. The schematic of the external structure of the windcatcher louver is shown in Figure 9, while the interior and the direction of the flow channel are shown in Figure 10. The high-pressure air ejected from the vent of the windcatcher louver flows toward the tailing edge along the upper surface, thereby increasing the area of the sub-atmospheric pressure formation region.
4.2. Mock-Up Test
Two mock-up test rooms were constructed in Seoul, South Korea, to analyze the natural ventilation performance of the windcatcher louver. The rooms were identical, and each had dimensions of 2500 mm × 2500 mm × 2500 mm. The roof and walls of the setup were constructed of sandwiched panels 100 mm thick, and a window with dimensions of 2000 mm × 2000 mm was installed in the south-facing wall of each room. The specifications of the rooms are summarized in Table 4.
Windcatcher louvers were only installed in Room 2 at a location 50 mm away from the top and bottom of the window to facilitate an efficient flow of outside air and to compare the ventilation performance without (Room 1) and with (Room 2) louvers. During the tests, the concentration of fine particles and the air current, temperature, and humidity were measured. The outside wind direction was set as either from the west (incidence angle of 0°) or south (incidence angle of 90°), depending on the test conducted. These wind directions correspond to the prevailing wind directions in Seoul, South Korea, and the building orientation was such that the south wind with an incidence angle of 90° flowed in a direction perpendicular to the wall and directly into the window. The measurement methods and a summary of the results are provided in Table 4 and Table 5; Figure 11 shows the plan and perspective view of the mock-up rooms. Table 6 lists the measurement instruments used in the tests.
The purpose of the tests was to measure the time required to reduce the concentration of contaminants in the air with and without the windcatcher. After the concentration of fine particles in the air in the mock-up room was set to approximately 1000 μg/m3, the window was opened in each room and the time required to reach a concentration of 30 μg/m3 was measured. The test was conducted as four separate experiments to compare the results of different configurations; the wind speed was set to 3.6 m/s for all tests. The direction of the wind was from the west (0°) in Experiments 1 and 3, and from the south (90°) in Experiments 2 and 4. The windcatcher was not used in Experiments 1 and 3 but was present in Experiments 2 and 4 (Figure 12).
5. Results and Discussion
5.1. CFD Simulation Results
5.1.1. Installation Angle of the Vertical Louver
The variation in airflow according to the installation angle of the vertical wind-up louver was analyzed. The analysis results helped verify that when a collection louver was installed, eddy currents were generated and adversely affected the airflow into the room. As the airflow collides with the louver and returns, a back-pressure gradient is generated, resulting in vortex and wake. Eventually, the flow separation occurred, and the velocity of the airflow entering the room further decreased. The same result was obtained even when the airflow speed decreased to 1/10th the existing speed. The simulation results for the base model are shown in Figure 13, those obtained after lowering the airflow velocity are shown in Figure 14. These results demonstrate that the installation of additional louvers other than the Clark Y airfoil-shaped window frame has an adverse effect on improving airflow speed.
5.1.2. Clark Y Airfoil Shaped Horizontal Louver
The pressure distribution and variation in the air current caused by the Clark Y airfoil-type windcatcher louver were analyzed to determine the optimal angle of attack for the louver. In this test, the angle of attack was set to 0, 1, 2, 4, and 8°, and the area of the sub-atmospheric pressure formation and the wind speed were found to increase for large angles of attack. However, at angles exceeding 8°, flow separation occurred and a rear vortex appeared. When the angle of attack was 0° and 8°, the maximum wind speeds were approximately 4.8 m/s and 5.7 m/s, respectively. In other words, the area covered by the sub-atmospheric pressure formation expanded and the wind speed increased for larger angles.
As the angle of the louver increases, the negative pressure forming area (circle with a red dotted line) on the louver surface increases proportionally. In addition, as the negative-pressure-forming area increases, the wind speed increases (red square), whereas the positive-pressure-forming area increases at the lower end (Figure 15). Based on the results of this CFD study, the angle of attack to be applied to the mock-up louver was selected.
5.2. Mock-Up Test Results
In the mock-up test, the concentration of fine particles in the air in the rooms was increased to approximately 1000 μg/m3. Then, the time required to reduce the concentration to 30 μg/m3 for various louver configurations and wind incidence angles was measured to determine the natural ventilation performance of the louver. The results of the test were as follows. In Experiment 1 (no windcatcher; wind incidence angle of 0°), the time required to reduce the concentration of fine particles from 1001 to 29.9 μg/m3 was 6 min (360 s) (Figure 16). In Experiment 2 (no windcatcher; wind incidence angle of 90°), the time required to reduce the concentration of fine particles from 1007.3 to 30 μg/m3 was 5 min 20 s (320 s) (Figure 17). In Experiment 3 (windcatcher present; wind incidence angle of 0°), the time required to reduce the concentration of fine particles from 999.9 to 30.5 μg/m3 was 5 min (300 s) (Figure 18). In Experiment 4 (windcatcher present; wind incidence angle of 90°), the time required to reduce the concentration of fine particles from 1003 to 29.5 μg/m3 was 3 min 20 s (200 s) (Figure 19).
The times required to reduce the concentration of fine particles in Experiments 1 and 2 in which no windcatcher was used differed by 40 s, while those obtained in Experiments 3 and 4 in which the windcatcher was used differed by 1 min 40 s (100 s) (Table 7).
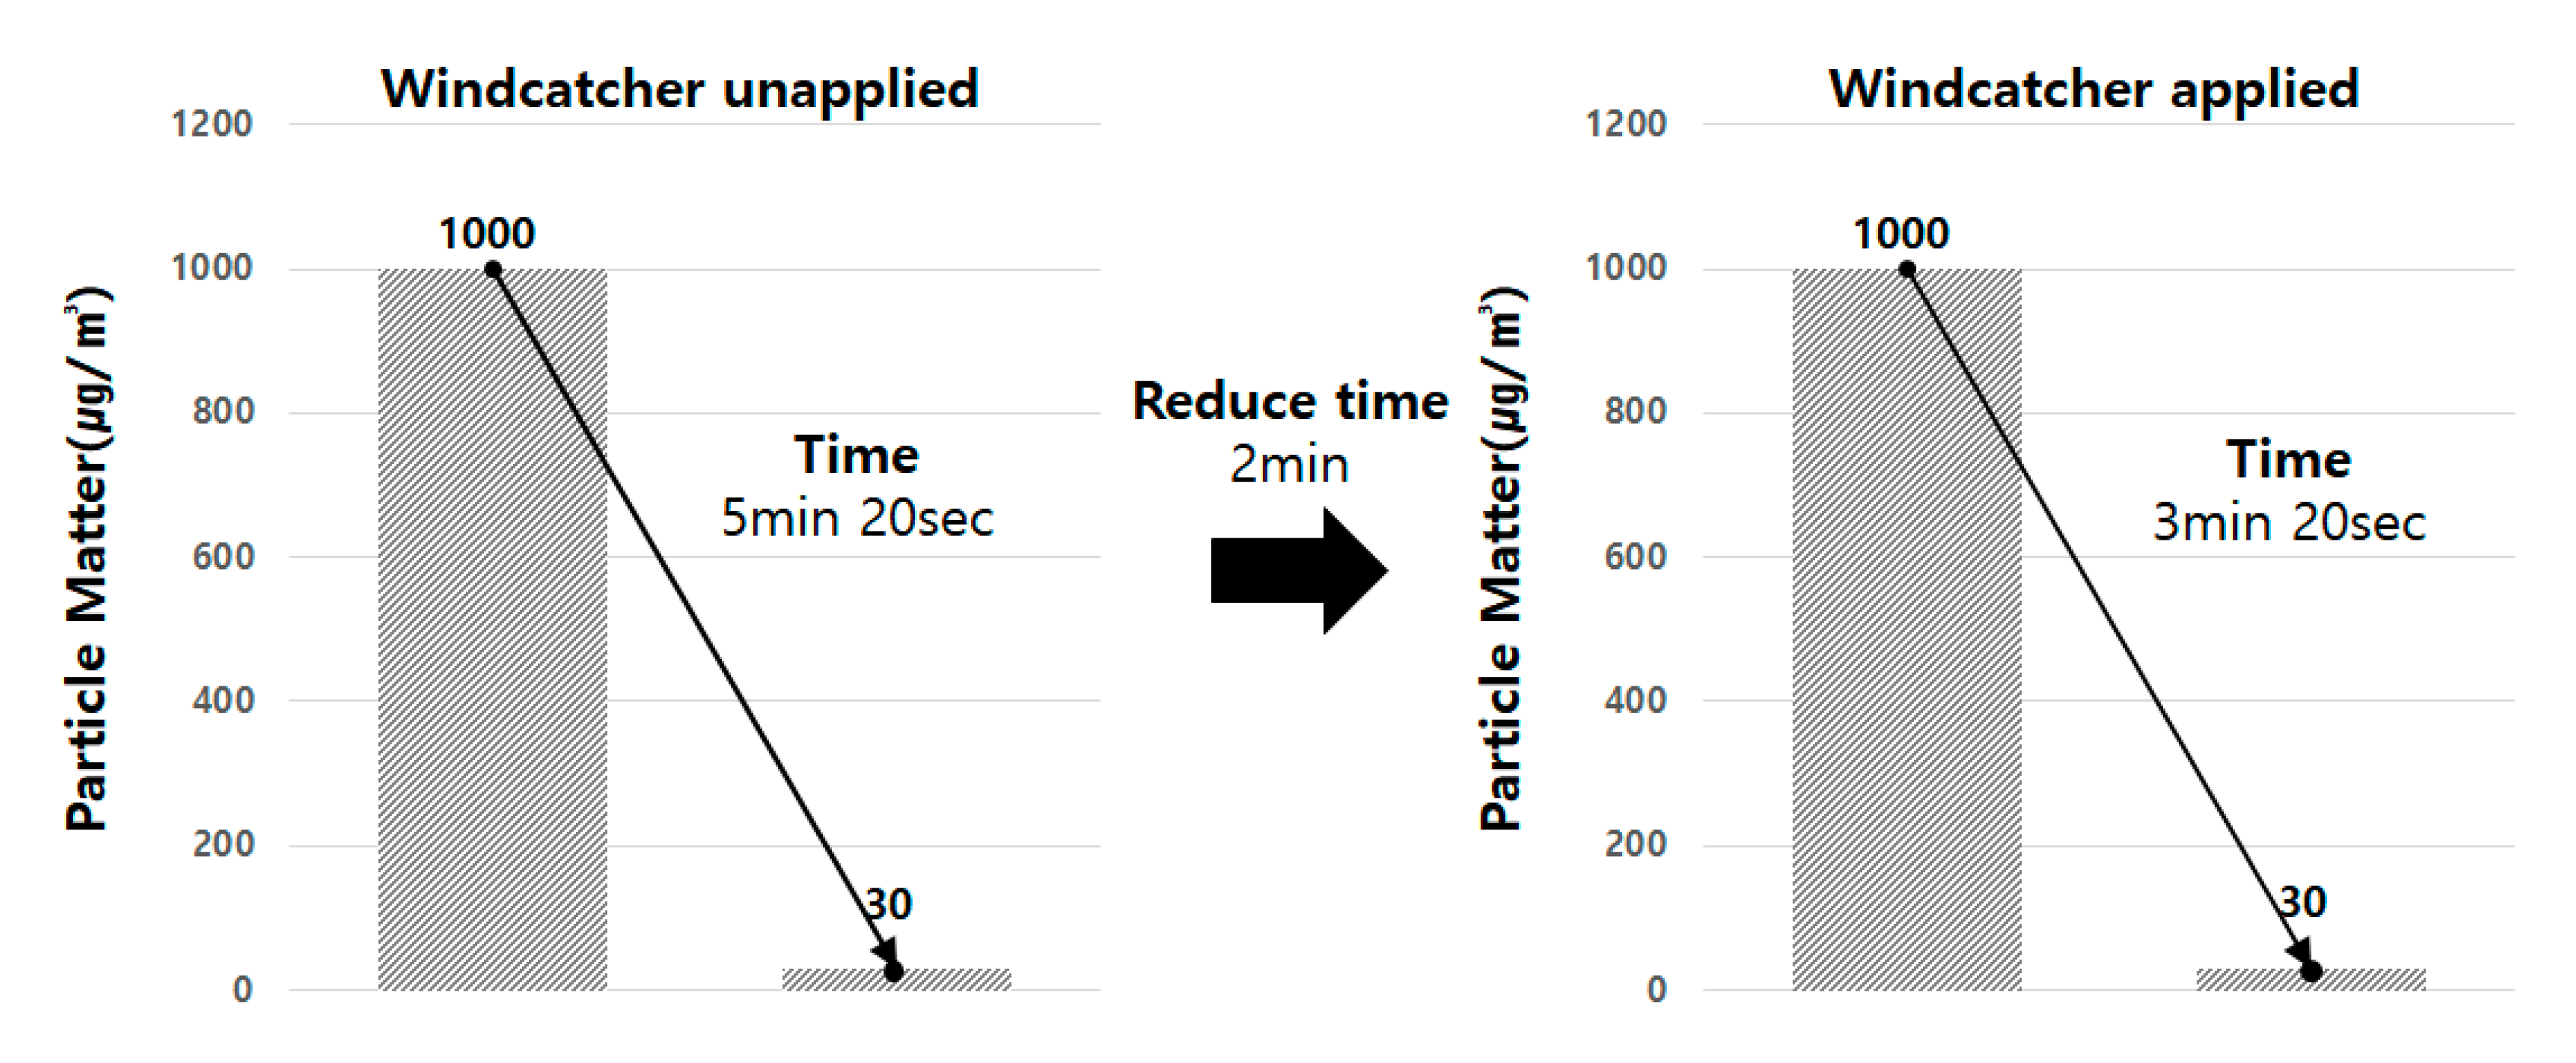
In other words, the effect of the wind incidence angle was higher when the windcatcher was installed. When the results of Experiments 2 (no windcatcher) and 4 (windcatcher) were compared, the times required to reduce the concentration of fine particles in Experiments 2 and 4 were 5 min 20 s (320 s) and 3 min and 20 s (200 s), respectively, exhibiting a difference of 120 s. These results demonstrate that the addition of a windcatcher louver decreased the time required to reduce the concentration of fine particles in indoor air by up to 37.5% (Table 8 and Table 9 as well as Figure 20).
6. Conclusions
In this study a CFD simulation and mock-up test were conducted on a Clark Y airfoil-type windcatcher louver that was designed to improve the natural ventilation of buildings. The results of the study can be summarized as follows:
- (a)
- In the CFD simulation, when a separate vertical louver is installed outside the window, eddy currents were generated and adversely affected the airflow into the room. Therefore, the installation of additional vertical louvers other than the horizontal louvers of the Clark Y airfoil has an adverse effect on improving the airflow speed.
- (b)
- In the CFD simulation, the area covered by the sub-atmospheric formation on the top of the louver and the maximum wind speed increased as the angle of attack increased from 0, 1, 2, 4, and 8°. Maximum wind speeds of 4.8 m/s and 5.7 m/s were measured at angles of 0° and 8°, respectively, which was identical to the results of a previous study [11] in which the maximum wind speed was achieved at an angle of 8°.
- (c)
- In the mock-up test, the natural ventilation performance was evaluated with and without a windcatcher louver for various wind incidence angles. The times required to reduce the concentration of fine particles for wind incidence angles of 0° and 90° and no louver differed by 40 s, while the times required for the same incidence angles when a windcatcher was present differed by 1 min 40 s. Based on these results, the effect of the incidence angle of the wind was found to be greater when a windcatcher was installed, which suggests that a windcatcher can improve the natural ventilation performance in a building. Improved natural ventilation efficiency in buildings can reduce electricity consumption [5]. Therefore, utilizing a windcatcher is considered to help save building energy.
- (d)
- The time required to reduce the concentration of fine particles without and with a windcatcher for a wind incidence angle of 90° were 5 min 20 s (320 s) and 3 min 20 s (200 s), respectively, exhibiting a difference of 120 s. In other words, the time required for the concentration of fine particles to be reduced was 37.5% shorter when the windcatcher was installed.
The results of this study demonstrate that the Clark Y airfoil-type windcatcher louver is a practical solution for improving the performance of natural ventilation systems in buildings. This saves electrical energy consumption corresponding to mechanical ventilation utilized in buildings. According to a study conducted by Park et al. (2020), if the natural ventilation efficiency is increased, the consumption of building energy can be reduced by approximately 30%. Therefore, the present ventilation system is considered to not only improve indoor air quality, but also reduce the ventilation consumption energy of the building.
However, this experiment was applied to mock-up to see a fragmentary aspect. Therefore, for a more accurate analysis, it is determined that an experiment that responds to changes in wind speed according to altitude by applying it to an actual building is necessary.
In the future, the durability, long-term annual energy analysis, economic feasibility, and applicability of the proposed windcatcher will be investigated in detail and the concept will be extended to other types of buildings.
Author Contributions
All authors contributed equally. Conceptualization, Y.K.Y., M.Y.K., J.C.P.; Methodology, Y.K.Y., M.Y.K., Y.W.S., J.C.P.; Formal analysis, Y.K.Y., M.Y.K., Y.W.S., S.H.C., J.C.P.; Resources, Y.K.Y., Y.W.S., S.H.C., J.C.P.; Data curation, Y.K.Y., M.Y.K., Y.W.S., S.H.C., J.C.P.; Writing—original draft preparation, Y.K.Y., J.C.P.; Writing—review and editing, J.C.P.; Visualization, Y.K.Y., M.Y.K., S.H.C; Supervision, J.C.P.; Project administration, J.C.P.; Funding acquisition, J.C.P. All authors have read and agreed to the published version of the manuscript.
Funding
This research was supported by Basic Science Research Program, through the National Research Foundation of Korea (NRF) funded by the Ministry of Education (NRF-2019R1A6A3A01095517), and by the Chung-Ang University Research Scholarship Grants in 2020.
Conflicts of Interest
The authors declare no conflict of interest.
References
- Park, D.Y.; Chang, S. Numerical analysis on the coupled operation of ventilation window system and central cooling system. J. Korean Soc. Atmos. Environ. 2015, 31, 385–395. [Google Scholar] [CrossRef] [Green Version]
- The Architectural Institute of Korea. Architecture Architectural Environment Planning; Kimoondang: Seoul, Korea, 2013. [Google Scholar]
- Oregon OSHA. Technical Manual. Indoor Air Quality Investigations. Available online: https://www.osha.gov (accessed on 1 June 2020).
- Kim, J.S. Architectural Environmental Engineering; SeoWoo Publications: Seoul, Korea, 2018. [Google Scholar]
- Cho, D.W. Relationship on the infiltration, natural ventilation and HVAC ventilation performance for indoor air quality. Archit. Inst. Korea 1999, 15, 201–208. [Google Scholar]
- Chun, C.-Y.; Kim, G.-T.; Kim, S.-D. A Study of Measurement on airtightness and Air-Flow performance of apartment housing adopting window frame-type natural ventilation. LHI J. Land Hous. Urban Aff. 2014, 5, 325–332. [Google Scholar] [CrossRef]
- Kang, J.-H.; Lee, S.J. Improvement of natural ventilation in a large factory building using a louver ventilator. Build. Environ. 2008, 43, 2132–2141. [Google Scholar] [CrossRef]
- Cheong, H.S.; Science Sharing Study Group. Design and Production of Small Wind Turbines; Iljinsa Blue Books: Seoul, Korea, 2011. [Google Scholar]
- Spera, D.A. Models of Lift and Drag Coefficients of Stalled and Uninstalled Airfoils in Wind Turbines and Wind Tunnels; NTRS NASA Technical Reports Server; NASA/CR-2008-215434; NASA: Washington, DC, USA, 2008. [Google Scholar]
- Silverstein, A. Scale Effect on Clark Y Airfoil Characteristics from NACA Full-Scale Wind-Tunnel Tests; NASA Technical Reports Server, NACA-TR-502; NASA: Washington, DC, USA, 1935. [Google Scholar]
- Theodore, T.; Clay, W.C. Ice Prevention on Aircraft by Means of Engine Exhaust Heat and a Technical Study of Heat Transmission from a Clark Y Airfoil; NASA Technical Reports Server, NACA-TR-403; NASA: Washington, DC, USA, 1933. [Google Scholar]
- Wenzinger, C.J.; Shortal, J.A. The Aerodynamic Characteristics of a Slotted Clark-Y Wing as Affected by the Auxiliary Airfoil Position; NASA Technical Reports Server, NACA Annual Report 17, NACA-TR-400; NASA: Washington, DC, USA, 1932. [Google Scholar]
- Doosan Corperation. Doopedia. “Windtower”. Available online: https://terms.naver.com/entry.nhn?docId=3588360&cid=40942&categoryId=32340 (accessed on 2 March 2020).
- Liu, S.; Mak, C.M.; Niu, J. Numerical evaluation of louver configuration and ventilation strategies for the windcatcher system. Build. Environ. 2011, 46, 1600–1616. [Google Scholar] [CrossRef]
- Chiang, C.M.; Chen, N.T.; Chou, P.C.; Li, Y.Y.; Lien, I.C. A study on the influence of horizontal louvers on natural ventilation in a dwelling unit. In Proceedings of the 10th International Conference on Indoor Air Quality and Climate 2005, Beijing, China, 4–9 September 2005. [Google Scholar]
- Park, B.; Lee, S. Investigation of the energy saving efficiency of a natural ventilation strategy in a multistory school building. Energies 2020, 13, 1746. [Google Scholar] [CrossRef] [Green Version]
- Bouchahm, Y.; Bourbia, F.; Belhamri, A. Performance analysis and improvement of the use of wind tower in hot dry climate. Renew. Energy 2011, 36, 898–906. [Google Scholar] [CrossRef]
- Hunt, H.H. Aerodynamics for Naval Aviators; Office of the Chief of Naval Operations, Aviation Training Division; U.S. Government Printing Office: Washington, DC, USA, 1960; pp. 21–22.
- Houghton, E.L.; Carpenter, P.W. Aerodynamics for Engineering Students, 5th ed.; Butterworth-Heinemann: Oxford, UK, 2003; ISBN 978-0-7506-5111-0. [Google Scholar]
- Phillips, W.F. Mechanics of Flight, 2nd ed.; Wiley & Sons: Hoboken, NJ, USA, 2010; ISBN 978-0-470-53975-0. [Google Scholar]
- Bertin, J.J.; Cummings, R.M. Aerodynamics for Engineers, 5th ed.; Pearson: London, UK, 2008; ISBN 978-0-13-227268-1. [Google Scholar]
- Boric, M. World Directory of Leisure Aviation; 2011/2012; EAA: Oshkosh, WI, USA, 2011. [Google Scholar]
- Beaumont, R.A. Airscrew. In Aeronautical Engineering; Odhams Press: London, UK, 1942. [Google Scholar]
- Haynes, L.R. Webmaster, SR-71 Blackbirds. In Clarence, L. “Kelly” Johnson Biography; Zenith Press: Minneapolis, MN, USA, 1990. [Google Scholar]
- Alexander, D.E. Nature’s Flyers: Birds, Insects, and the Biomechanics of Flight; The Johns Hopkins University Press: Baltimore, MD, USA, 2002; ISBN 0801880599. [Google Scholar]
- Hertel, H. Structure, Form, Movement; Reinhold Publishing Corporation: New York, NY, USA, 1966. [Google Scholar]
- Fish, F.E.; Howle, L.E.; Murray, M.M. Hydrodynamic flow control in marine mammals. Integr. Comp. Boil. 2008, 48, 788–800. [Google Scholar] [CrossRef] [PubMed] [Green Version]
- Rolls Royce (COR). The Jet Engine, 6th ed.; John Wiley & Sons Inc.: Hoboken, NJ, USA, 2005; ISBN 0902121235. [Google Scholar]
- Cleynen, O. Examples of Airfoils. Wikimedia Commons: 2011. Available online: https://en.wikipedia.org/wiki/Airfoil (accessed on 1 June 2020).
- Lefebvre, A.; Dano, B.; Bartow, W.B.; Fronzo, M.D.; Zha, G.C. Performance and energy expenditure of coflow jet airfoil with variation of mach number. J. Aircr. 2016, 53, 1757–1767. [Google Scholar] [CrossRef] [Green Version]
Figure 1.
Flow chart of the structure of the remainder of the paper.

Figure 2.
Basic concept of an airfoil [13].
Figure 2.
Basic concept of an airfoil [13].


Figure 4.
Operating principles of the CFJ Airfoil [30].
Figure 4.
Operating principles of the CFJ Airfoil [30].

Figure 5.
Cross-section, lift, and drag coefficients of a Clark Y airfoil (a) Cross section of Clark-Y, (b) Clark-Y lift and drag coefficient [12].
Figure 5.
Cross-section, lift, and drag coefficients of a Clark Y airfoil (a) Cross section of Clark-Y, (b) Clark-Y lift and drag coefficient [12].

Figure 6.
Window modeling for simulation analysis.

Figure 7.
Modeling of the installation angle setting applied to simulation.

Figure 8.
Diagrams showing the angles used in the simulation. (a) 0°, (b) 1°, (c) 2°, (d) 4°, (e) 8°.
Figure 8.
Diagrams showing the angles used in the simulation. (a) 0°, (b) 1°, (c) 2°, (d) 4°, (e) 8°.

Figure 9.
Clark Y airfoil windcatcher: (a) cross section, (b) overall shape of the windcatcher, and (c) pressure distribution.
Figure 9.
Clark Y airfoil windcatcher: (a) cross section, (b) overall shape of the windcatcher, and (c) pressure distribution.

Figure 10.
Internal shape of the airfoil and the corresponding air flow patterns. (a) Overview of airflow, (b) Airflow inside the louver, (c) Airflow on the louver surface.
Figure 10.
Internal shape of the airfoil and the corresponding air flow patterns. (a) Overview of airflow, (b) Airflow inside the louver, (c) Airflow on the louver surface.

Figure 11.
Plan and perspective view of the mock-up rooms. (a) mock-up plan view, (b) louver application location.
Figure 11.
Plan and perspective view of the mock-up rooms. (a) mock-up plan view, (b) louver application location.

Figure 12.
Setup of the mock-up experiment. (a) measuring device, (b) louver application.

Figure 13.
Result of the installation angle setting simulation. (a) Base model, (b) Louver installed at 90°, (c) Louver installed at 45°.
Figure 13.
Result of the installation angle setting simulation. (a) Base model, (b) Louver installed at 90°, (c) Louver installed at 45°.

Figure 14.
Wind speed change result. (a) 3.6m/s west wind (b) 0.3m/s west wind.

Figure 15.
Analysis of the pressure distribution for different angles.


Figure 16.
Results of Experiment 1.

Figure 17.
Results of Experiment 2.

Figure 18.
Results of Experiment 3.

Figure 19.
Results of Experiment 4.

Figure 20.
Comparison of the ventilation performance for different configurations of windcatcher louver.
Figure 20.
Comparison of the ventilation performance for different configurations of windcatcher louver.


Table 1.
Data describing a Clark Y airfoil [12].
Table 1.
Data describing a Clark Y airfoil [12].
| X [%] | Y [%] | |
|---|---|---|
| Upper | Bottom | |
| 0.00 | 3.50 | 3.50 |
| 1.25 | 5.45 | 1.93 |
| 2.50 | 6.50 | 1.47 |
| 5.00 | 7.90 | 0.93 |
| 7.50 | 8.85 | 0.63 |
| 10.00 | 9.60 | 0.42 |
| 15.00 | 10.68 | 0.15 |
| 20.00 | 11.36 | 0.00 |
| 30.00 | 11.70 | 0.00 |
| 40.00 | 11.40 | 0.00 |
| 50.00 | 10.52 | 0.00 |
| 60.00 | 9.15 | 0.00 |
| 70.00 | 7.35 | 0.00 |
| 80.00 | 5.22 | 0.00 |
| 90.00 | 2.80 | 0.00 |
| 95.00 | 1.49 | 0.00 |
| 100.00 | 0.12 | 0.00 |
Table 2.
Simulation design.
| Item | Settings | |
|---|---|---|
| Space | Three Dimensional | |
| Mesh | Polyhedral Mesh | |
| Mesh Size | Base size | 0.01 m |
| Target size | 50% (0.005 m) | |
| Time | Analysis of windcatcher louver by angle | Steady |
| Fluid state | Air | |
| Flow | Segregated Flow | |
| Viscosity | Turbulent | |
| Reynolds-turbulent flow | Horizontal louver: K-epsilon Turbulence | |
| Vertical louver: K-omega Turbulence | ||
Table 3.
Mesh validation diagnostic result.
| Face Validity | |
|---|---|
| 0.80 <=, < 0.90 | 0.03% |
| 0.90 <=, < 0.95 | 0.021% |
| 0.95 <=, < 1.00 | 0.036% |
| 1.00 | 99.913% |
Table 4.
Specifications of the mock-up rooms.
| Parameter | Contents | |
|---|---|---|
| Height | 2.5 m | |
| Number of Floors | 1st floor | |
| Building Direction | facing south | |
| Floor Height | 2.4 m | |
| Floor Area (12.5 m2) | Room 1 | 6.25 m2 |
| Room 2 | 6.25 m2 | |
| Envelope of Roof | Room 1 | no airfoil present |
| Room 2 | airfoil present | |
Table 5.
Experimental method and location of the windcatcher.
| Experiment Number | Room Number | Windcatcher Louver | Wind Flow |
|---|---|---|---|
| Wind Direction | |||
| 1 | 1 | not present | 3.5 m/s |
| 0° | |||
| 2 | 3.5 m/s | ||
| 90° | |||
| 3 | 2 | present | 3.5 m/s |
| 0° | |||
| 4 | 3.5 m/s | ||
| 90° |
Table 6.
Specifications of the measurement equipment used in the tests.
| Measurement Item | Particulate Meter Measurement Instrument | Thermo-Hygrometer | Airflow Measurement Instrument | ||||
|---|---|---|---|---|---|---|---|
| Name of the Equipment | TSI DUSTTRAK 8530 | SATO SK-L200T | KIMO AMI310, SOM900 | ||||
| Measuring instrument specification | Range | Concentration (mg/m3) | 0.001–400 | Temperature (°C) | −15–65 | Temperature (°C) | 20–80 |
| Particle Size (μm) | 0.1–10 | Humidity (%RH) | 10–99.9 | Humidity (%RH) | 0–100% RH | ||
| Wind Speed (m/s) | 0.00–5.00 | ||||||
| Accuracy | ±0.5% of factory set point internal flow controlled (Flow Accuracy) | Temperature (°C) | 0.1 °C at −9.9 to 65.0 °C, 1 °C at −10 °C or less | Temperature (°C) | ±3% of the leading value ±0.25°C | ||
| Humidity (%RH) | ±1.8%RH | ||||||
| Humidity (%RH) | 0.1% RH at 15.0 to 99.0% RH, 1% RH at less than 15.0% | Wind Speed (m/s) | ±3% of the leading value ±0.05 m/s | ||||
Table 7.
Summary of the experimental results.
| Windcatcher | Wind Incidence Angle | Time | Concentration of PM10 | Particle Matter Reduction Time | |
|---|---|---|---|---|---|
| Expt. 1 | unapplied | 0° | 19:38:39 | 1001 μg/m3 | 6 min (360 s) |
| 19:44:39 | 29.9 μg/m3 | ||||
| Expt. 2 | unapplied | 90° | 23:20:16 | 1007.3 μg/m3 | 5 min 20 s (320 s) |
| 23:25:36 | 30 μg/m3 | ||||
| Expt. 3 | applied | 0° | 18:32:39 | 999.9 μg/m3 | 5 min (300 s) |
| 18:37:39 | 30.5 μg/m3 | ||||
| Expt. 4 | applied | 90° | 20:56:16 | 1003 μg/m3 | 3 min 20 s (200 s) |
| 20:59:36 | 29.5 μg/m3 |
Table 8.
Effects of the incidence angle of the wind for different louver configurations.
| Experiment Number | Windcatcher | Wind Incidence Angle | Particle Matter Reduction Time | Time Difference to Reduce Particle Matter |
|---|---|---|---|---|
| 1 | Unapplied | 0° | 6 min (360 s) | 40 s |
| 2 | 90° | 5 min 20 s (320 s) | ||
| 3 | Applied | 0° | 5 min (300 s) | 100 s |
| 4 | 90° | 3 min 20 s (200 s) |
Table 9.
Particulate matter reduction with or without a windcatcher louver.
| Windcatcher Louver | Experiment Number | Wind Incidence Angle | Particle Matter Reduction Time | Time Difference to Reduce Particle Matter |
|---|---|---|---|---|
| unapplied | Expt. 2 | 90° | 5 min 20 s (320 s) | 2 min (120 s) |
| applied | Expt. 4 | 90° | 3 min 20 s (200 s) |
© 2020 by the authors. Licensee MDPI, Basel, Switzerland. This article is an open access article distributed under the terms and conditions of the Creative Commons Attribution (CC BY) license (http://creativecommons.org/licenses/by/4.0/).
Share and Cite
MDPI and ACS Style
Yang, Y.K.; Kim, M.Y.; Song, Y.W.; Choi, S.H.; Park, J.C. Windcatcher Louvers to Improve Ventilation Efficiency. Energies 2020, 13, 4459. https://0-doi-org.brum.beds.ac.uk/10.3390/en13174459
AMA Style
Yang YK, Kim MY, Song YW, Choi SH, Park JC. Windcatcher Louvers to Improve Ventilation Efficiency. Energies. 2020; 13(17):4459. https://0-doi-org.brum.beds.ac.uk/10.3390/en13174459
Chicago/Turabian StyleYang, Young Kwon, Min Young Kim, Yong Woo Song, Sung Ho Choi, and Jin Chul Park. 2020. "Windcatcher Louvers to Improve Ventilation Efficiency" Energies 13, no. 17: 4459. https://0-doi-org.brum.beds.ac.uk/10.3390/en13174459
Note that from the first issue of 2016, this journal uses article numbers instead of page numbers. See further details here.