A Theory for Power Extraction from Passive Accelerators and Confined Flows


1
Design and Engineering, GenH Inc., Charlestown, MA 02129, USA
2
Department of Naval Architecture and Marine Engineering, University of Michigan, Ann Arbor, MI 48109, USA
*
Author to whom correspondence should be addressed.
Energies 2020, 13(18), 4854; https://0-doi-org.brum.beds.ac.uk/10.3390/en13184854
Submission received: 24 July 2020
/
Revised: 11 September 2020
/
Accepted: 14 September 2020
/
Published: 16 September 2020
(This article belongs to the Special Issue Engineering Fluid Dynamics 2019-2020)
Abstract
:No accepted fluid theory exists for power extraction from unpressurized confined flow. The absence of a valid model to determine baseline uniform power extraction in confined flows creates difficulties in characterizing the coefficient of power. Currently, the primary body of research has been limited to Diffuser Augmented Wind Turbines (DAWTs) and passive fluid accelerators. Fluid power is proportional to the cube of velocity; therefore, passive acceleration is a promising path to effective renewable energy. Hypothetical models and experiments for passive accelerators yield low ideal power limits and poor performance, respectively. We show that these results derive from the misapplication of Betz’s Law and lack of a general theory for confined flow extraction. Experimental performance is due to the low efficiency of DAWTs and prior hypotheses exhibit high predictive error and continuity violations. A fluid model that accurately predicts available data and new experimental data, showing disk specific maximum CP for the confined channel at 38% of power available to disk, is presented. This is significantly lower than the 59% Betz freestream limit yielded by hypothetical models when the area ratio equals one. Experiments and their results are presented with non-DAWT accelerators, where new experimental results exceed CP limits predicted previously and correlate with the proposed predictive model.
1. Introduction
Power extraction from passive acceleration has been actively studied since the 1950’s. Passive accelerators are placed in fluid flows, such as wind or hydro currents, to accelerate fluid velocity and can increase the energy density and availability [1] of the resource. Passive accelerators operate in the unpressurized confined flow regime and constitute the primary body of research for unpressurized confined flow. The unpressurized confined flow regime presents a complex fluid mechanics problem for which there is no valid theory that accurately predicts power extraction. Power extraction from confined flows is becoming a subject of importance to the energy landscape and climate mitigation. A valid theory for power extraction from the confined flow is necessary to quantify, develop, and utilize these resources and technologies.
Research into wind and hydro current passive acceleration provides a unique body of experimental work for the development of a theory of power extraction from confined flows. Passive wind and current accelerators are confined systems open to the freestream with no addition of energy to the flow from gravity or a combustion or vacuum chamber. Passive accelerators exhibit the fundamental properties of confined flow power extraction, absent the further complexities introduced in pressurized systems. Accurate theoretical prediction of the experimental performance of wind and current accelerators is the first step in developing a theory of power extraction from confined flows. This paper is concerned with developing a valid theoretical framework for the unpressurized or baseline confined condition.
Renewable Energy (RE) generation from solar or standard wind has low power density per m2, as defined and detailed by V. Smil [2]. RE’s power density has likely restrained its impact on Green House Gas emissions and climate change due to the inability to supply significant power at load centers [3], remote viable resources [4], and low availability over most of the globe [5]. The largest energy market share growth since 2000 has been in coal and natural gas, not RE [6,7,8]. Acceleration could help change that. Improved passive acceleration and extraction could significantly increase RE’s capability to offset fossil fuels using accelerated wind and hydrodynamic power generation within urban environments. A complete theory of extraction from accelerated flows is necessary to determine the potential importance of acceleration to the energy landscape and in combatting climate change.
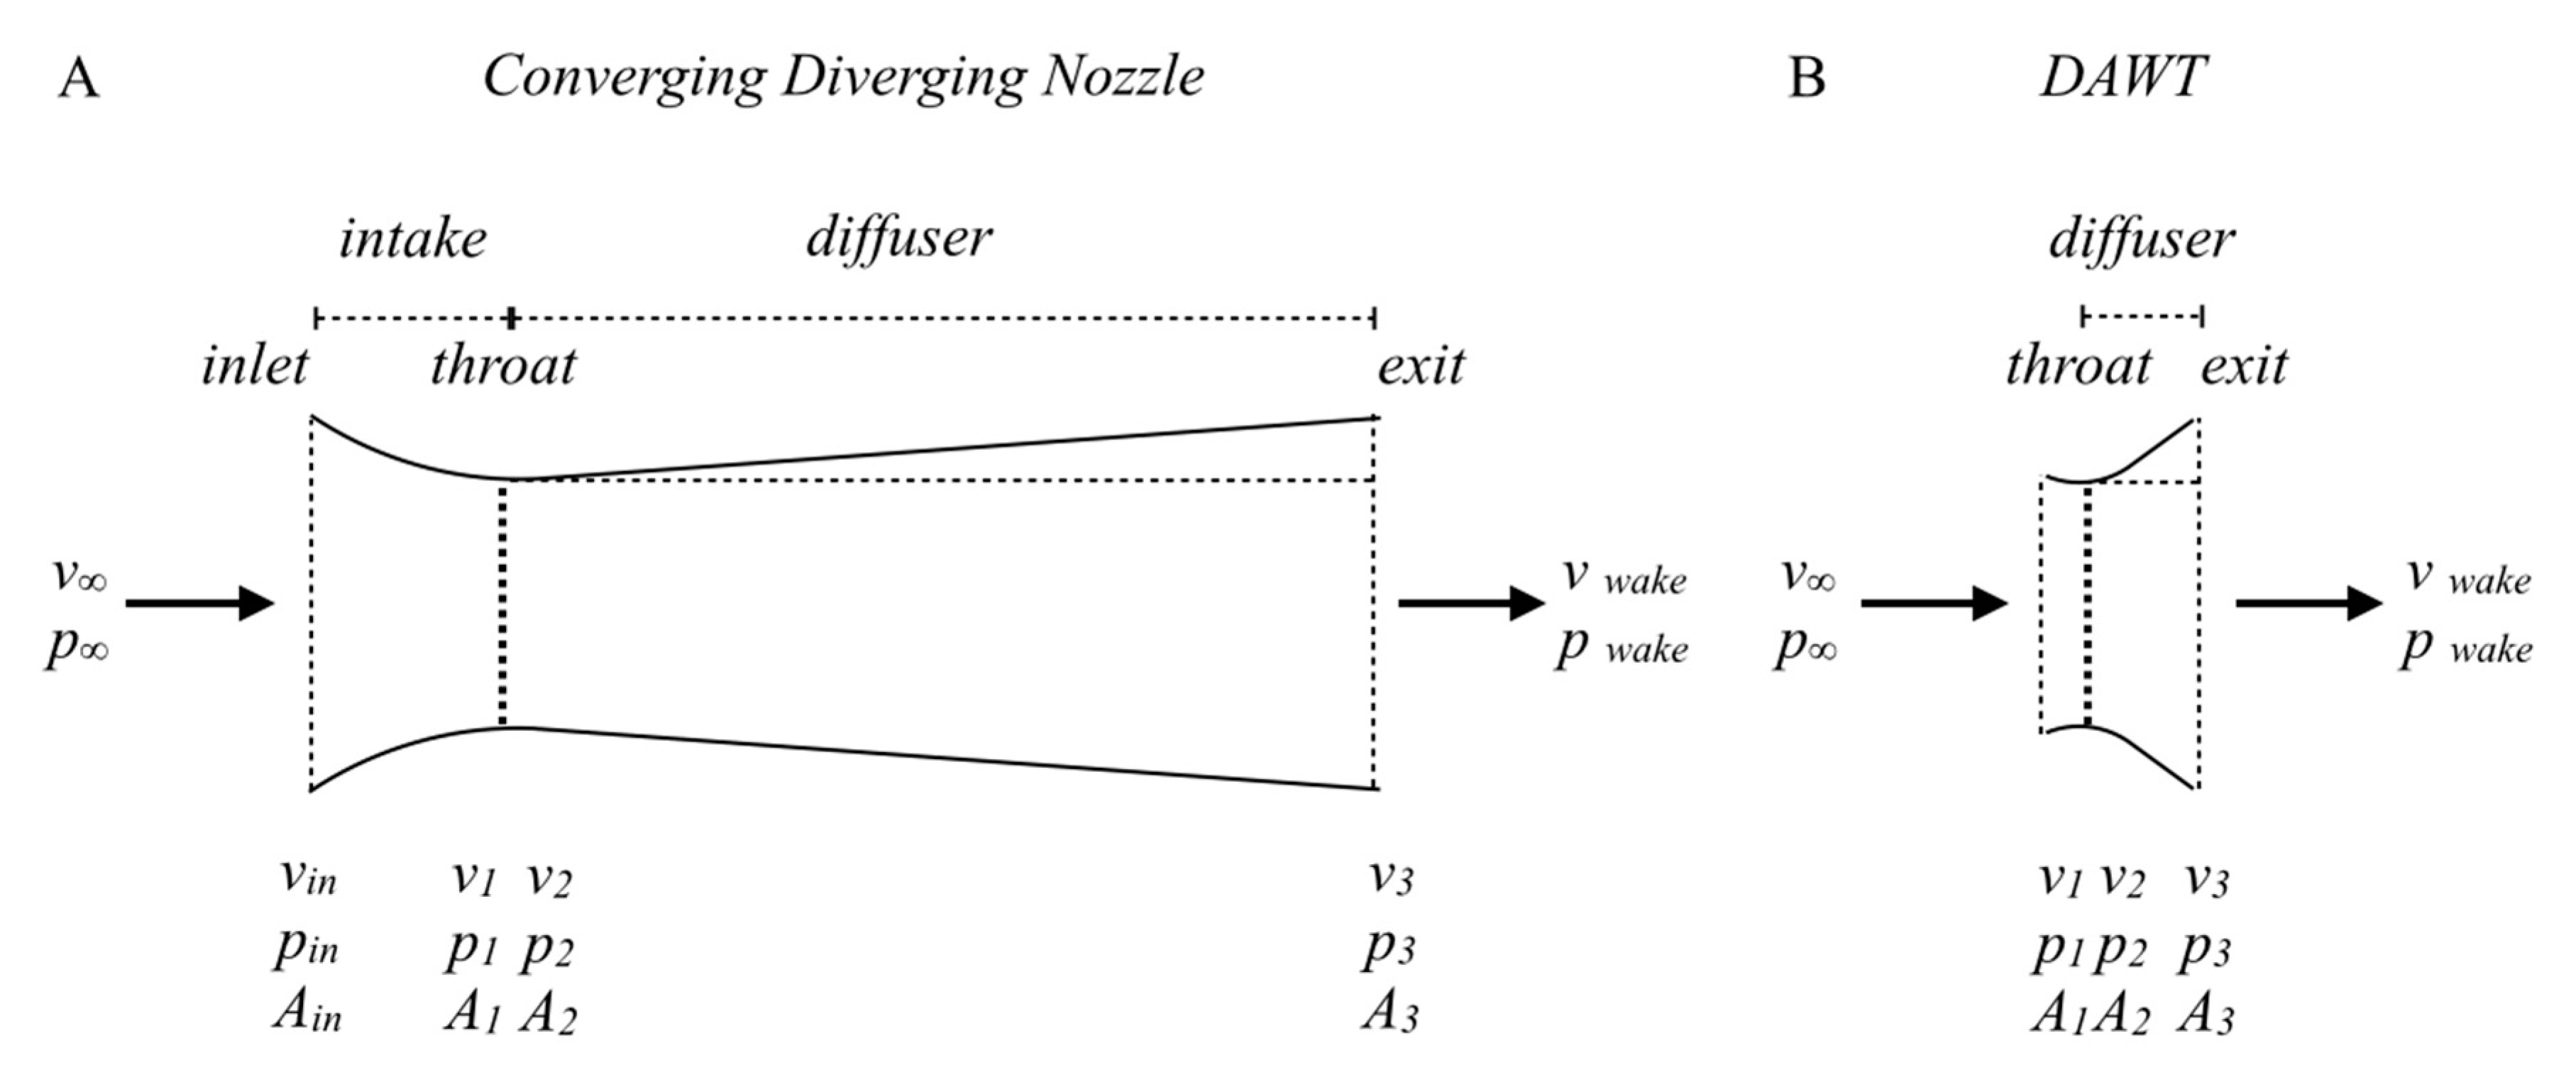
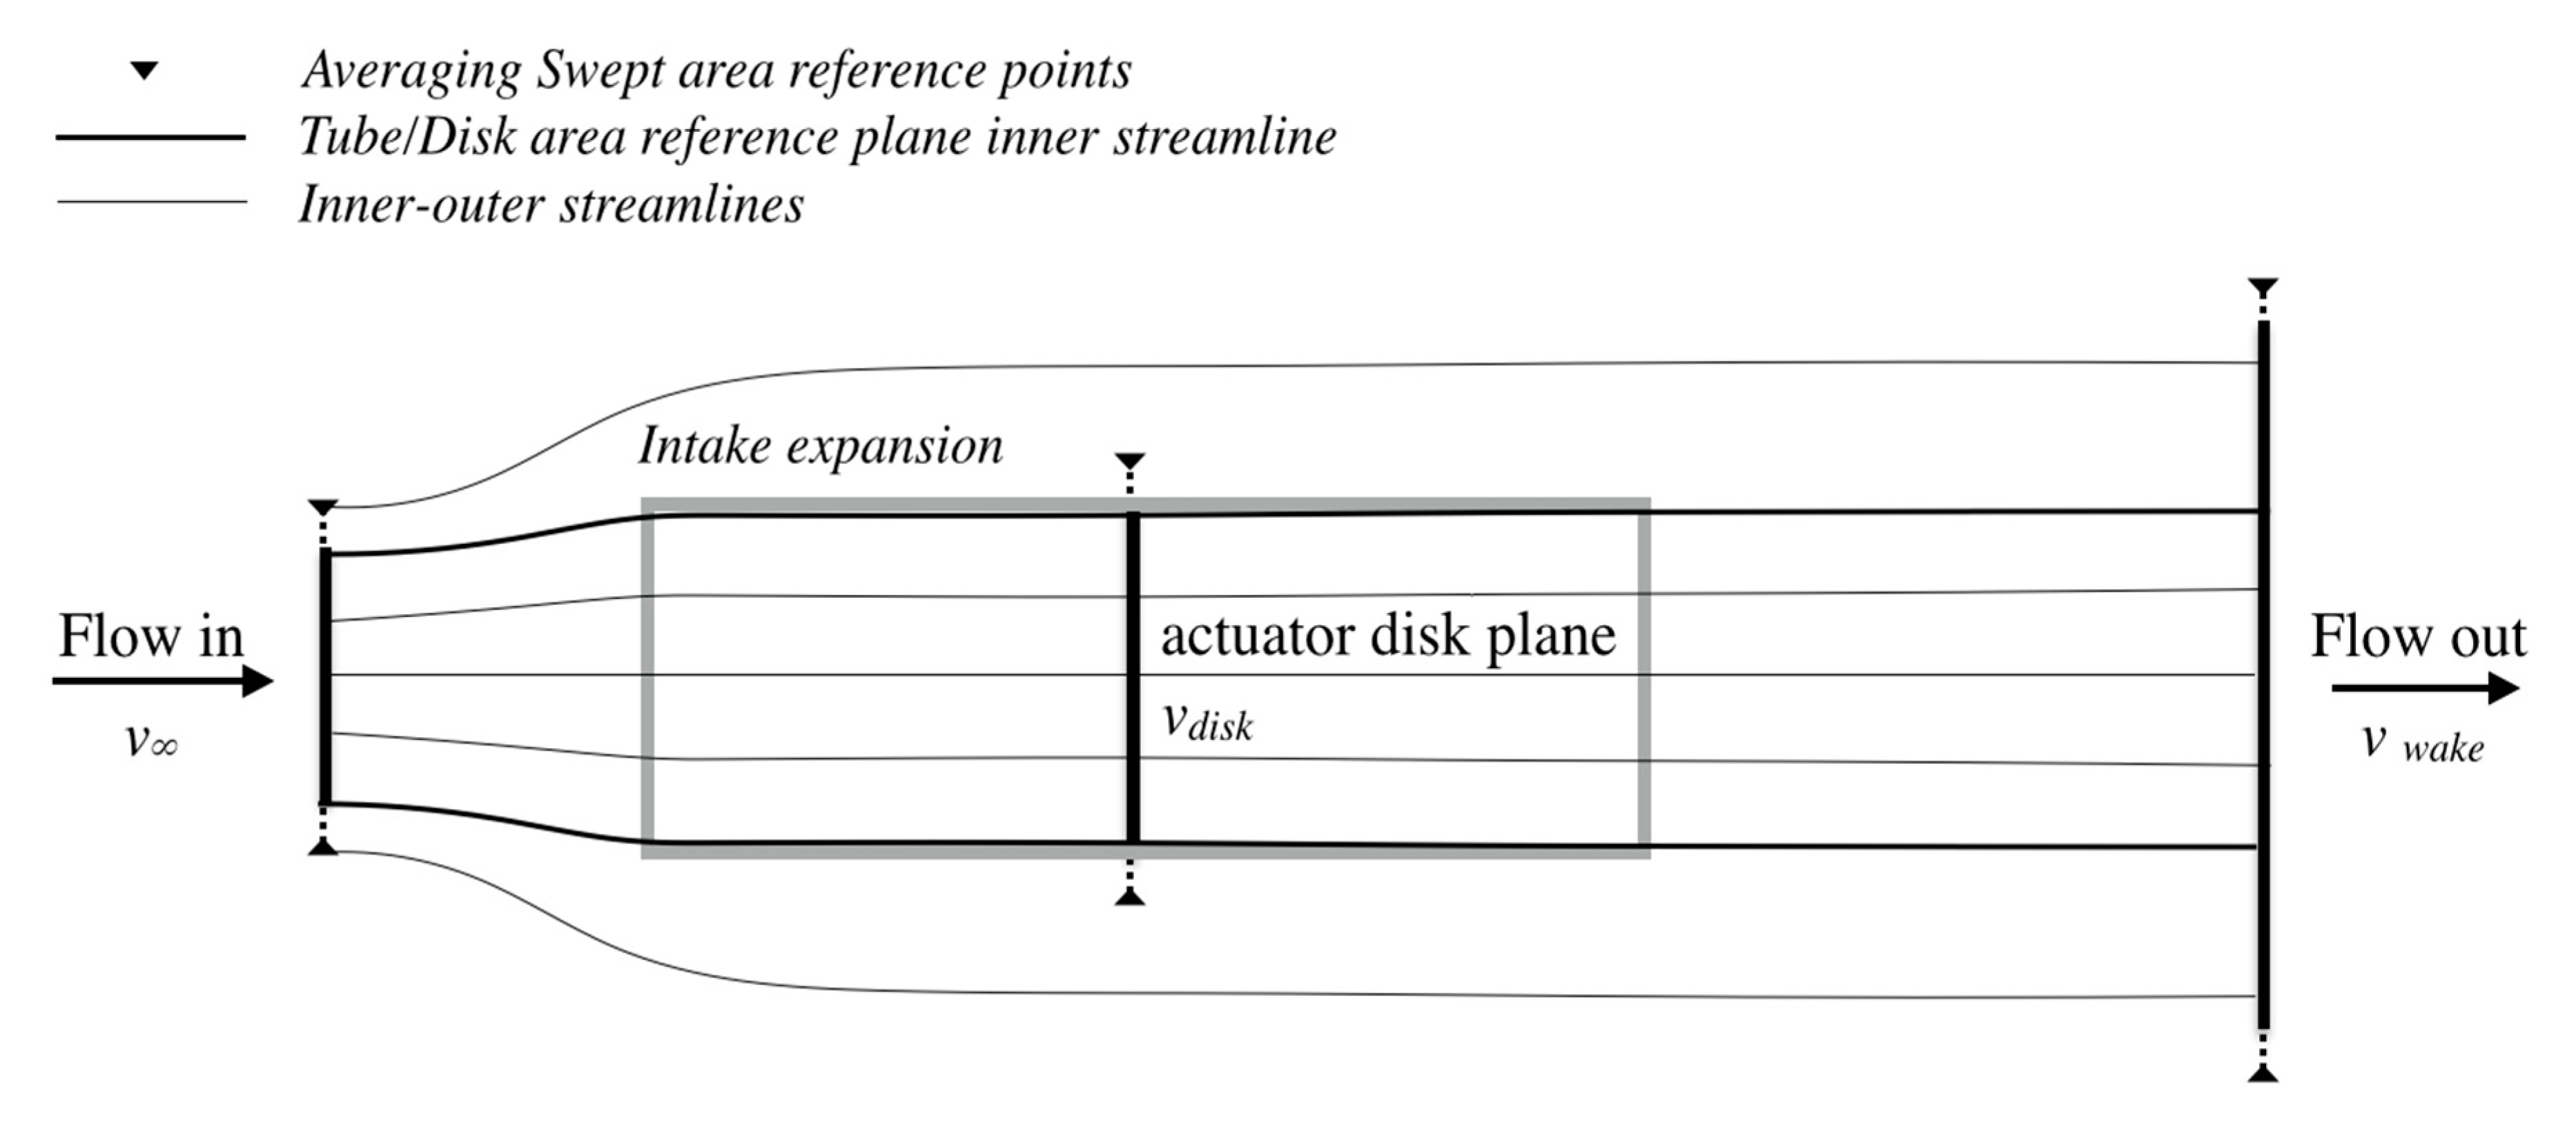
Passive accelerator flow is the flow is diagrammed in Figure 1. Continuity must be satisfied between the inlet and exit, making accelerators difficult to analyze with free stream theories that require unconfined expansion. Betz’s Law establishes the limit for free stream turbines [9]. Hypothetical models presented by van Bussel [10], Jamieson [11], and Werle and Presz (WP) [12] referred to subsequently as Averaging Models (AMs), have attempted to use Betz’s Law to establish ideal accelerator power limits. The AM’s have sought to validate ideal models with experimental data from Diffuser Augmented Wind Turbines (DAWTs). DAWTs are characterized by short, high-angle diffusers, and are inefficient accelerators [13,14]. AMs predict that accelerators in ideal flow have a Coefficient of Power (CP) limit that is the same as a normal wind turbine of the accelerator’s maximum frontal area.
A hypothesis, referred to as the Thrust Model, was derived by Knight et al. [15]. This paper provides a detailed mathematical analysis of the preceding AMs and the Thrust model, which was specifically developed for the analysis of power extraction from confined flows, uses accelerator performance and actuator disk body forces to predict CP performance. We show that AM’s misapply Betz’s methods by using Betz’s velocity averaging without satisfying the necessary assumptions. AMs rely exclusively upon velocity averaging to determine actuator disk conditions, which results in a significant error in the prediction of component variables, CP results, and violations of continuity.
We show that the Thrust Model is related to Rankine–Froude’s Momentum and Actuator Disk Theory [16] and thereby Betz’s Law [9] with additional constraints. When related to the Coefficient of Thrust (CT) and the area ratio between the throat and maximum area is set to one, Rankine–Froude momentum theory’s wake velocity equation is the same as the Thrust Model’s disk velocity equation. This illustrates the relationship between the Thrust and Rankine–Froude Momentum theory and the additional continuity constraints in the Thrust Model. The Thrust Model and AMs’ predictions are compared to experimental data to determine predictive accuracy. New experimental evidence is presented that exceeds the limits predicted by AMs. The Thrust Model accurately predicts all experimental data and indicates significantly higher performance and CP limits for accelerators than AM limits. All performance and limits herein are related to the power available at the accelerator’s maximum area at freestream velocity (P = 0.5ρAmaxv∞3).
A Brief History of Accelerators
Interest in accelerators is due to the fact that fluid power increases as the cube of velocity. If one can passively increase the velocity one should be able to extract more power from the flow. This conclusion, based on the standard velocity form of the fluid power equation, has always been at odds with certain assumptions in fluid dynamics. Some suggest that an accelerator cannot extract more power than a free stream turbine of the accelerator’s maximum area. Others have suggested this limit could be exceeded under certain conditions which will be examined in the technical analysis in Appendix A. Theorists have formulated hypotheses showing the limit of the maximum area and some have provided potential mechanisms to exceed that limit. Prior research has been unsuccessful in showing that accelerators can increase the power extractable from a fluid related to an equivalent freestream turbine of the accelerator’s maximum area. However, this research has been restricted to a single type of accelerator, the Diffuser Augmented Wind Turbine (DAWT). Theories to date have relied strictly on data from this single accelerator type. Theorists such as van Bussel, Jamieson, and WP have used this data to validate ideal theories and limits for accelerators. Problematically DAWT’s are not ideal accelerators.
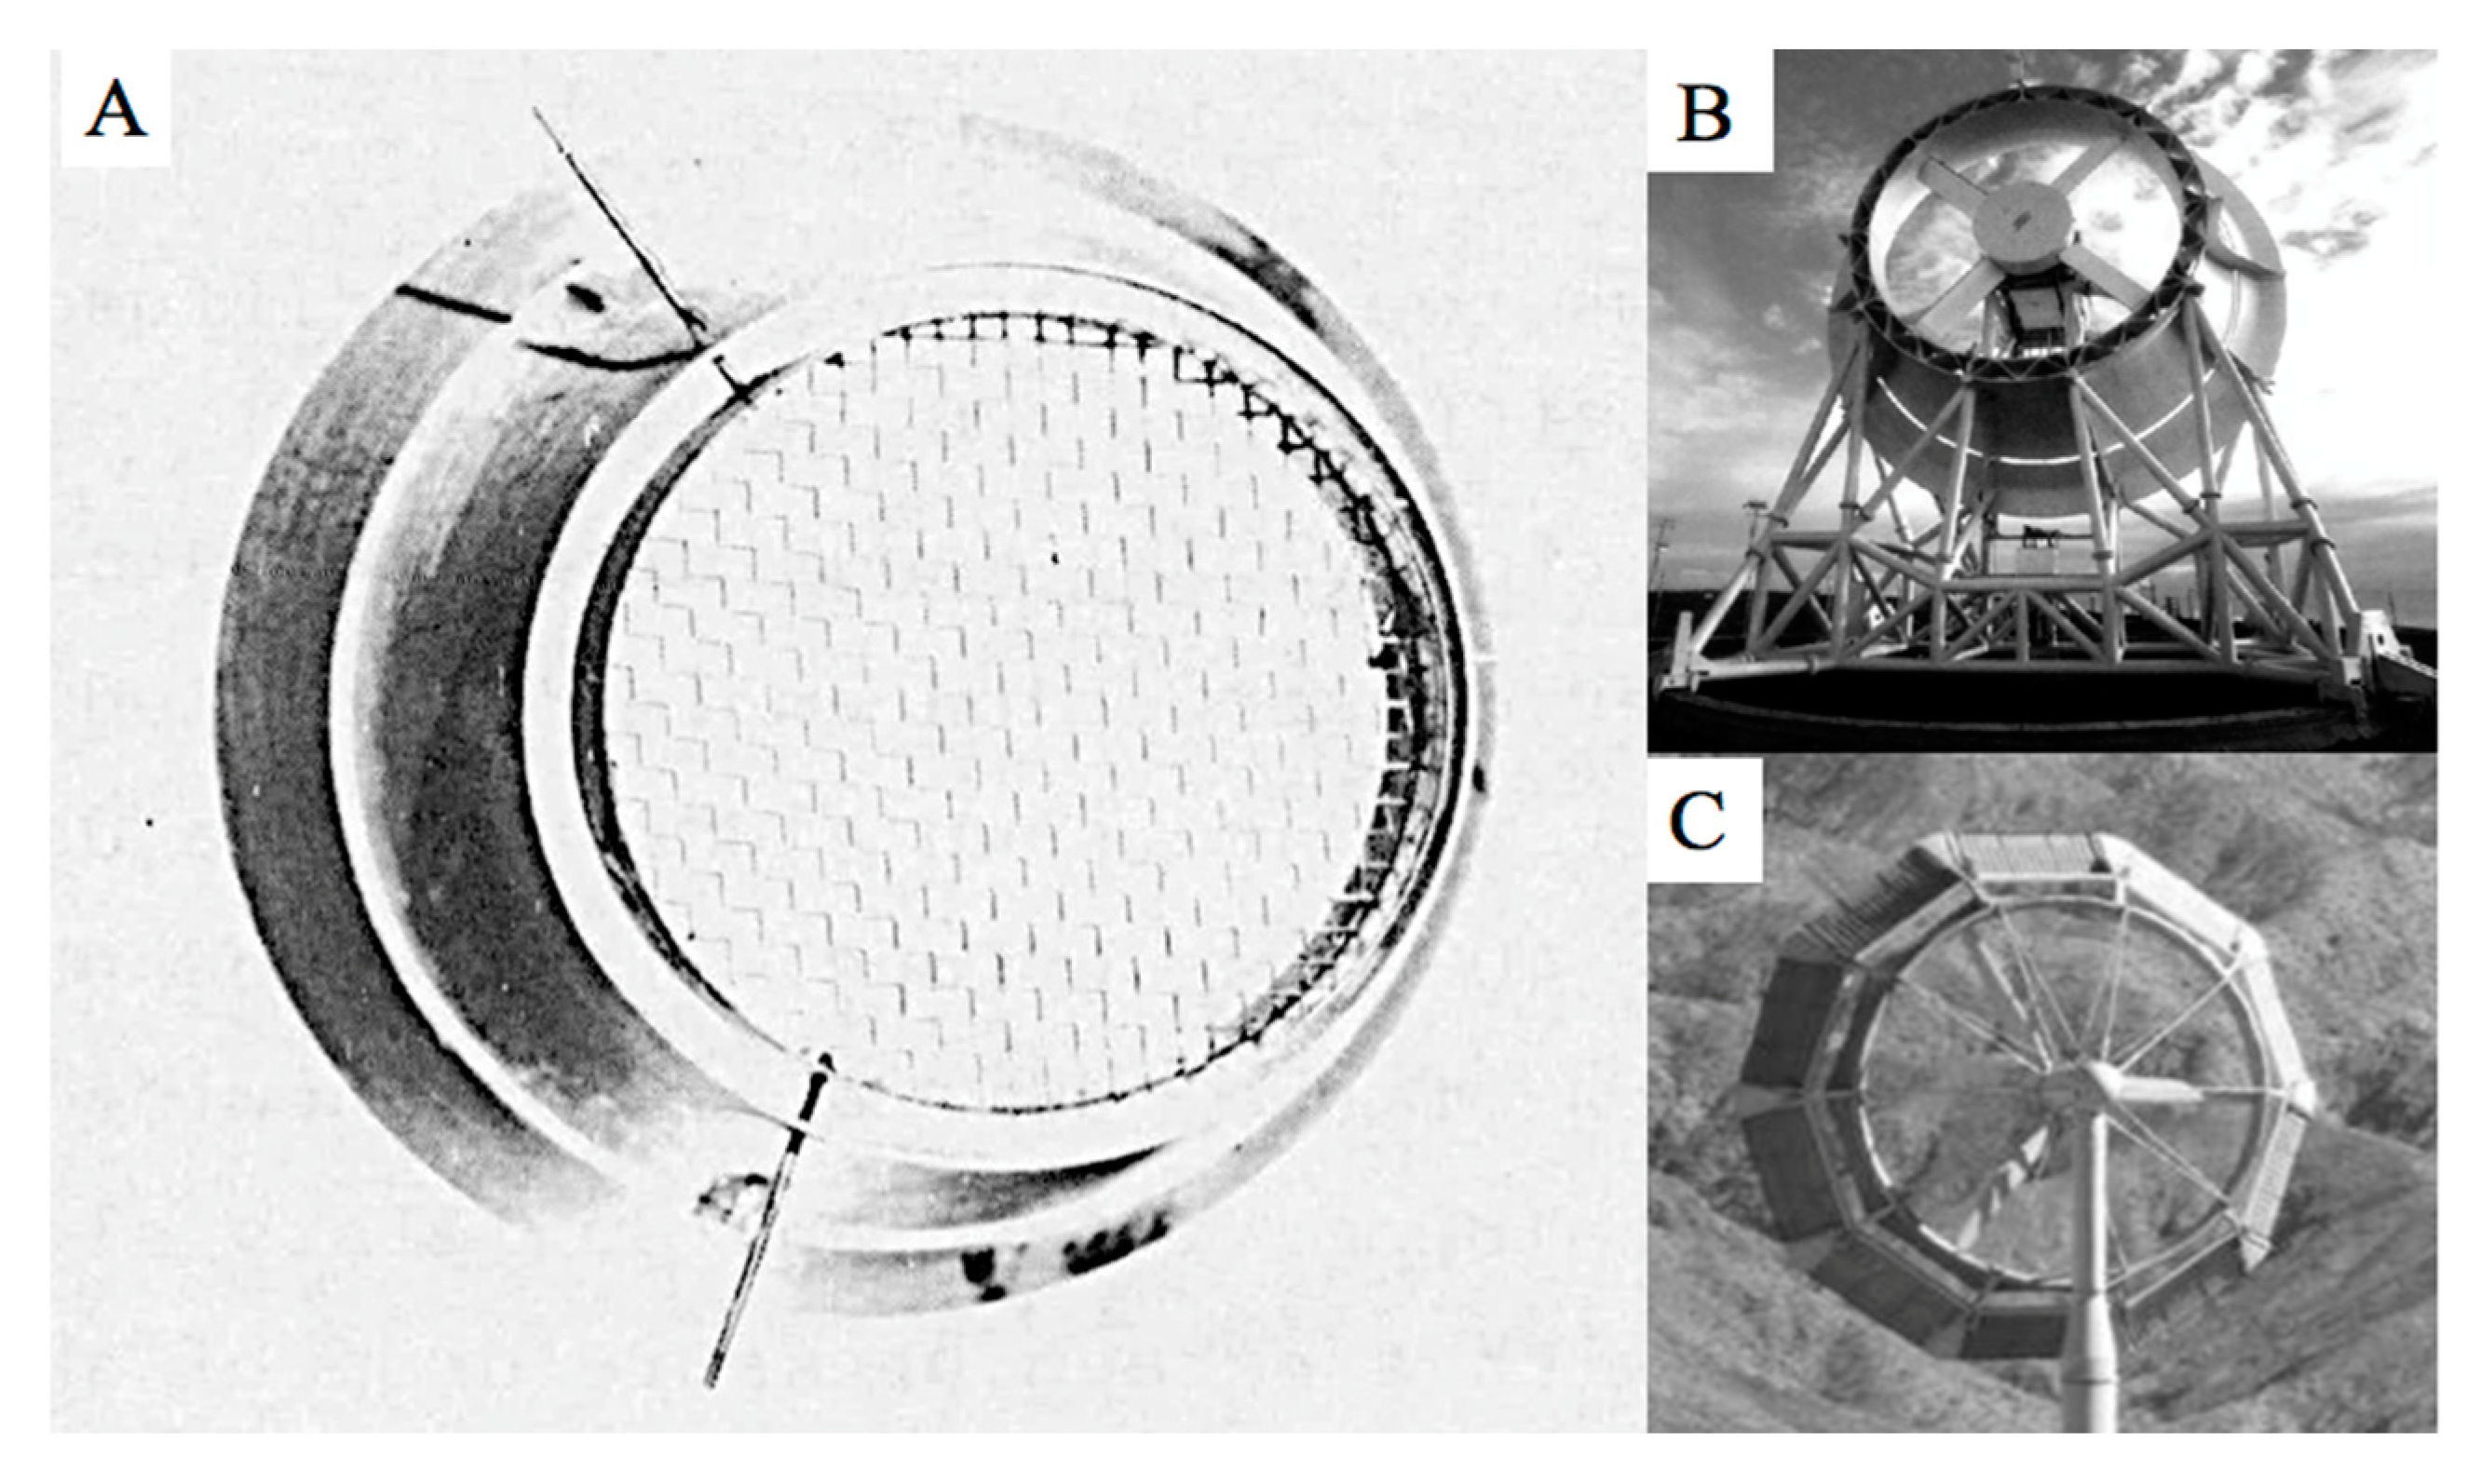
DAWT’s have been researched in the field and wind tunnels since the 1970’s. Initial research was performed by Igra of Ben Gurion University in Israel [13]. Igra was the first scientist to design a DAWT. The design drivers for Igra’s DAWT were to reduce both the accelerator material costs and the swept area occupied by the machine under rotation for different incoming flow directions. With single accelerators under rotation, unless the diffuser length from the point of rotation is less than or equal to the radius of the exit, the effective free stream wind turbine that the accelerator has to outperform is significantly larger than just the maximum frontal area of the accelerator. Research was continued by a team from Grumman Aerospace led by K. Foreman [17]. The Grumman team’s work, which culminated in the Vortec 7 [18] in early 2000, constitutes one of the more complete bodies of experimental data. Work was done with both screens and rotors which makes the research particularly useful for deriving limits for accelerators based on Rankine–Froude’s actuator disk theory. Figure 2A shows the Grumman device [17] from 1979 that has provided the data for predictive comparisons in this and other papers. Figure 2B,C show the Vortec 7 (B) [18] from 2000 and Flodesign/Ogin (C) [19] from 2015. Historically, high expansion angle diffusers with either a single annulus or a double annulus have characterized DAWTs. Phillips [13] and Wind Lens [20] added a brim at the exit of the diffuser. Using the unsteady effects caused by the brim, the Wind Lens DAWT is the most efficient, with a frontal area CP of 0.54 [20].
DAWT design has generally failed to achieve the two design goals of its creator Igra [21]. While the shorter diffuser uses less material, the diffuser also experiences significantly higher drag than a freestream turbine which in turn increases structural costs. DAWTs require greater power production to achieve a reduction in the freestream wind turbine Levelized Cost of Electricity. While the DAWT solves the rotational issue, high-expansion angle diffusers perform poorly on an accelerative basis, effectively negating the benefit. Reid’s National Advisory Committee for Aeronautics (NACA) work from 1951 [22] clearly shows the reduction in diffuser efficiency that accompanies an increased diffuser expansion angle. Foreman specifically mentions the tradeoff between cost reduction and acceleration [17]. The loss of accelerative efficiency is particularly problematic when DAWTs are used to validate hypothetical limits for accelerators.
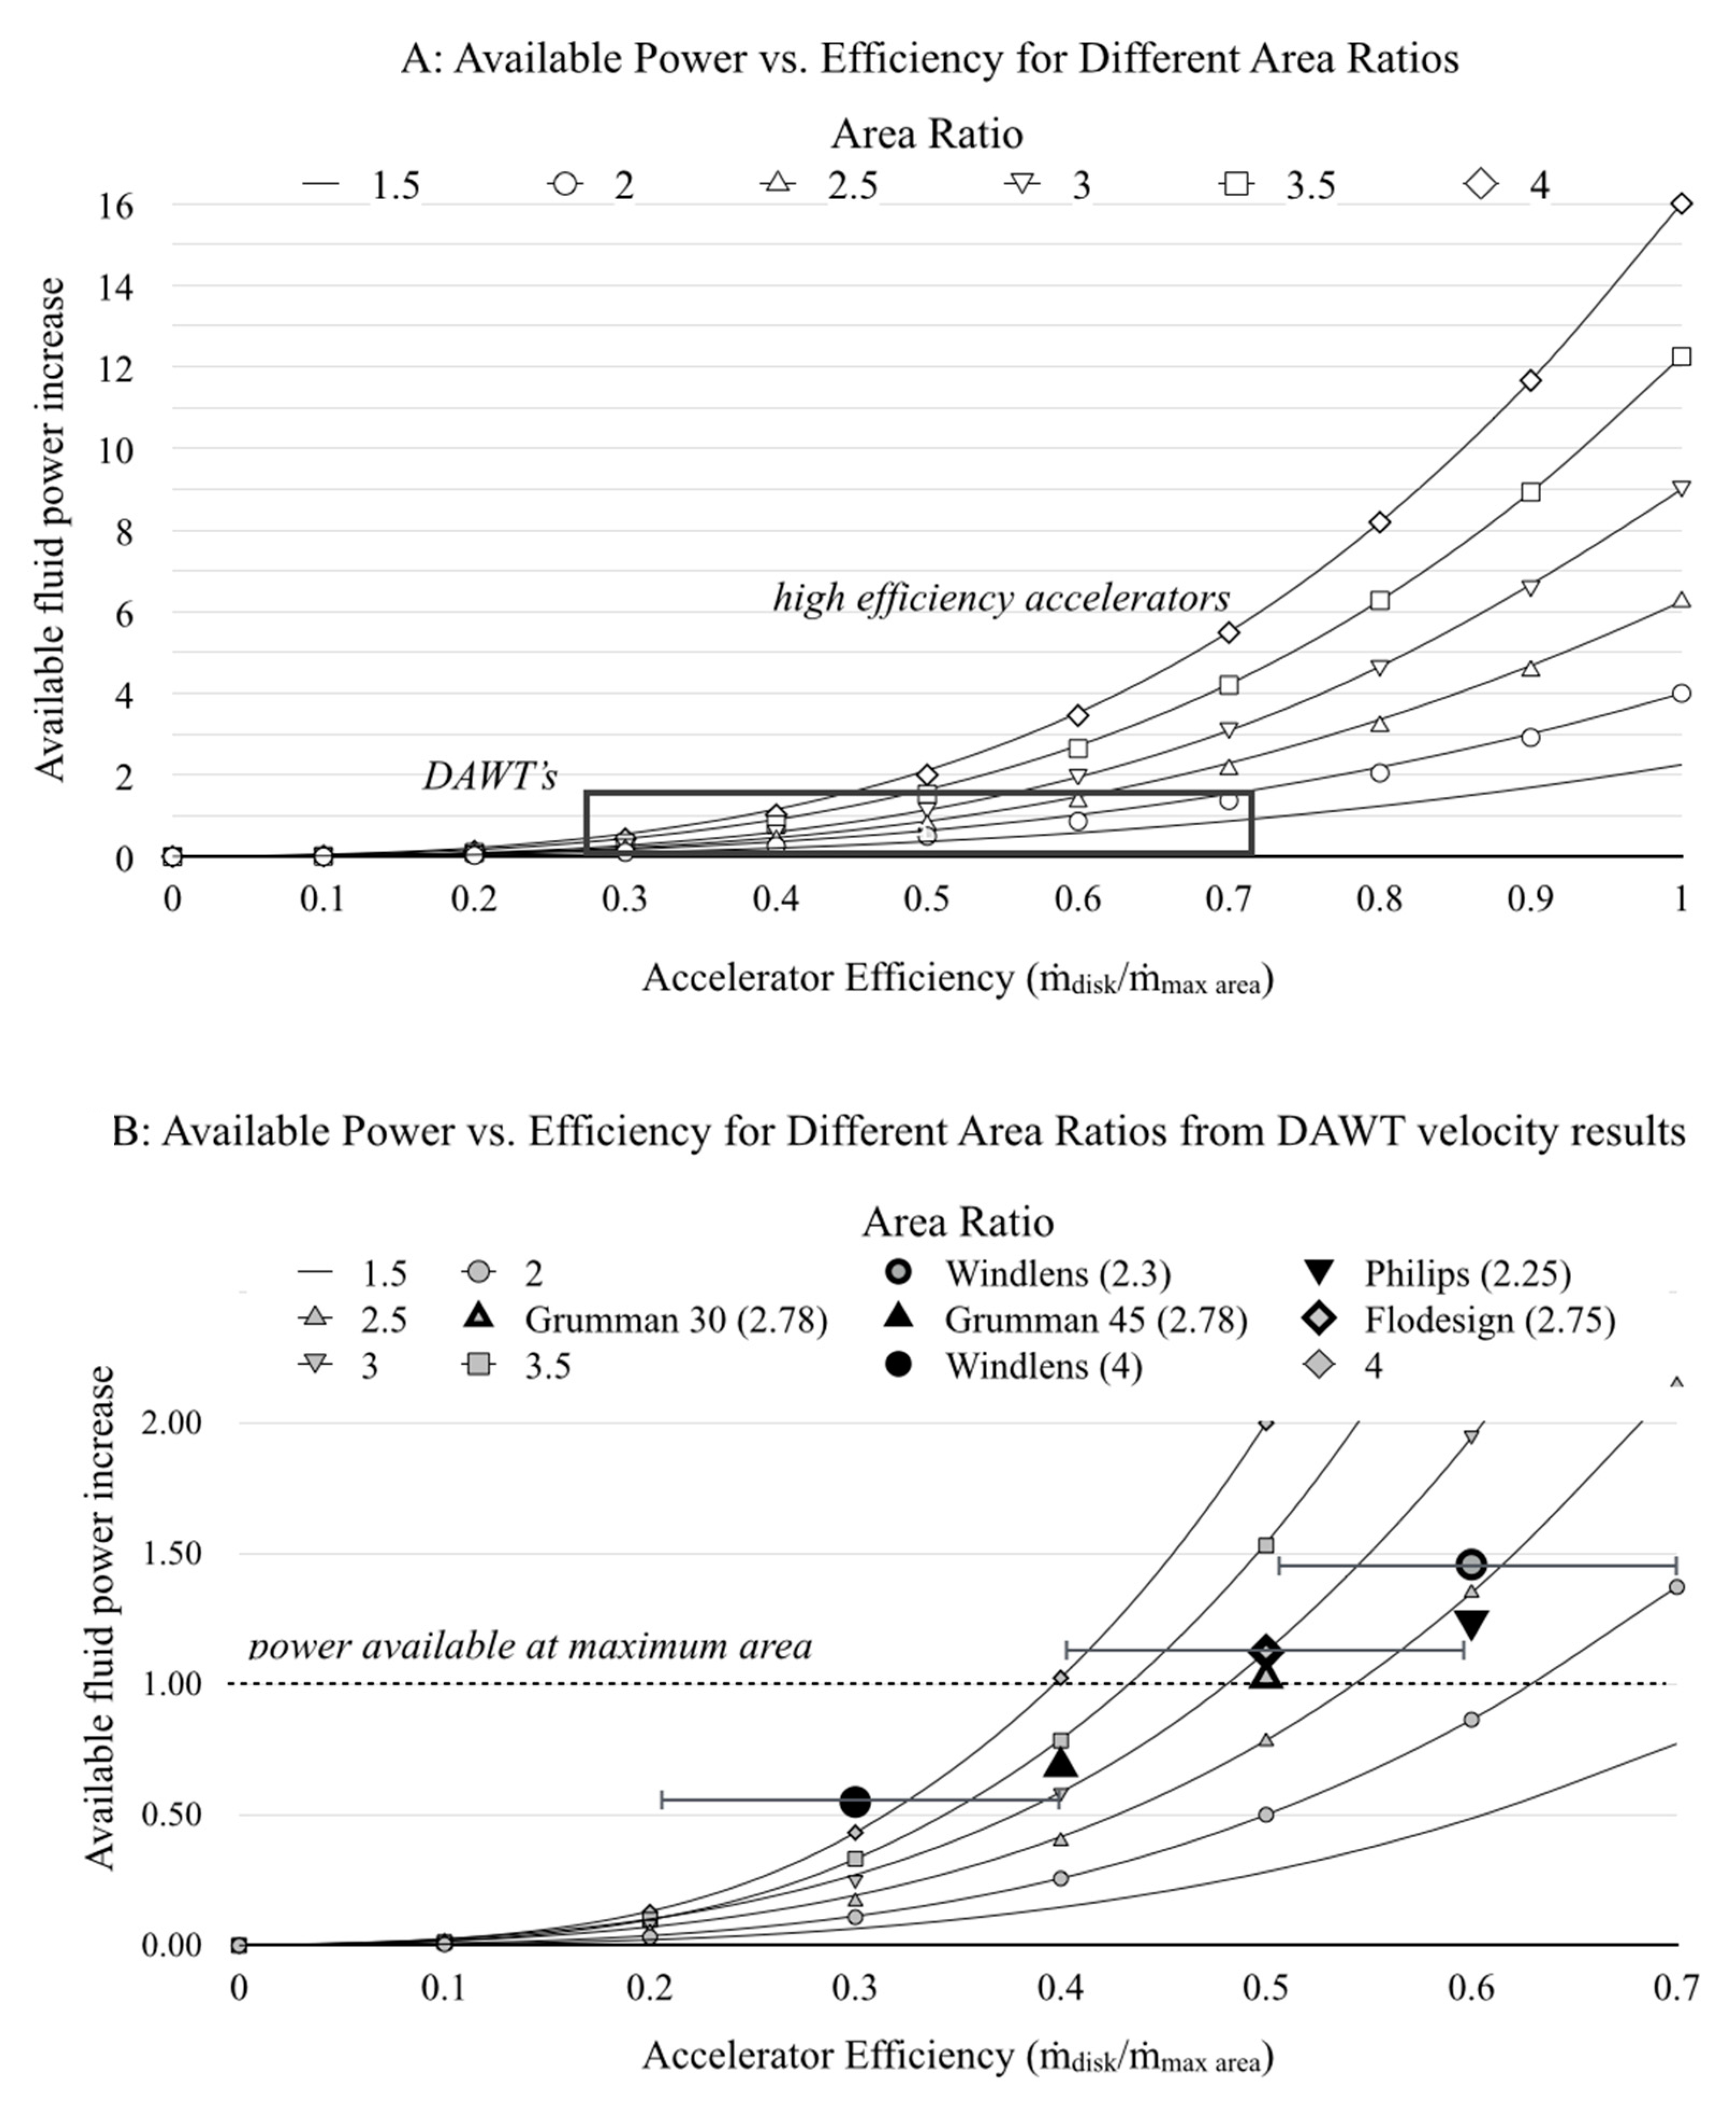
The issue of DAWT performance and the conclusions that can be drawn from DAWT research should be understood in the simplest of terms, absent the complexities addressed in the later sections of this paper. A rotor or actuator disk at the DAWTs throat area will experience an accelerated velocity. Using the Grumman data presented in Figure 3 below, the Grumman DAWT [13,17] had an acceleration of 1.56v∞ for a 2.78 area ratio with nothing at the throat. Absent other effects, an increase of wind speed to 1.56v∞ provides power increase to that area of 1.563, by the fluid power equation. Independent of further constraints this relation characterizes the most power that the Grumman DAWT actuator disk could possibly produce. Unless the throat area power available to the actuator disk at the accelerated velocity is significantly higher than the power available to an actuator disk of the DAWTs maximum area operating at v∞, it is highly unlikely that with the additional accelerator constraints the DAWT’s actuator disk could exceed its maximum area limit. Figure 3A shows the power available to a disk of the throat area as a function of accelerative efficiency for different area ratios. The values for the Wind Lens and Flodesign/Ogin devices are estimates based on published or claimed CP. These estimates may contain errors due to the lack of relevant variables in the published data. Error bars on these estimates are provided which assume that the extractor in question operates at a minimum of 0.2 CPdisk and a maximum of 0.4 CPdisk. Figure 3B is a detailed image of DAWT performance. Figure 3 demonstrates that all DAWTs to date have operated at less than 70% baseline accelerative efficiency. The lack of efficiency leads to a reduction in fluid power available at the throat. Unsurprisingly, DAWTs have failed to exceed the Betz limit of their maximum frontal area and that failure cannot be considered evidence of a limit or the potential value of acceleration. More efficient accelerators than DAWTs are necessary to realize the benefits of acceleration.
2. Materials and Methods
2.1. AMs: The Inapplicability of Rankine–Froude’s and Betz’s Averaging Methods to Accelerators
Betz’s Law is deemed the power limit for freestream turbines. Betz used averaging of wake and freestream velocities to determine the resistance, velocity, and power extracted by Rankine–Froude’s ideal actuator disk. AMs have used this same averaging method to incorrectly predict limits for actuator disks inside of accelerators. Averaging is not valid within accelerators since the flow conditions at the disk cannot be determined by averaging freestream and wake velocities. Betz’s Law requires that all flow effects are entrained in the relevant streamtube and that the flow is free to expand at the disk plane. Neither of these requirements are satisfied by AMs’ application of Betz’s methods.
2.1.1. Overview of Betz’s Law for Freestream Turbines
Betz’s Law defines the maximum extractable power for a freestream turbine. Betz’s equations, [9], utilize averaging of freestream and wake conditions to determine the power of a turbine. Equation (1) shows how Betz averages the wake and freestream velocity to determine the velocity at an actuator disk. The uniform resistance of the disk slows the velocity through the actuator disk. The rate of velocity reduction is represented by axial induction in Equation (2). The resistance for a given CT is applied at the wake and results in a reduced velocity at the disk due to averaging with v∞. Therefore, the streamtube must be free to expand around the disk to satisfy mass flow conservation.
Betz’s pressure drop is defined as a function of the axial induction or freestream velocities and uniform density as shown by Equation (3). Betz’s Law predicts power as a function of area, velocity, and pressure drop as shown by Equation (4). In Betz’s Law, the CP and CT can be represented explicitly or in terms of axial induction as shown by Equations (5) and (6).
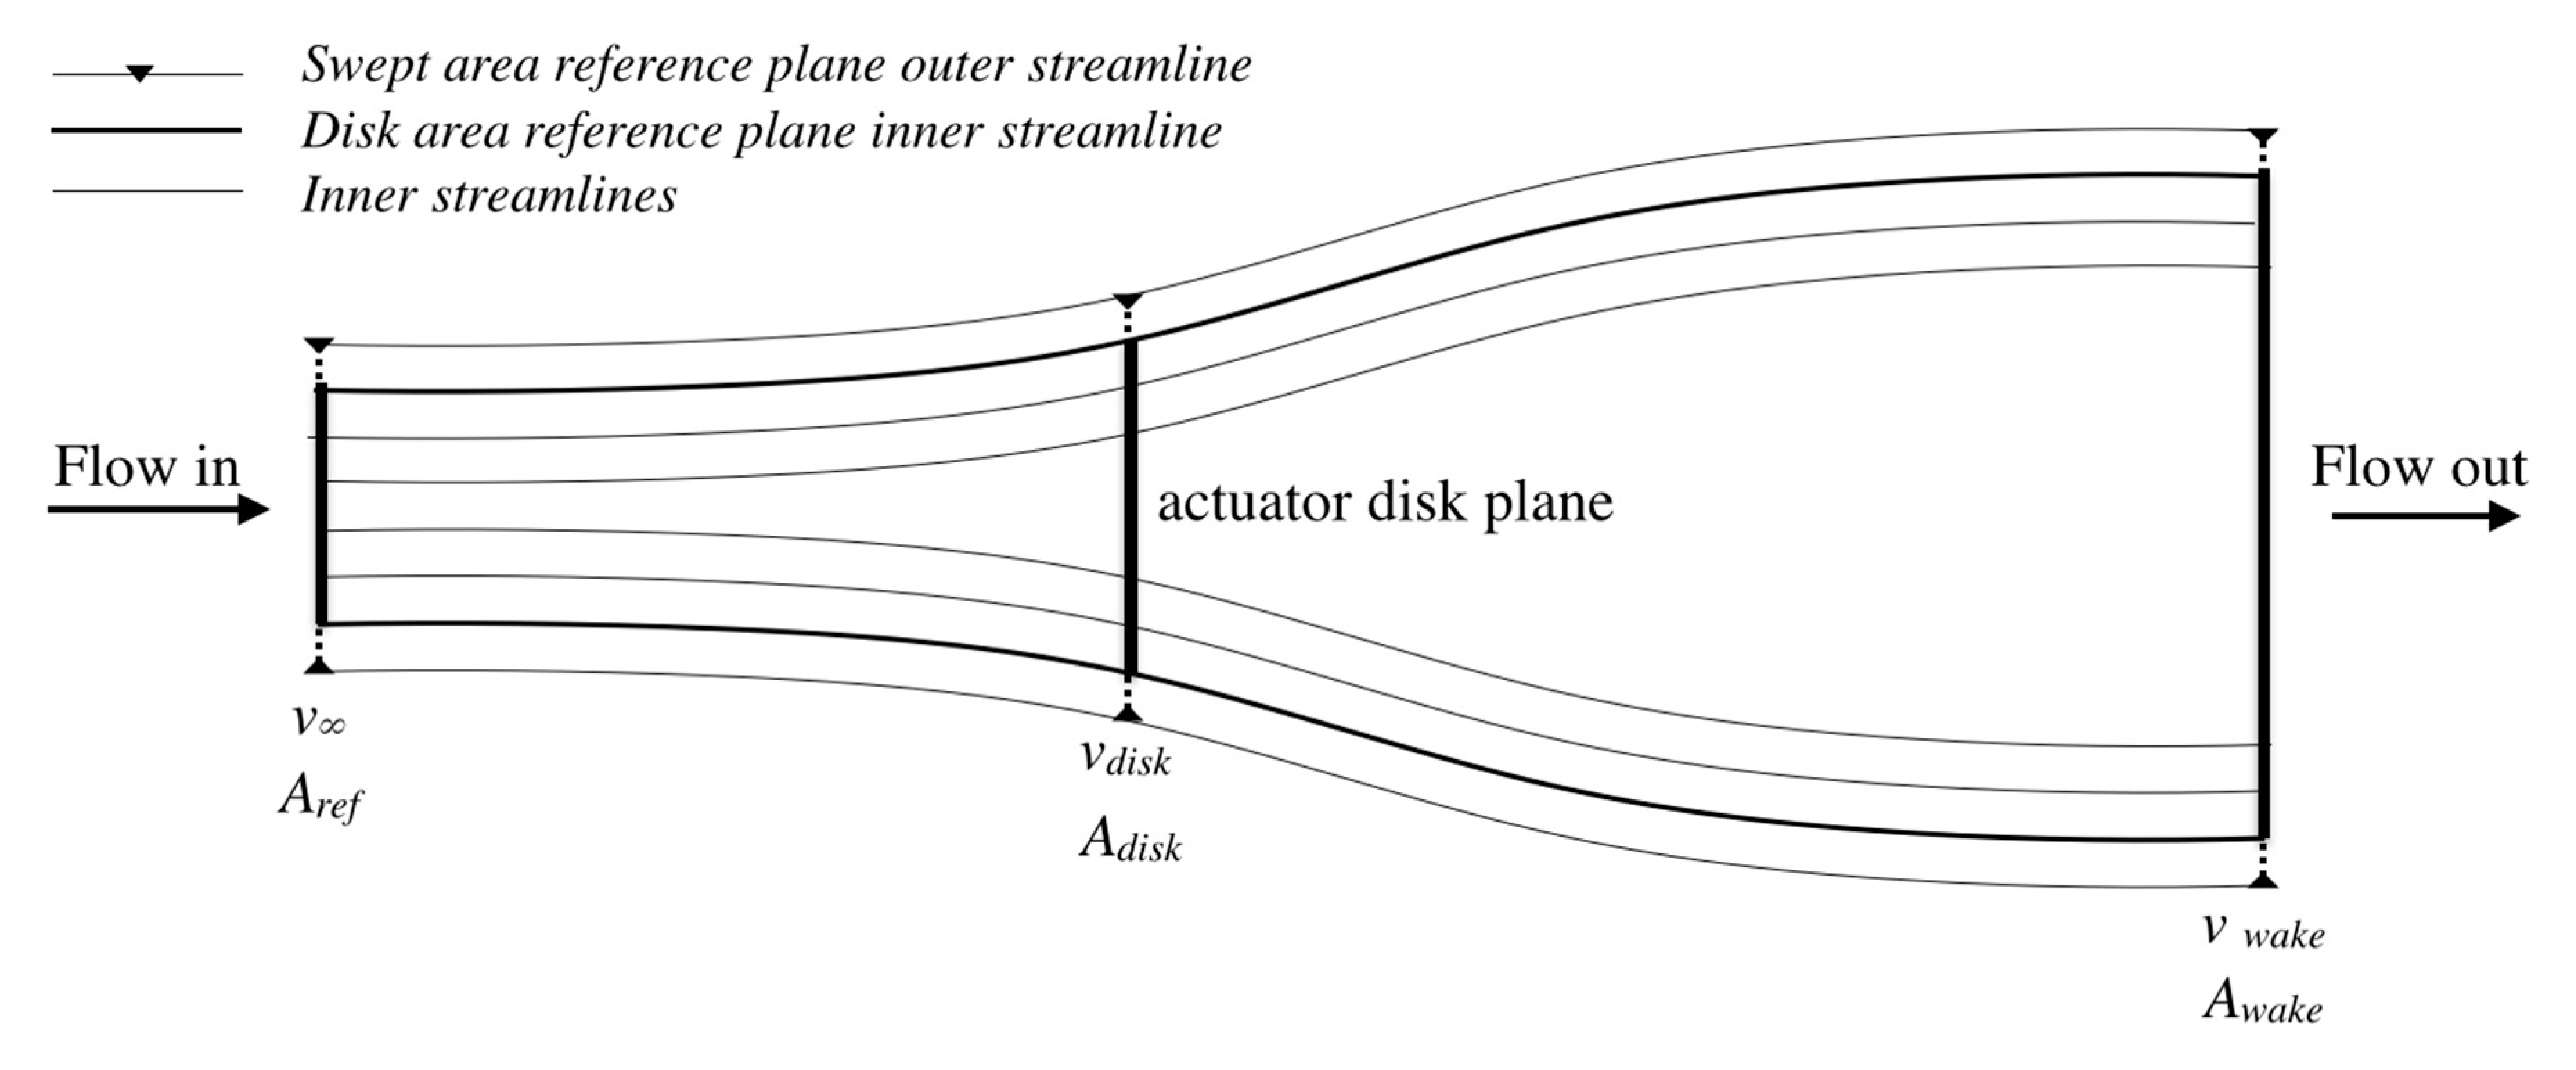
As Betz’s Law was developed for freestream turbines, it is a fundamental requirement that the extractor cannot be confined. Figure 4 shows the streamlines for a freestream turbine. The streamline shown in black depicts the streamtube which passes through the disk area at the disk velocity as specified by Betz’s Law. The light gray lines show the streamtubes for different reference areas. The swept area referenced to v∞ passes to the outside of the actuator disk area displaying the free expansion requirement inherent to the method. For all streamlines, the area at the disk is greater than the corollary freestream area as v∞ is greater than vdisk. Expansion at and around the actuator disk is a function of Betz’s averaging equations as vwake vdisk v∞, and Awake Adisk A∞.
2.1.2. Concerning Rankine–Froude’s and Betz’s Velocity Averaging Methods and Confined Flows
Betz requires constant expansion of the fluid area in the axial direction to the lowest velocity in the wake. Betz’s Law was derived for freestream power extraction, not for confined flow power extraction. In a confined condition, the boundary is closed, and the mass flow area cannot expand at the disk. The mass flow must be conserved throughout the confinement. The resistance at the disk determines the mass flow through the confined channel. Mass flow is rejected at the intake of the confinement instead of at the disk plane as in the freestream case. Confinement engenders a compound reductive effect on the disk velocity which cannot be accounted for by an averaging method.
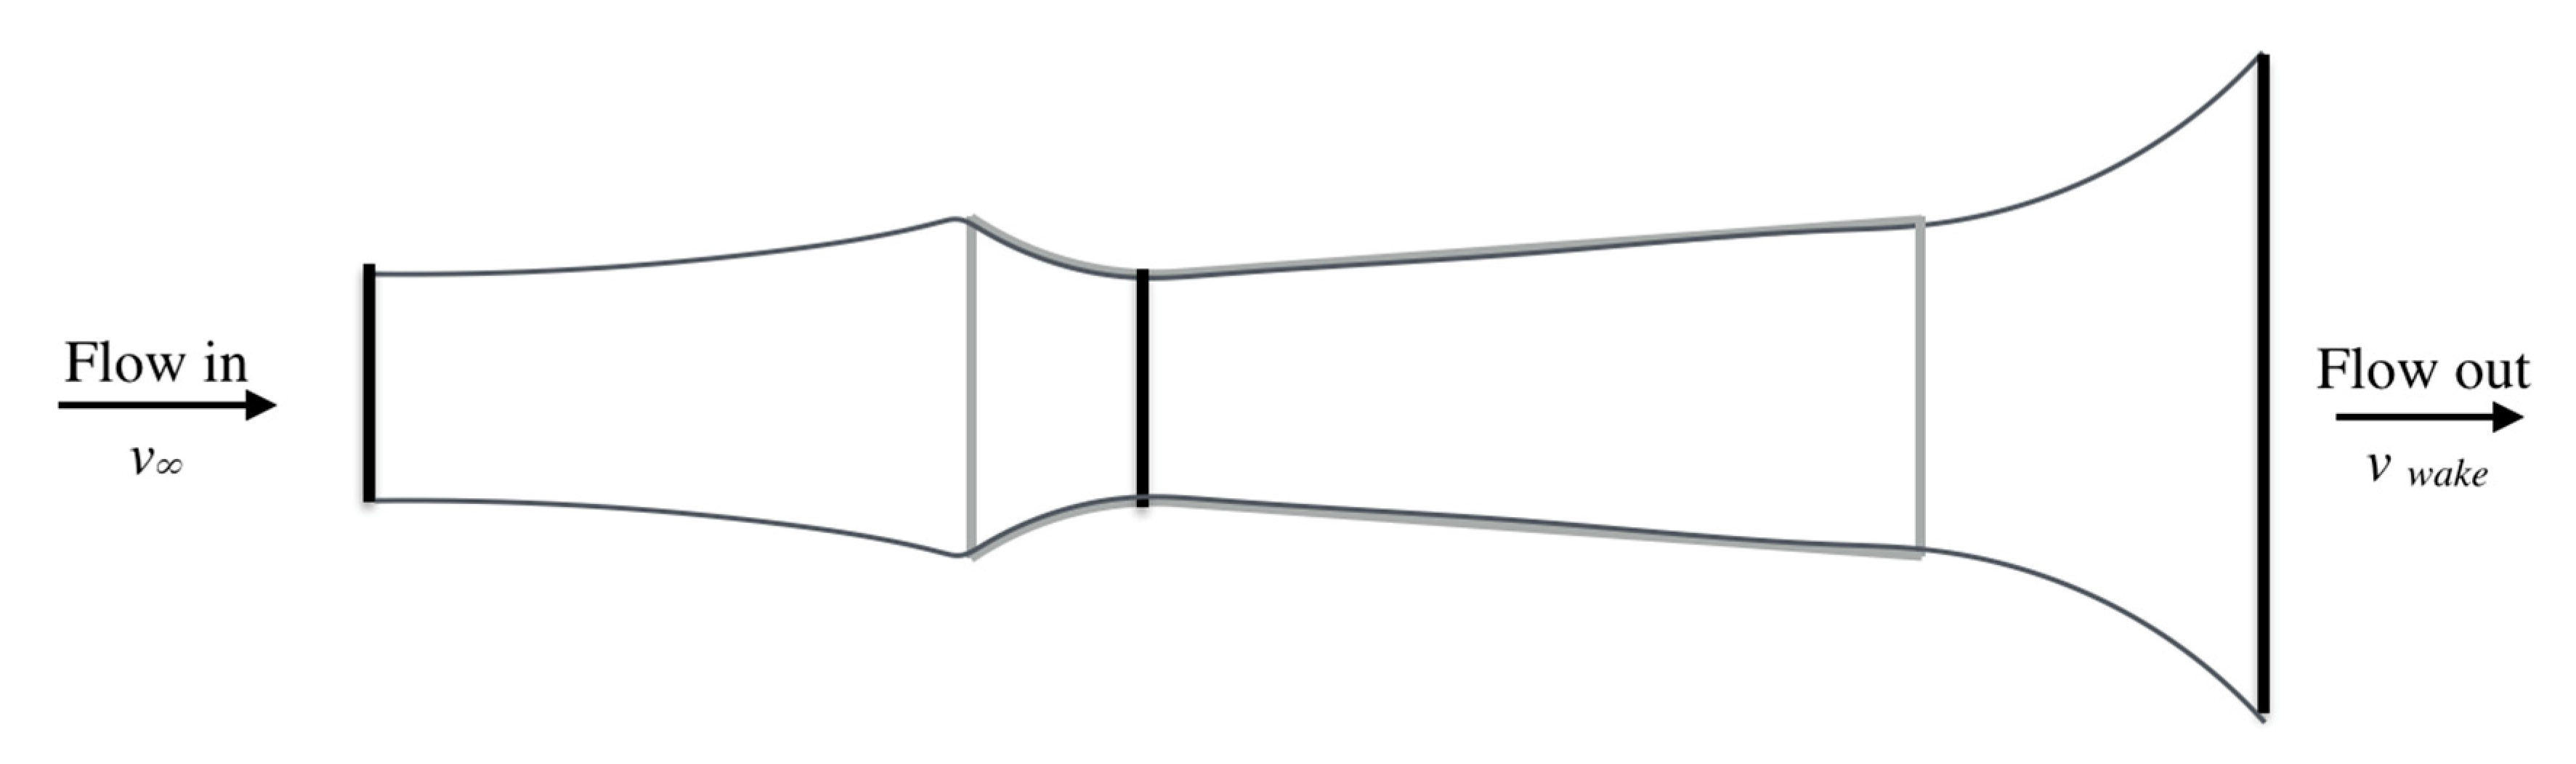
As can be seen in Figure 4 above, all Betz streamlines are parallel. While not a stated assumption of Betz’ control volume, velocity averaging methods will only yield parallel streamlines except at the plane of symmetry as all v∞ reference areas produce the same results related to CP. A confined disk cannot have universally parallel streamlines, expanding from all reference areas to the rotor to the wake. Figure 5 depicts a simple tube confinement that is open on either end and has an actuator disk in the middle. For a confined disk resistance is experienced at the actuator disk and the flow expansion occurs at the intake. Therefore, the reference area streamlines diverge at the intake and cannot be parallel. The streamlines inside the tube are not free to expand. It is stated as a requirement of Betz’ Law that all relevant flow effects be entrained at the actuator disk [9], which is not satisfied for the confined case by the averaging method. In confined flow, averaging cannot satisfy the assumptions that justify its application. Averaging is therefore incapable of determining disk velocity in confined conditions.
2.1.3. AMs’ Misapplication of Betz’s Law and Velocity Averaging
The AMs, proposed by van Bussel [10], Jamieson [11], and WP [12], all rely on the Betz’ averaging methods to predict actuator disk velocity and pressure drop in the accelerator channel. The AMs assume that the resistance of a disk in a confined channel is the same as the resistance of the disk in the freestream. The AMs present no derivation, argument, or experimental evidence to justify or validate this assumption. While AMs all use different equation development, the averaging method is fundamental to all AMs irrespective of the apparent differences in variables. The specific relation of each AM to the general averaging method is addressed in Appendix A.
Using velocity averaging for confined flows creates fundamental control volume and conservation problems. Experimental evidence presented in Appendix A will further show that the rate of resistance for a free stream rotor and the streamline expansion at the disk is not the same as the rate of resistance for a confined rotor and the streamline expansion at the intake. The general AM control volume is stated to be the volume depicted in Figure 6 by van Bussel [10], Jamieson [11], and WP [12].
The stated control volume does not expand at the disk and therefore averaging cannot entrain the relevant flow effects at the actuator disk as noted in the discussion above. Furthermore, under extraction, axial induction is present. Mass is rejected at the intake in the AM control volume, but the mass flow rate external to the nozzle in the AM treatment is associated with external averaging not the applied resistance at the throat. Van Bussel’s, Jamieson’s, and WP’s control volumes violate Betz’s assumptions. All flow effects are not entrained in the averaging equations and the flow is not able to expand at the actuator disk.
Additionally, the presented AM control volume is not the only control volume applied in some AMs. Some of the AMs actually use two control volumes to satisfy the assumed energy limits. AM theorists begin with the assumption that the only energy available to do work is the kinetic energy available at v∞ for the accelerator’s maximum area. Van Bussel specifically states, in his 1999 paper [23] that “the amount of energy that can be extracted from the flow per unit of volume is the same as for an ordinary wind turbine”. This assumption is reiterated with a second assumption which van Bussel states in his 2007 paper [10], “it is assumed that at the exit of the diffuser the same conditions apply as just after an ordinary wind turbine (assuming no extra back pressure)”. To satisfy these assumptions, the AMs must further adapt Rankine–Froude’s and Betz’s equations resulting in the application of two control volumes and continuity violations.
Equations (7)–(10) are the explicit and axial induction forms of the general AM equations. Power is defined in Equation (7). Equation (10) has Equations (8) and (9) substituted for vdisk and Δp, respectively.
Equation (8) shows that β is distributive in the velocity case and can be applied directly to the averaged velocity value or its components. Averaging is inherent in the axial induction form of the equation. There is no reduction from the pure application of β to the averaged velocity which shows the absence of the mass flow constraints necessary to model confined flow. There is also no application of β in Equation (9), the pressure drop equation. Given the initial assumption that the accelerator maximum area is the kinetic energy limit of the accelerator and the absence of mass flow constraints in the vdisk equation, the removal of β from the pressure drop equations is necessary to satisfy the AMs’ kinetic energy assumption. The AM power as defined by Equations (7) and (10) contains the error found in Equation (8).
Jamieson and WP start with the axial induction form of the equations and note that β drops out of the equations. Van Bussel specifically justifies the removal of β as vdisk drops out of Betz’s pressure drop equations. β cannot be considered distributive in Equation (9), due to the square of velocities. Therefore, the application of β within the squared term or outside of the squared term must be justified and validated experimentally. AMs’ exhibit high predictive error for vdisk and Δp when compared to experimental results, as will be shown in Section 4. This indicates that there is no basis for van Bussel’s removal of the β variable or any application β outside the squared term. In the vdisk calculation, β is applied to both v∞ and vwake. If applied consistently with one application of β in the vdisk equation the result is Equation (11).
Van Bussel states that this cannot be the case, “The maximum achievable power however is not equal to β3γ3CPmax, where CPmax is the maximum achievable power of the wind turbine without diffuser” where γ is backpressure. Van Bussel is in part correct, but only because the consistent application of β has no mass flow constraints on the free expansion of the fluid around the disk and will over-predict accelerator power by a large margin. The β2 result is the same as applying β to the standard fluid power equation within the cubed term and then correcting for the maximum area used.
In the consistent application of β, the error is limited to an incorrect control volume which ignores the confinement. The over-prediction of both vdisk and pressure drop could be considered a limit, albeit one that can never be achieved.
The application used by the AM theorists is more problematic. It results in a second control volume, beyond the stated control volume, which simultaneously leads to over-prediction of vdisk and under-prediction of pressure drop. The AM’s misapplication of β leads to two different velocities being applied to the actuator disk at the same time neither of which reflects the relevant flow effects and conditions.
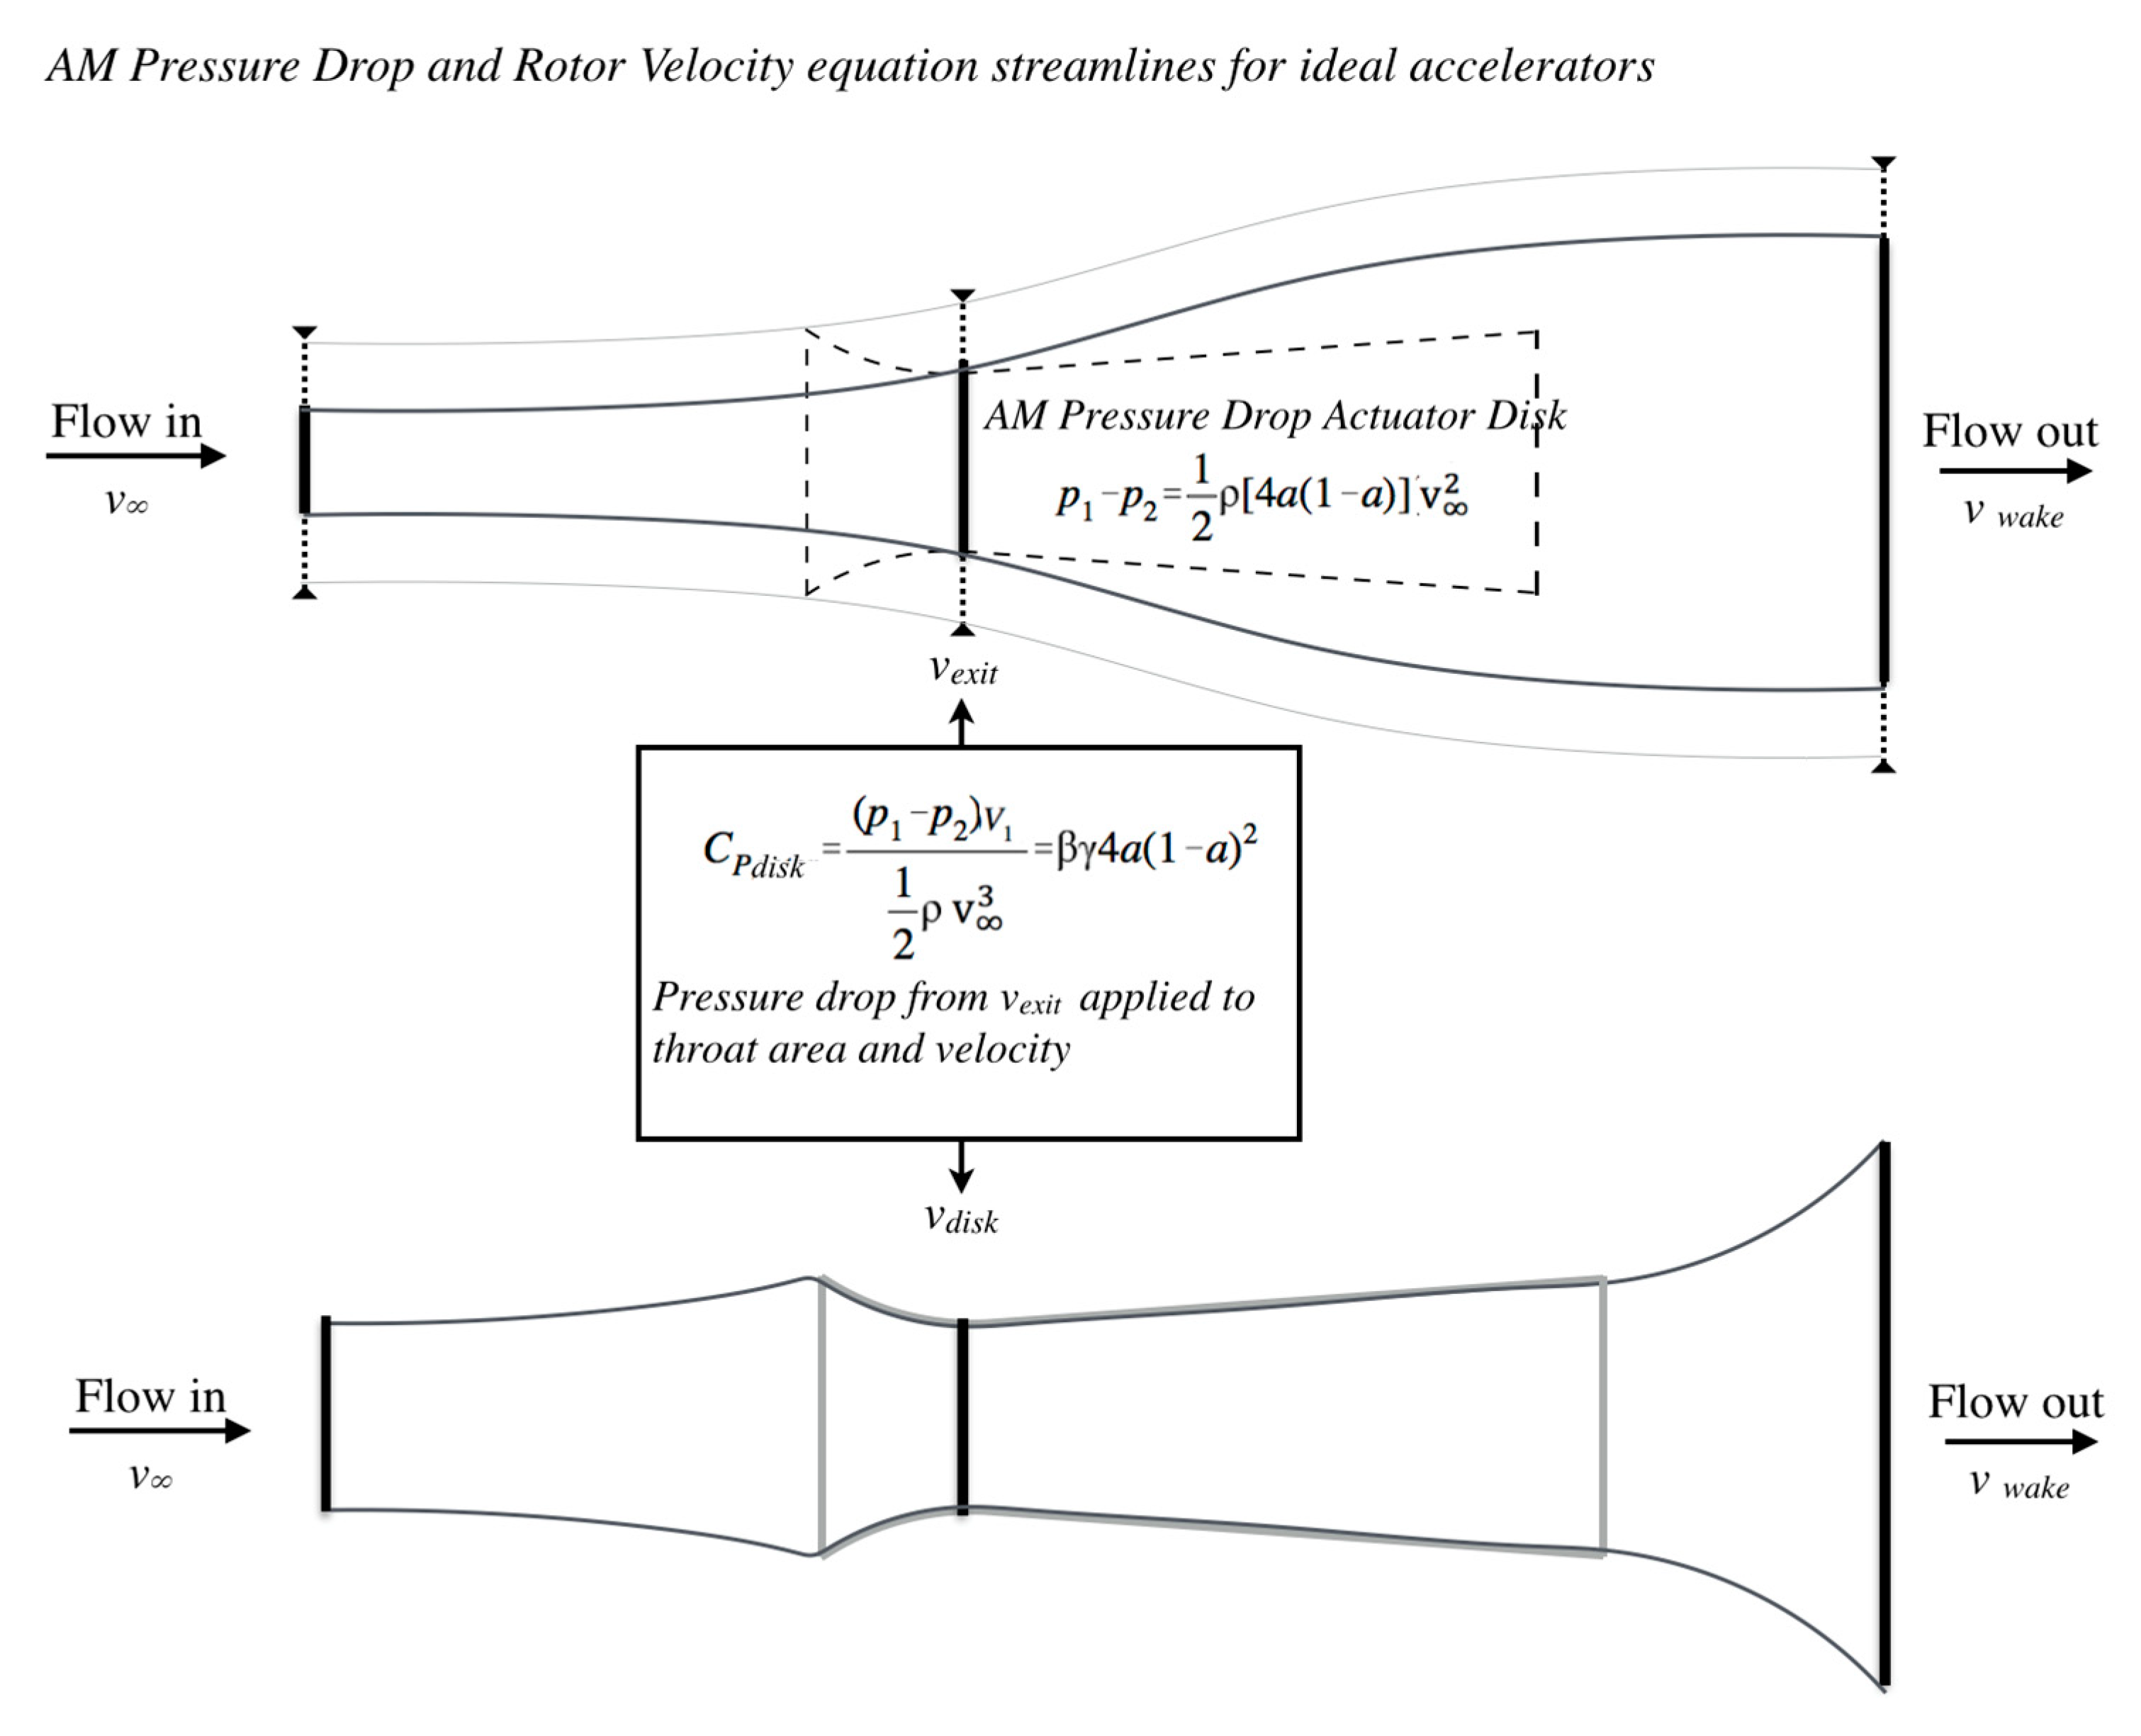
The AMs’ utilized control volumes for velocity and pressure drop are shown in Figure 7 below. The AMs assert that for an ideal accelerator the pressure drop is that of the exit plane area and freestream velocity. The AMs, therefore, disregard the fact that the pressure drop occurs in the confinement of the throat of the accelerator and at the throat velocity. The top image of Figure 7 shows the axial induction form of the pressure drop in the AM equations for an ideal accelerator and the absence of an accelerator in the equation’s control volume. The lower image in Figure 7 depicts the control volume which the AMs claim to use. The velocity at the throat of the lower control volume is combined with the pressure drop from the upper control volume to determine the AM power. The control volume in the lower image also has ideal assumptions applied to it. It is unlikely that for an accelerator with an inlet of the same size as the exit that the flow would stay attached to the outside of the accelerator as shown by the light grey line or that the confined rotor would have the same velocity as a freestream rotor increased by β.
2.1.4. The Tube Case (an Accelerator Where β = 1)
The problems inherent in the general AM are most evident in the application of AM methods to the tube case where β = 1. Certain AM authors [11,12] claim that their methods provide a general theory for extraction from either freestream or confined flows. A general theory for power extraction for a confined flow should be valid for all positive values of β, 1, or greater. For an infinitely thin-walled tube, the diameter of the tube and the actuator disk are the same. When β = 1 the AMs yield the Betz limit of the tube area. This is the same as a freestream turbine in the same area. When an extractor is placed in a tube, the extractor’s performance is lower than it would be in the free stream.
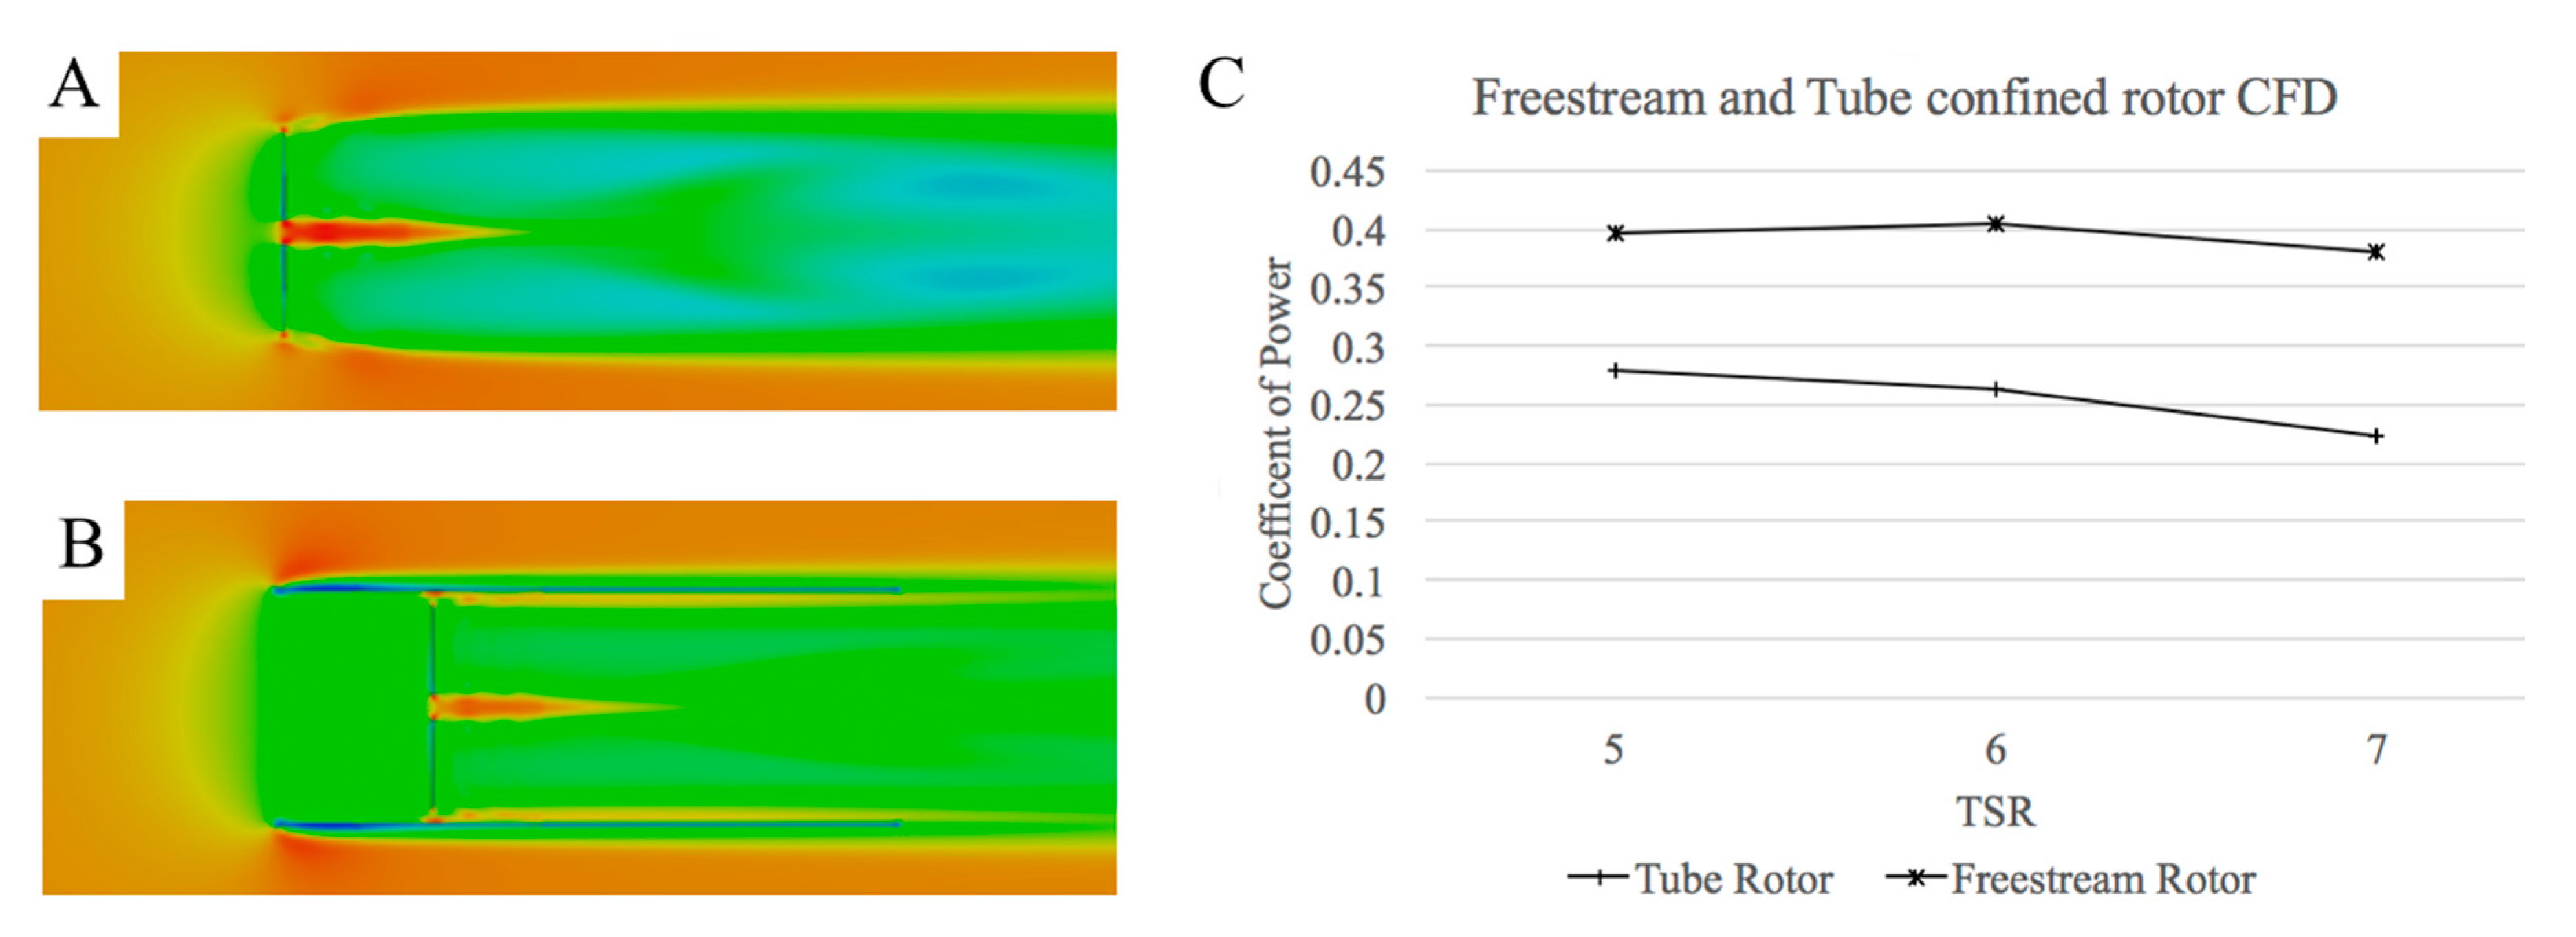
Figure 8A depicts a RANS CFD study of a two-bladed Horizontal Axis Wind Turbine (HAWT), without a hub, operating in the freestream and a long tube. Figure 8B shows that the power reduces from the initial freestream power in a tube. Images of the flow are RANS CFD velocity plots, which bisect the rotor. Red is high velocity and blue is low velocity. High velocity is shown in the center of the turbine where a hub is not present and in the tip vortex due to a 15% tip gap.
As intuition and Figure 8 shows, a wind turbine (or actuator disk) inside of a tube operates at a lower performance than a freestream turbine (or freestream actuator disk) due to the reductive effect of the confinement. The AMs assert that a turbine will have the same performance in a tube as in the freestream. Contrary to the AMs, analytical models, like that presented by Lawn, predict that the power in a tube will be less than in the freestream [24].
Figure 8 shows that mass is rejected at the intake of the tube and the wake begins to expand at the intake. The AMs predict that the tube is collapsible into a single plane through invalid assumptions, which removes the confinement of the tube.
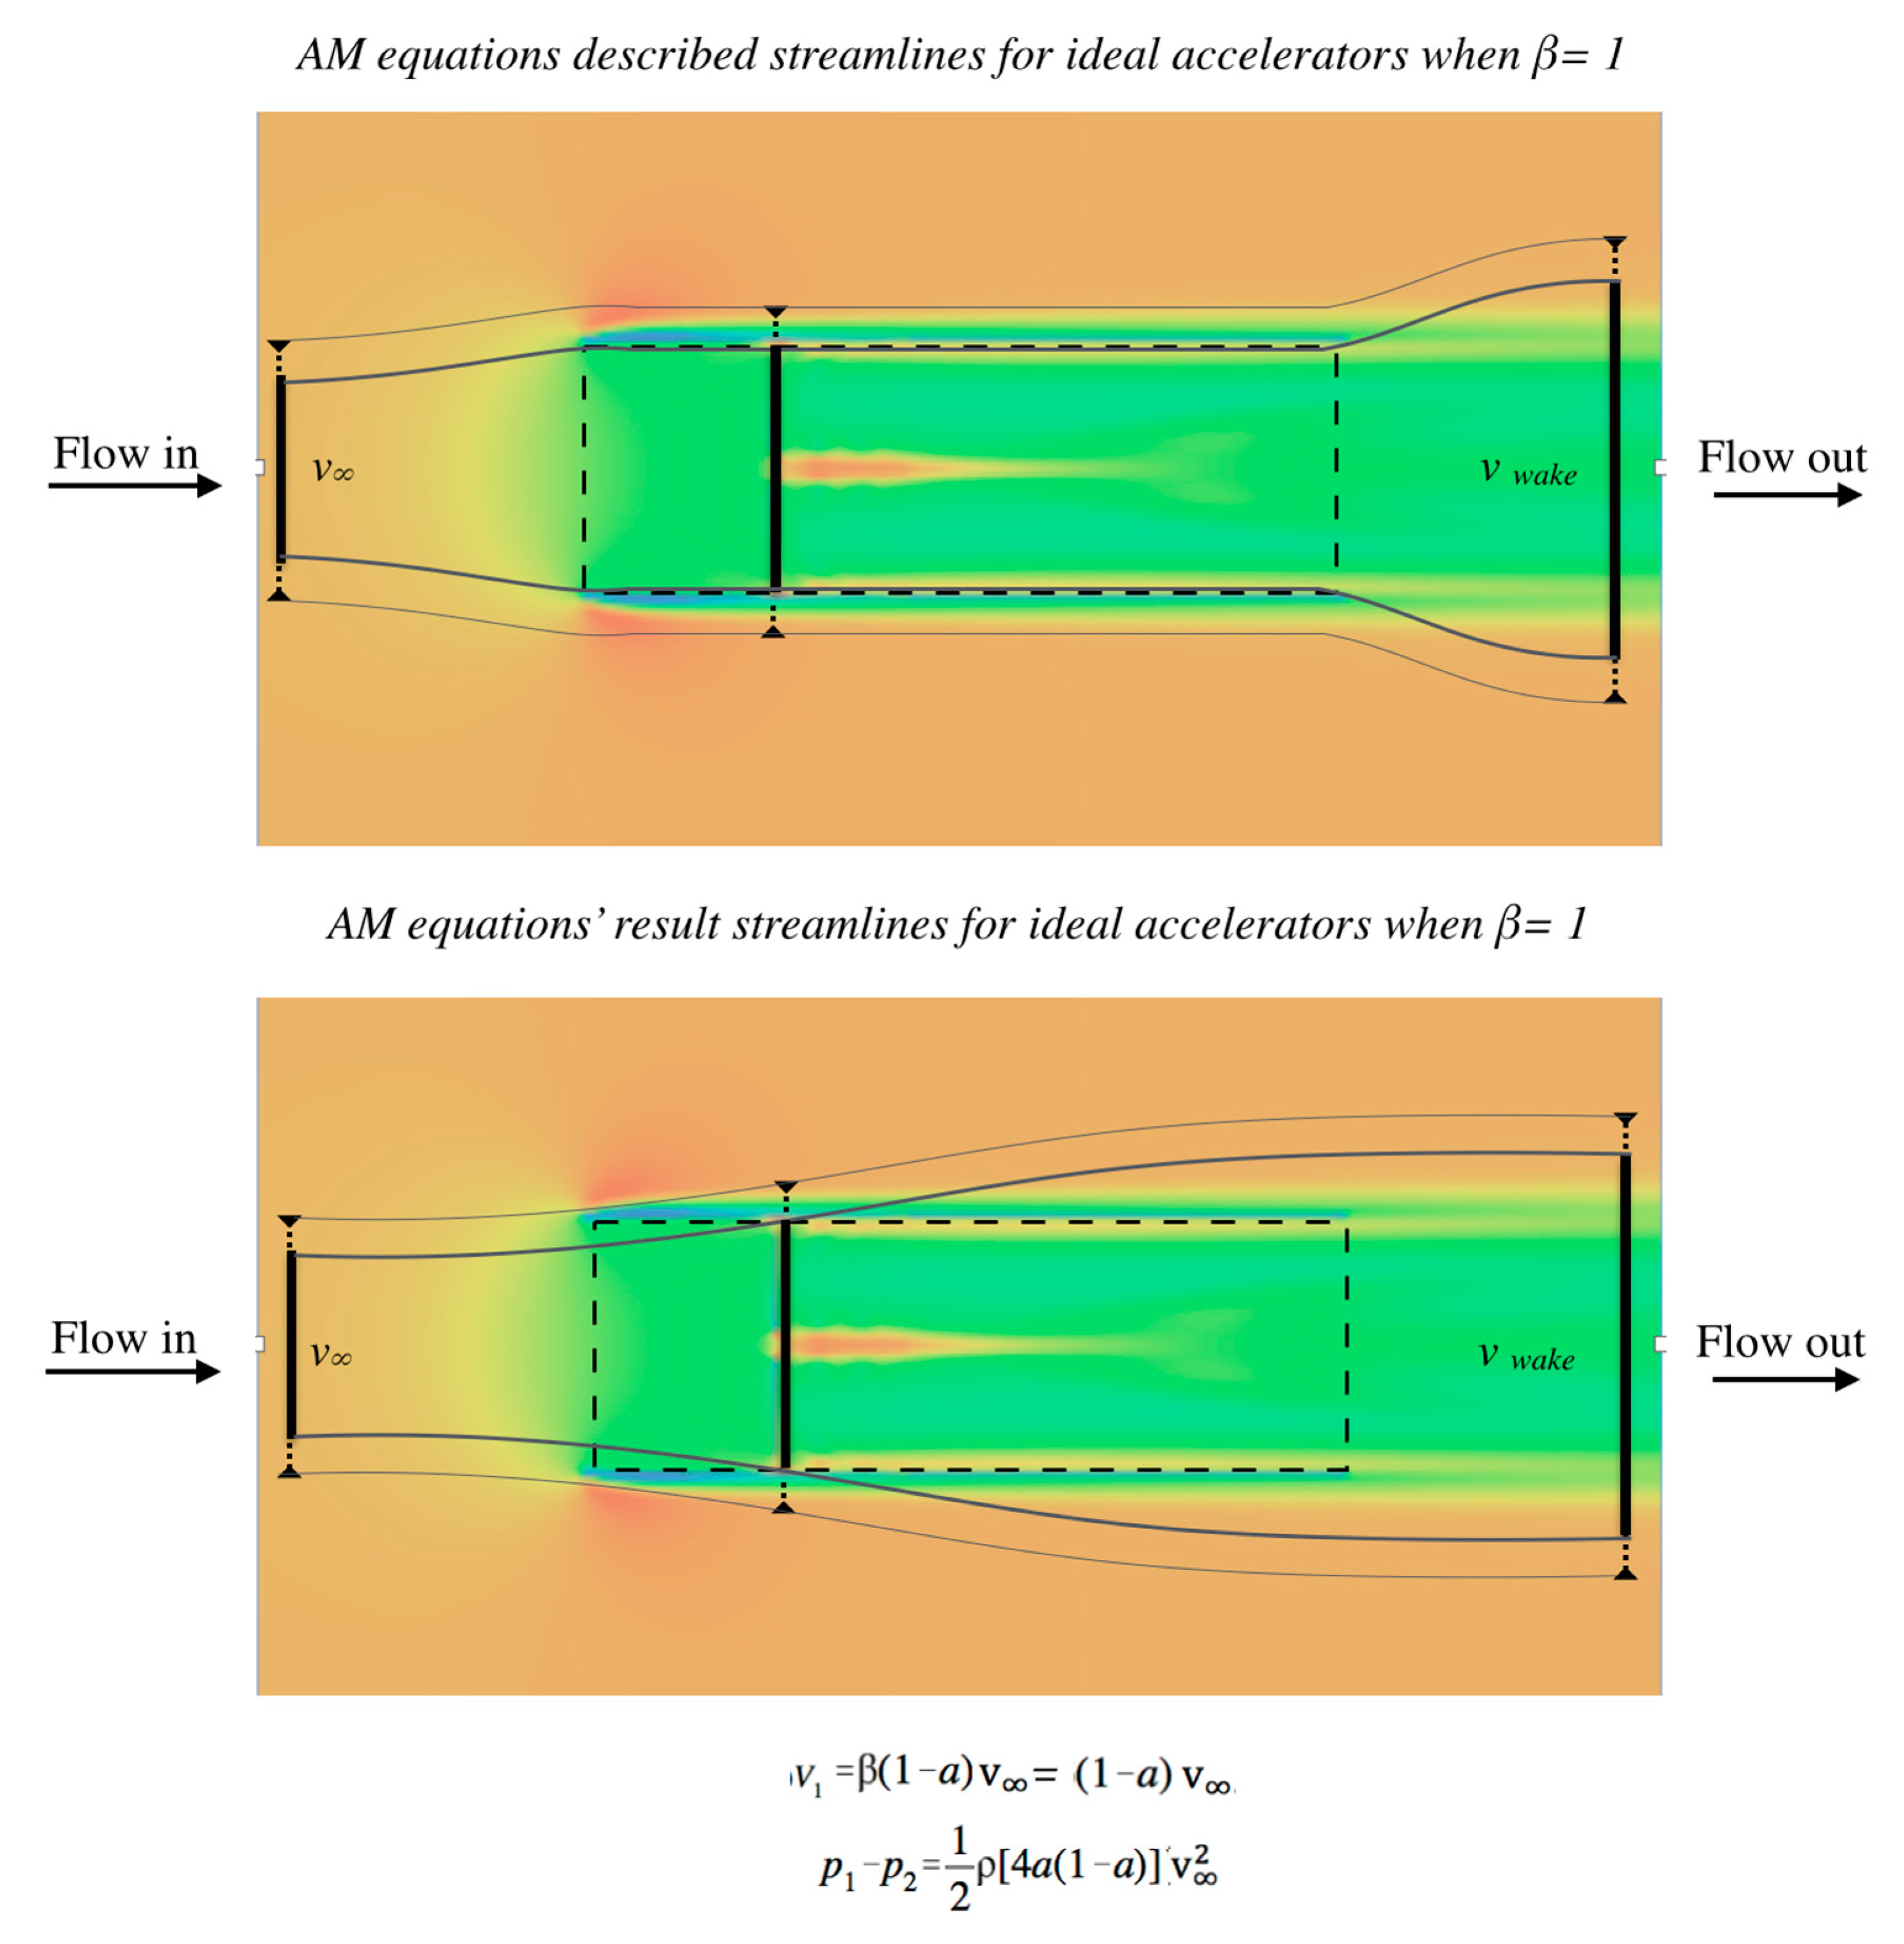
Figure 9 depicts the AM streamtubes when β = 1, based on the equations for disk velocity and pressure drop, overlaid with the RANS CFD long tube case with the two-bladed HAWT. The dimensions of the tube are dashed. The top image of Figure 9 depicts the stated stream tubes of the AMs for a tube. However, the result of the AMs’ equations is that the entire volume of the tube can instead be collapsed into a single extraction plane. For an ideal tube, the AMs predict that the power extraction inside of a tube will be the same as for a freestream turbine. The bottom image of Figure 9 depicts the streamlines of the result of the AMs. These AM streamlines based on the axial induction equations for this condition are the same as the Betz streamlines as there is no reductive effect caused by the confinement. Figure 9 demonstrates that the AM equations do not include a reductive effect caused by the confinement and that the AMs fundamentally ignore the presence of an accelerator. The AM streamtubes for the β = 1 case is the same for both velocity and pressure drop, unlike the cases shown above in Figure 7 for β 1.
As will be shown in later sections, the rate of expansion at the intake depends on the resistance at the disk within the confinement, not on the averaged external velocities. While all AMs suffer from the flaws caused by averaging, the particular execution varies slightly between methods.
3. The Thrust Model Derivation and Comparison to Rankine–Froude Momentum Theory
3.1. The Thrust Model
A complete theory for power extraction in accelerators must predict performance for both ideal and non-ideal functions directly from the actuator disk in the confined channel and be valid for all values of β equal to or greater than one. Qualification of a specific accelerator’s performance is necessary to model non-ideal states and to benchmark a particular geometry. The Thrust Model [15] satisfies these requirements.
3.1.1. Thrust Model Derivation
Bernoulli’s Law, as specified in Equation (12) governs pressure conditions within the accelerator. The Thrust Model assumes that density is constant through the incompressible assumptions. Stations 1 and 2, as shown in Figure 1 are immediately forward and rearward of the throat of the accelerator and by mass conservation, v1 = v2, and is related to v∞ by the area ratio, β. β relates A1 to the greater of Ain or A3 per Equation (13). Equation (14) defines the initial ideal throat velocity, v1o in relation to v∞, without extraction (CT equal to 0). Non-ideal accelerator efficiency, r, is defined in Equation (15) and characterizes the baseline efficiency of the accelerator, which qualifies the accelerator’s available power without an extractor present. The Thrust Model assumes incompressible flow.
The extractor is represented by a uniform porous resistance at the disk per actuator disk theory. The disk’s closed porosity is equal to the local coefficient of thrust, CT, defining the body forces acting on the disk. By mass conservation, the resistance of the extractor must immediately communicate through the accelerator as related to β, as shown by Equation (16). The available thrust in the initial flow and thrust on the disk for a given value of CT is specified by Equations (17) and (18) respectively. As CT increases with extraction, the magnitude of v1 decreases from the initial velocity, and the pressure drop, Δp, across the disk increases.
Equation (19) shows the remaining force in the fluid. We define Equation (20) as the result of the substitution of Equations (17) and (18) into Equation (19). Equations (20) and (21) define the remaining force in the fluid referred to v1o and v1 respectively. F1remaining is set as equal and solved for v1, resulting in Equation (22) for the velocity in the accelerator under extraction. Force remaining and velocity anywhere in the accelerator are related to v1 and F1remaining by the local value of β. The resistance of the disk can be characterized at any station related to the local value of β and is related to resistance at the intake by βin. Equation (22) gives the disk velocity related to CT as CT varies from zero to one. Equation (23) gives the pressure drop across the extractor. Equation (24) shows the power extracted. Equation (25) shows the system CP is where Amax is the larger of Ain or A3. Equation (26) specifies the disk specific CP.
The obstruction presented to the flow by the extractor-accelerator pair has a variable area related to a given CP and CT of the pair. Rejection of mass flow under operation increases the effective area of the accelerator, akin to increasing the coefficient of drag of a system to a greater value than one. From the reference plane of the flow, the body appears larger than its area. The AMs restrain the energy streamtube to the swept area of the device projected forward; whereas the Thrust Model does not constrain the energy effects. An object like a flat plate has a coefficient of drag greater than one, therefore the object experiences more force than the force present in its swept area projected forward. A similar effect occurs with an accelerator, where the available power for extraction increases from the initial state and swept area of the accelerator to a maximum at CT = 0.65. Equation (27) specifies the effective area of the device calculated from power.
3.1.2. The Thrust Model’s Relationship to Rankine–Froude’s Actuator Disk (Momentum) Theory and Betz’ Law
Rankine–Froude’s actuator disk theory and Betz’s Law rely upon velocity averaging to determine disk velocity. Due to velocity averaging the Thrust Model may be unrelated to either and breaks the assumptions on which both are based in terms of power extractable from a flow based on kinetic energy limits. This is not the case. The Thrust Model is an extension of Rankine–Froude’s Theory and Betz’ Law to confined flows using body forces at the disk instead of averaging external velocities. The Thrust Model observes all assumptions and parameters on which Rankine–Froude’s and Betz’ models are based. As noted in the AM section, the specific application of β is crucial to the accurate formulation of theory and prediction of experimental behavior.
In a freestream flow, Rankine–Froude’s actuator disk relies upon three velocities to derive disk power, incident (v∞), disk (v1), and resultant (vwake). Pressure drop is calculated from incident to resultant velocities. The disk velocity is the average of the incident and the resultant velocities. Therefore, power is a function of all three velocities. The pressure drop resistance is applied at vwake, as shown by Rankine–Froude’s Equation (4) or equation (28).
The averaging to produce v1 introduces the limitation of half the resistance at the disk. A valid general theory for a confined flow should arrest the flow in the channel when CT = 1. For a confined channel the fluid effects of the extraction are fundamentally different than in the freestream case. The “wake” expansion occurs at the inlet and the wake mixing occurs rearward of the exit. In the Rankine–Froude or Betz model, the expansion occurs around the rotor and the mixing occurs rearward of the wake. AMs interpret this condition for confined channels as a pressure drop from v∞ to vwake independent of the value of β. In confined flow, there is no distinct consequent vwake related to a “wake” area. The vwake condition is coincident with v1 due to mass flow constraints. The normal maximum wake expansion for a given value of CT, vwake, is the velocity within the confined channel, which predicates that the relevant pressure drop velocity is βvwake. Rearward of the confinement this reduced exit velocity mixes with the external “wake” from the intake and the freestream as in the Betz model after the point of maximum expansion. Therefore, in confined flow, there are only two relevant velocities, the incident, and resultant. The introduction of averaging to determine disk velocity therefore introduces conservation violations if applied to the confined channel.
A derivation of Rankine–Froude and Betz wake velocities related to CT shows that the resultant velocity, vwake, the equation is the disk velocity equation of the Thrust Model. When β and r are equal to one, corollary to a tube in the freestream, Equation (10) of the Thrust Model becomes Equation (29).
To compare the Thrust Model to the Rankine–Froude and Betz models, the wake velocity must be derived related to CT. Betz’s Law [9] states that the pressure drop across a free stream turbine can be defined by the dynamic pressure variation between the wake and the freestream. This can be related to CT by pressure drop over freestream dynamic pressure, q∞. Therefore, vwake referred to CT can be derived as follows. Equations (30) and (31) describe the pressure conditions of the incident velocity and the resultant velocity.
Static terms drop out and CT is given by Equation (32) and pressure drop, in terms of freestream and wake dynamic pressure, is given by Equation (33).
Combining Equations (32) and (33) and simplifying results in Equations (34)–(36).
Substituting Equations (30) and (31) for pressure and simplifying in Equations (37)–(40) yields Equation (41).
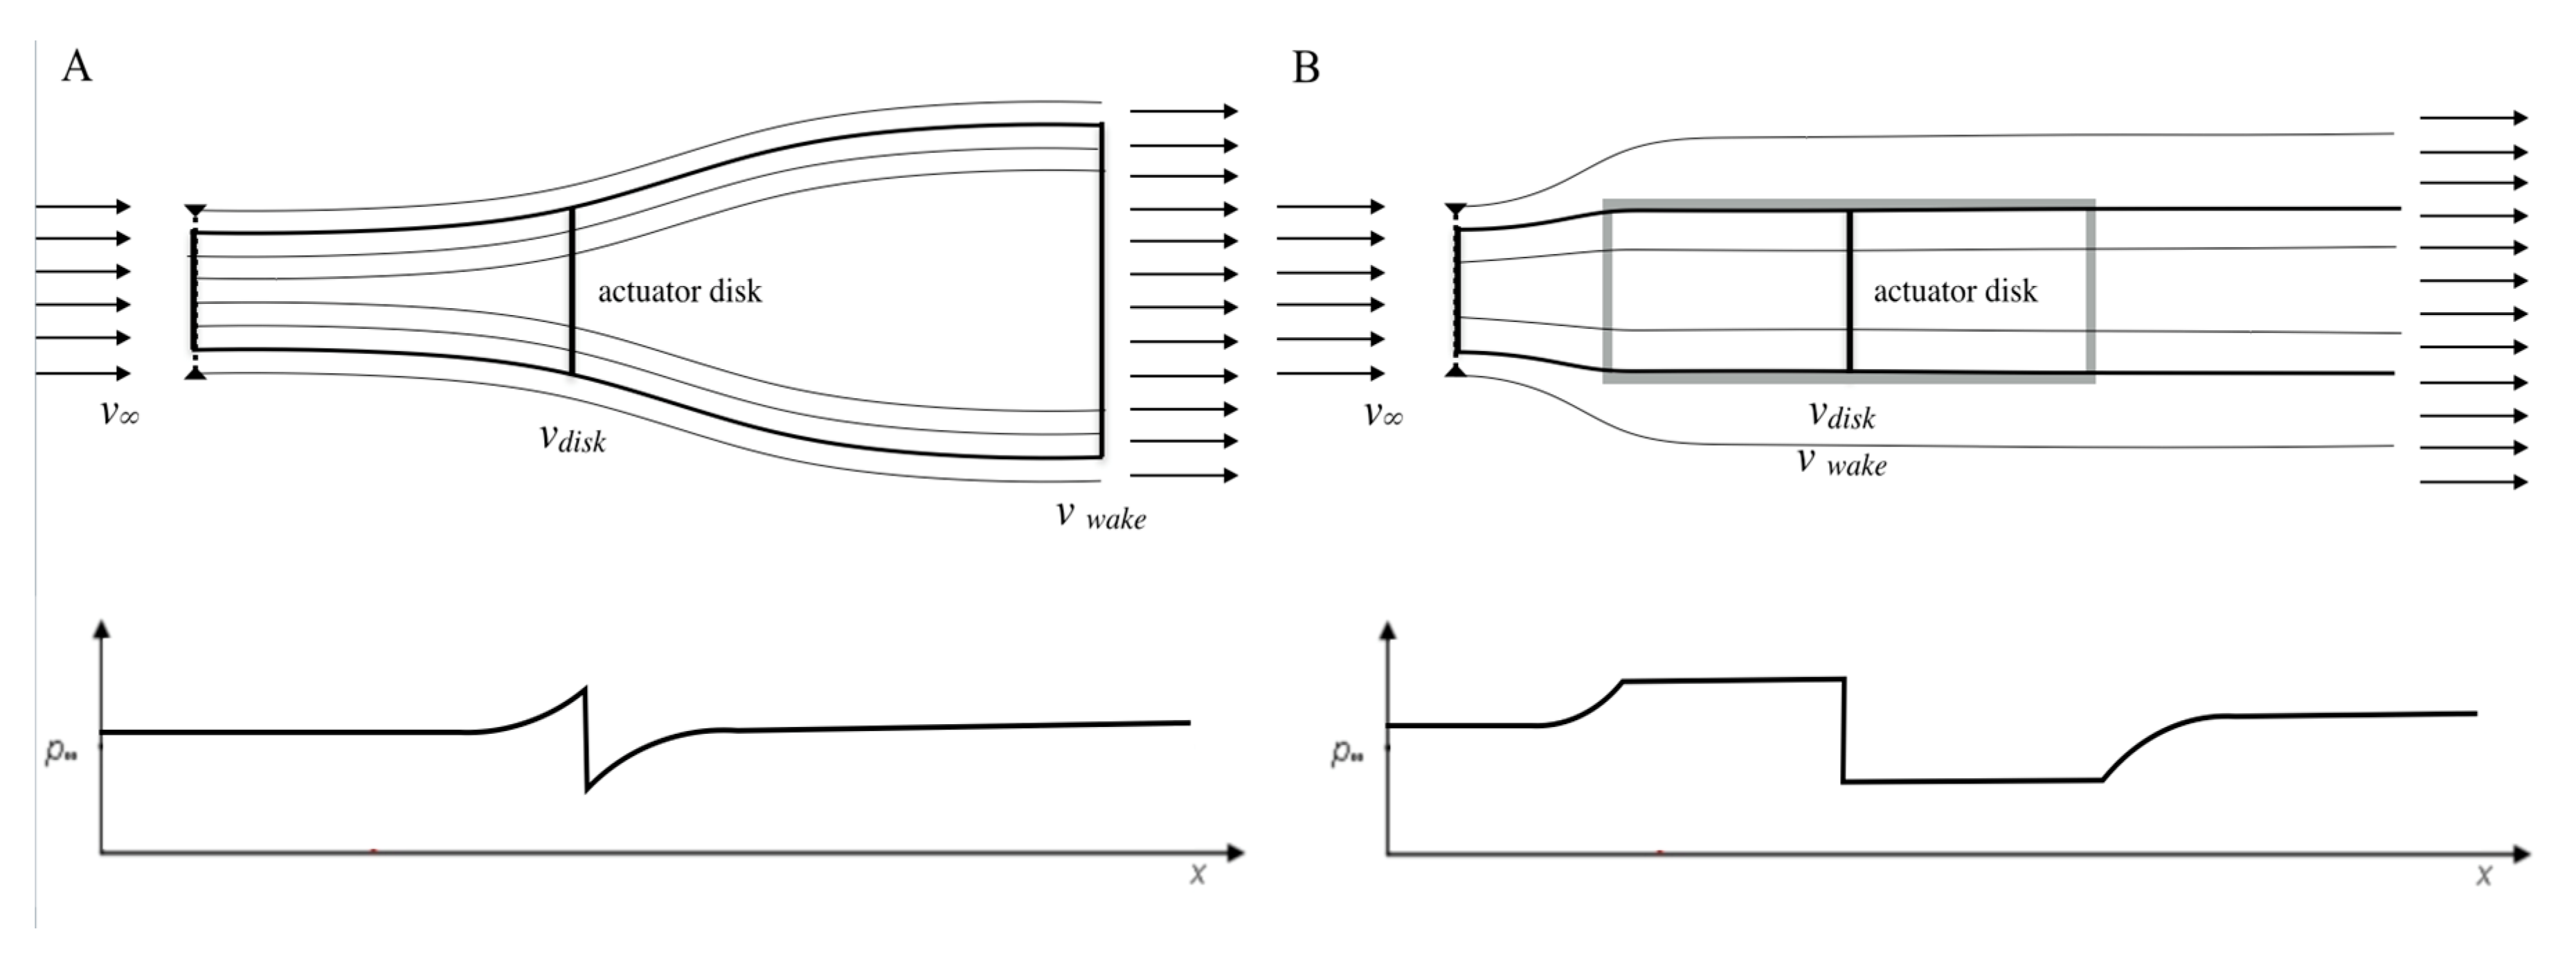
The Rankine–Froude and Betz wake velocity Equation (41) is the same as the Thrust Model disk velocity, shown by Equation (29). This shows that when related to CT, the Thrust Model throat velocity is the same as Rankine–Froude and Betz wake velocity. At this velocity, the streamtube is no longer expanding and is in a confined state. In the Thrust Model, the disk and wake velocities are coincident. This shows the compound reductive effect of the confinement on disk velocity and power. This equation can be brought to 0 m/s at CT = 1. Figure 10 shows the stream tubes of Rankine–Froude and the Thrust Model and the relevant pressure conditions.
As Rankine–Froude and Betz are models for freestream turbines, CT in their models is non-dimensionalized with the freestream velocity. As shown above, the Thrust Model’s uses initial throat velocity to non-dimensionalize the pressure drop to calculate CT, since initial throat velocity is the source of the pressure drop in the Thrust Model. The AMs assert that the pressure drop for a turbine inside of an accelerator occurs in the same way as a freestream turbine. Therefore, AMs use freestream velocity to calculate CT.
By non-dimensionalizing pressure drop with the relevant velocity for the CT calculation the Thrust Model, Rankine–Froude’s theory, Betz’s Law, and the AMs can be compared on the same basis. When non-dimensionalized in this way, all models have an open disk when CT = 0 so that vwake = v∞. When CT = 1 a singularity occurs for all models. When CT = 1, the Thrust Model has 100% disk solidity so v1 and mass flow through the accelerator goes to zero, therefore there is a singularity at the intake as there must be infinite mass flow area expansion at the intake. When CT = 1 for Rankine–Froude and Betz there is a singularity at the wake where there is infinite mass flow area expansion as vwake goes to zero. At this point, the axial induction at the disk is a = 0.5. The AMs contain the same singularity because they assert that the pressure drop is the same as for a freestream turbine.
The fundamental error of preceding attempts to apply Rankine–Froude’s momentum methods to pressure drop in confined flow is the application of β. The Thrust Model pressure drop equation (Equation (22)) can be restated in Rankine–Froude’s form as shown by Equation (42).
v2 is the resultant velocity within the channel after the work is done as in the Rankine–Froude and Betz wake. For ß = 1 the disk velocity is lower than the freestream case and the maximum rotor specific CP is 38% as predicted by the Thrust Model and Lawn’s analytical model. This pressure drop correlates to the difference between the accelerated incident and resultant velocities. As will be shown in comparison to experimental data this yields an accurate pressure drop for a confined disk. As disk velocity cannot be the freestream disk velocity, the relevant velocity at the disk must be the resultant velocity in the channel under mass flow constraints.
4. Discussion
4.1. Comparison of Hypotheses and Experimental Data
The primary determinant of limits for accelerator-extractor pairs is the rate of mass flow rejection due to actuator disk resistance at the throat. AM methods have no mechanism to correctly qualify an experimental accelerator. Equations (43) and (44) show that the Grumman accelerator, as referenced by van Bussel, had available fluid power that at CT = 0 was only marginally greater than the fluid power available to a freestream turbine of the accelerator’s maximum area [10,17].
As noted in Section 1, any validation based on unqualified DAWT experiments would erroneously confirm a limit of roughly the maximum area. Without proper qualification, non-ideal tests cannot validate limits.
Careful consideration is necessary to compare a system like the Thrust Model with systems like the AMs. We present two methods of comparison. The first method bounds the comparison on the same CT mapping basis. The second method non-dimensionalizes the thrust on the extractor with the local disk velocity.
AM and Thrust Results Mapped to CT Boundary of 0–1
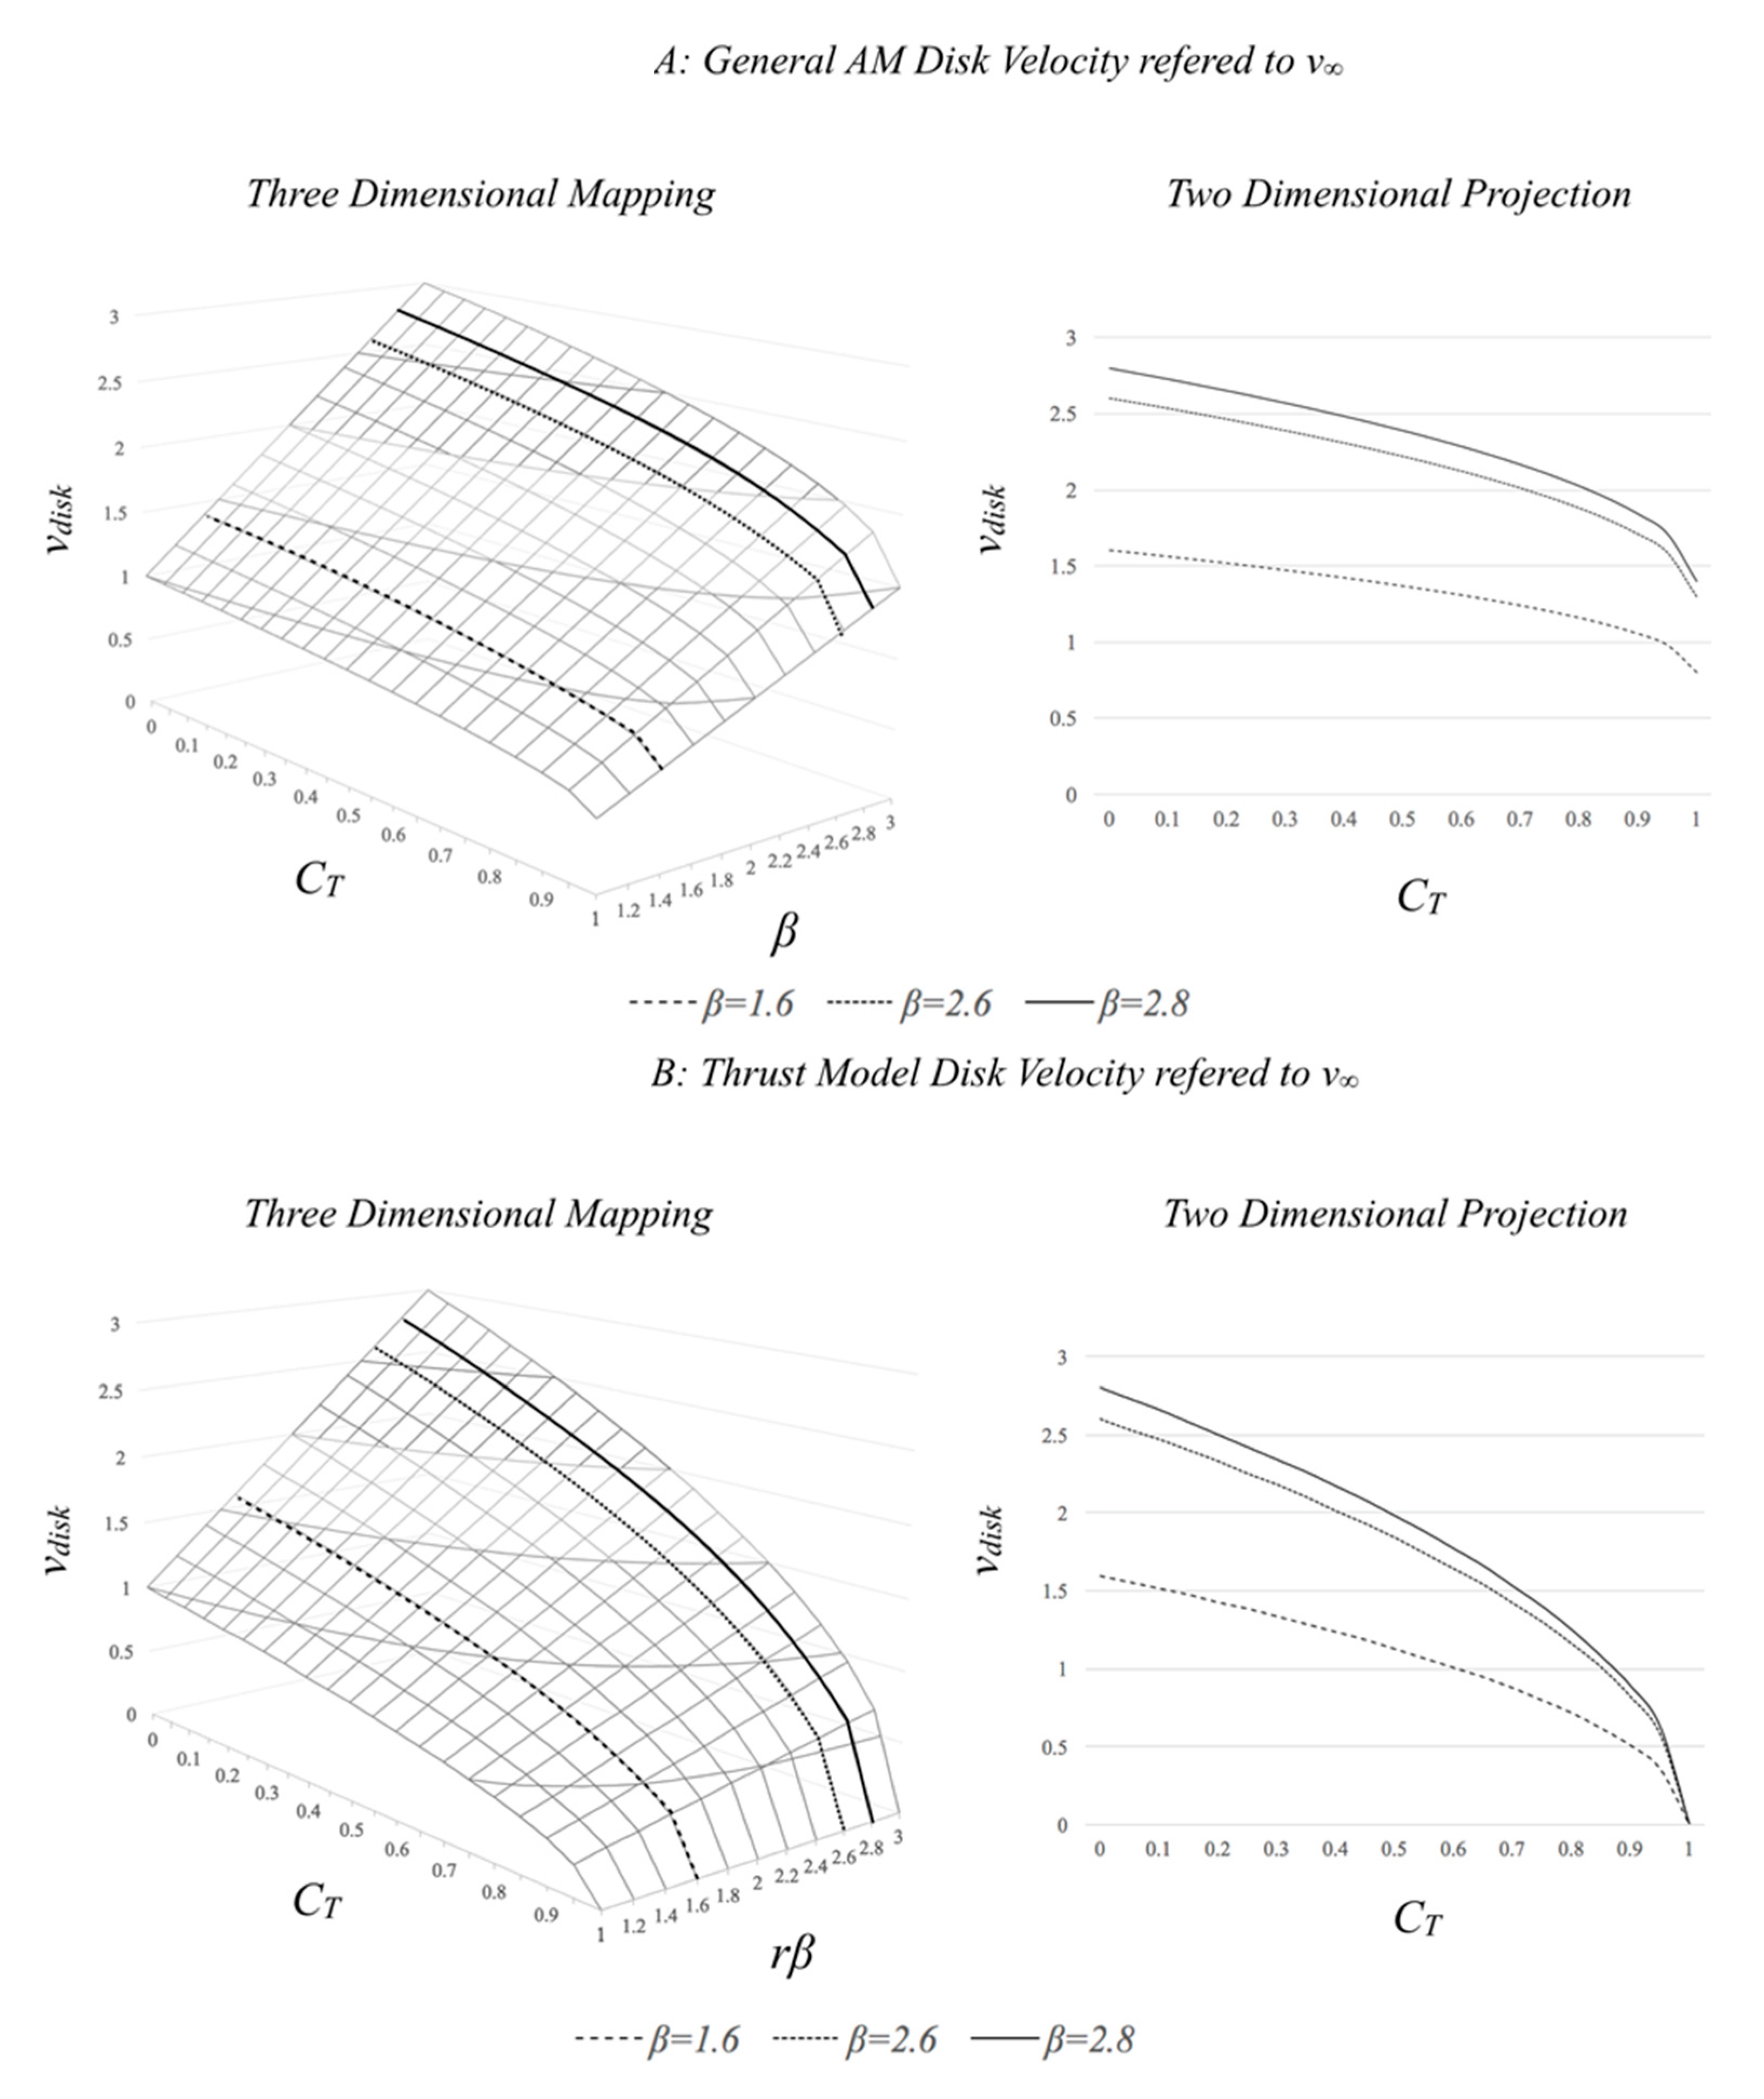
The CT mapping basis is derived from the relations in Section 3. As noted in Section 3, the Thrust Model’s CT in non-dimensionalized in terms of incident throat velocity. Furthermore, the Thrust Model’s disk and wake velocities are coincident. This provides the numerical basis for non-dimensionalized v1 to be varied from zero to one. This is the same basis as the Betz, Rankine–Froude, and AM methods. The Thrust Model requires three-dimensional mapping since it has variation in three independent variables, r, β, and CT. The Betz and Rankine–Froude systems have a single independent variable CT as defined by Equation (41). As the AMs are an extension of the Betz and Rankine–Froude systems, they are univariate in their CP and pressure drop equation. However, the AMs are multivariate in the disk velocity equation due to variation in the β dimension as can be seen in Figure 11A. To compare univariate (Rankine–Froude/Betz), multivariate (Thrust Model), and blended univariate/multivariate systems (AMs) it is a useful visualization to set the same boundary conditions for the two and three-dimensional mapping. The boundary for comparison is established by the bounds of the AM disk velocity, shown in Figure 11A, which has the same bounds as the univariate equations. Figure 11B shows the same boundaries applied to the Thrust Model disk velocity, where the CT is referred to as the incident velocity factor rβ. This can be seen applied to the Thrust Model disk velocity in Figure 11B. Figure 12 is the projection of the three-dimensional mapping along the β axis as shown in Figure 11A,B.
When mapped in three dimensions, the CT domain in the β dimension is bounded by non-dimensionalizing CT to the local value of rβv∞. This maintains the AMs’ frame of reference and allows direct comparison to the Thrust Model in the same CT range. The incident velocity at the disk, rβv∞, is taken to be the relevant velocity for pressure drop and CT. Disk loading remains non-dimensionalized to v∞ (equal to the Betz, Rankine–Froude, and AM CT). In the Thrust Model the CT is related to rβv∞ and the CP, velocity ratio, and disk loading are related to v∞. Therefore, the Thrust Model disk loading predictions diverge from the classical two-dimensional relationship expressed in the Betz, Rankine–Froude, and AM developments where CT and disk loading are the same.
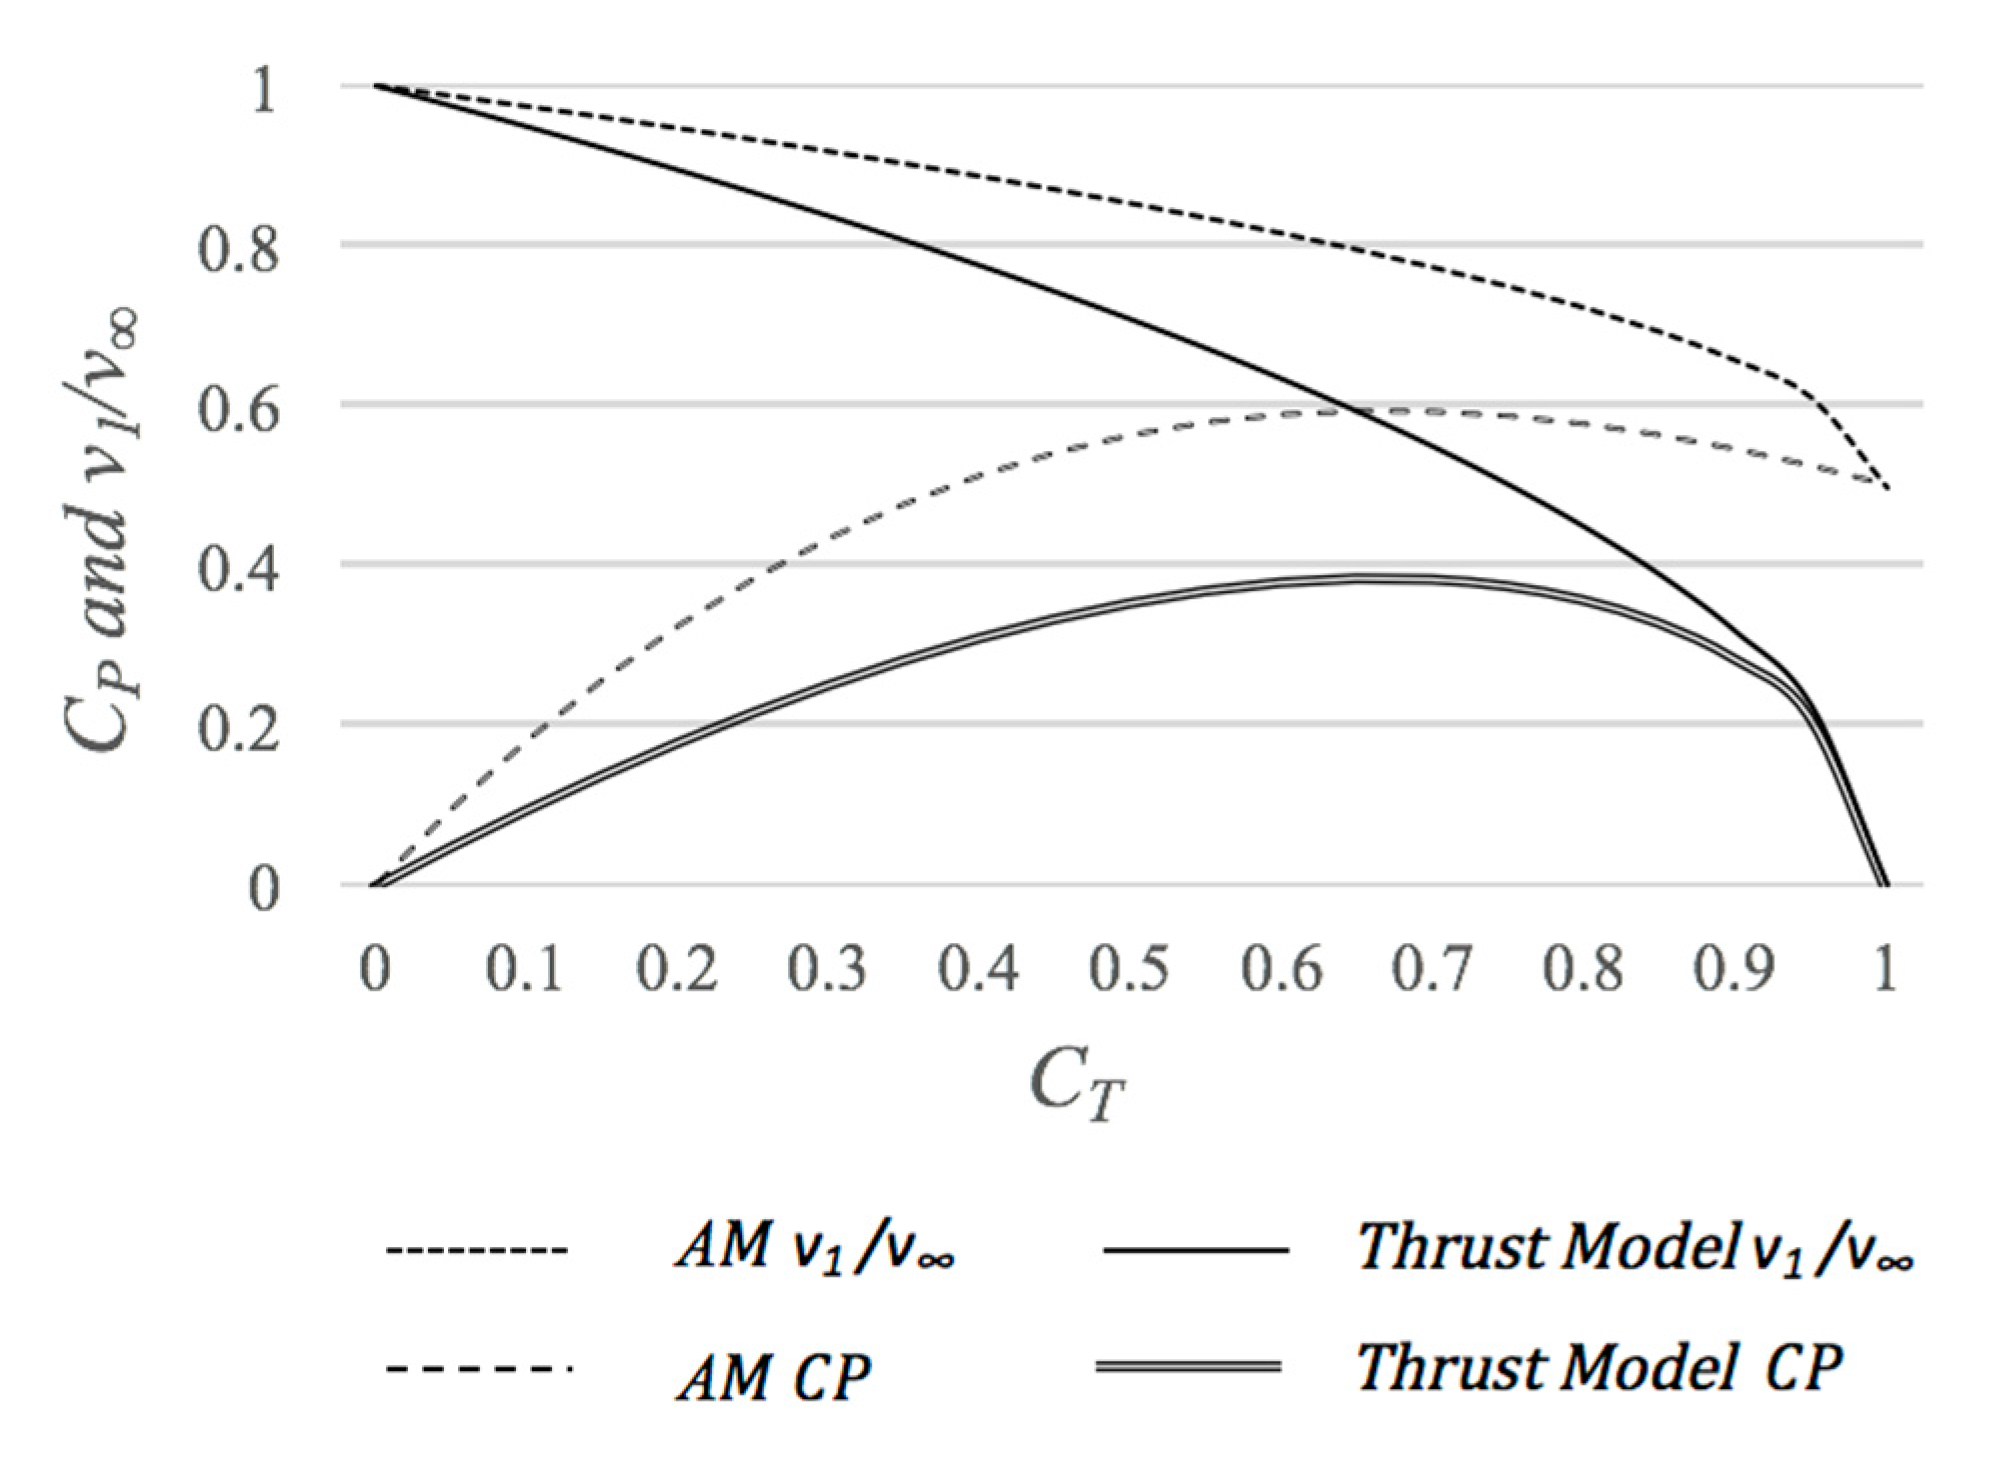
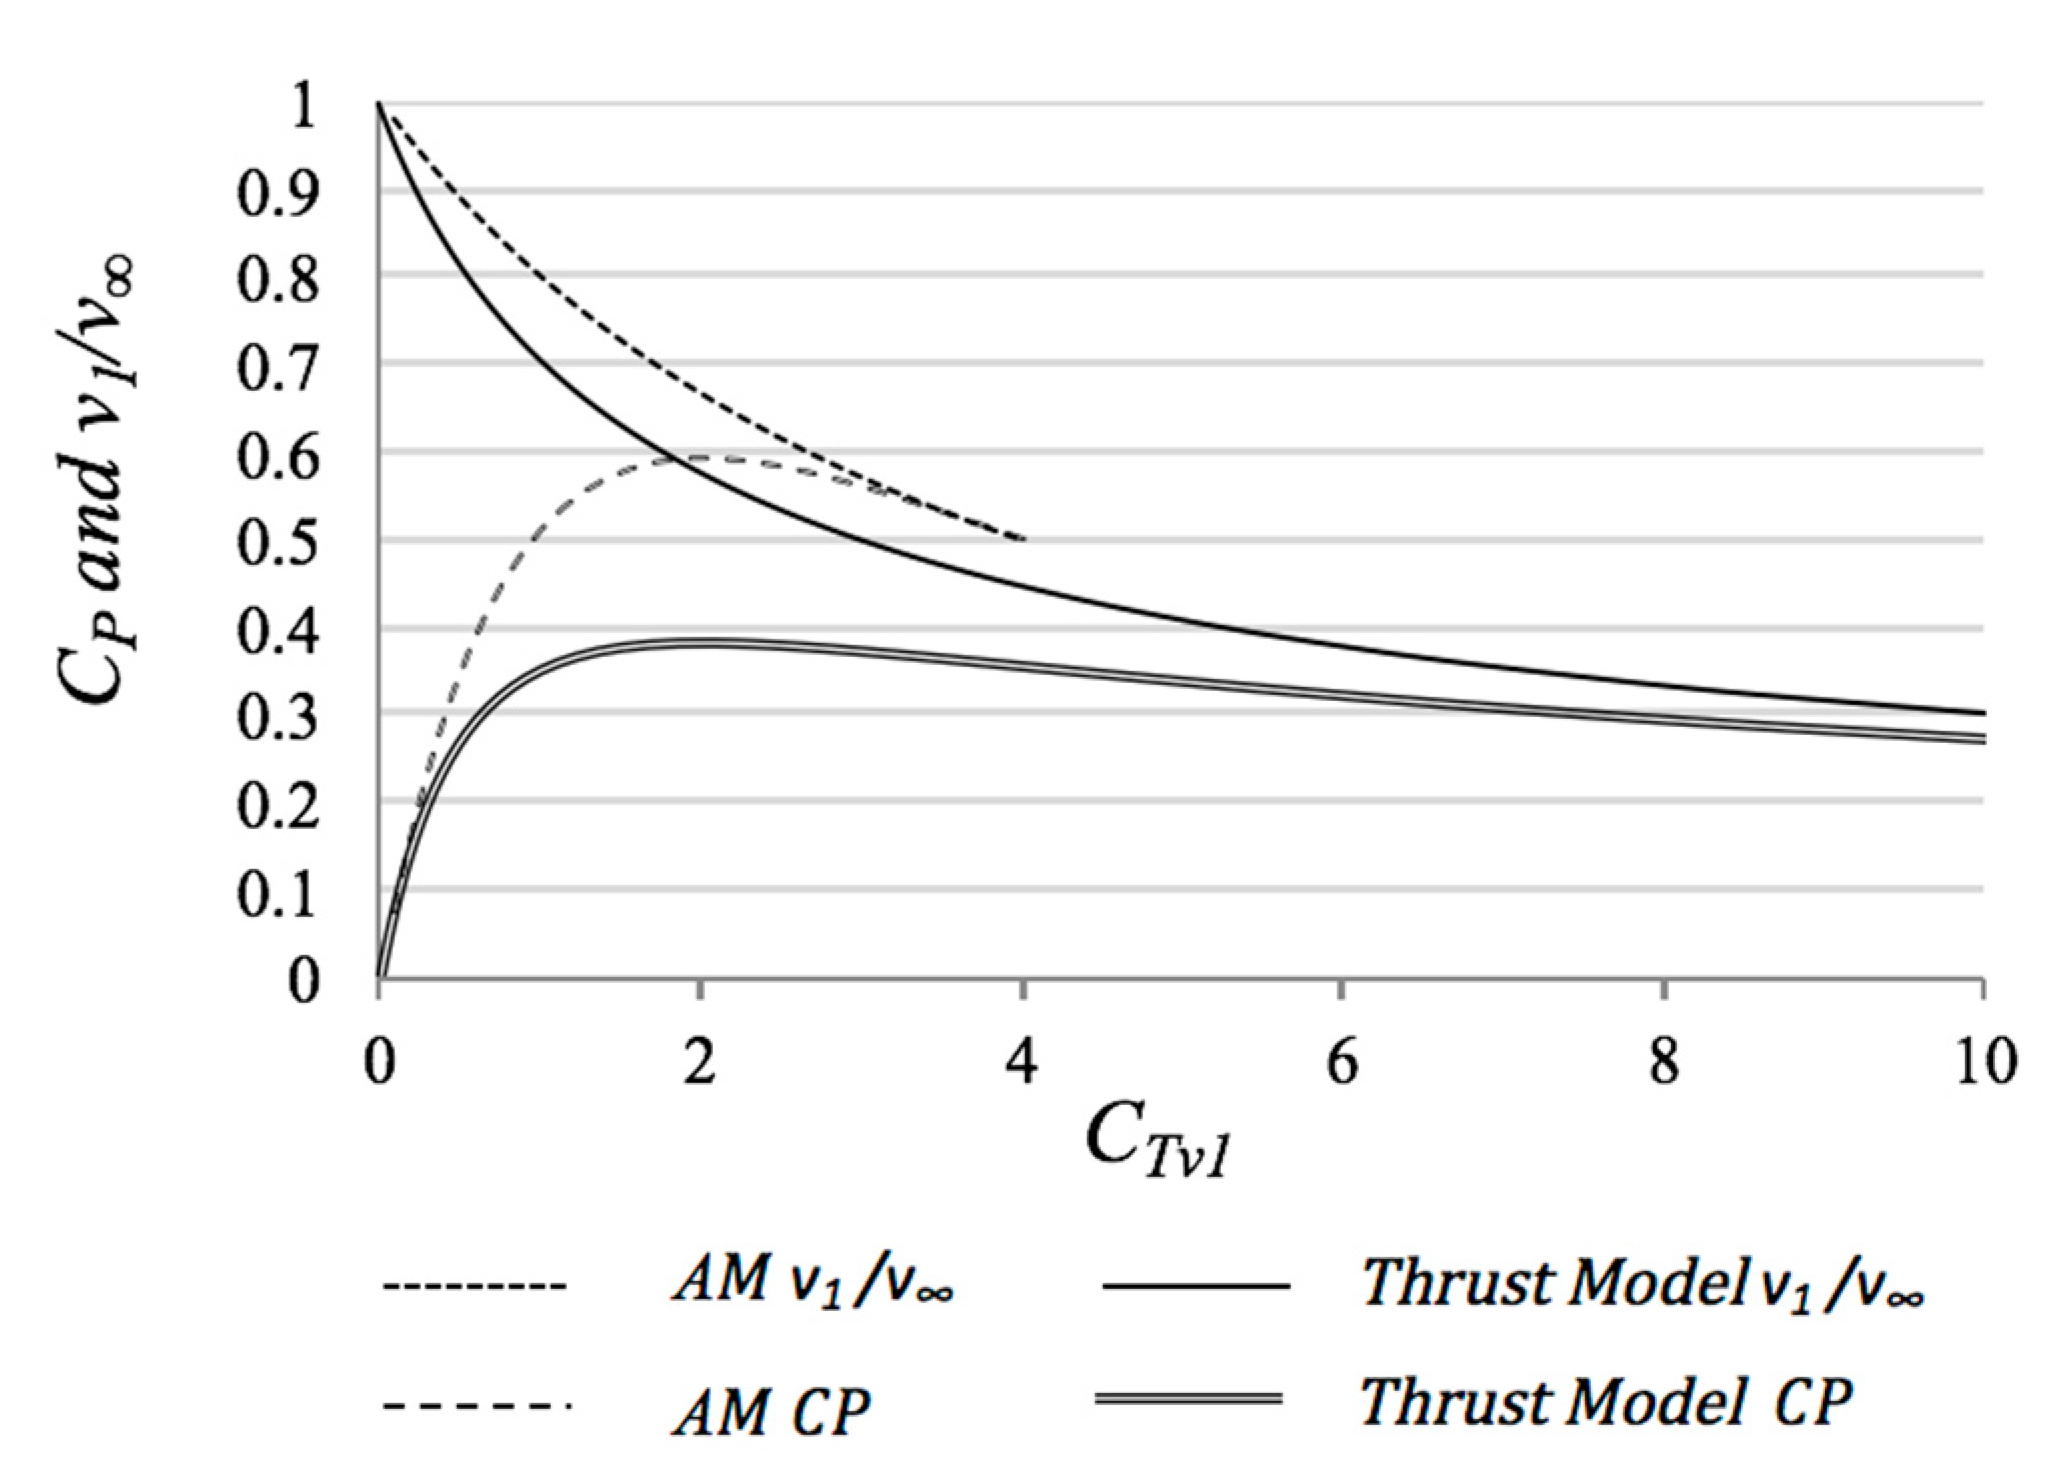
In Figure 12 the tube case is plotted to show the difference in disk velocity (as a ratio of free stream velocity) and CP prediction between AMs and the Thrust Model. In the Thrust Model, when ß = 1 the confined rotor displays roughly a 30% loss in output power due to its confinement. This correlates well with the loss in tube CP shown in Figure 8. No confinement is present in the AMs.
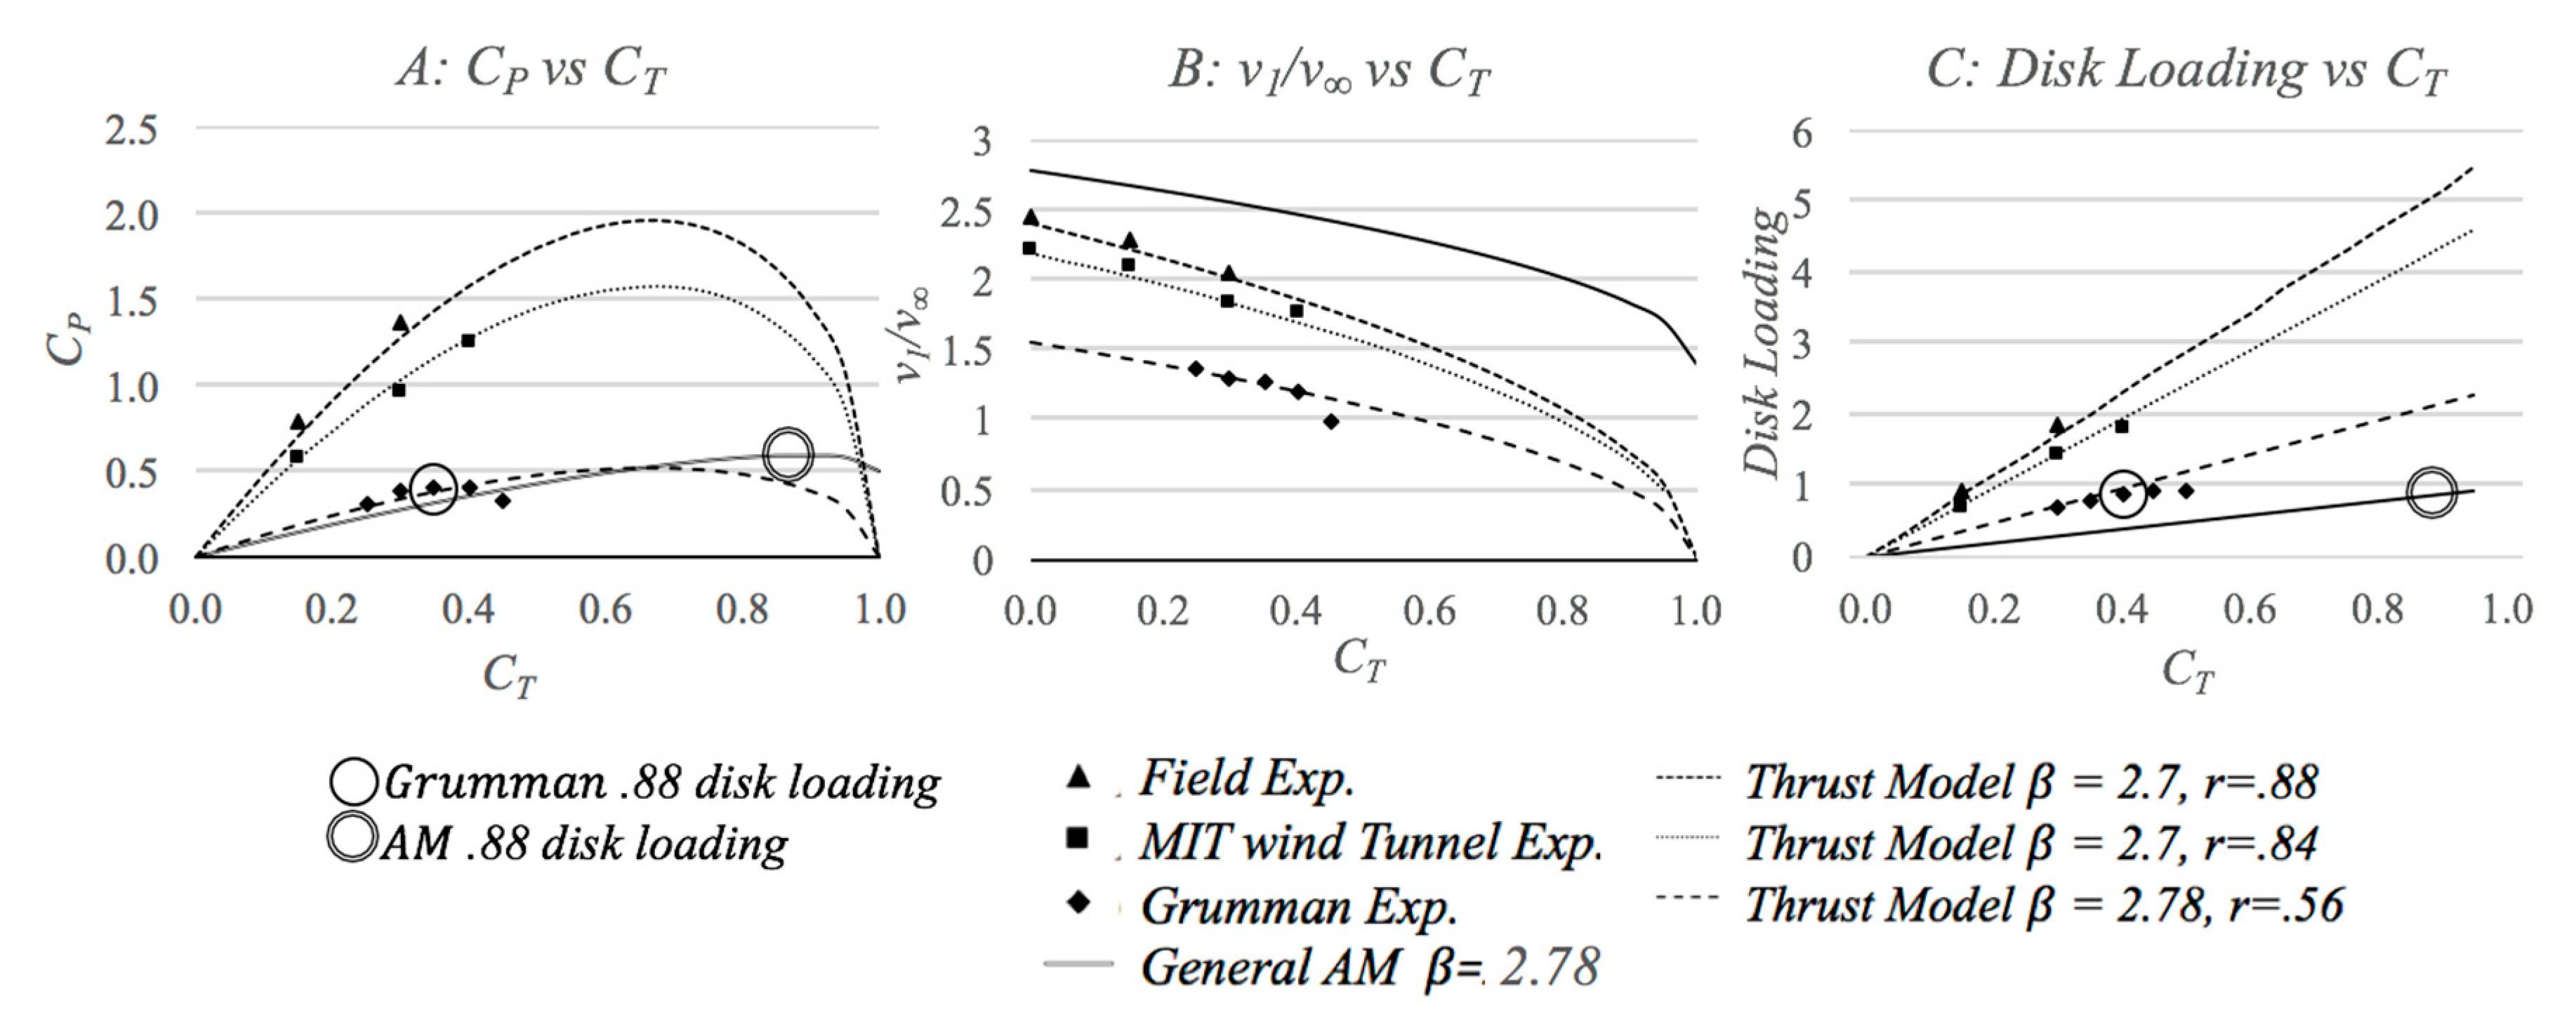
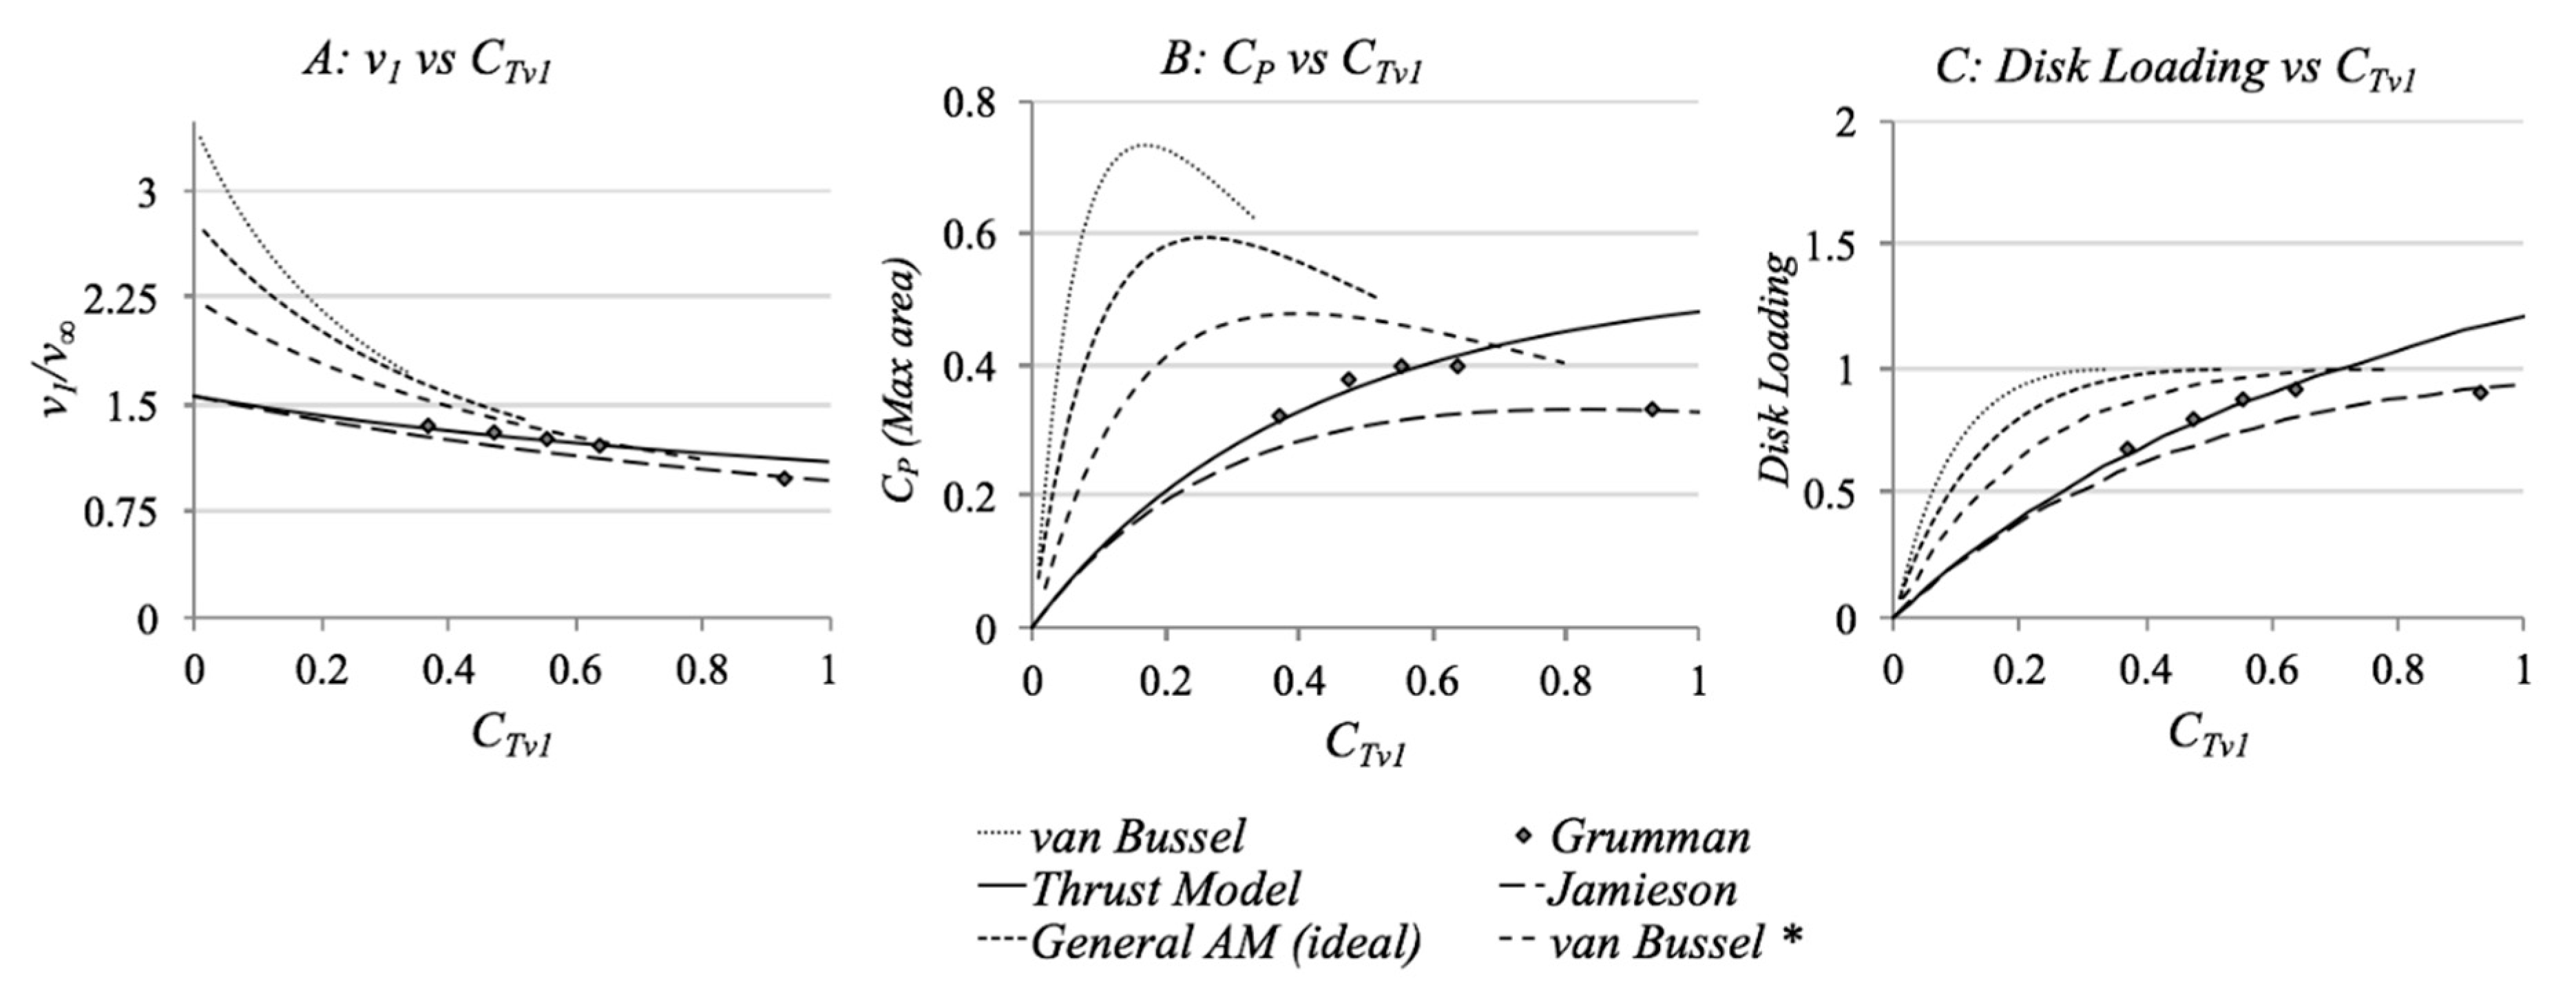
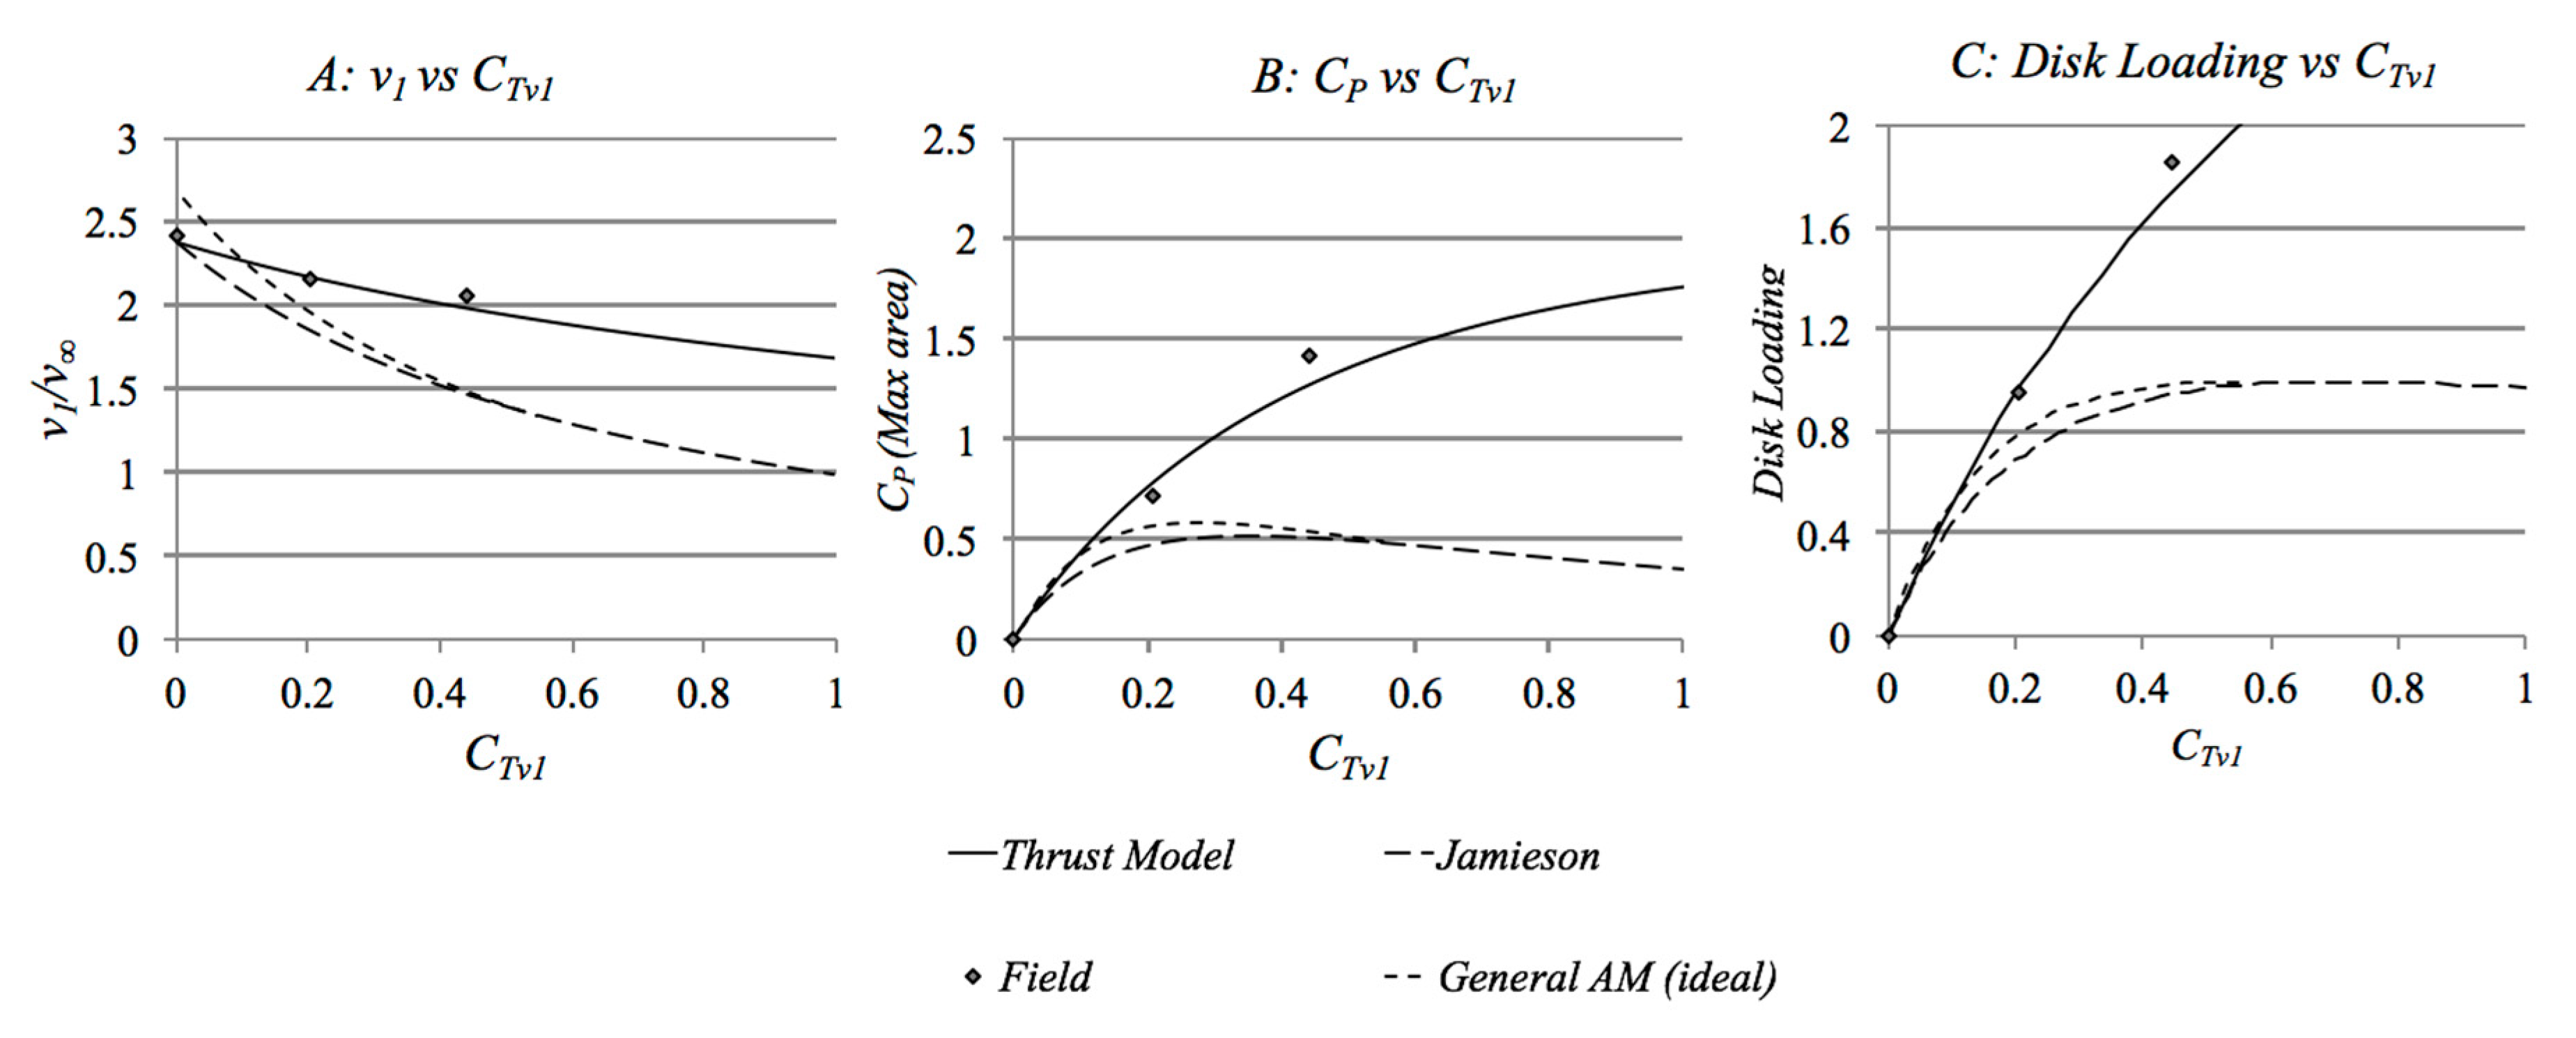
Figure 13A–C show experimental results projected into the 2D. These figures show that it is insufficient to base any validation solely on CP without a means to qualify said CP. Validation requires the prediction of CP and disk velocity and pressure drop to ensure a given hypothesis is accurate in its representation of physical conditions.
Figure 13A–C also demonstrates the level of predictive error for the AM and the Thrust Model when the models are compared to the more efficient class of accelerators tested at MIT and in the field. As noted, these accelerators have significantly higher efficiencies than the Grumman DAWT. The experiments were performed with screens to represent uniform power extraction as in the Grumman experiments. The accelerator’s baseline acceleration rates were 2.4 v∞, r = 0.88 in the field, and 2.2v∞, r = 0.84 in the wind tunnel. The effect of r on power output is non-linear. As noted above Grumman reported a baseline velocity of 1.56v∞, r = ~0.56, for their 30-degree diffuser [10,17].
Figure 13A shows that the AMs appear to match the Grumman CP curve reasonably well, assuming losses. Further examination of van Bussel’s notes [9] on disk loading and the corollary velocity and disk loading conditions his model predicts, Figure 13B,C, shows the AM predictions do not match experiments. The 0.88 disk loading value noted as evidentiary by van Bussel is not at a concurrent performance level to the experiment. Two different CP conditions are conflated, shown in Figure 13A, AMs yielding 0.88 disk loading at 59.3% CP and Grumman experiments yielding 0.88 disk loading at 40% CP [10,11]. The component variable predictions elucidate the problems with AMs. The general ideal AM model over-predicts Grumman velocity data by a factor of almost two. The inclusion of van Bussel’s backpressure would increase the error in AM’s predicted velocity. Jamieson and WP can account for the velocity discrepancy of the general AM by use of their variables a0 and CS, respectively. If van Bussel’s γ was inverted, it would serve a similar function as the other AM authors correction for inefficient accelerators. Disk loading in the general AM is under-predicted by a factor of two in the Grumman case and does not vary with velocity. Jamieson’s and WP’s ability to correct for inefficient accelerator design would only render a further under-prediction of pressure drop. For the higher efficiency accelerators, the AMs’ pressure drop error is more significant. Simultaneous large over-prediction and under-prediction illustrate the foundational flaws in the AMs.
4.2. Potential Limitations
Field testing and wind tunnel testing are the first steps toward validating the Thrust Model. More extensive testing with further instrumentation at all relevant stations described in the model is required to properly validate the Thrust Model’s predictive accuracy. Such a complete data set on any accelerator is absent in the published prior art. Comparison to prior experimental data is especially useful in the case of the Grumman DAWT. The Thrust Model’s accurate prediction of the Grumman experimental results, when taken in combination with the low error predictions on the new experimental data, suggests that the Thrust model is likely accurate for uniform extraction. The Thrust Model predicts other published DAWT data well. Unfortunately, this data is either restricted to CP data or lacks the requisite velocity data when CT = 0. The lack of the initial state and a complete set of component variables makes any correlation questionable given the narrow range of DAWT performance (r = 0.4–0.6). In all prior work other than Grumman and Phillips, the r and CPdisk variables must be estimated so the results are essentially fitted to CP in the absence of a full set of component variables.
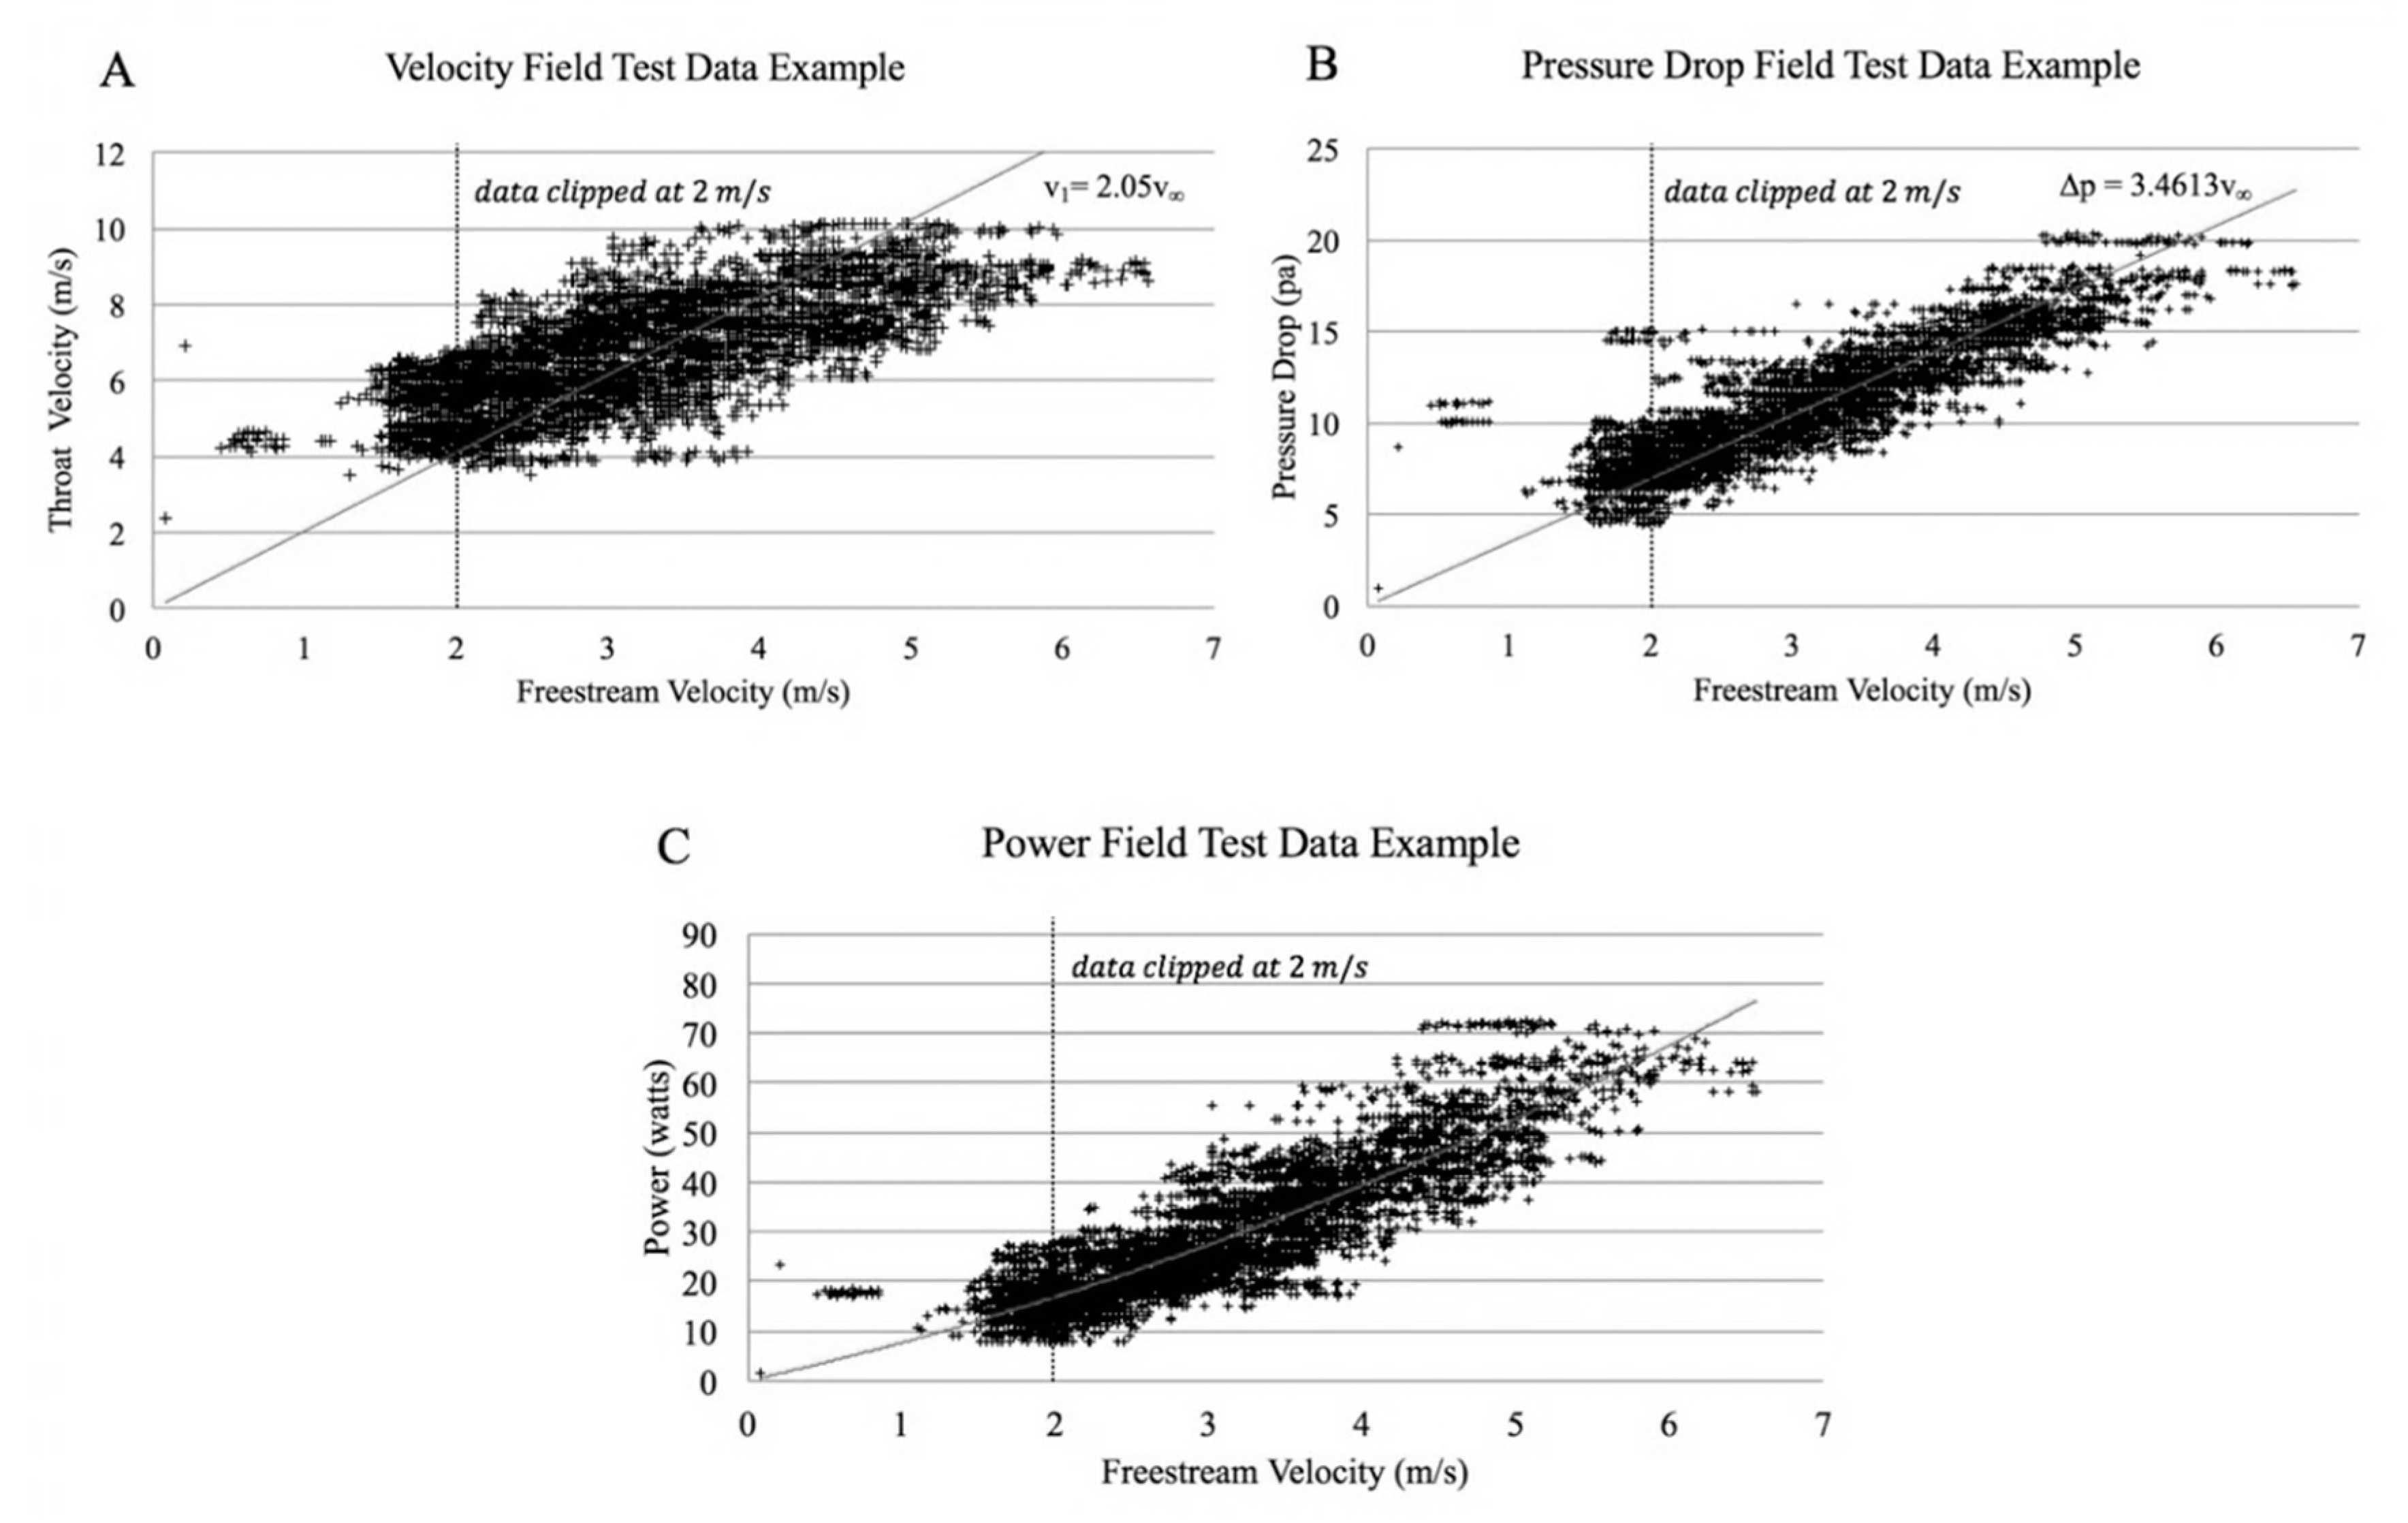
An interesting result of the field testing and MIT wind tunnel testing is the respective 1.4 and 1.2 system CP. This result implies the highest known system CP provided the data is valid. This system CP and the component variable measurements defies the prior AMs. In terms of experimental accuracy, the tests performed in the field had complete instrumentation. Figure 14A–C shows a representative data set for the raw velocity data, pressure drop data, and power respectively for the 24.5% solidity screen test. The line in Figure 14A–C shows the best fit line with the Y-Intercept = 0. As testing was performed in the field the fluctuations are not surprising. The data set’s system CP for the 24.5% screen had a standard deviation of 0.579 based on the product of throat area, sample pressure, and sample velocity results compared to ideal power available at the intake based on ambient velocity. Despite the fluctuations, even if the −1σ are used for this data set, the 24% screen implies a minimum of 0.79 CP. This shows that the data shows with 68% certainty that this device could exceed the Betz Limit. More testing should be performed in more steady winds or in a wind tunnel to reduce the standard deviation.
Ambient velocities below 2 m/s led to very high multiples of power. Therefore, the data for ambient velocities below 2 m/s was clipped. The mean values of power were taken as the arithmetic means of each sample’s product u1 and Δp. These samples do include samples for which the axial orientation of the nozzle was off-center because the nozzle was manually oriented. Qualitatively, the accelerators perform well to 20° off-center, but the complete analysis is needed to determine what losses the manual orientation could have caused. For these reasons, even though there was some fluctuation in data, the results should illustrate the non-optimal performance of the ducted turbine. More testing could be performed on other efficient turbine designs to further validate the experiments.
As noted, the field testing was performed with screens at the throat to represent uniform power extraction. This method has been used by others like Grumman [17] and has been shown to provide an accurate representation of power extraction by Phillips [13]. Non-uniformity and non-ideal extraction may reduce extractable power as predicted by actuator disks and screen data.
Both the field testing and the wind tunnel testing done in the MIT wind tunnel suggest similar CP’s. The wind tunnel tests are limited because the screens were placed at the exit instead of at the throat. The resistance is experienced at the screen which covered the entirety of the exit. Therefore, the velocity is reduced before the screen. This is translated by mass flow conservation to the reduced throat velocity related to and mass rejection at the inlet. Therefore, the velocity does not have a limitation. The limitation is present for the pressure drop, as it did not occur at the throat but the exit plane, and therefore must be related to the throat theoretically. The field testing demonstrates that the pressure drop occurs at the relevant velocity, and thus the pressure drop can be translated from the exit to throat plane based on the relevant β. The experimental data sets support each other. However, wind tunnel tests with a screen at the throat would further support the findings presented herein.
The Thrust Model has limitations similar to Betz’s Law. Like Betz’s Law, the Thrust Model assumes incompressible flow, uniform disk loading across an infinitely thin disk, and 1-D simplifications. Like Betz’s Law which should only be considered valid for freestream flow, the Thrust Model is only applicable to unpressurized confined flow, in which confinement is present in the freestream but is open on each end. A weighted coefficient could adjust either’s results, but post derivation. Unifying the theories with correction coefficients serves little purpose scientifically or predictively. The Thrust Model has been shown by us to be mathematically and experimentally correct when compared to third-party tests, like Grumman and MIT, as well as testing performed by the authors. The tests show that the theory works well for actuator disk extraction inside of accelerators. Its applicability to propellers has not yet been investigated. Due to the added energy required for a propeller, it is unlikely that the Thrust Model’s passive technique would directly apply to propellers. The experiments demonstrate that the pressure drop occurs at the accelerated throat velocity. Provided that the product of pressure drop and velocity at which the pressure drop occurs is the power, the Thrust Model demonstrates that significant power increases are available for ducted wind turbines over standard wind turbines.
The tested 0.72 and 1.37 system field CP’s and 0.96 and 1.25 wind tunnel CP’s are more than all other wind power in the art. This agrees well with the increase in the efficiency of the new accelerators over previously tested accelerators. To turn that result into real power, a pure uniform extractor would be required. Non-uniform power extraction will likely create added losses that would reduce the realized power multiple. There are likely different limits for different extractor device types. The Thrust Model implies that efficient high-rate acceleration could create significant power increases based on the frontal area system CP.
5. Conclusions
The AM hypotheses are invalid because they incorrectly apply Rankine–Froude and Betz’s velocity averaging methods to passive accelerators without satisfying the assumptions of Betz’s Law. AMs exhibit inverse predictive error sufficient to disprove the hypotheses and contain violations of continuity. The pressure drop across a uniform resistance measured in experiments occurs at the accelerated local velocity, not at the external velocity average used by AMs. The rate of velocity reduction at the inlet occurs at a greater rate than AMs predict. Due to the use of external velocity averaging, the AMs’ equations disregard the effects of the accelerator.
The Thrust Model closely predicts uniform power extraction in confined channels, matching experimental data. Further work and more complete instrumentation is required to validate the theory. The Thrust Model shows that the disk specific maximum CP for a confined channel is 38% of the power available to the disk, significantly lower than the 59% Betz freestream limit yielded by AMs when β equals one.
CP limits for accelerators are a function of r and β. The Thrust Model shows the CP performance of a high-efficiency accelerator increases with increased β. This is a novel result critical to informing future RD paths.
The qualification of specific experimental accelerators by the Thrust Model in this work shows that RD efforts in this area have been unproductive due to the absence of benchmarking methods for accelerators. For an accelerator design to justify the research, the efficiency must be sufficient in the empty state (CT = 0) to exceed the power of a freestream turbine of the same maximum frontal area. Equation (45) shows the minimum baseline efficiency for a given accelerator to justify the presence of an accelerator.
The Wind Lens [19] is the only DAWT that may have met this benchmark. When qualified, DAWTs, except the Wind Lens, have less available power than the Betz limit of a freestream turbine of their maximum area. The high-efficiency accelerator designs, tested in the field and the MIT wind tunnel, significantly surpass all DAWTs as shown by Figure 13, Figure A4 and Figure A7. (See Appendix A).
The result of having a system CP greater than one is of interest. With a system CP greater than one, the system would extract more energy than the kinetic energy in the streamtube of the maximum area of the accelerator projected forward. This phenomenon seems to contradict the assumption in ideal incompressible external fluid dynamics, that the only power available for extraction is the kinetic energy in the flow of the maximum frontal area projected forward. The mathematics and laws of continuity contradict the validity of that assumption. While not mathematically supported to date this prior assumption can, but should not be ignored due to its pervasiveness in the art. Several possible explanations could resolve these contradictions.
The accelerator extractor pair could draw kinetic energy from an area greater than its frontal area. This could be likened to an object, like a flat plate, which has a coefficient of drag greater than one. This larger area would be related to Equation (27) above. This larger area could be referenced to mass flow or pressure or a combination of the two. In this way the flow is non-ideal.
The second explanation in field testing could be related to local pressure gradients, causing gusts, lulls, and transient effects. With field testing, fluctuations in wind speed are expected and for this reason, many data sets were taken. Due to the extensive testing time, the local pressure gradients and velocity variations should not have significantly affected results. However, more testing needs to be done to confirm these results.
Due to the combination of confined (internal flow) and freestream (external flow) phenomena, the inherent assumptions based on freestream kinetic energy may be incorrect. The local pressure variations caused by the accelerator suggest that kinetic energy assumptions assigned for steady-state velocity driven, incompressible, and ideal flow may not be valid.
The standard assumption that the power is limited to the ideal kinetic energy of the frontal area could be true. However, this assumption is what the AMs are predicated upon and leads to AMs’ discontinuities. Furthermore, this would require that the field, MIT, and Grumman testing was incorrect. The use of actuator disk theory inside of a duct could be misapplied, however, this is also unlikely due to Phillips and Grumman’s research. For these reasons, the thrust model predictions have been confirmed with three experimental data sets. For two of these, the authors were not involved in the experiments, MIT and Grumman. The Thrust Model should be applied to more experimental data. However, complete data sets, which include uniform extraction at the throat and baseline accelerator performance, are unavailable in the art.
The flow could cease to be incompressible at the points of extraction, but this is unlikely due to the low speeds. This analysis assumes incompressible flow; therefore, density is assumed to be constant.
More research is required to determine if there is another cause for these apparent contradictions. Further work is necessary to determine accelerators’ optimal performance for non-uniform power extraction, the optimal form of the technology, and the deployed power density of actual systems which is dependent on the specific axial induction to CP ratio, wake recovery length, and machine separation. Preliminarily, the Thrust Model’s CP predictions and the new experimental evidence show that passive acceleration can produce large increases in uniformly extracted fluid power. Acceleration technology applied to fluid resources could radically expand the technical potential and siting opportunities for peaking wind energy and baseload freestream hydropower. The findings in this paper show that acceleration could constitute a crucial and, as yet untapped, enabling technology for large scale fossil fuel offsets to combat climate change.
6. Patents
The research is partially a result of work for the U.S. Army. The following awarded patents are related to the research above:
- PAT. NO.10,408,189; Efficient systems and methods for the construction and operation of mobile wind power platforms.
- PAT. NO.9,709,028; Efficient systems and methods for the construction and operation of mobile wind power platforms.
- PAT. NO.8,937,399; Efficient systems and methods for the construction and operation of mobile wind power platforms.
- PAT. NO.8,598,730; Modular array wind energy nozzles with truncated catenoidal curvature to facilitate airflow.
- PAT. NO.8,482,146; Efficient systems and methods for the construction and operation of accelerating machines.
- PAT. NO.8,395,276; Modular array wind energy nozzle with increased throughput.
- PAT. NO.8,178,990; Wind power nozzle with increased throughput.
- PAT. NO.8,089,173; Wind power nozzle with optimized intake length.
- PAT. NO.7,804,186; Modular array fluid flow energy conversion facility
Author Contributions
Conceptualization, R.F. and B.K.; methodology, R.F. and B.K.; software, R.F. and B.K.; validation, R.F., B.K., and S.P.; formal analysis, R.F. and B.K.; investigation, R.F., B.K., and S.P.; resources, R.F., B.K., and S.P.; data curation, R.F. and B.K.; writing—original draft preparation, R.F. and S.P.; writing—review and editing, S.P.; visualization, S.P.; supervision, R.F.; project administration, R.F.; funding acquisition, R.F. All authors have read and agreed to the published version of the manuscript.
Funding
This research was partially funded by the US Army under contract number W911QY-3-C-0054.
Acknowledgments
The authors would like to acknowledge the work of S. Widnall and S. Gomez for their independent research at the Wright Bros on the accelerator arrays designed by the authors. Thanks to S. Widnall for the review of the prior art analysis and Thrust model derivation.
Conflicts of Interest
The authors declare no conflict of interest.
Nomenclature
| β | Area Ratio |
| Δp | Pressure drop across extractor |
| ρ | Density |
| a | Axial Induction |
| A1 | Throat area in front of extractor/Area of extractor |
| A2 | Throat area behind extractor |
| A3 | Diffuser exit area |
| Adisk | Area of disk |
| Aeffective | Effective area of the device presented to the freestream flow |
| Ain | Inlet area |
| Amax | Maximum frontal Area of Diffuser |
| CP | Coefficient of Power |
| CPsystem | Coefficient of Power of max area |
| CPdisk | Coefficient of Power of disk |
| CS | Shroud Force Coefficient used by Werle and Presz |
| CT | Coefficient of Thrust |
| CTv1 | Coefficient of Thrust non-dimensionalized by disk velocity |
| F1o | Force available at the throat without extraction |
| F1extracted | Force extracted at throat |
| F1remaining | Force not extracted |
| Fs | Shroud force variable used by Werle and Presz |
| p∞ | Freestream static pressure |
| p1 | Throat static pressure in front of extractor |
| p2 | Throat static pressure behind extractor |
| p3 | Diffuser exit static pressure |
| pin | Static pressure at inlet |
| ptot | Total pressure |
| pwake | Wake static pressure |
| P | Power |
| PBetz | Power predicted by Betz’s law |
| PAM | Power predicted by Averaging Methods |
| Paccelerator | Power available for an accelerator |
| Pavailable | Power available |
| Pavailable,o | Initial Power available |
| Pfreestream | Power available for a free stream turbine |
| q∞ | Freestream dynamic pressure |
| qwake | Wake dynamic pressure |
| r | Accelerator efficiency |
| rGrumman | Accelerator efficiency of the Grumman DAWT |
| TSR | Tip Speed Ratio |
| v∞ | Freestream velocity |
| v1 | Throat velocity in front of extractor, ‘Disk Velocity’ |
| v1o | Initial Throat Velocity with no extractor present |
| v2 | Throat velocity behind extractor |
| v3 | Diffuser exit velocity |
| vdisk | Velocity at disk |
| vin | Inlet velocity |
| vwake | Wake velocity |
Appendix A
Appendix A.1. Specifics of AM Methods and Other Theories
In terms of the fundamental averaging equations, there is little difference between the AMs. The axial induction forms of the Betz averaging equations found in the AMs are Equations (A1) and (A2) below. Regardless of the variables used by the prior hypotheses, the respective equation systems simplify the general AM system described above. The AMs require an accelerator to have an efficiency greater than one to exceed the Betz Limit of the accelerator’s frontal area. Of the previous theorists, only van Bussel addresses the maximum area and presents backpressure as a means to exceed ideal accelerator efficiency. Jamieson and WP do not estimate system efficiency, performance, or potential. Their analyses are restricted to the rotor area and characterize performance independent of the maximum area correction.
Appendix A.1.1. AM Method 1: van Bussel
Van Bussel [10] derives velocity conditions in the accelerator in his Equations (2), (5), and (7)–(10). This velocity development relates the throat velocity to the exit velocity based on the axial induction. The pressure drop across a turbine in an accelerator is given by van Bussel’s Equation (13) or equation A3. The pressure drop across p2 and p1 does not use the flow variables in the accelerator, but is derived from the axial induction, and thereby freestream and wake velocities.
The axial induction is calculated based on the averaging of freestream and wake velocities, like Betz’s Law. Van Bussel explicitly demonstrates his use of averaging in his specification of axial induction, “the axial induction factor a is defined at the exit of the diffuser. Just as in an ordinary wind turbine momentum theory this induction is half the induction factor found in the far wake behind the DAWT.” [10]
This averaging is inherent to the derivation of the axial induction form of the Betz disk and wake velocity equations. The presence of these variables shows that van Bussel’s method has the general AM errors inherent to the averaging. Additionally, the application of β to the induction terms is improper as induction should be calculated by applying β to velocity within the squared term as noted in the general AM discussion. Applying β in van Bussel’s way serves to eliminate it from the axial induction equations as is noted in the analysis of the explicit equations described in the AM section. Van Bussel’s Equations (11) and (12), or Equations (A3) and (A4), reduce to the general AM pressure drop or Betz equation without any nozzle variables or confinement of the rotor.
This yields van Bussel’s CP equations. Van Bussel’s Equations (14) and (15), or Equations (A6) and (A7), relate CP to the throat and exit, respectively, wherein the nozzle has been effectively eliminated from the pressure drop component. This yields the AM general result of the maximum limit being the Betz limit of the exit, as shown by van Bussel’s Equation (15) or equation A7.
As can be seen in van Bussel’s Equation (15) or equation (A7), van Bussel’s development states that an accelerator can only exceed the equivalent freestream turbine if γ is greater than one. This use of backpressure is characteristic of active systems wherein choking the throat of a nozzle is the objective. The increased backpressure of DAWTs has not led to improved performance because increasing fluid velocity through backpressure requires the addition of energy. High backpressure is a sign of poor accelerative efficiency in passive systems and should not be an object of accelerator design.
Further, van Bussel conflates ideal and non-ideal states in his proposed validation of his momentum theory. He shows that his theory predicts the maximum power at 8/9th’s disk loading and concludes that the momentum theory is validated by the 0.88 experimental disk loading of the Grumman device at the maximum tested output. This conflates the optimum condition which van Bussel asserts is 16/27th’s of the maximum area with the non-optimal performance of the Grumman device. In Grumman experiments, the disk loading value of 0.88 was reported at 40% CP related to the maximum area, not at 59% CP which is van Bussel’s result.
Appendix A.1.2. AM Method 2: Jamieson
Jamieson [11] states that the maximum coefficient of power for a shrouded rotor is the product of the Betz Limit times (1 – a0). His variable a0, in his Equation (15) or Equation (A8), is the axial induction at the extraction plane under no extraction. For an ideal accelerator, Jamieson states, β = 1 − a0. Therefore, Jamieson predicts that the power limit of an ideal accelerator is the Betz Limit of its maximum frontal area. His specific application of averaging in his derivation is found in his Equation (10) or equation (A9), which is his adaptation of the Betz CT equation. Jamieson uses an axial induction reference plane, b, rather than the throat axial induction reference plane, a.
Jamieson states that “Denoting axial induction at the reference plane as b, then velocity in the far wake is V (1 − 2b), a result first determined by R E Rankine–Froude.” Regardless of whether the typical a plane or the b plane is used, the fundamental error of applying averaging remains evident in the 1 − b and 1 − 2b terms.
Jamieson claims to have developed a general theory for open flow and confined rotors by introducing the b reference plane, but his hypothesis exhibits the same techniques, errors, and violations as the general AM. Applying the β = 1 condition shows that Jamieson’s theory does not constitute a general theory for confined flow. In the β = 1 case Jamieson’s a and b planes are coincident, and he asserts that the confined disk is in the same condition as an open flow rotor. Therefore, there is no confinement of the actuator disk evident.
Jamieson provides his a0 term, which reduces the mass flow due to accelerator inefficiency. Additionally, Jamieson’s control volume differs from Figure 7 and Figure 9 above since his equations are developed with a reference plane. The reference plane designation asserts that the pressure drop occurs over an area equal to the initial mass flow rate through the accelerator at the freestream velocity. With non-ideal acceleration, Jamieson predicts that there is more thrust on the disk as compared to van Bussel, who asserts that the pressure drop occurs at the rotor size at the freestream velocity.
Appendix A.1.3. AM Method 3: Werle and Presz (WP)
WP [12] state that their equation system yields the freestream turbine when the shroud force is reduced to zero, “Note that the unducted wind/water turbine case is recovered using CS = 0”. In WP’s framework, a CS = 0 should represent a tube, not a freestream actuator disk. WP’s Cs variable is the inverse of Jameison’s a0 variable. WP’s Equation (2) and (3a), or (A10) and (A11), show the velocity averaging used for the calculation of disk velocity. WP’s Equation (4), or Equation (A12), shows the equivalency between CS and Jamieson’s a0 referring to Jamieson’s Equation (14) [11]. Where possible, the nomenclature is converted from WP’s nomenclature to the nomenclature of this paper.
WP’s work exhibits the same fundamental mathematical structure, assumptions, and errors as Jamieson and the general AM.
Appendix A.1.4. Non-AM Method: Lawn
Lawn [24] developed an analytical model to analyze extractors inside of accelerators. Lawn defines the resistance coefficient, K, in his Equation (1), and defines the coefficient of power in his Equations (6) and (7). Accelerator efficiency and turbine efficiency is accounted for in his model development. Unlike the AMs, Lawn does not claim to present a theoretical model that constrains the power and flow effects of an accelerator. Instead, Lawn derives his velocity and pressure drop data from experiments and references. Since Lawn does not use velocity averaging to determine flow conditions, he can accurately determine results if correct flow variables are input. For example, Lawn predicts that an extractor within a tube does not behave like a freestream turbine but is rather restrained to lower power. Lawn’s model is limited since it is an analytical model and it cannot provide a means to evaluate designs without experimental evidence.
Appendix A.2. Methods for New Experiments: Third-Party High-Efficiency Array testing in MIT Wind Tunnel and High-Efficiency Accelerator Field Testing
The AMs and the proposed Thrust Model are compared to several experiments: the Grumman DAWT experiments, a high-efficiency accelerator array tested in the MIT wind tunnel, and field testing of a high-efficiency accelerator. The Grumman device with a screen in place is pictured in Section 1 and the specifics of the Grumman experiment can be found in reference [17]. Below are the procedures for MIT and the authors’ experiments.
Appendix A.2.1. Accelerator Array Tested in MIT Wind Tunnel
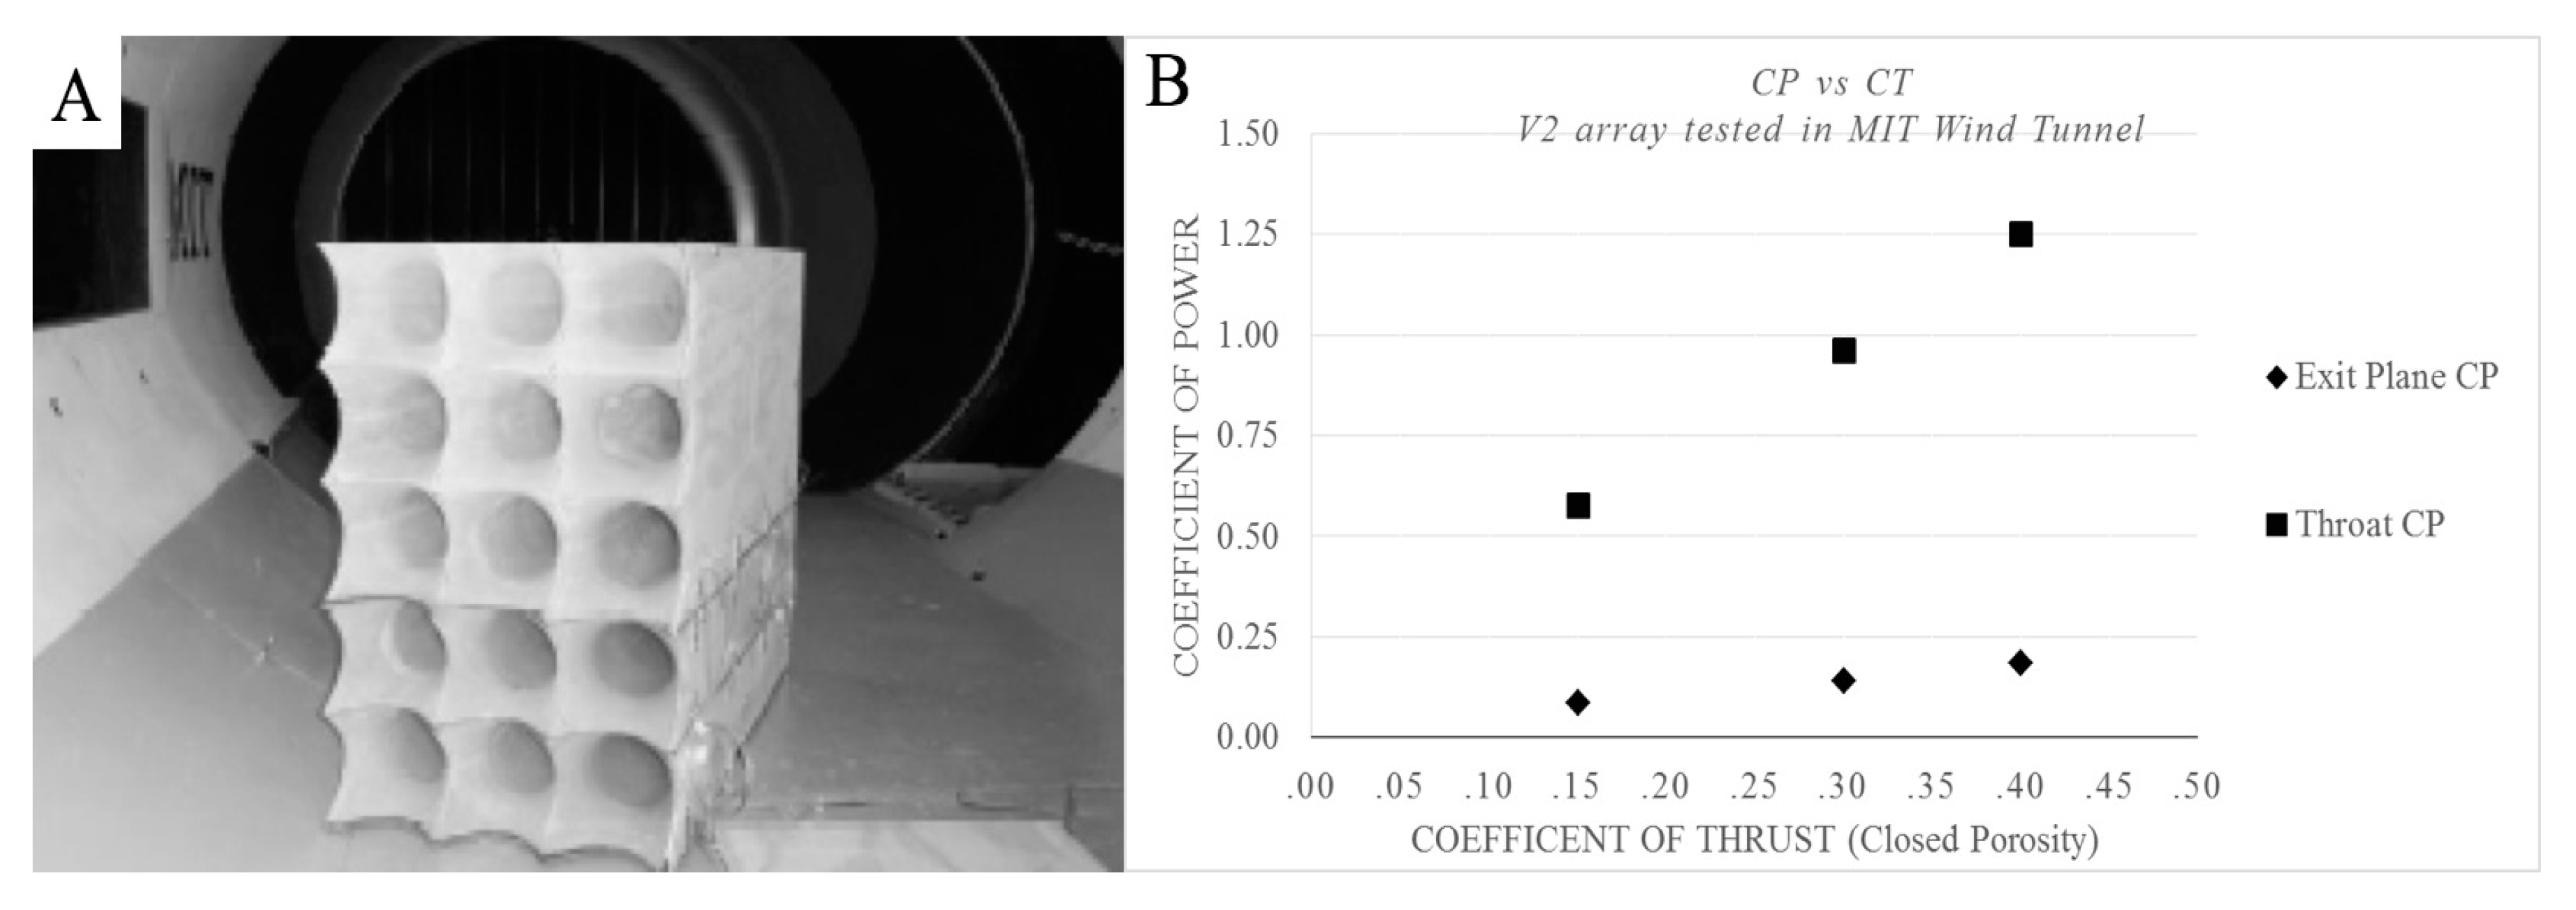
A 1:4 scale accelerator array was tested in the MIT Wright Brothers Wind Tunnel [25], as shown by Figure A1A. The design for the array was provided by the authors. The tests were performed by S. Gomez. The array consisted of a 3 × 5 array of accelerators where β = 2.6. Screens were attached to the exit of the array. An X-Y traverse was used to measure the pressure across the exit plane of the array. The screens were placed at the exit to measure the complete radial exit flow field with the X-Y traverse which would not have been possible at the individual throats.
Figure A1.
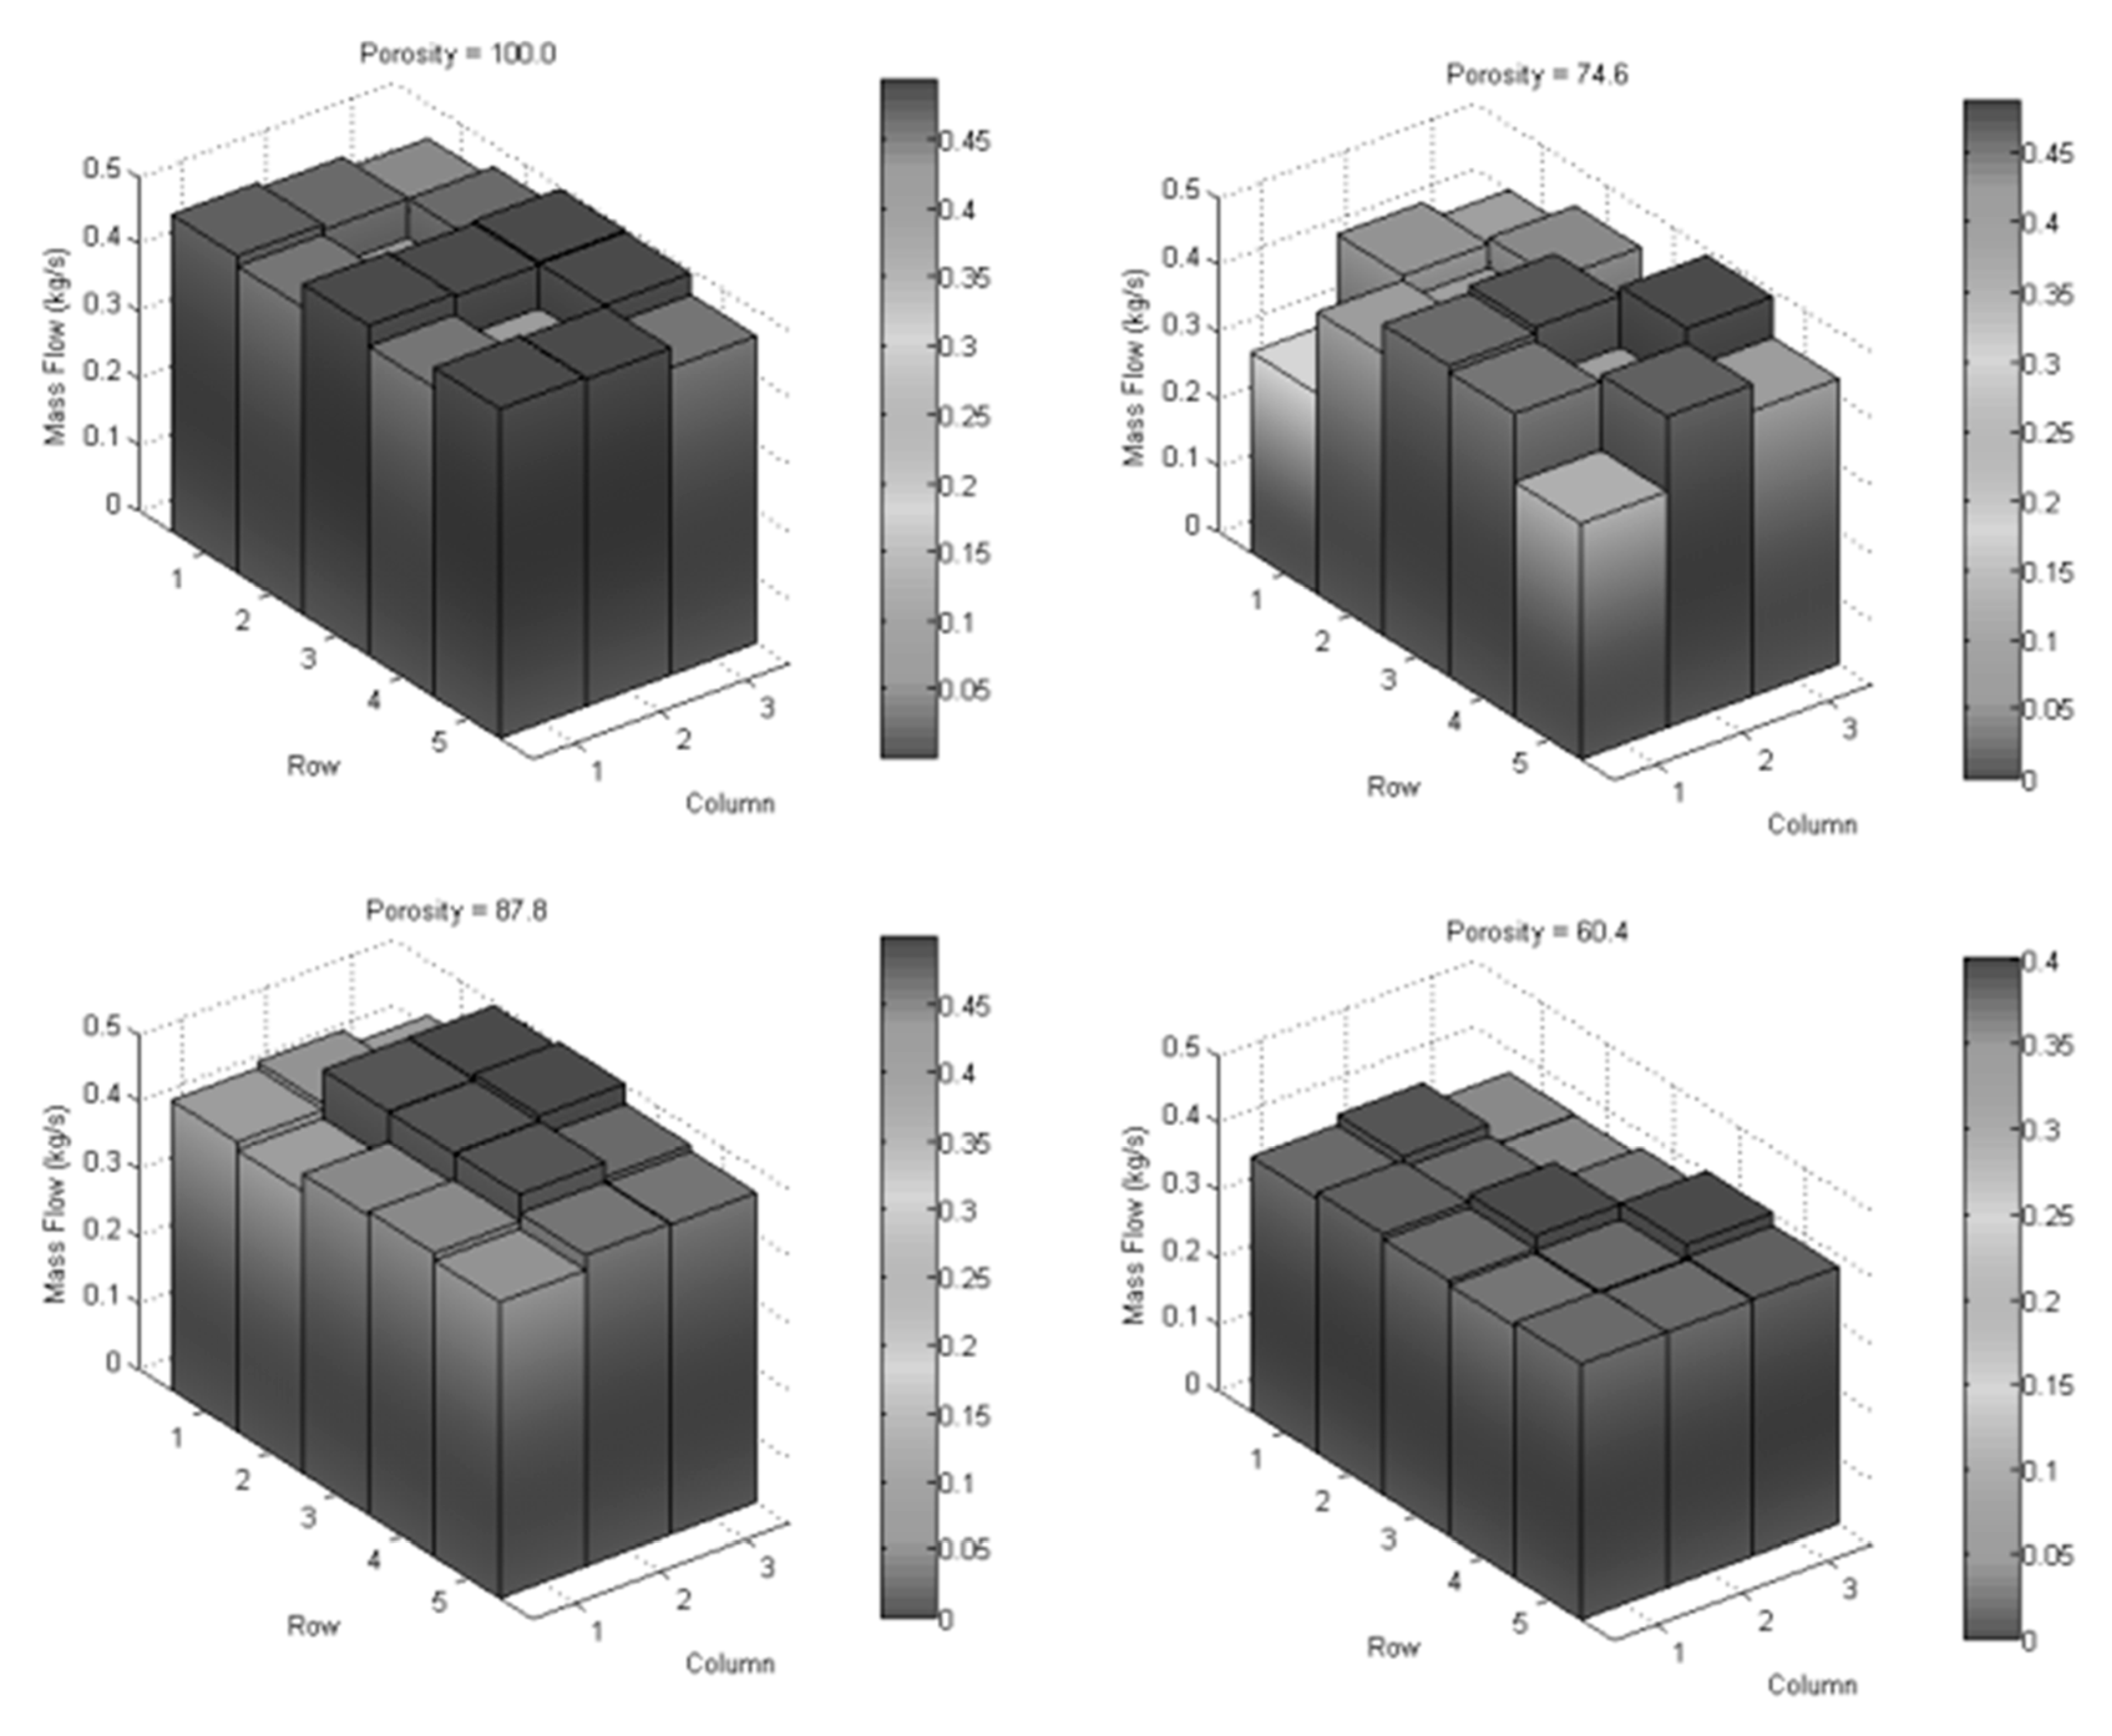
(A) Stagnation pressure measurements were taken for screens with open porosities of 60.4%, 74.6%, 87.8%, and 100% (no screen). The same screens were tested at the exit of the array and in free-standing screen tests to isolate CP correlation to screen open porosity. The exit screen will produce resistance in accordance with the given CT value and that velocity reduction will be experienced at the throat and intake related to local . The tested CP at the exit is related by mass flow conservation to a throat CP by the relation of (rβ)2. (B) depicts the experimental exit plane CP and the correlating throat plane CP. The CP is non-dimensionalized based on freestream velocity and maximum frontal area. Figure A2 depicts the mass flow rate for the array at a different closed percentage.
Figure A1.
(A) Stagnation pressure measurements were taken for screens with open porosities of 60.4%, 74.6%, 87.8%, and 100% (no screen). The same screens were tested at the exit of the array and in free-standing screen tests to isolate CP correlation to screen open porosity. The exit screen will produce resistance in accordance with the given CT value and that velocity reduction will be experienced at the throat and intake related to local . The tested CP at the exit is related by mass flow conservation to a throat CP by the relation of (rβ)2. (B) depicts the experimental exit plane CP and the correlating throat plane CP. The CP is non-dimensionalized based on freestream velocity and maximum frontal area. Figure A2 depicts the mass flow rate for the array at a different closed percentage.

Figure A2.
MIT Wind Tunnel Results: Mass flow in each accelerator of the array for 100%, 87.8%, 74.6%, and 60.4% porous arrays [25].
Figure A2.
MIT Wind Tunnel Results: Mass flow in each accelerator of the array for 100%, 87.8%, 74.6%, and 60.4% porous arrays [25].

There are limitations to the results of the experiments presented by Gomez. The first is that, as shown in Figure A2, there are inconsistencies in mass flow between the different accelerators, which could be due to turbulence. Further testing should be performed to attempt to gather more uniform results, especially for the 74.6% porosity case. The second limitation is due to testing constraints to use the X-Y traverse, the screen was tested at the exit of the accelerator instead of at the throat. This required further analysis to relate the exit plane performance to the throat plane.
Appendix A.2.2. Field Experiment for a U.S. Army Phase I SBIR
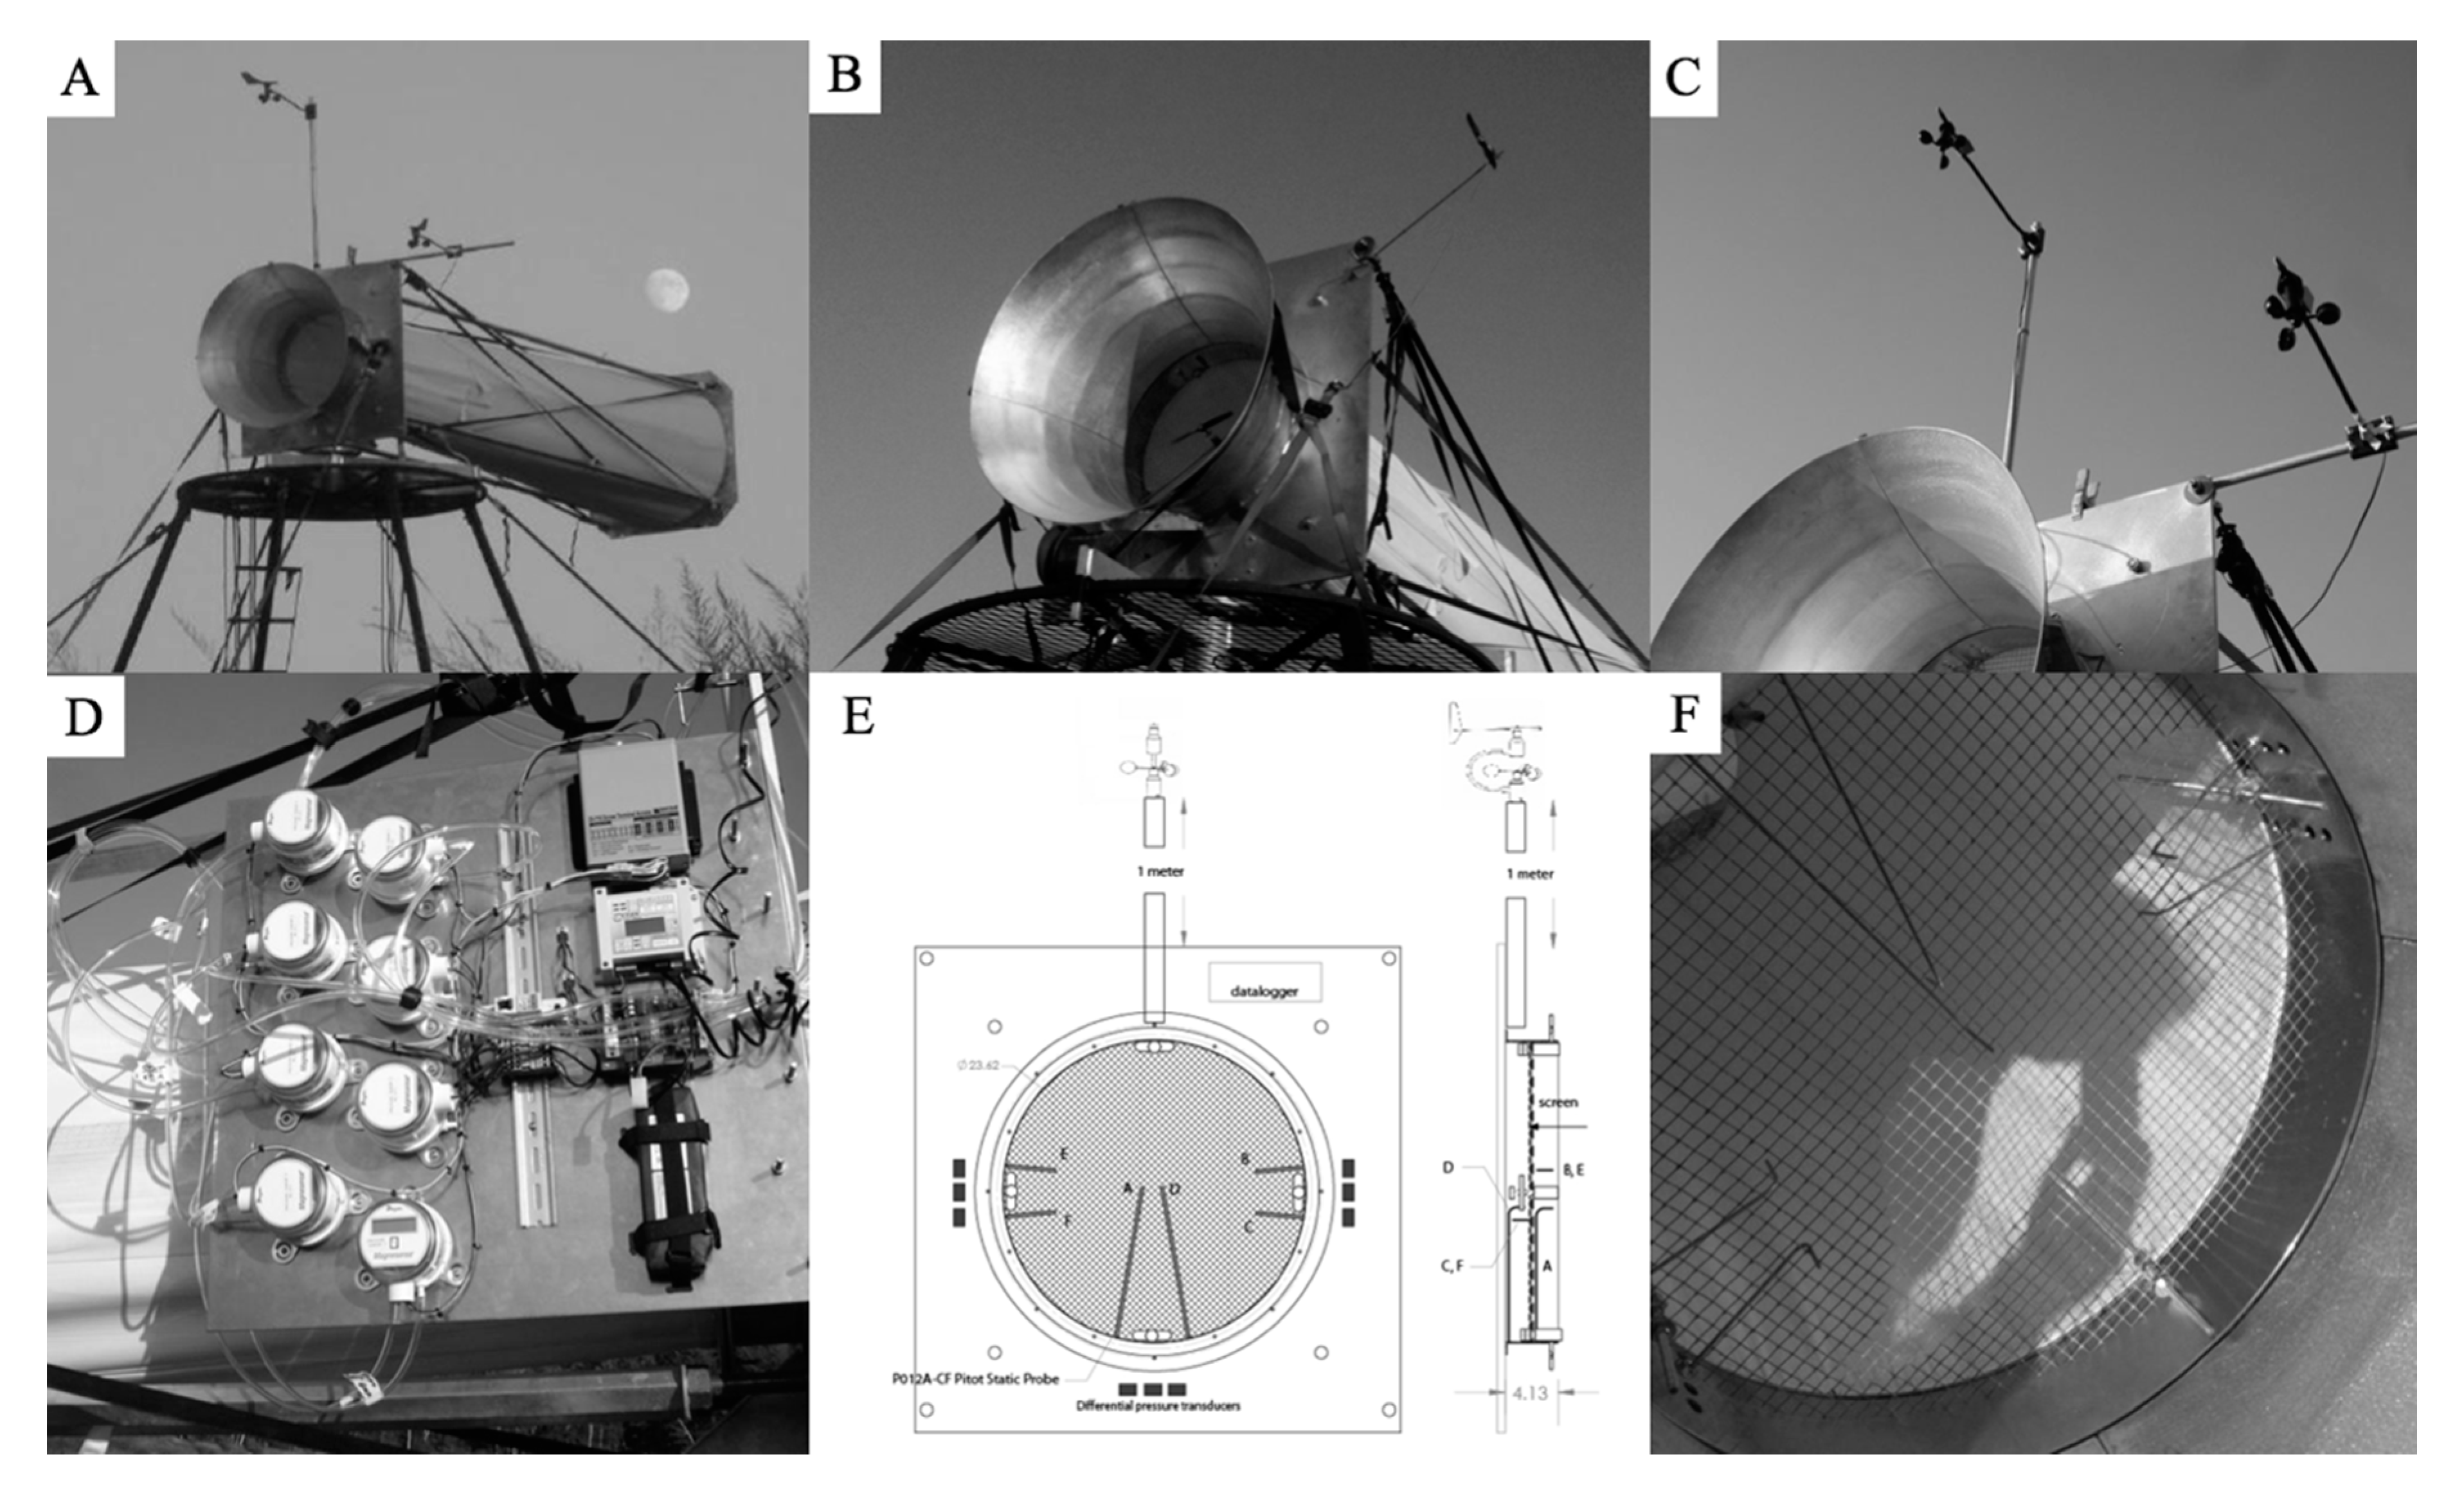
A single full-scale wind acceleration module was designed and fabricated for testing in the field [26]. The test nozzle dimensions were 1 m × 1 m × 5 m. The nozzle was attached to a bearing assembly and mounted on a ~1.5 m tall quadpod. Figure A3A shows the inlet, center body assembly, exit assembly, and bearing and elevation assembly. Velocity measurements without screens were taken to characterize the baseline acceleration performance of the prototype, r. The test setup is shown in Figure A3B. Rotor anemometer measurements were taken to confirm the main pressure measurement system velocity data. Hotwire anemometer spot checks were performed throughout testing with Sper hotwire anemometers.
Figure A3.
(A) Accelerator Field Experiment, (B) Rotor anemometer velocity measurement, (C) Anemometers 1m above and to the right of the accelerator, (D) Instrumentation panel on side of prototype, (E) Diagram of Prandtl tube arrangement in the accelerator, (F) Prandtl Tubes installed with a 24% solidity screen in the throat of Accelerator.

Velocity and power testing were performed using screens at the throat to simulate a uniform actuator disk. Pressure and anemometer measurements were used to capture results. The pressure system was comprised of three sets of Prandtl tubes to measure velocity at the throat, with and without screens, and the pressure drop across the screens to estimate power output. Pressure measurements were taken by differential pressure transmitters. Ambient wind speed and direction data were taken with 2 co-mounted SKADA cup anemometers, as shown by Figure A3C. All pressure and anemometer signals were recorded to a datalogger to insure the simultaneous measurement of the data. Figure A3D shows the instrumentation panel on the side of the prototype. Prandtl tubes were arranged in pairs. The forward tube measured stagnation and static pressure before the throat/screen. The rearward tube measured static pressure after the screen. In the field, the rearward tubes were oriented downstream. Prandtl static ports were tested in a wind tunnel and the field with forwarding and rearward orientation and no difference was found in the static pressure measurement. Rearward tubes did not require stagnation measurement. Figure A3E,F depicts the instrumentation at the throat.
Screens used in testing were 15.2% and 24.5% closed porosity. Previous testing in MIT’s Wright Brothers wind tunnel, referenced above, indicated that these screens represented turbine CP’s of roughly 15% and 28%, respectively.
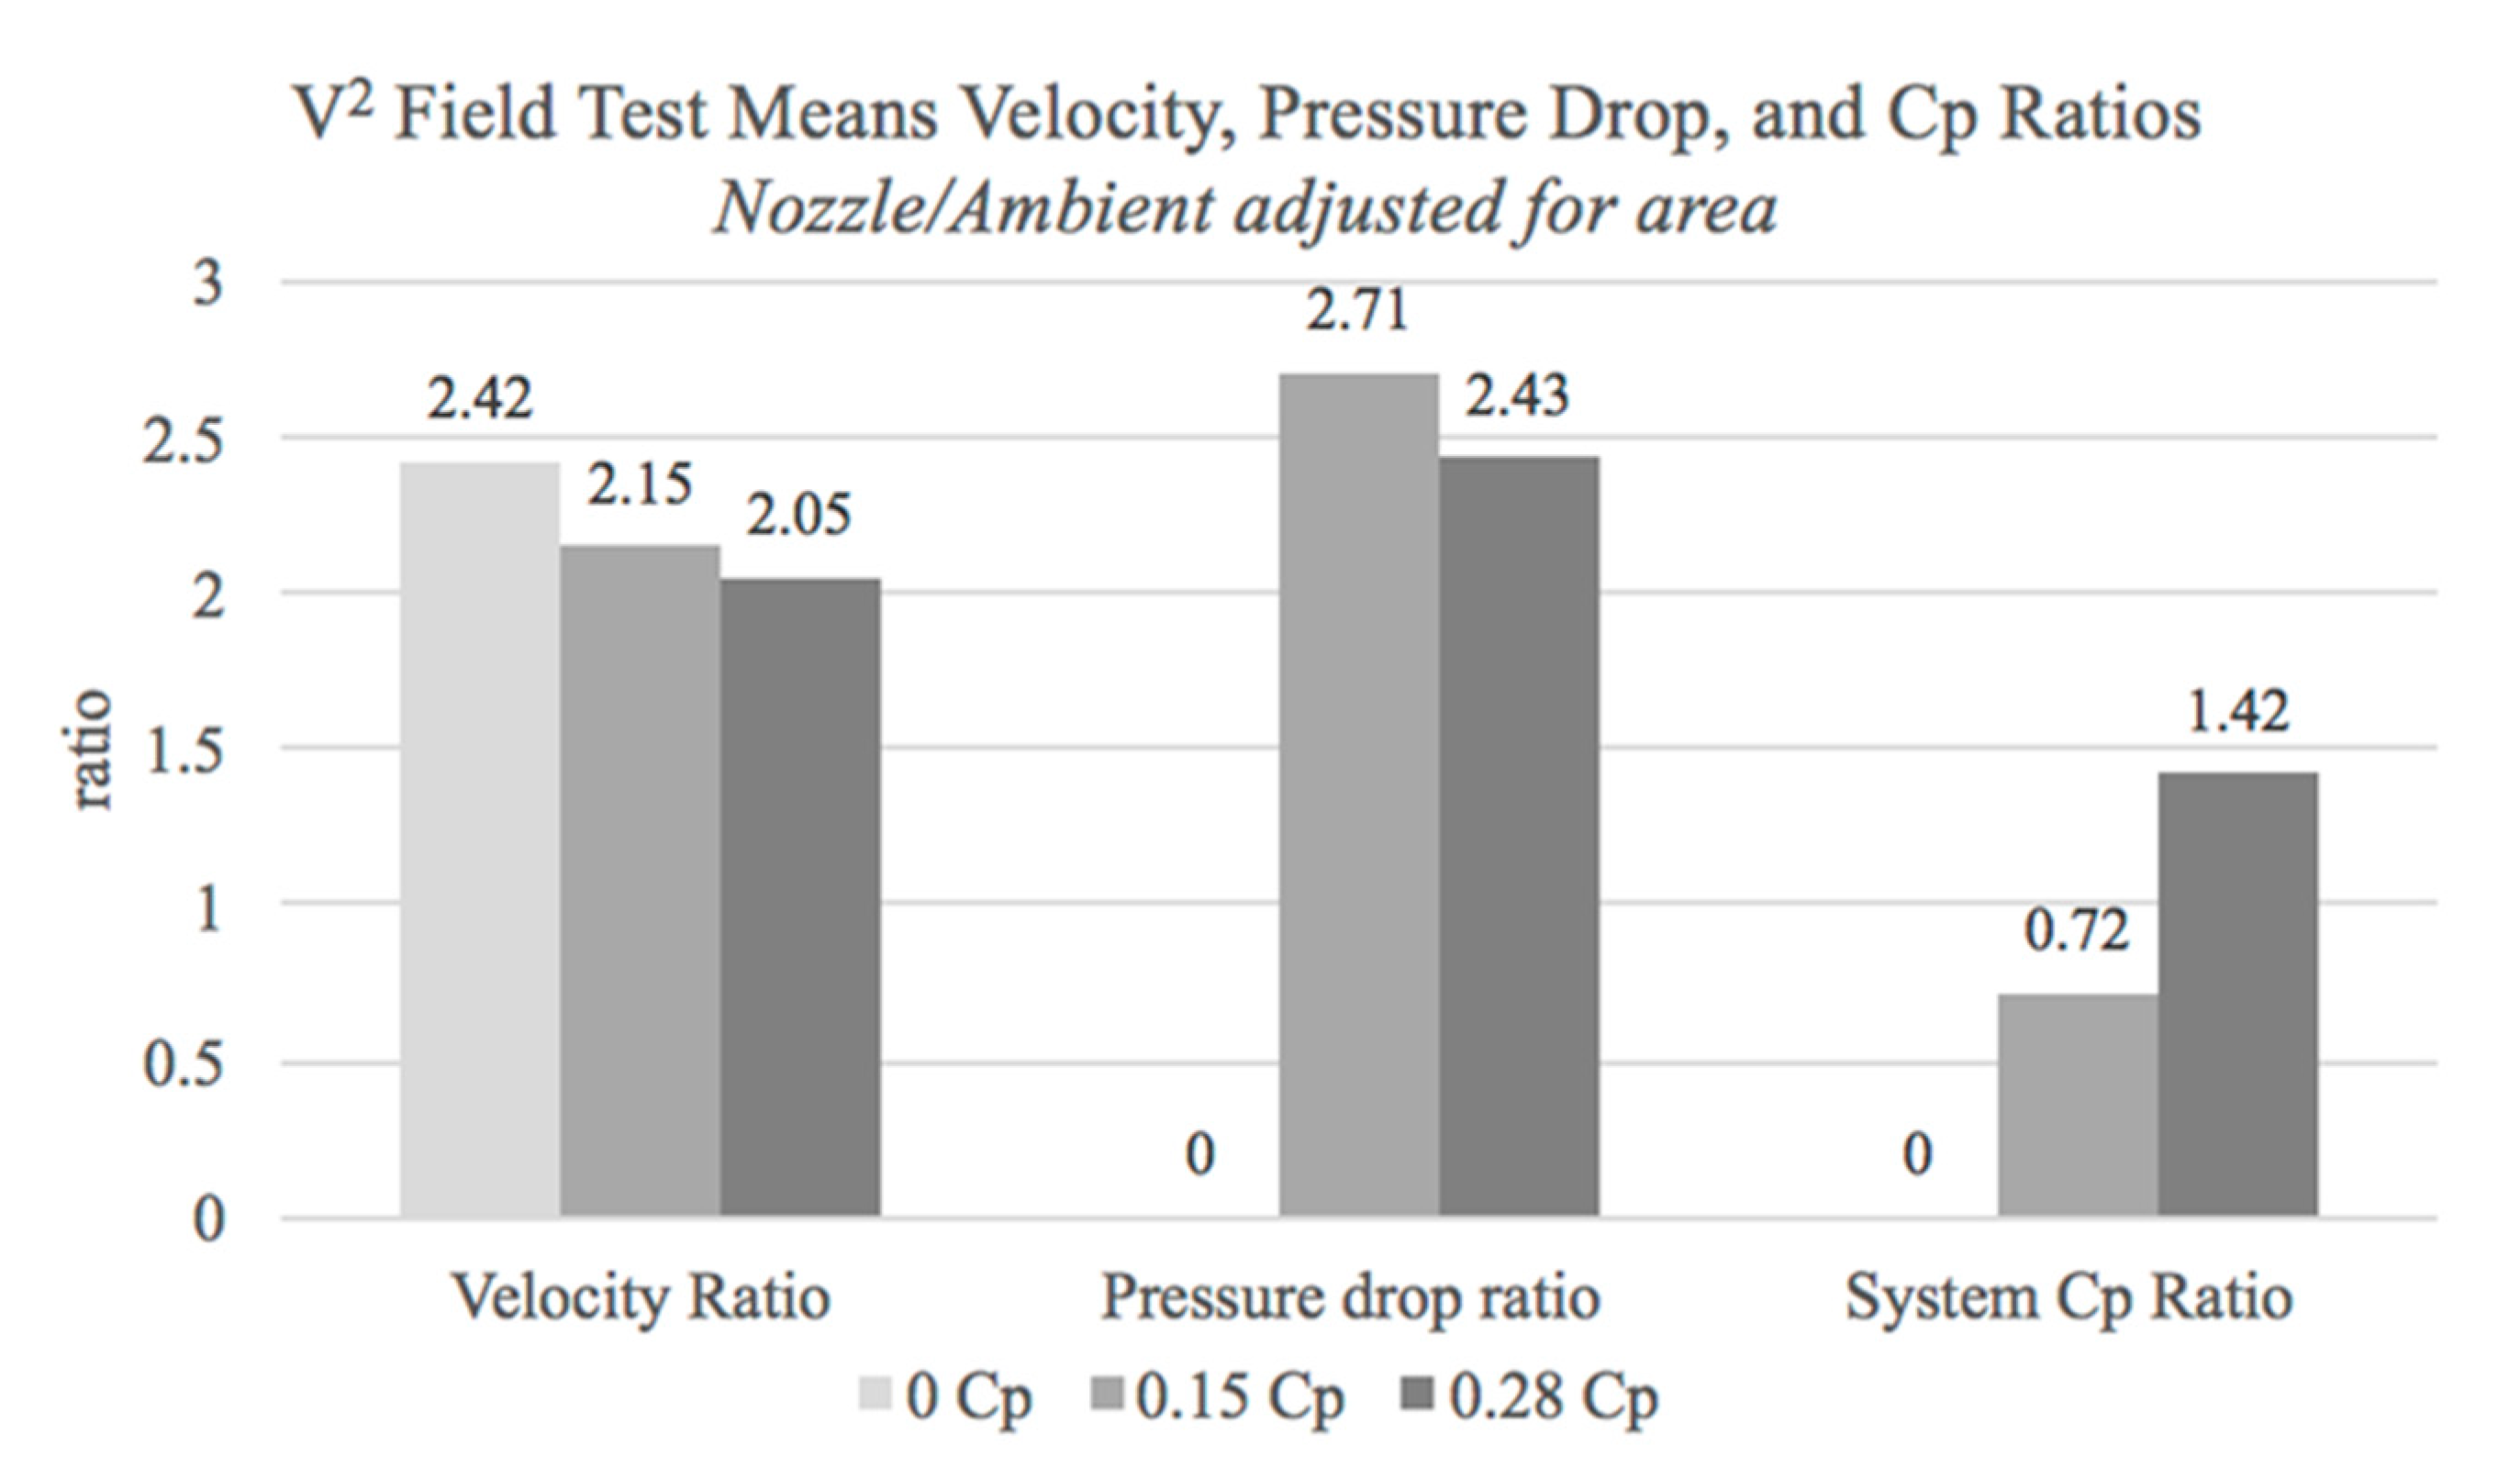
Figure A4 below depicts the experimental multiple of the velocity, pressure drop, and ambient power for 0%, 15%, and 24% solidity screens. On average each data set was one hour long, and data was collected for over 20 h. Instantaneous samples were taken every half second. Each sample’s power was determined by the product of v1, A1, and Δp as shown by Equation (A13). The average of all samples above a v∞ of 2 m/s is used.
Figure A4.
Mean Test data ratio to freestream turbine variables at 0, 0.15, and 0.28 rotor CP.

Velocity ratio is the achieved throat velocity, rß, related to ambient velocity. The pressure drop ratio is taken as the square root of the ratio between the measured pressure drop and the ideal Betz pressure drop calculated at the ambient velocity. CP ratio is the ratio between the extracted power at the accelerator’s throat and the total fluid power available at the ambient velocity at the accelerator’s maximum area.
Appendix A.3. Experimental Results Shown by Non-Dimensionalizing Thrust with Disk Velocity
To further illustrate the predictive errors with the AMs and accuracy of the Thrust Model, the CT can instead be non-dimensionalized with v1. A new variable, CTv1, is created by non-dimensionalizing CT with v1 instead of v1o (Thrust Model) or with v∞ (AMs). CTv1 provides an alternate metric to compare all models non-dimensionalized with the same station velocity in a way that is commonly used for the internal flow. Figure A5 shows the disk velocity and CP predictions for the Thrust Model and the general AM. As the general AM is only able to produce results up to a = 0.5, the maximum CTv1 is 4 (as the disk velocity is 0.5, so CTv1 = CT/0.52 = 4). In contrast, the Thrust Model can analyze results until disk velocity is zero at which point CTv1 is infinite. This image also shows that the general AM predicts the maximum power to be the Betz Limit of the maximum area instead of 38% CP as predicted by the Thrust Model.
Figure A5.
General AM and Thrust Model predictions of v1 and CP vs. CTv1 in a tube (β = 1).

Figure A5A–C depicts the disk velocity, CP, and disk loading for the Grumman experiment, the general AM prediction, the Thrust model prediction, Jamieson’s prediction, van Bussel’s prediction, and van Bussel’s prediction if his γ variable was inverted. WP was not plotted due to its similarity to Jamieson’s model. To note, when the Thrust Model is non-dimensionalized with disk velocity, as the disk velocity approaches zero, the CTv1 approaches infinity. In contrast, models like van Bussel are only able to analyze results to ~0.5 axial induction entering the accelerator. For this reason, van Bussel’s model and the general AM do not have a CTv1 values that correlate with the Grumman data. This depicts how van Bussel’s model and the general AM over-predict disk velocity and under-predict corollary pressure drop. If van Bussel’s γ was inverted he would be able to model disk velocity more accurately but would still over-predict. In Figure 13 above the AM CP predictions as a function of CT are coincidently close to the Grumman results. When plotted based on CTv1, the AM predictions are no longer close to the Grumman results. This method removes the possibility for conflation of CP when component variables are incorrectly predicted.
Jamieson’s a0 variable reduces the initial mass flow through the device and as a result, can predict disk velocity vs. CTv1 more accurately than van Bussel and the general AM. Despite Jamieson’s ability to calculate disk velocity, he underpredicts the pressure drop, except for the highest CTv1 data point, since his model assigns pressure drop at the freestream velocity. As a result, Jamieson underpredicts CP. Figure A6 is plotted using his Equations (A1) and (A2).
Figure A6.
Grumman Test Results compared to theoretical models (A) v1 vs. CTv1 (B) CP vs. CTv1 (C) Disk Loading vs. CTv1 (* Denotes van Bussel’s model with inverted back pressure which more accurately predicts results).
Figure A6.
Grumman Test Results compared to theoretical models (A) v1 vs. CTv1 (B) CP vs. CTv1 (C) Disk Loading vs. CTv1 (* Denotes van Bussel’s model with inverted back pressure which more accurately predicts results).

In contrast, the Thrust Model accurately predicts the Grumman data except for the highest CTv1 data point. Figure A6 demonstrates the accuracy of the Thrust Model, especially when compared to the AMs. The Thrust Model can accurately predict disk velocity, disk loading, and power.
Figure A7 illustrates the field-testing results compared to the general AM, Thrust Model, and Jamieson predictions as a function of CTv1. As shown above, in Figure 13, van Bussel’s backpressure leads to over prediction of velocity so it is not included, since the general AM will be closer to real results. As Figure A7 depicts, the general AM and Jamieson underpredict the disk loading and CP for the field test data. The AM’s apparent underprediction of v1 vs. CTv1 is caused by the underprediction of pressure drop, which shrinks the AM’s CTv1 domain. The Thrust Model accurately predicts (within 12%) the velocity, disk loading, and CP of the field tests. The Thrust Model predicts the lower porosity screen more accurately than the higher porosity screen, where it over predicts by 8% and under-predicts by 12%, respectively.
Figure A7.
General AM, Thrust Model, and Jamieson’s model compared to Field Test Results for (A) v1 vs. CTv1 (B) CP vs. CTv1 (C) Disk Loading vs. CTv1.
Figure A7.
General AM, Thrust Model, and Jamieson’s model compared to Field Test Results for (A) v1 vs. CTv1 (B) CP vs. CTv1 (C) Disk Loading vs. CTv1.

The Thrust Model’s predictions correlate well to all experimental results, prior art data as well as the new experimental data. The largest CP error is 12% for the 24.5% screen field tests. The Thrust Model yields a disk CP of 0.28 and a disk-loading coefficient of 0.84 for r = 0.56. Grumman disk-loading was 0.88. System CP for the Thrust Model prediction was 38%, compared to Grumman at 40%. The throat velocity for the Thrust Model was 1.2v∞ compared to Grumman at 1.2v∞ [17]. The accuracy of the Thrust Model’s prediction confirms that the pressure drop occurs at the accelerated velocity not at the average of the external velocities. CP of 0.28 for a free stream disk would correspond to a disk loading of ~0.3 which correlates to the 2.78 β value for the Grumman accelerator (0.3 × 2.78 = 0.84). This confirms that throat disk loading is related to intake disk loading by β and pressure drop is related by β2 as shown in Equation (23) above.
References
- Carlos, J.; Martin, A. Key Performance Indicators Wind Farm Availability TIME Vs ENERGY. In Analysis of Operating Wind Farms; EWEA Technology Workshops: Lyon, France, 2012. [Google Scholar]
- Smil, V. Power Density Primer: Understanding the Spatial Dimension of the Unfolding Transition to Renewable Electricity Generation; 8 May 2010. Available online: http://vaclavsmil.com/wp-content/uploads/docs/smil-article-power-density-primer.pdf (accessed on 24 June 2020).
- Sansoucy, G. In-City Renewable Resource Executive Summary for the Theoretical, Technical, and Economic Potential for Renewable Energy Resource Development in the City and County of San Francisco as part of the CCA Program; CCA Contract No.: CS No.: CS-920R-A; CCA 2009. Available online: https://sfgov.org/lafco/sites/default/files/FileCenter/Documents/19063-GES_Draft_Report_Tasks1-2.pdf (accessed on 24 June 2020).
- Schmalensee, R. The Future of the Us Electric Grid; MIT Press: Cambridge, MA, USA, 2016; pp. 73–79. [Google Scholar]
- Lopez, A.; Roberts, B.; Heimiller, D.; Blair, N.; Porro, G.U.S. Renewable Energy Technical Potentials: A GIS-Based Analysis; Technical ReportNREL/TP-6A20-51946; Office of Scientific and Technical Information (OSTI): Oak Ridge, TN, USA, 2012. [Google Scholar]
- California Power Plant Database.xls. Available online: https://www.eia.gov/electricity/data/eia923/ (accessed on 28 June 2020).
- Power Trends 2015: Rightsizing the Grid; NYISO: Rensselaer, NY, USA, 2015.
- Gurney, J.; Company, B.P. BP Statistical Review of World Energy. J. Policy Anal. Manag. 1985, 4, 283. [Google Scholar] [CrossRef]
- Betz, A. Introduction to the Theory of Flow Machines; Elsevier BV: Amsterdam, The Netherlands, 1966. [Google Scholar]
- Van Bussel, G.J.W. The science of making more torque from wind: Diffuser experiments and theory revisited. J. Phys. Conf. Ser. 2007, 75. [Google Scholar] [CrossRef]
- Jamieson, P. Beating Betz—Energy Extraction Limits in a Uniform Flow Field. In Proceedings of the European Wind Energy Conference, Brussels, Belgium, 1 January 2008; Available online: http://www.katru.com.au/External%20Recognition/13_EWEC2008fullpaper.pdf (accessed on 5 June 2020).
- Werle, M.J.; Presz, W.M. Ducted Wind/Water Turbines and Propellers Revisited. J. Propuls. Power 2008, 24, 1146–1150. [Google Scholar] [CrossRef]
- Phillips, D. An Investigation of Diffuser Augmented Wind Turbine Design. Ph.D. Thesis, University of Auckland, Auckland, New Zealand, 2003. [Google Scholar]
- Kline, S.J.; Abbott, D.E.; Fox, R.W. Optimum Design of Straight-Walled Diffusers. J. Basic Eng. 1959, 81, 321–329. [Google Scholar] [CrossRef]
- Knight, B.; Freda, R.; Young, Y.L.; Maki, K. Coupling Numerical Methods and Analytical Models for Ducted Turbines to Evaluate Designs. J. Mar. Sci. Eng. 2018, 6, 43. [Google Scholar] [CrossRef] [Green Version]
- Rankine-Froude, R.E. On the part played in propulsion by differences of fluid pressure. Trans. Inst. Nav. Archit. 1889, 30, 390–405. [Google Scholar]
- Oman, R.A.; Foreman, K.M.; Gilbert, B.L. Investigation of Diffuser-Augmented Wind Turbines: Part 2; Technical Report DOE/SERI #Contract No. EY-76-C-02-2616; Research Department Grumman Aerospace Corporation: Bethpage NY, USA, 1977. [Google Scholar]
- Concentrating Windsystems—Sense or Nonsense. Available online: http://www.heiner-doerner-windenergie.de/diffuser.html (accessed on 3 May 2016).
- Gipe, P. Ogin Installs Ducted Turbines in the San Gorgonio Pass” “FloDesign-Ogin Some Brief Comments (CP claims). Available online: http://www.wind-works.org/cms/index.php?id=665 (accessed on 3 June 2020).
- Ohya, Y.; Karasudani, T. A Shrouded Wind Turbine Generating High Output Power with Wind-lens Technology. Energies 2010, 3, 634–649. [Google Scholar] [CrossRef] [Green Version]
- Igra, O. Shrouds for Aerogenerators. AIAA J. 1976, 14, 1481–1483. [Google Scholar] [CrossRef]
- Reid, E.G. Performance Characteristics of Plane-Wall Two-Dimensional Diffuser. In NACA Technical Note 2888; Nobel Press: Berlin, Germany, 2012. [Google Scholar]
- Bussel, G. An Assessment of the Performance of Diffuser Augmented Wind Turbines (DAWT’s). In Proceedings of the Third ASME/JSME Joint Fluids Engineering Conference, San Francisco, CA, USA, 18–23 July 1999. [Google Scholar]
- Lawn, C.J. Optimization of the power output from ducted turbines. Proc. Inst. Mech. Eng. Part A J. Power Energy 2003, 217, 107–117. [Google Scholar] [CrossRef]
- Gomez, S. Performance of a Ducted Wind Turbine Array Final Report. In Massachusetts Institute of Technology Report; MIT Press: Cambridge, MA, USA, 2011; p. 16.622. [Google Scholar]
- Freda, R. SBIR Topic Number A12-051—Phase I Final Report; United States Army: Boston, MA, USA, 2013. [Google Scholar]
Figure 1.
Cross-section schematic of passive accelerator types with stations. (A) Converging Nozzle [15]; (B) Diffuser Augmented Wind Turbine (DAWT).
Figure 1.
Cross-section schematic of passive accelerator types with stations. (A) Converging Nozzle [15]; (B) Diffuser Augmented Wind Turbine (DAWT).

Figure 2.
(A) Grumman Double Annulus, Boundary Layer Control, 30 Diffuser Augmented Wind Turbines (DAWTs) with wire mesh installed for wind tunnel testing, [17]; (B) Vortec 7 [18]; (C) Flodesign/Ogin MEWT [19].

Figure 3.
Baseline DAWT Fluid power at throat related to maximum area power ratio. Estimates are based on published/claimed CP. These estimates are may contain errors due to incomplete reporting of performance. (n) Denotes Area Ratio. Phillips [13], Grumman [17], Wind Lens [20], Flodesign/Ogin [19].

Figure 4.
Betz streamlines.

Figure 5.
Streamlines around actuator disk inside of a tube.

Figure 6.
Control Volume described by Averaging Models (AMs).

Figure 7.
AM Pressure Drop and Rotor Velocity Equation streamlines for ideal accelerators.

Figure 8.
Turbines in (A) free stream and (B) tube; (C) power vs. TSR for each case.

Figure 9.
AM equation streamlines for ideal accelerators when β = 1.

Figure 10.
Relevant Pressure conditions: (A) Rankine–Froude Actuator Disk Theory and (B) Thrust Model.
Figure 10.
Relevant Pressure conditions: (A) Rankine–Froude Actuator Disk Theory and (B) Thrust Model.

Figure 11.
(A) General AM Disk Velocity related to CT (B) Thrust Model Disk Velocity related to CT.

Figure 12.
Thrust Model and General AM prediction of CP and velocity ratio (v1/v∞) in a tube (β = 1).
Figure 12.
Thrust Model and General AM prediction of CP and velocity ratio (v1/v∞) in a tube (β = 1).

Figure 13.
Thrust Model and general AM predictions compared to experimental results (A) CP vs. CT, (B) Velocity ratio vs. CT, (C) Disk Loading vs. CT.
Figure 13.
Thrust Model and general AM predictions compared to experimental results (A) CP vs. CT, (B) Velocity ratio vs. CT, (C) Disk Loading vs. CT.

Figure 14.
(A) shows the raw 24.5% solidity screen velocity, (B) shows the raw 24.5% screen pressure drop data, (C) shows the power as the product of throat velocity, pressure drop, and throat area.
Figure 14.
(A) shows the raw 24.5% solidity screen velocity, (B) shows the raw 24.5% screen pressure drop data, (C) shows the power as the product of throat velocity, pressure drop, and throat area.

© 2020 by the authors. Licensee MDPI, Basel, Switzerland. This article is an open access article distributed under the terms and conditions of the Creative Commons Attribution (CC BY) license (http://creativecommons.org/licenses/by/4.0/).
Share and Cite
MDPI and ACS Style
Freda, R.; Knight, B.; Pannir, S. A Theory for Power Extraction from Passive Accelerators and Confined Flows. Energies 2020, 13, 4854. https://0-doi-org.brum.beds.ac.uk/10.3390/en13184854
AMA Style
Freda R, Knight B, Pannir S. A Theory for Power Extraction from Passive Accelerators and Confined Flows. Energies. 2020; 13(18):4854. https://0-doi-org.brum.beds.ac.uk/10.3390/en13184854
Chicago/Turabian StyleFreda, Robert, Bradford Knight, and Siddharth Pannir. 2020. "A Theory for Power Extraction from Passive Accelerators and Confined Flows" Energies 13, no. 18: 4854. https://0-doi-org.brum.beds.ac.uk/10.3390/en13184854
Note that from the first issue of 2016, this journal uses article numbers instead of page numbers. See further details here.