Simulation, Analysis, and Characterization of Calcium-Doped ZnO Nanostructures for Dye-Sensitized Solar Cells

 ,
,  , ,
, , 
Abstract
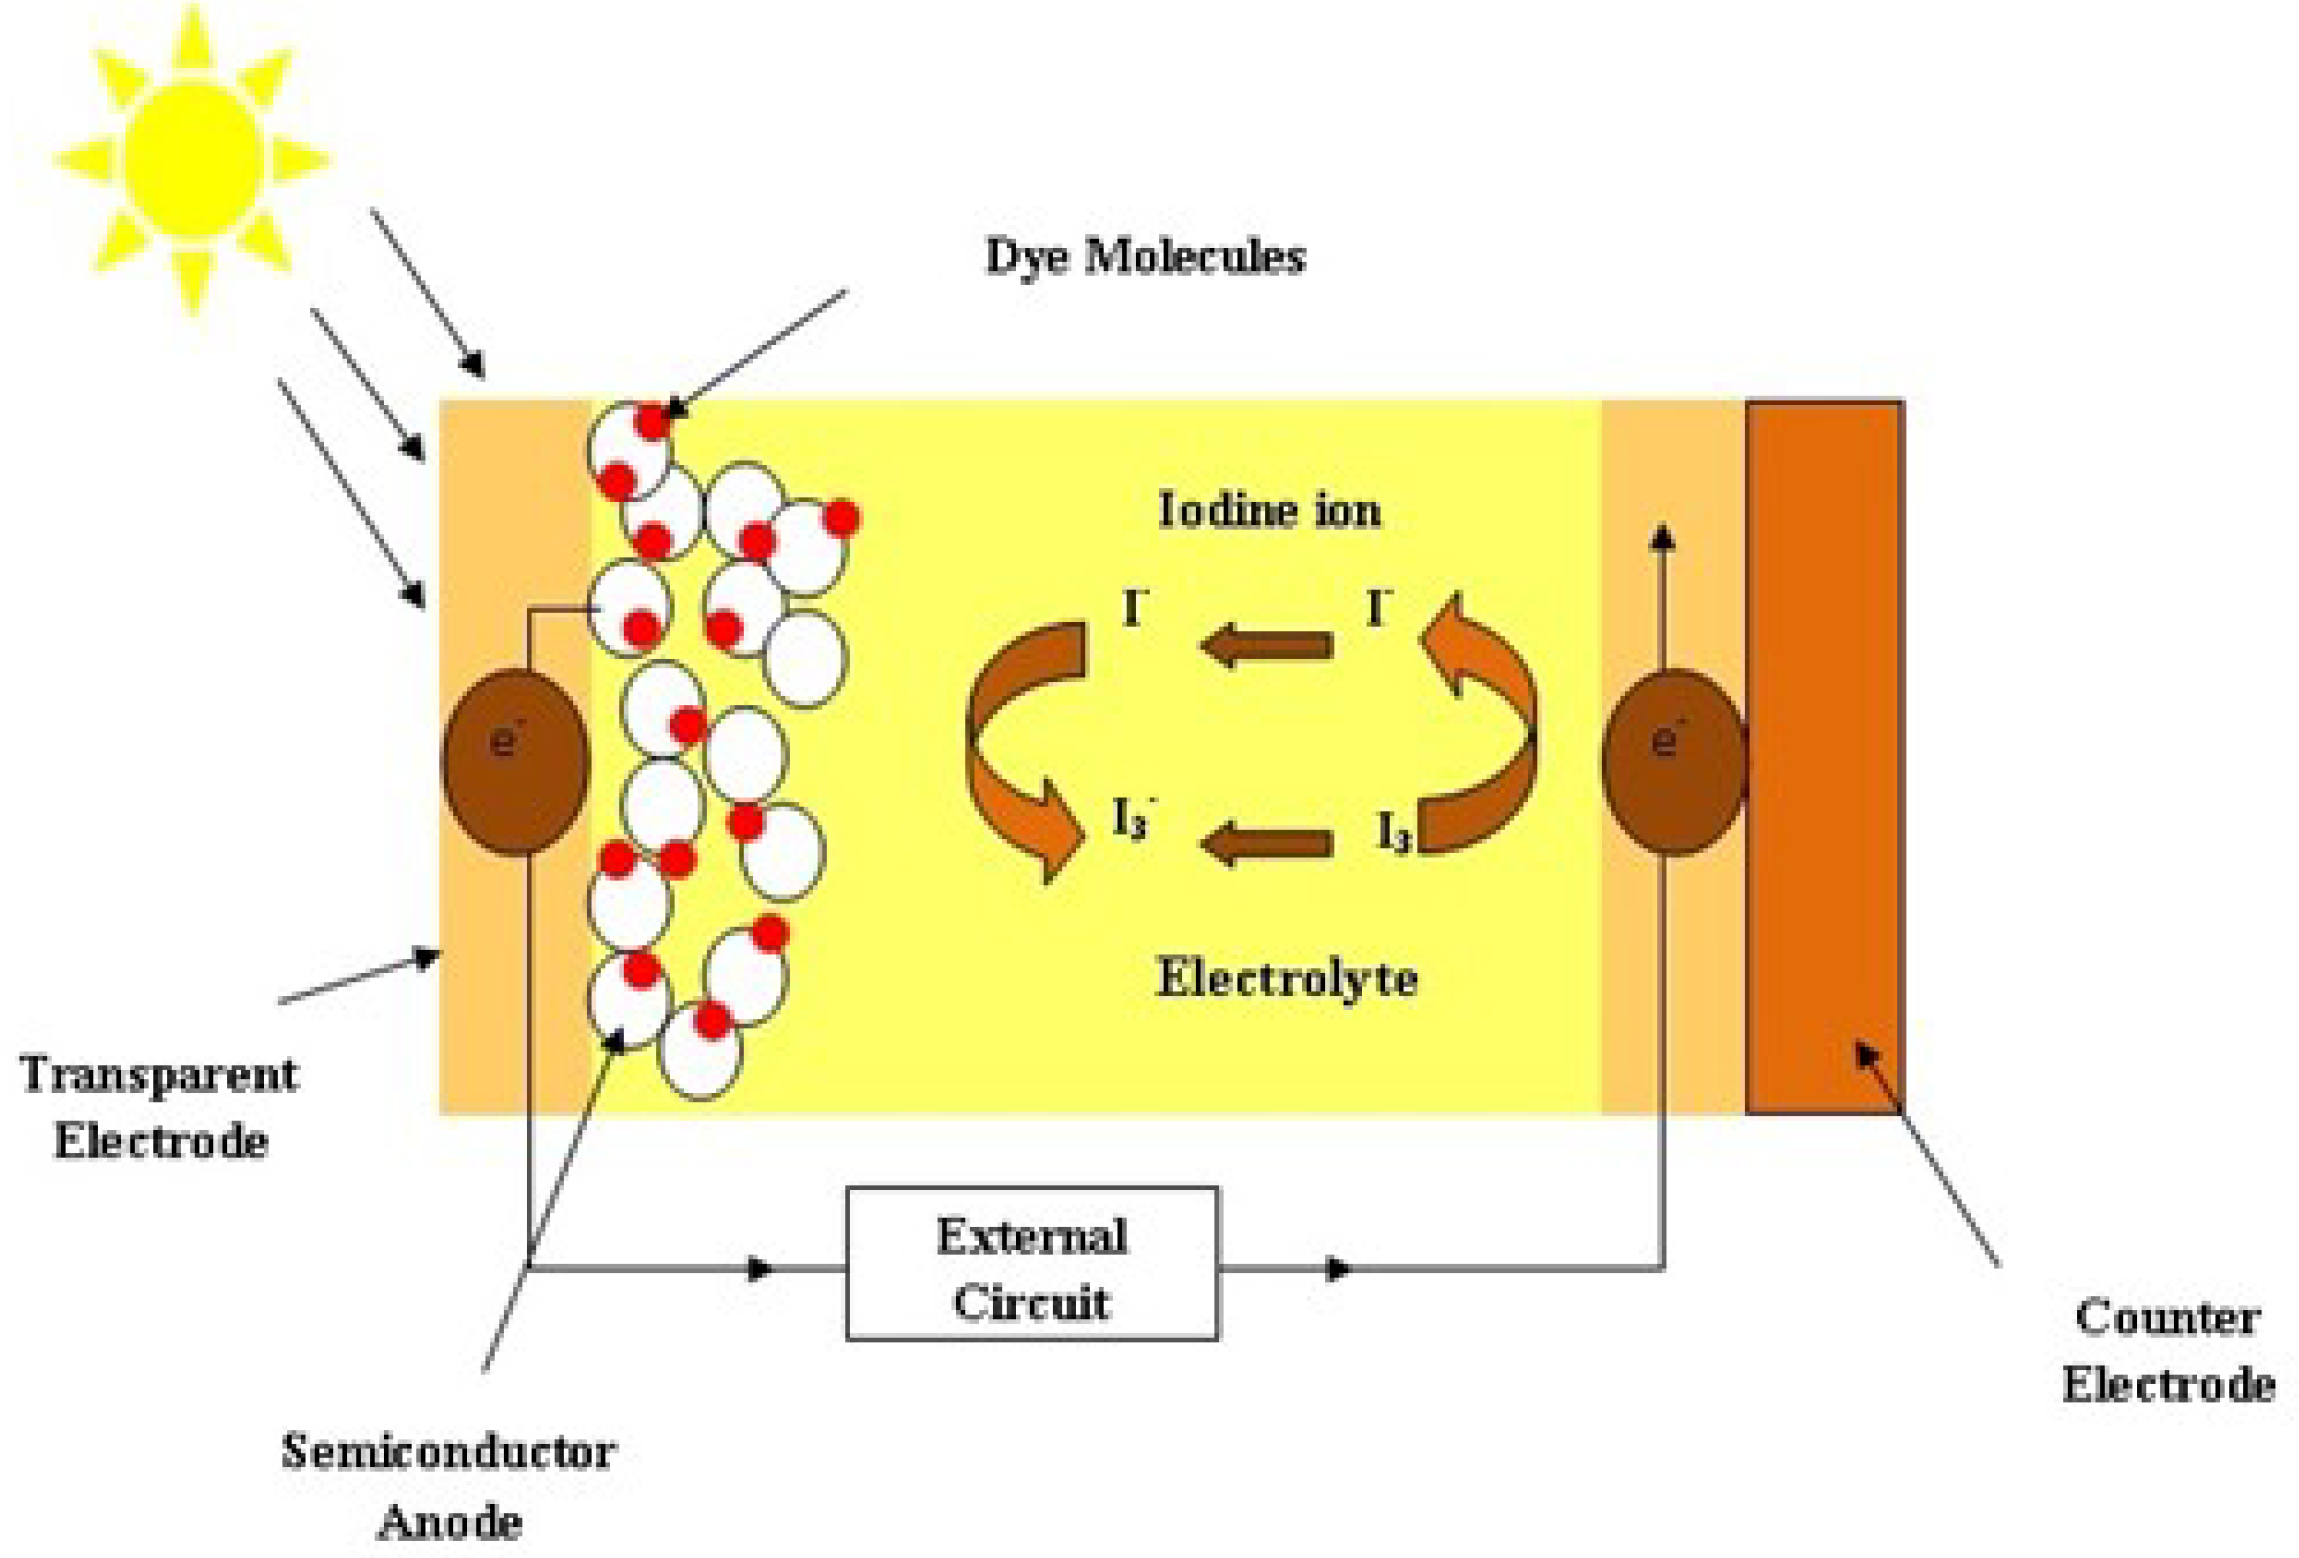
:1. Introduction
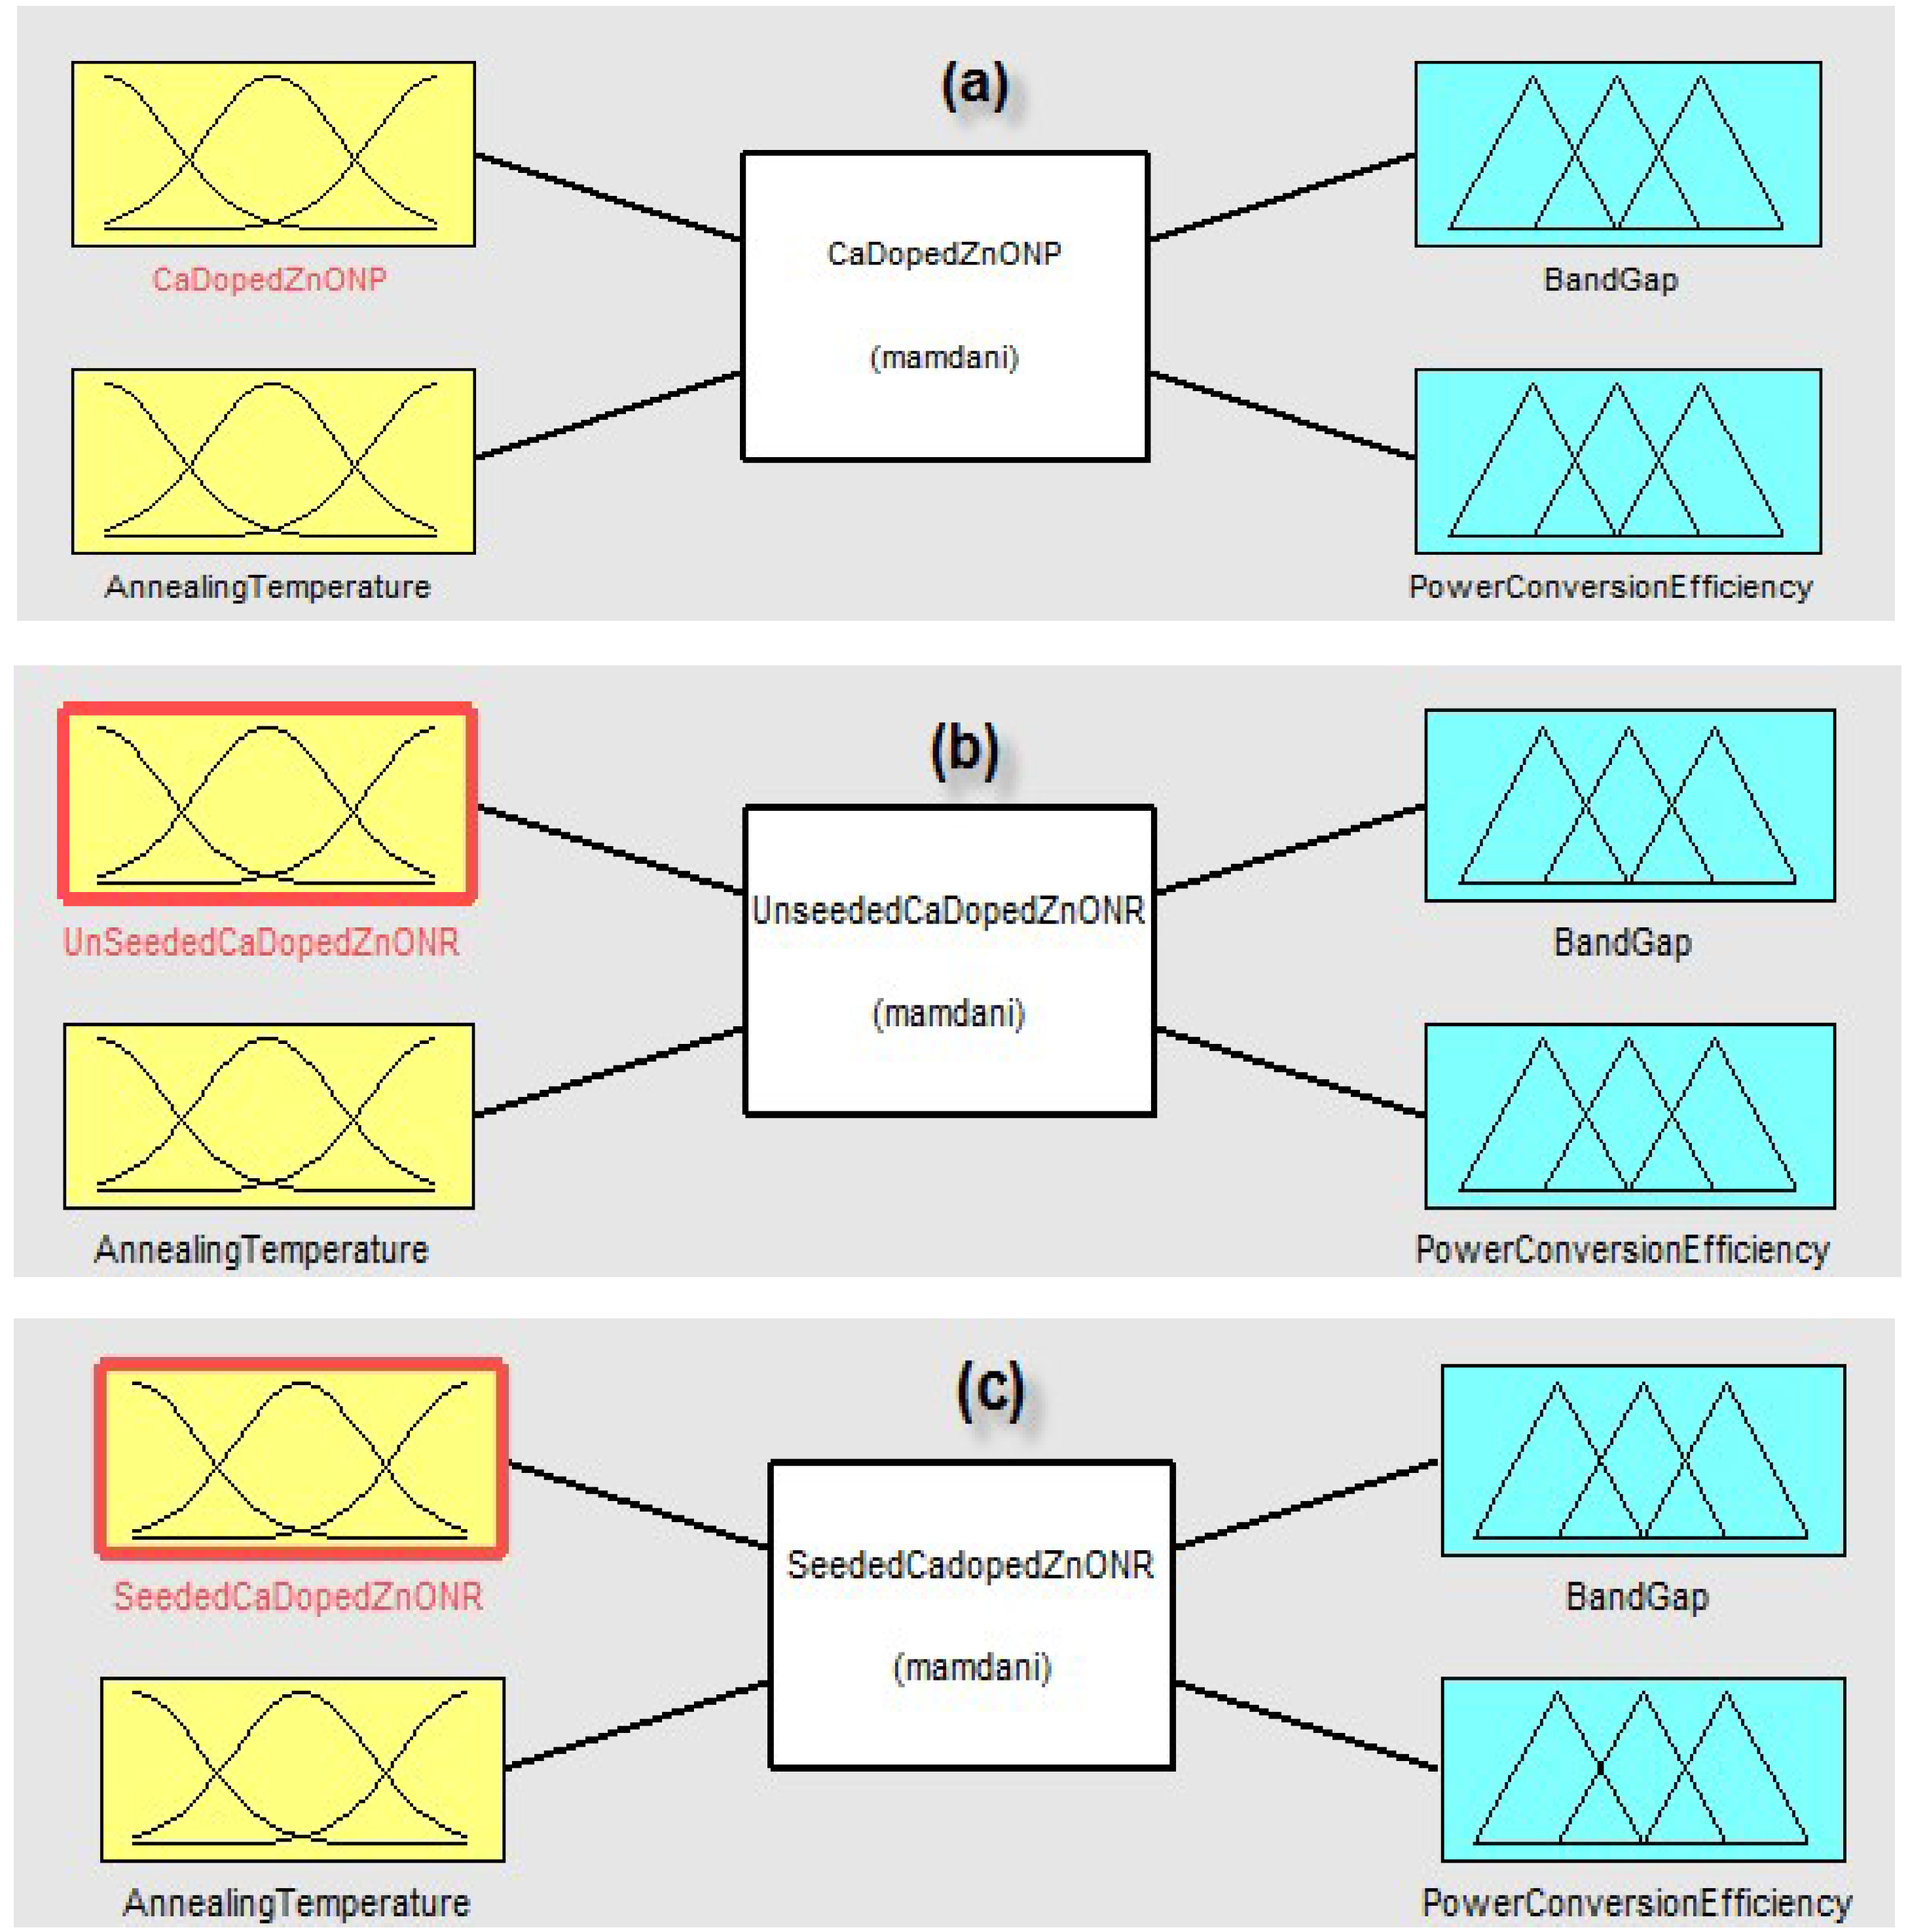
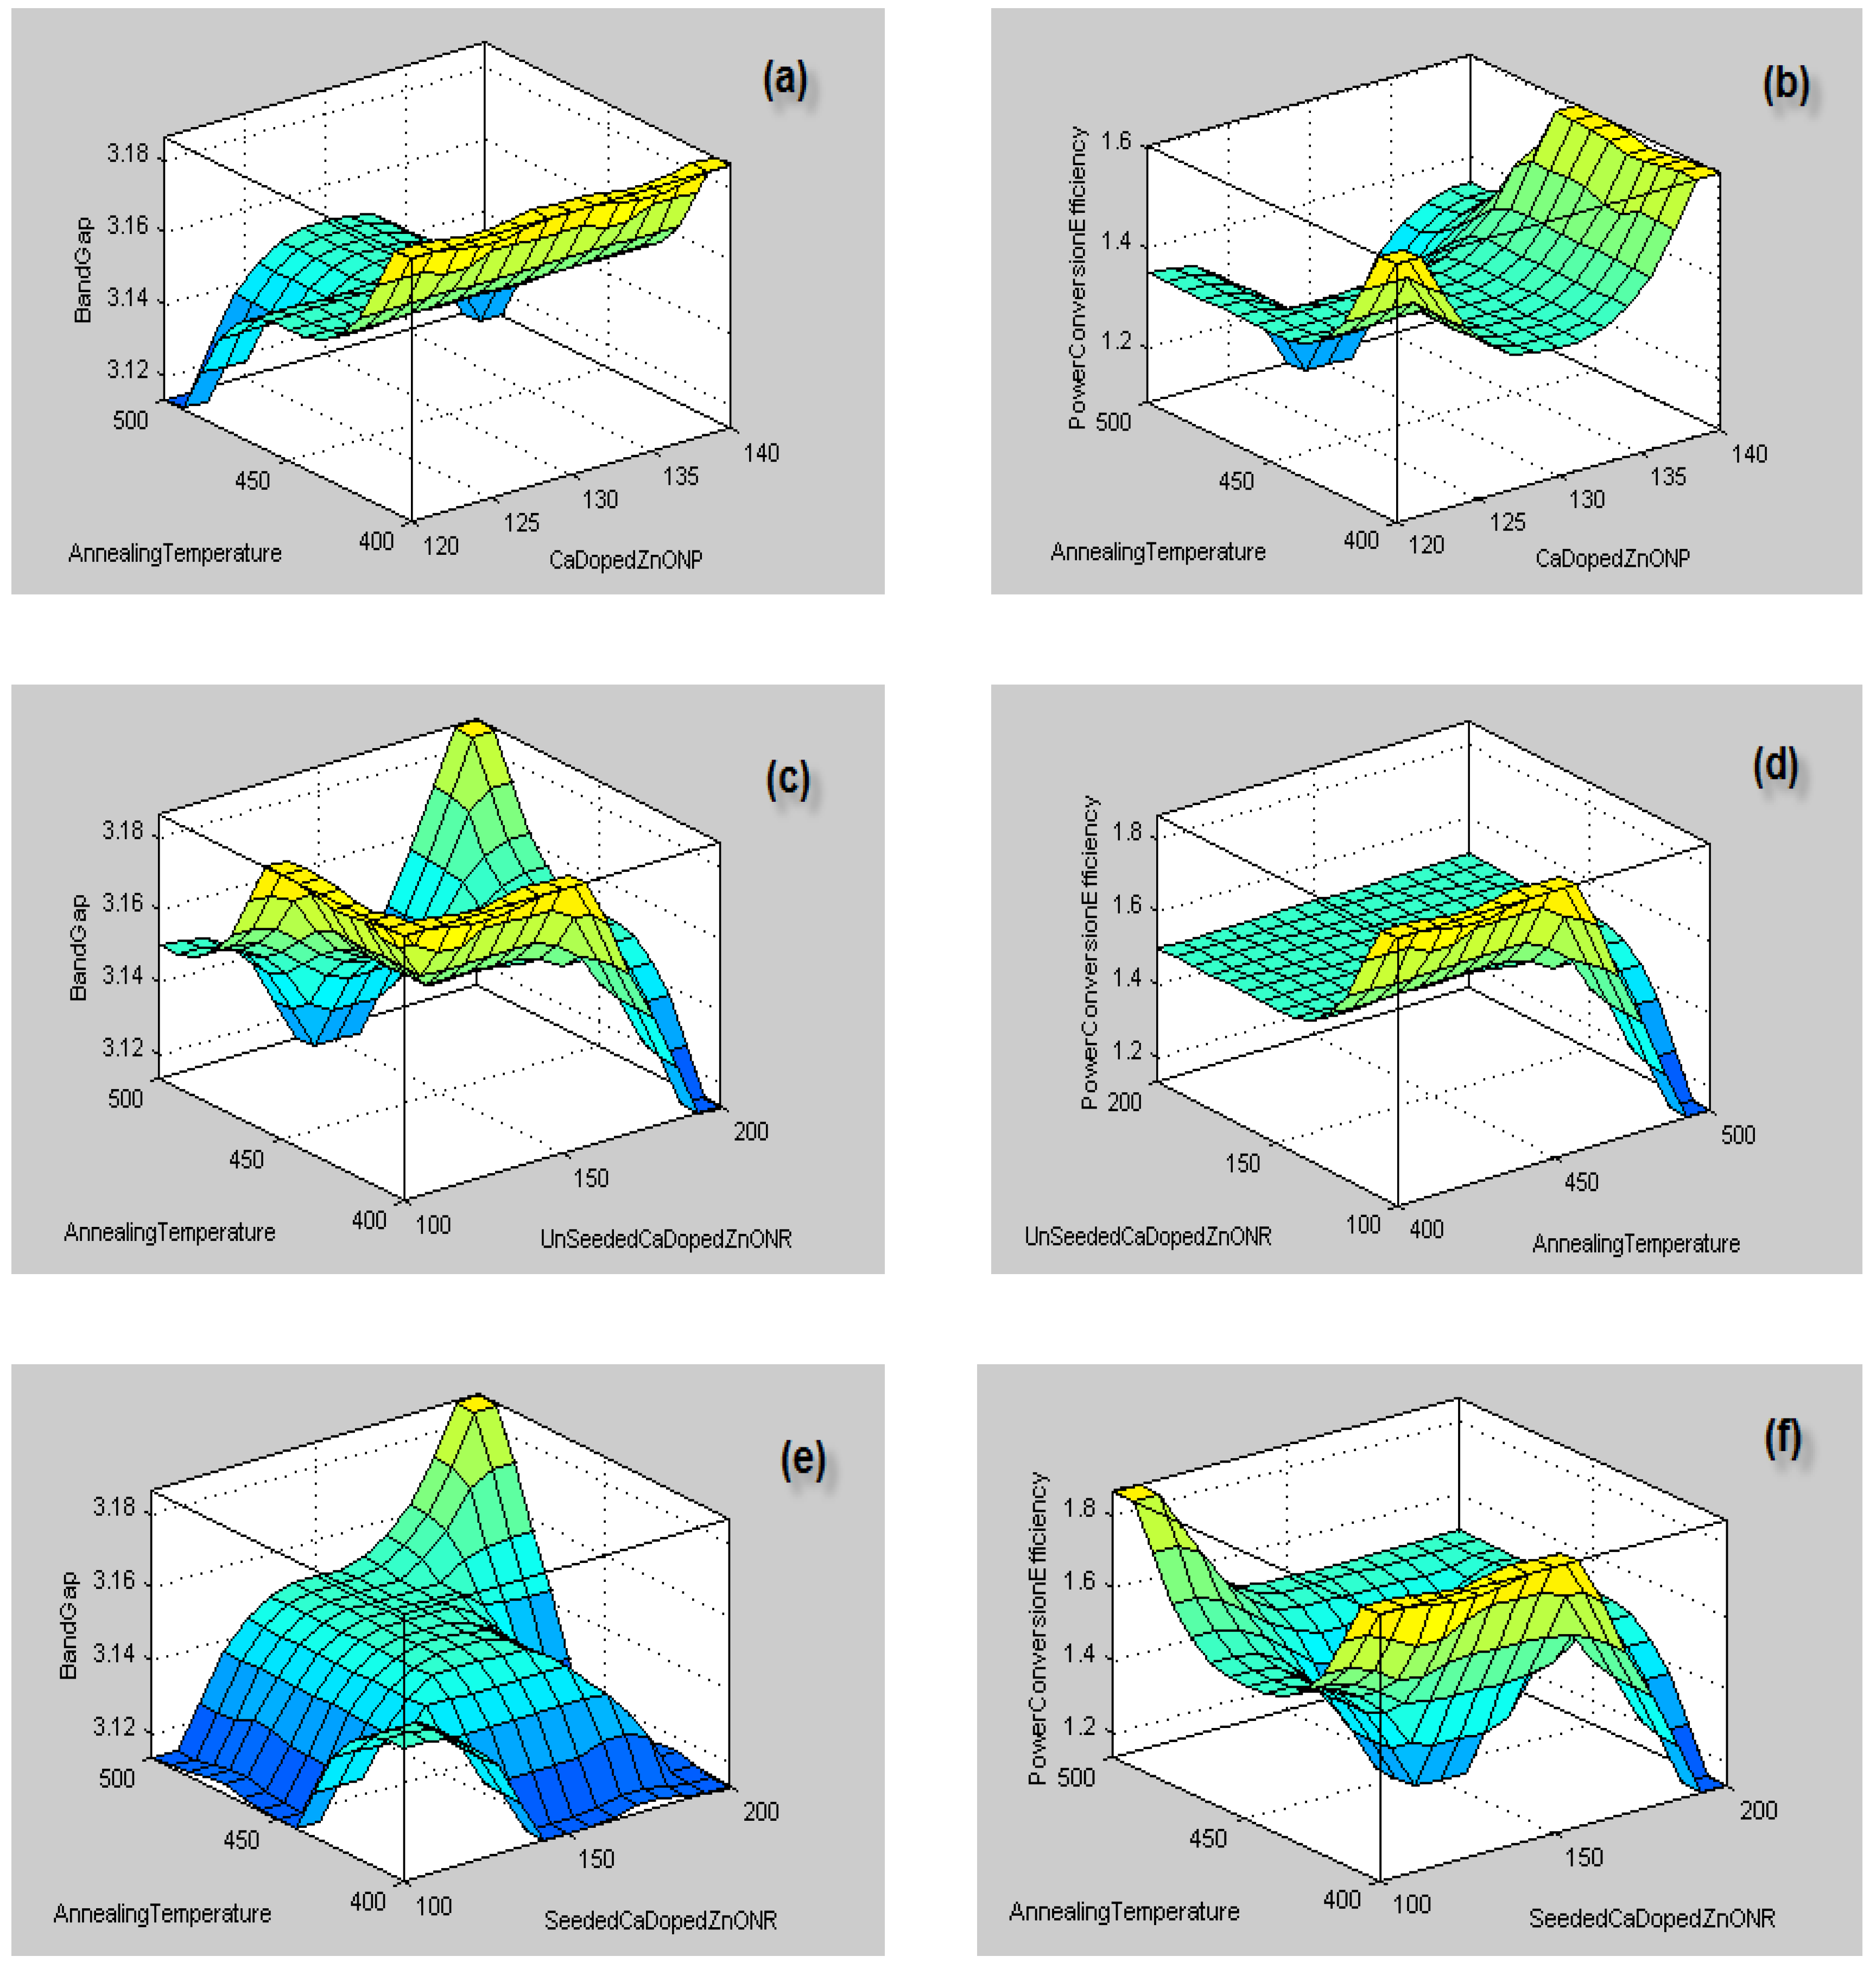
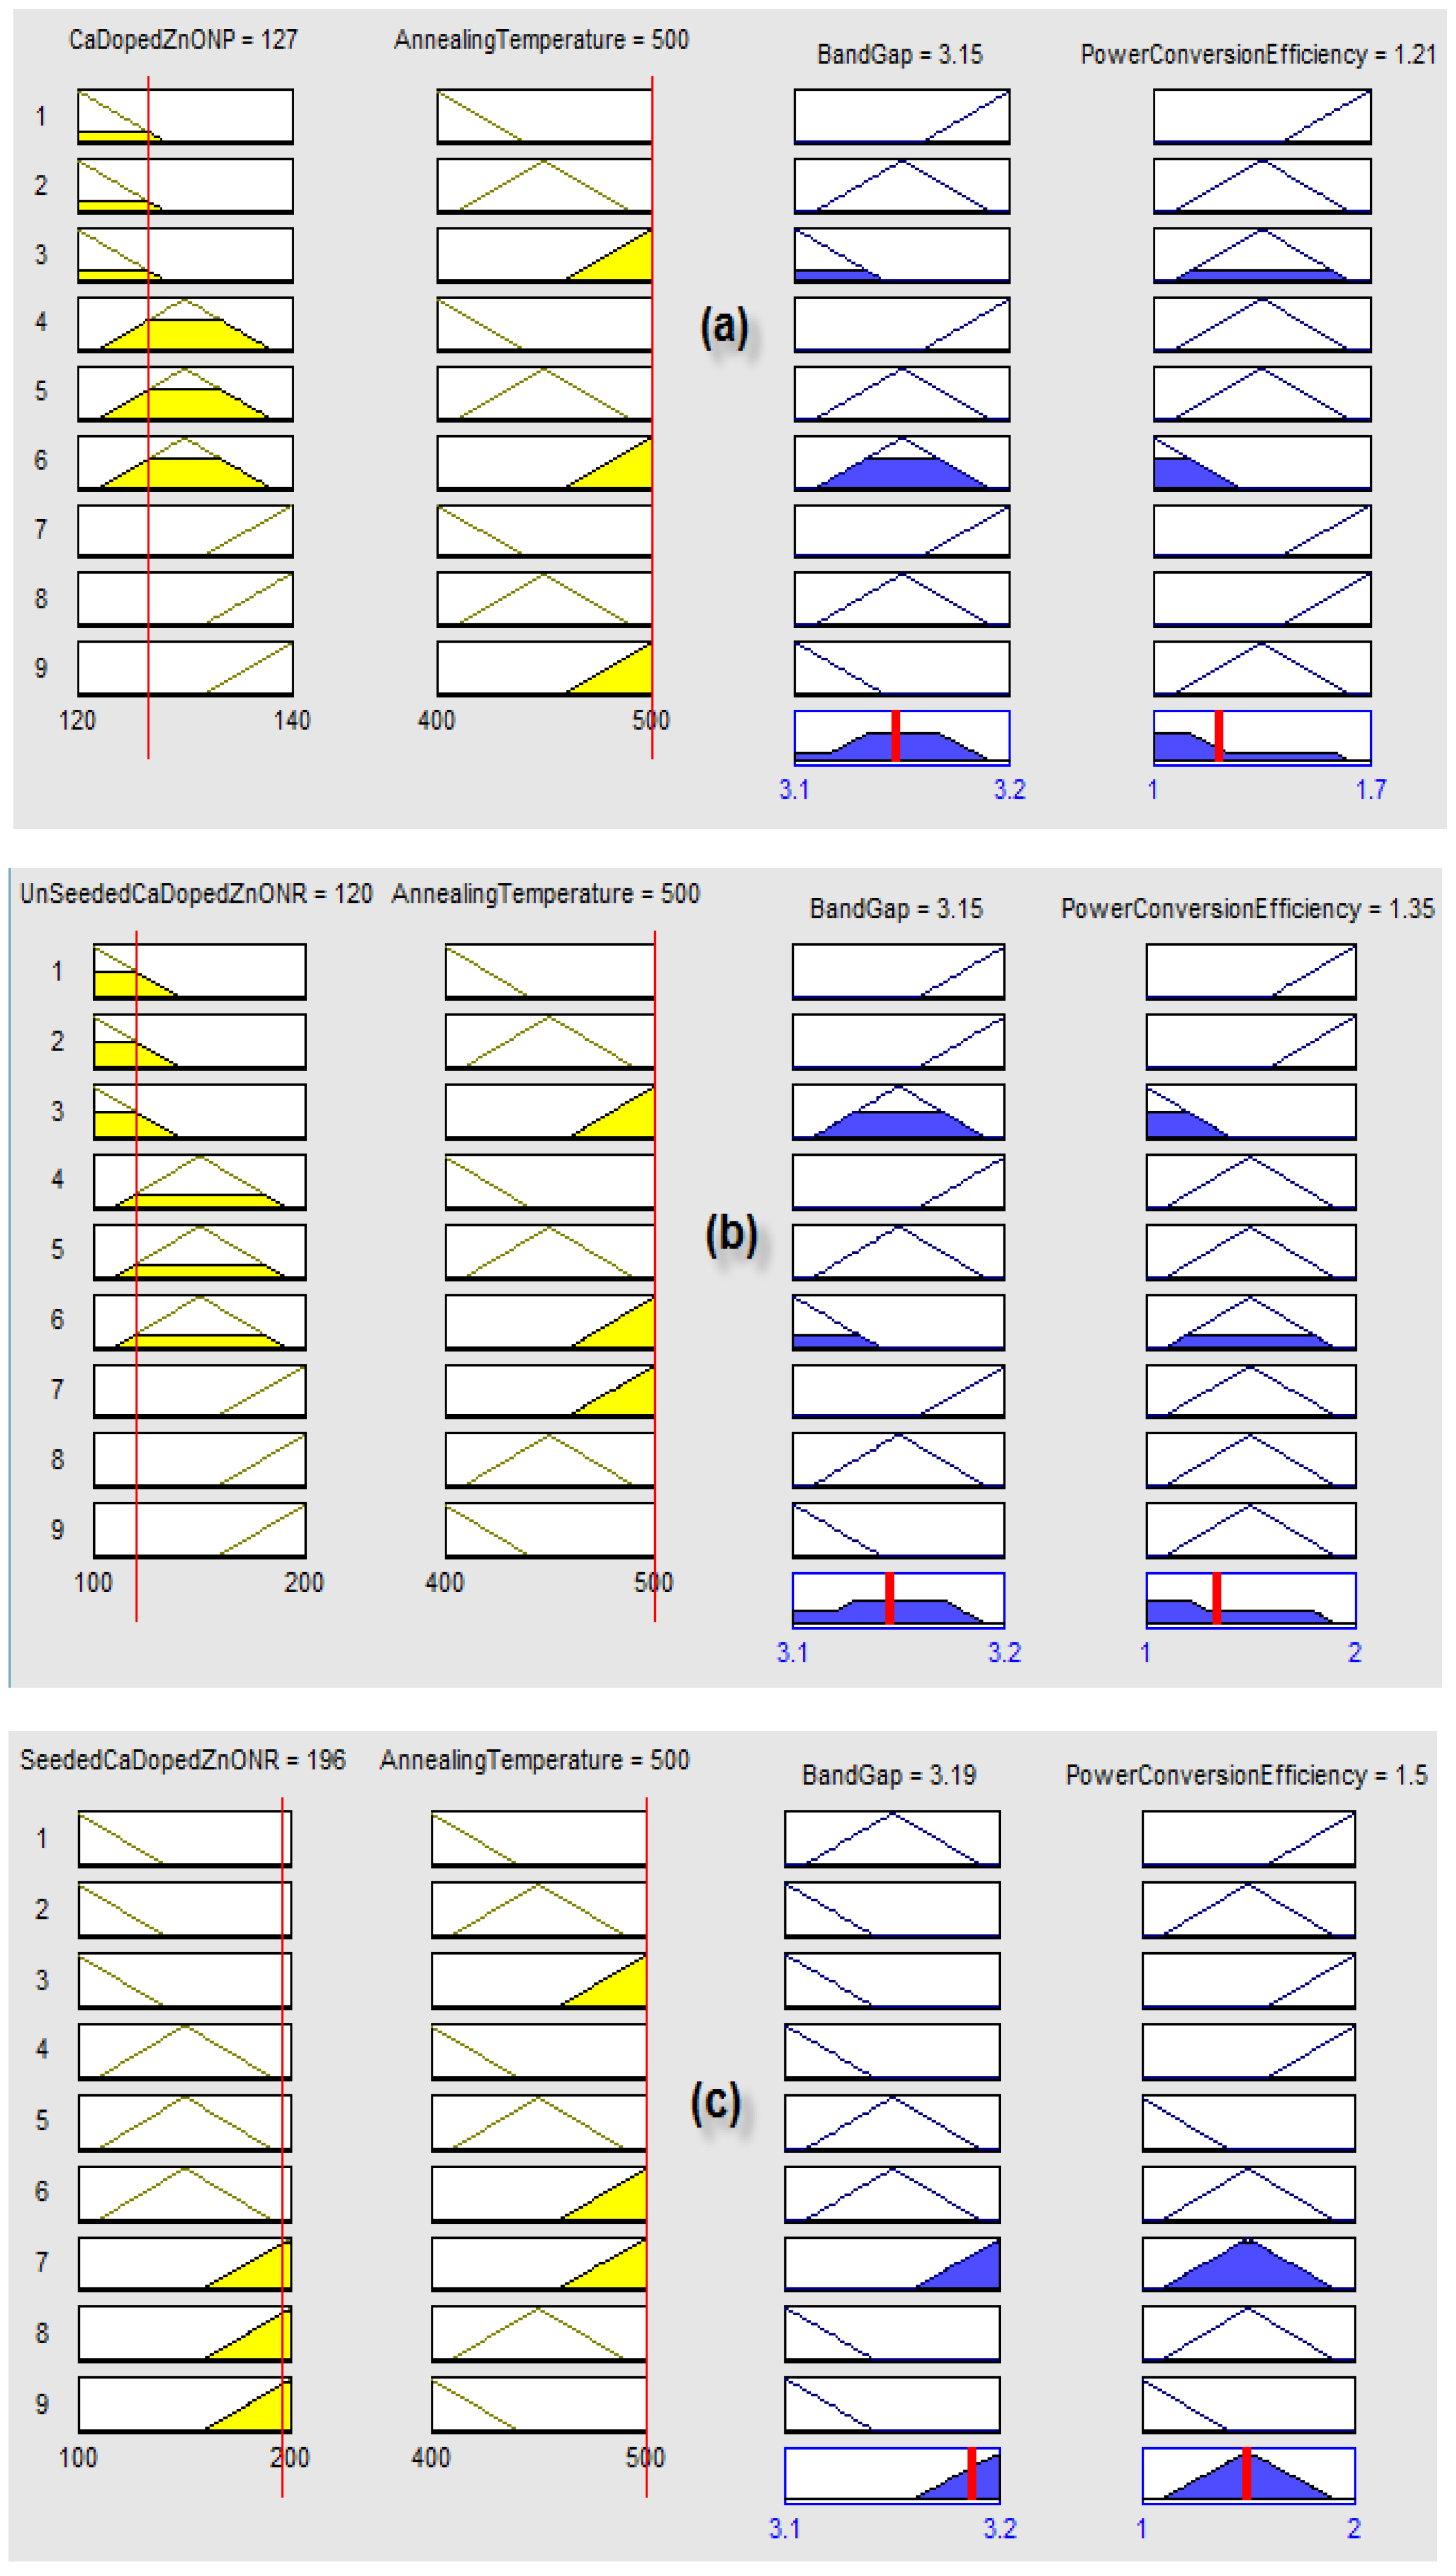
2. Fuzzy Analysis
3. Materials and Methods
Photoanode Preparation
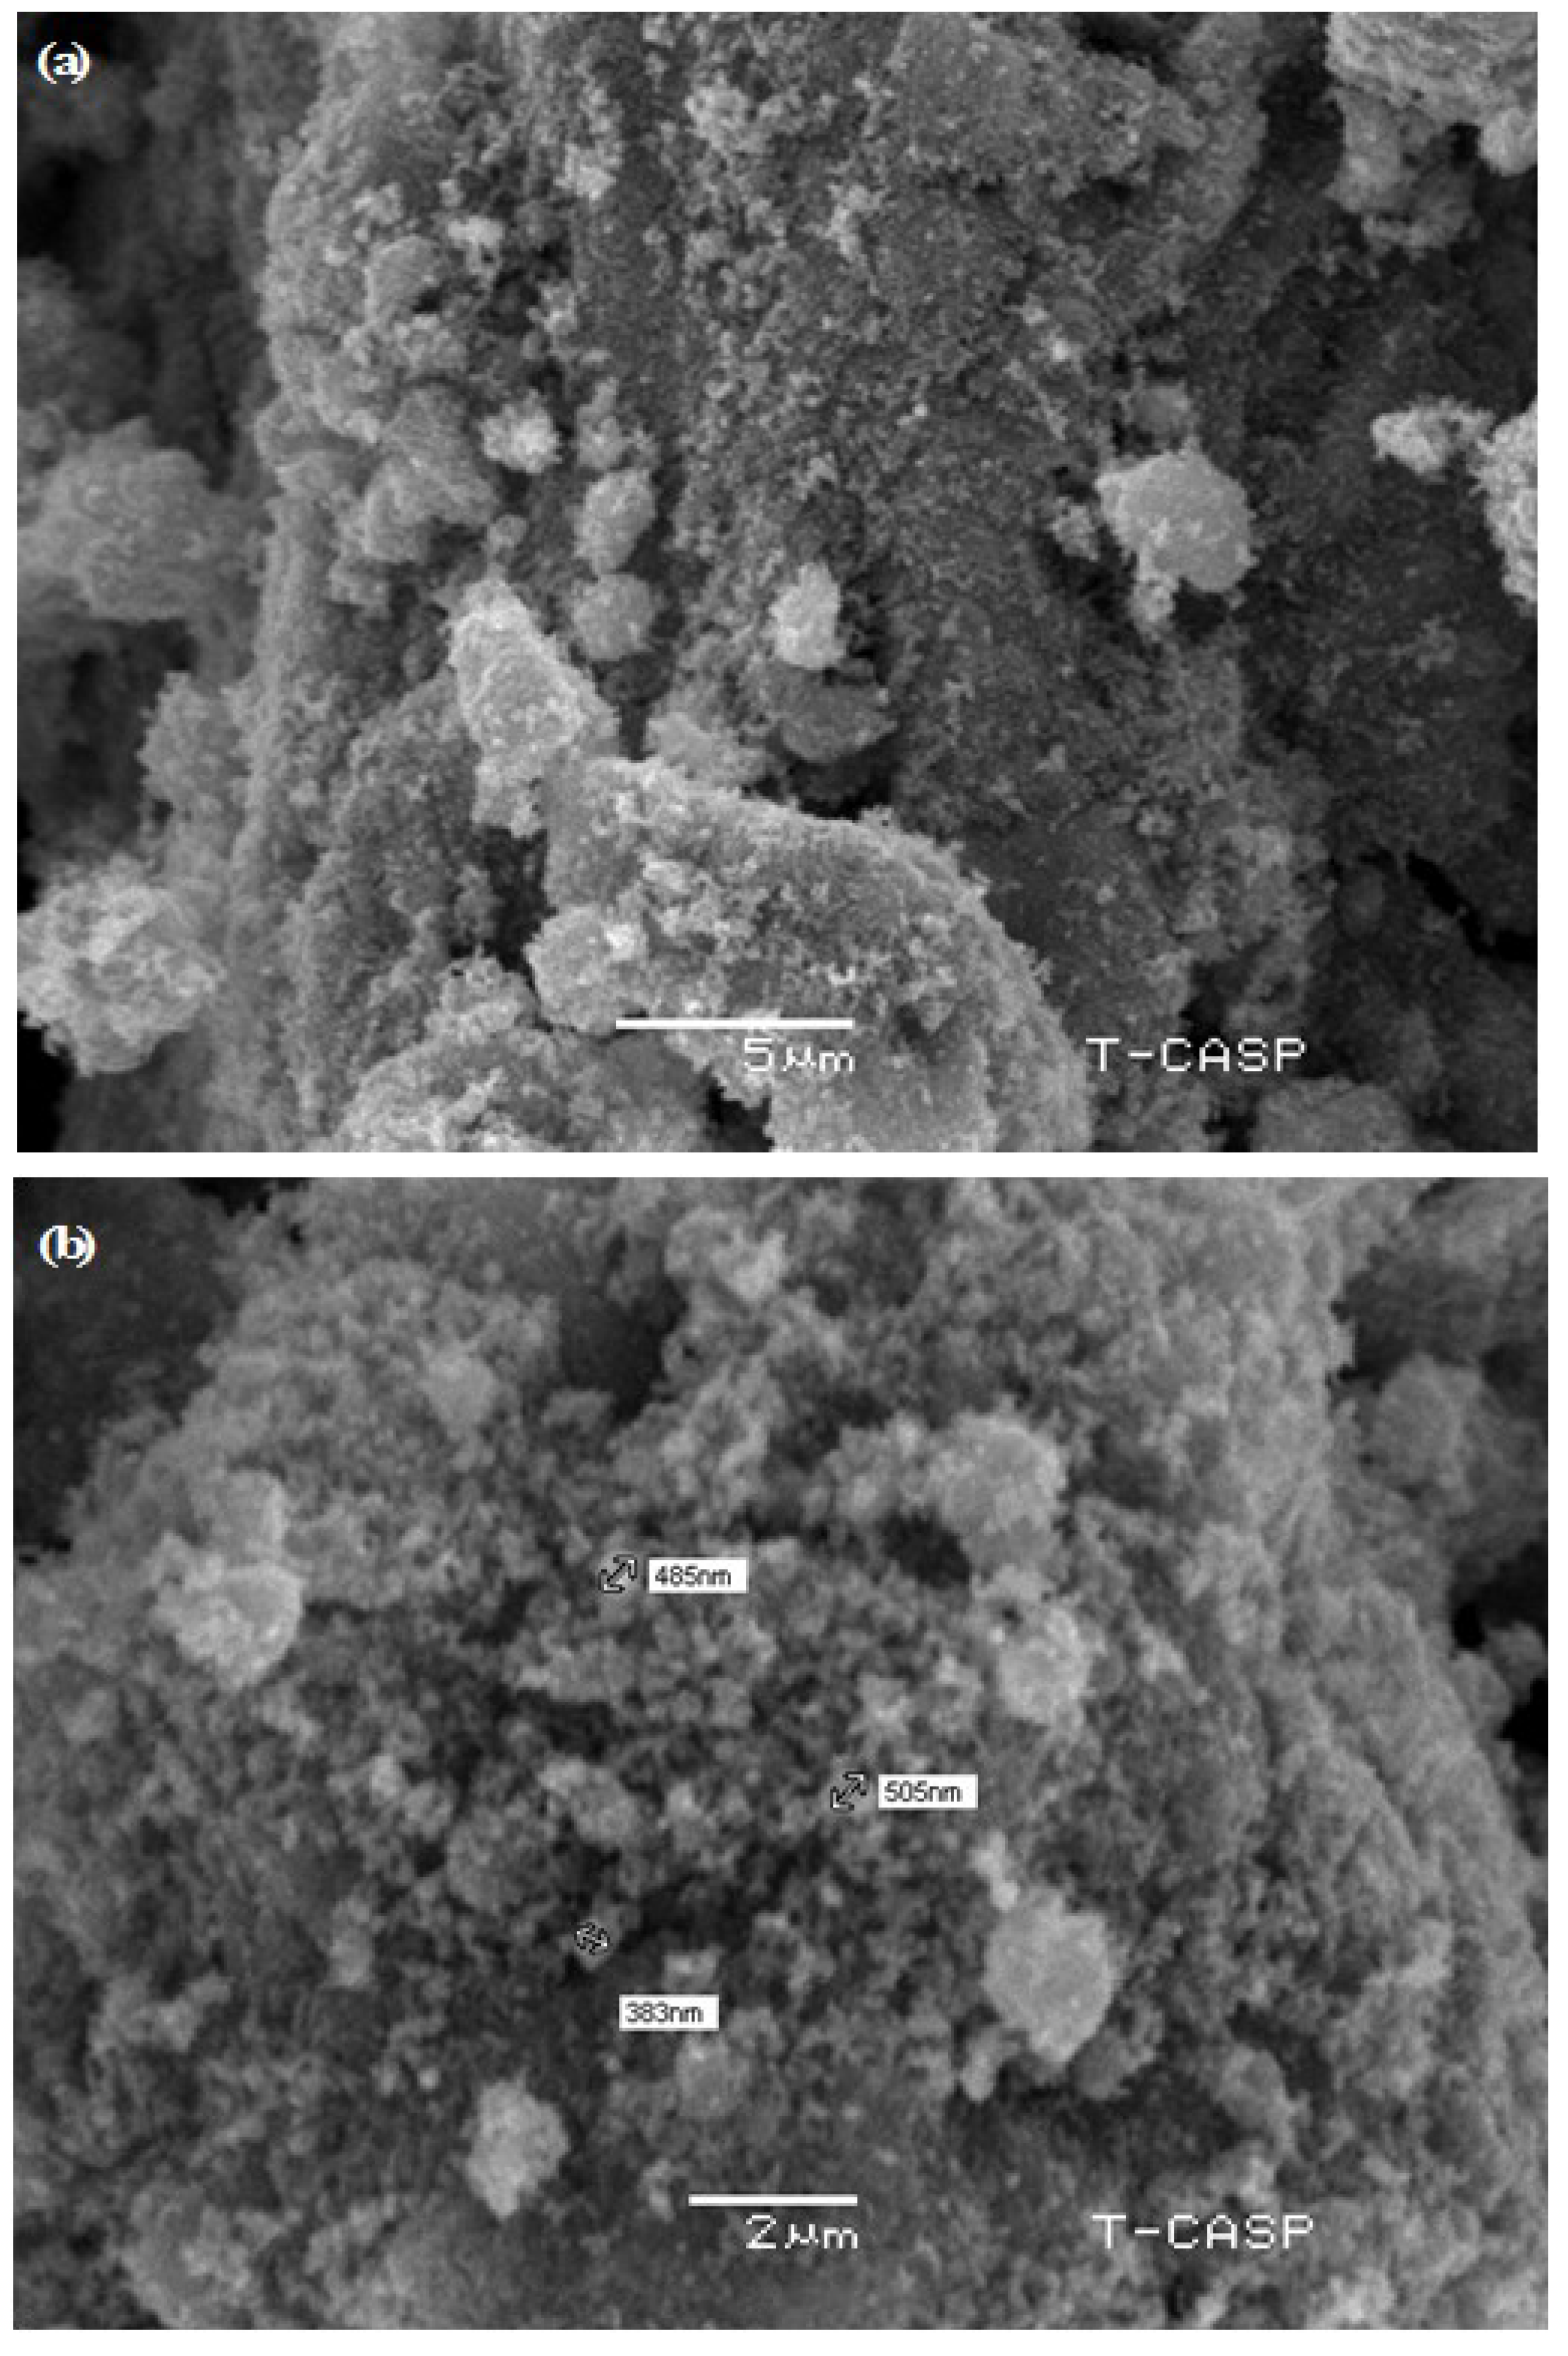
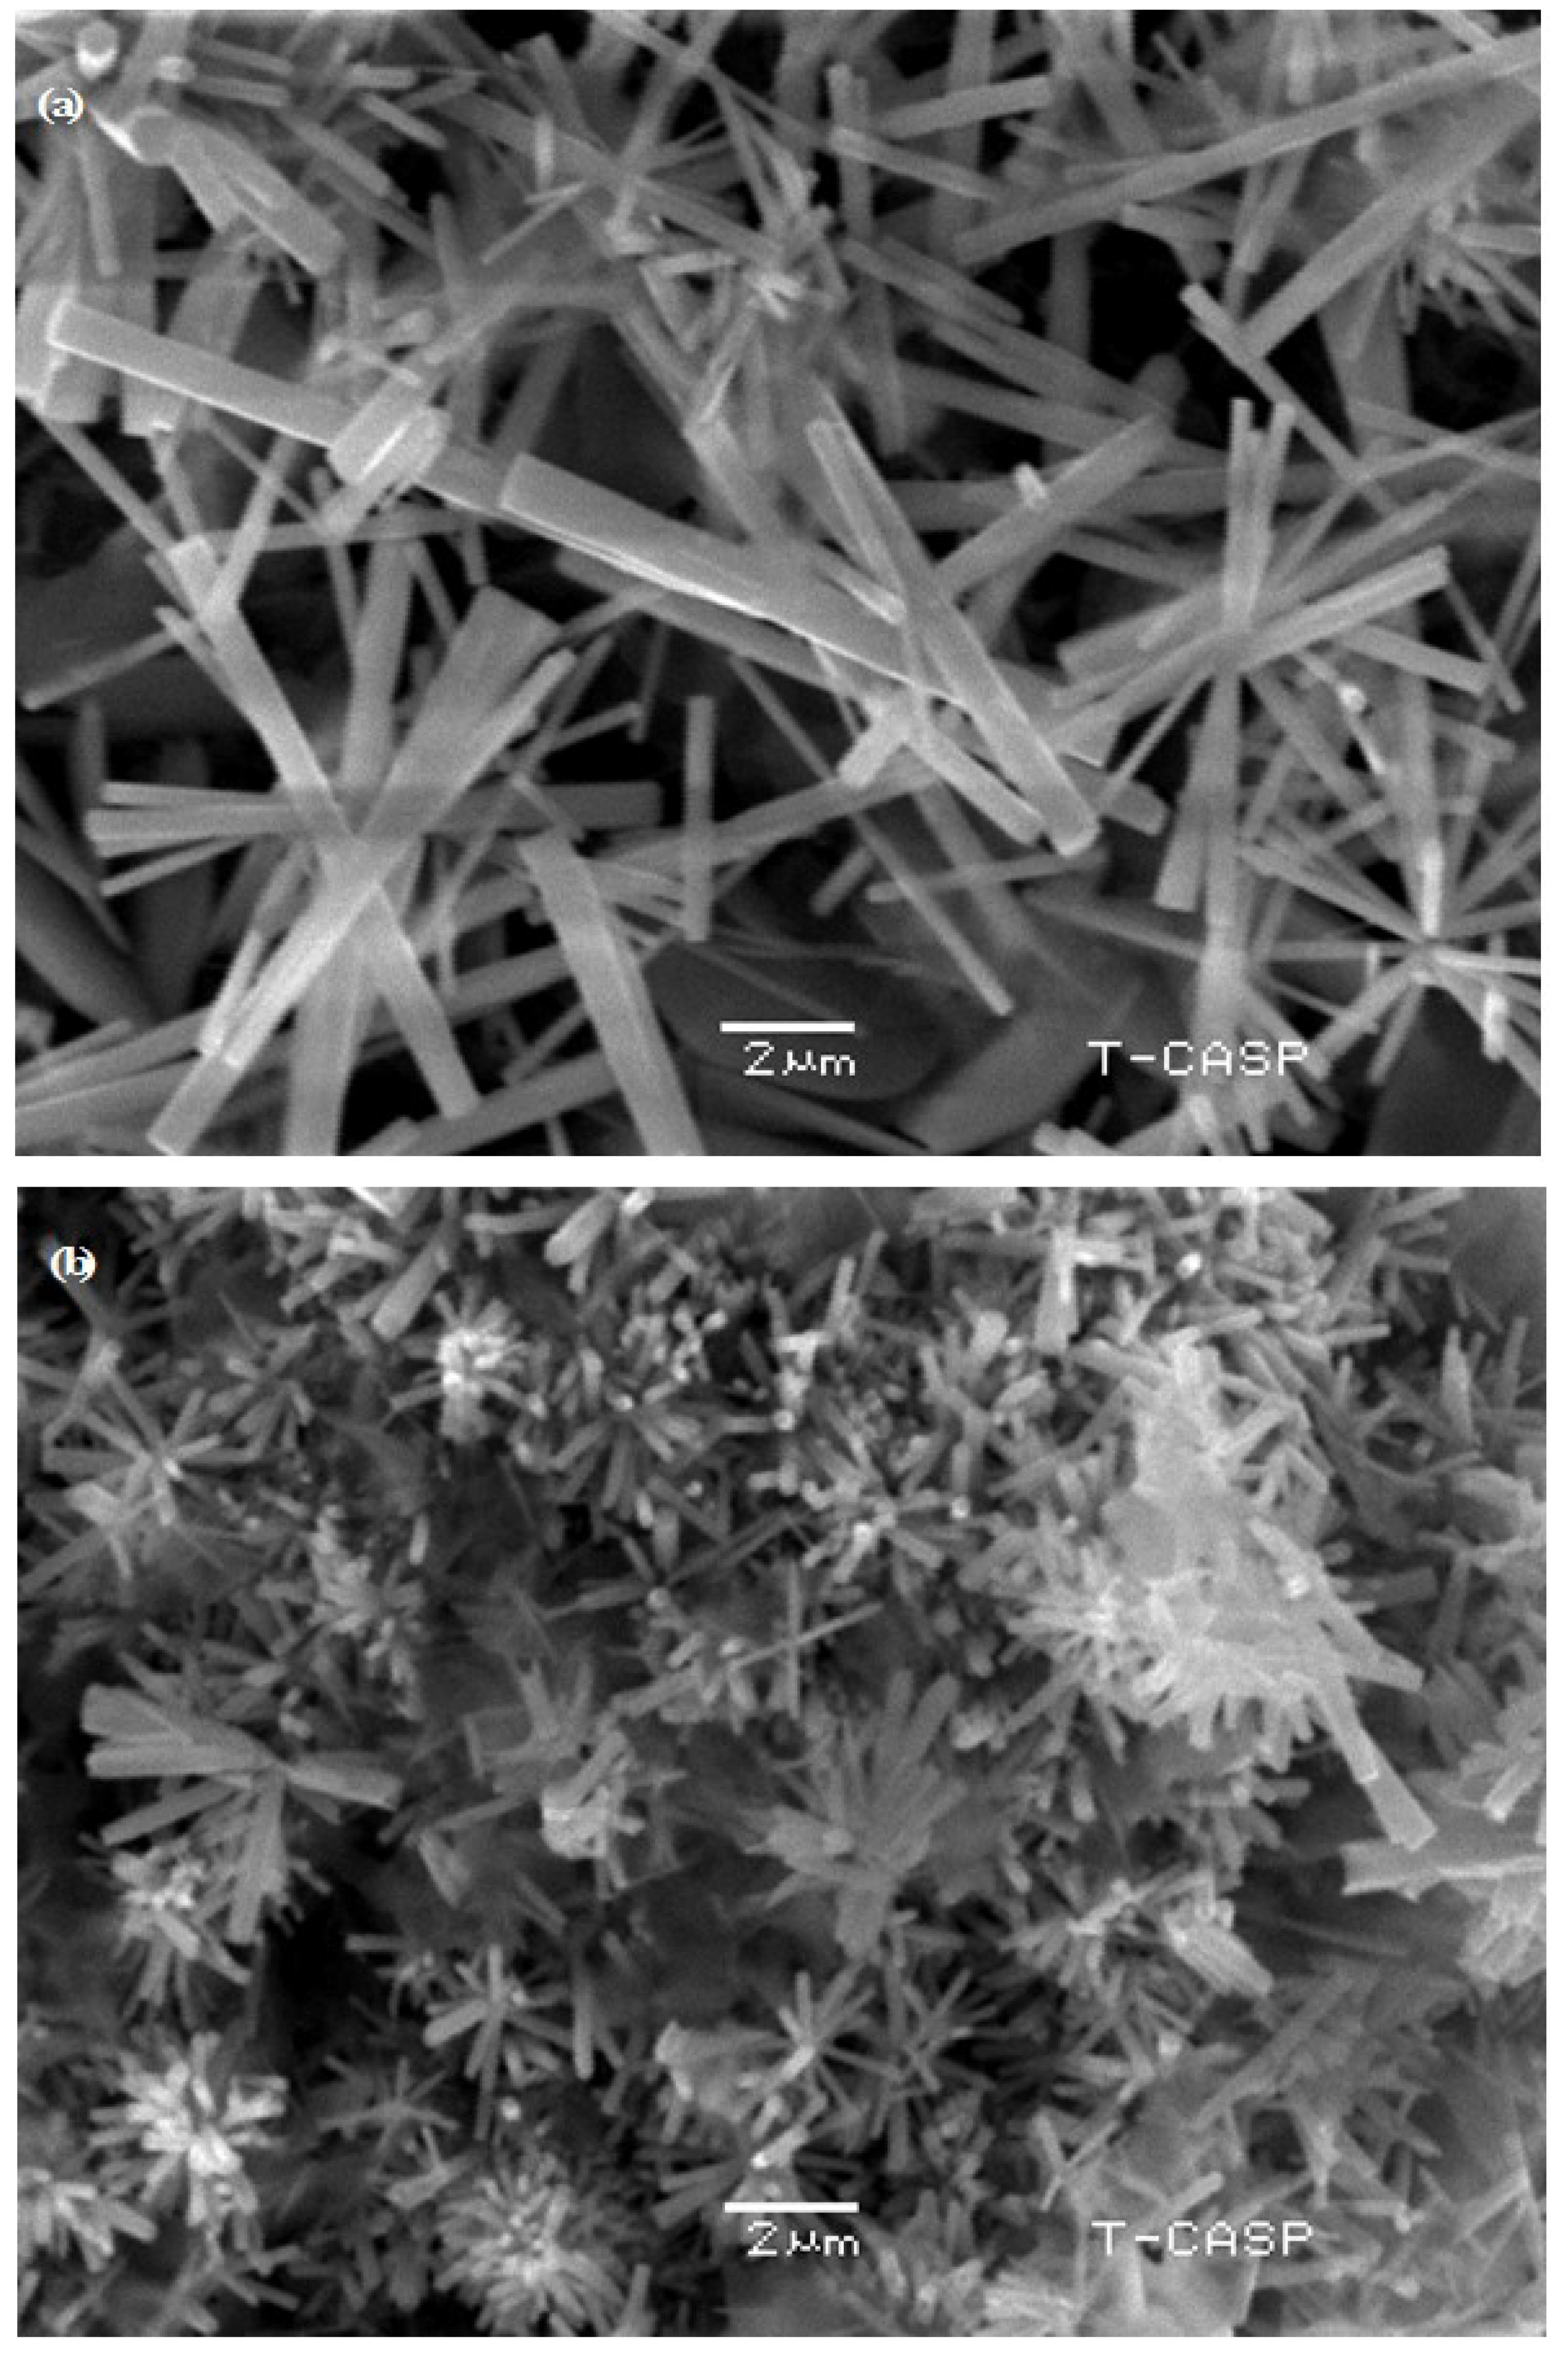
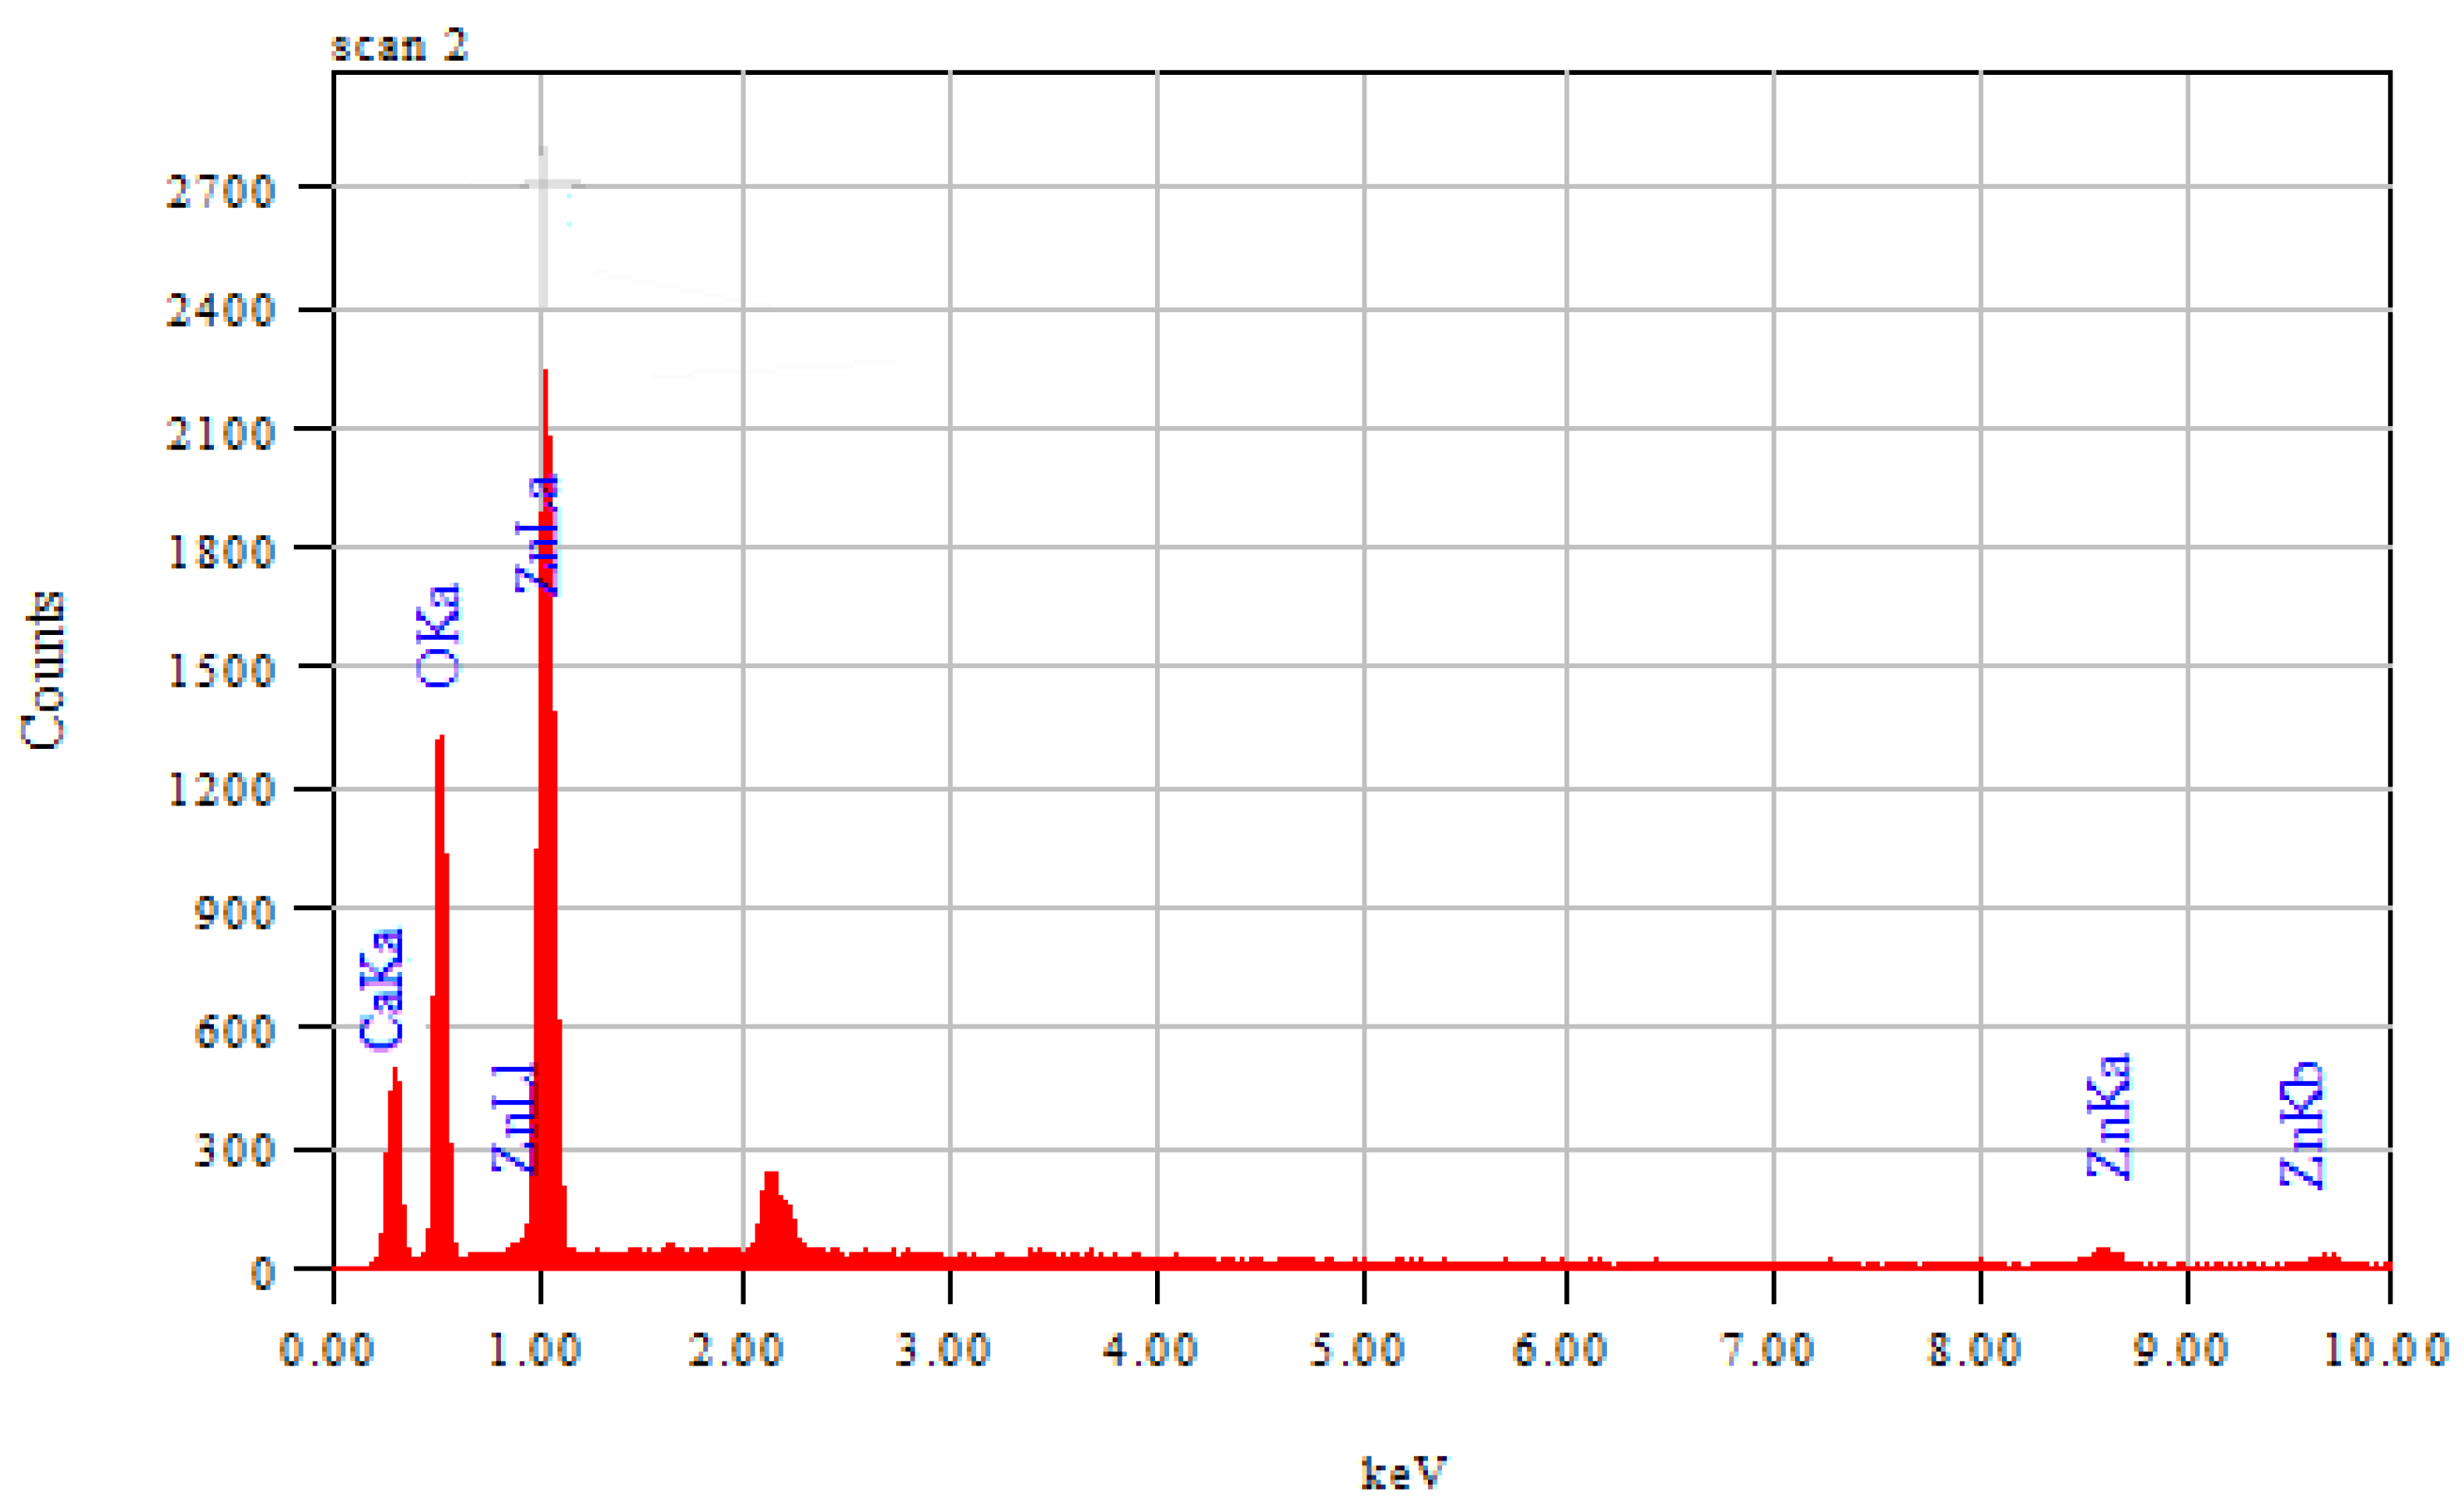
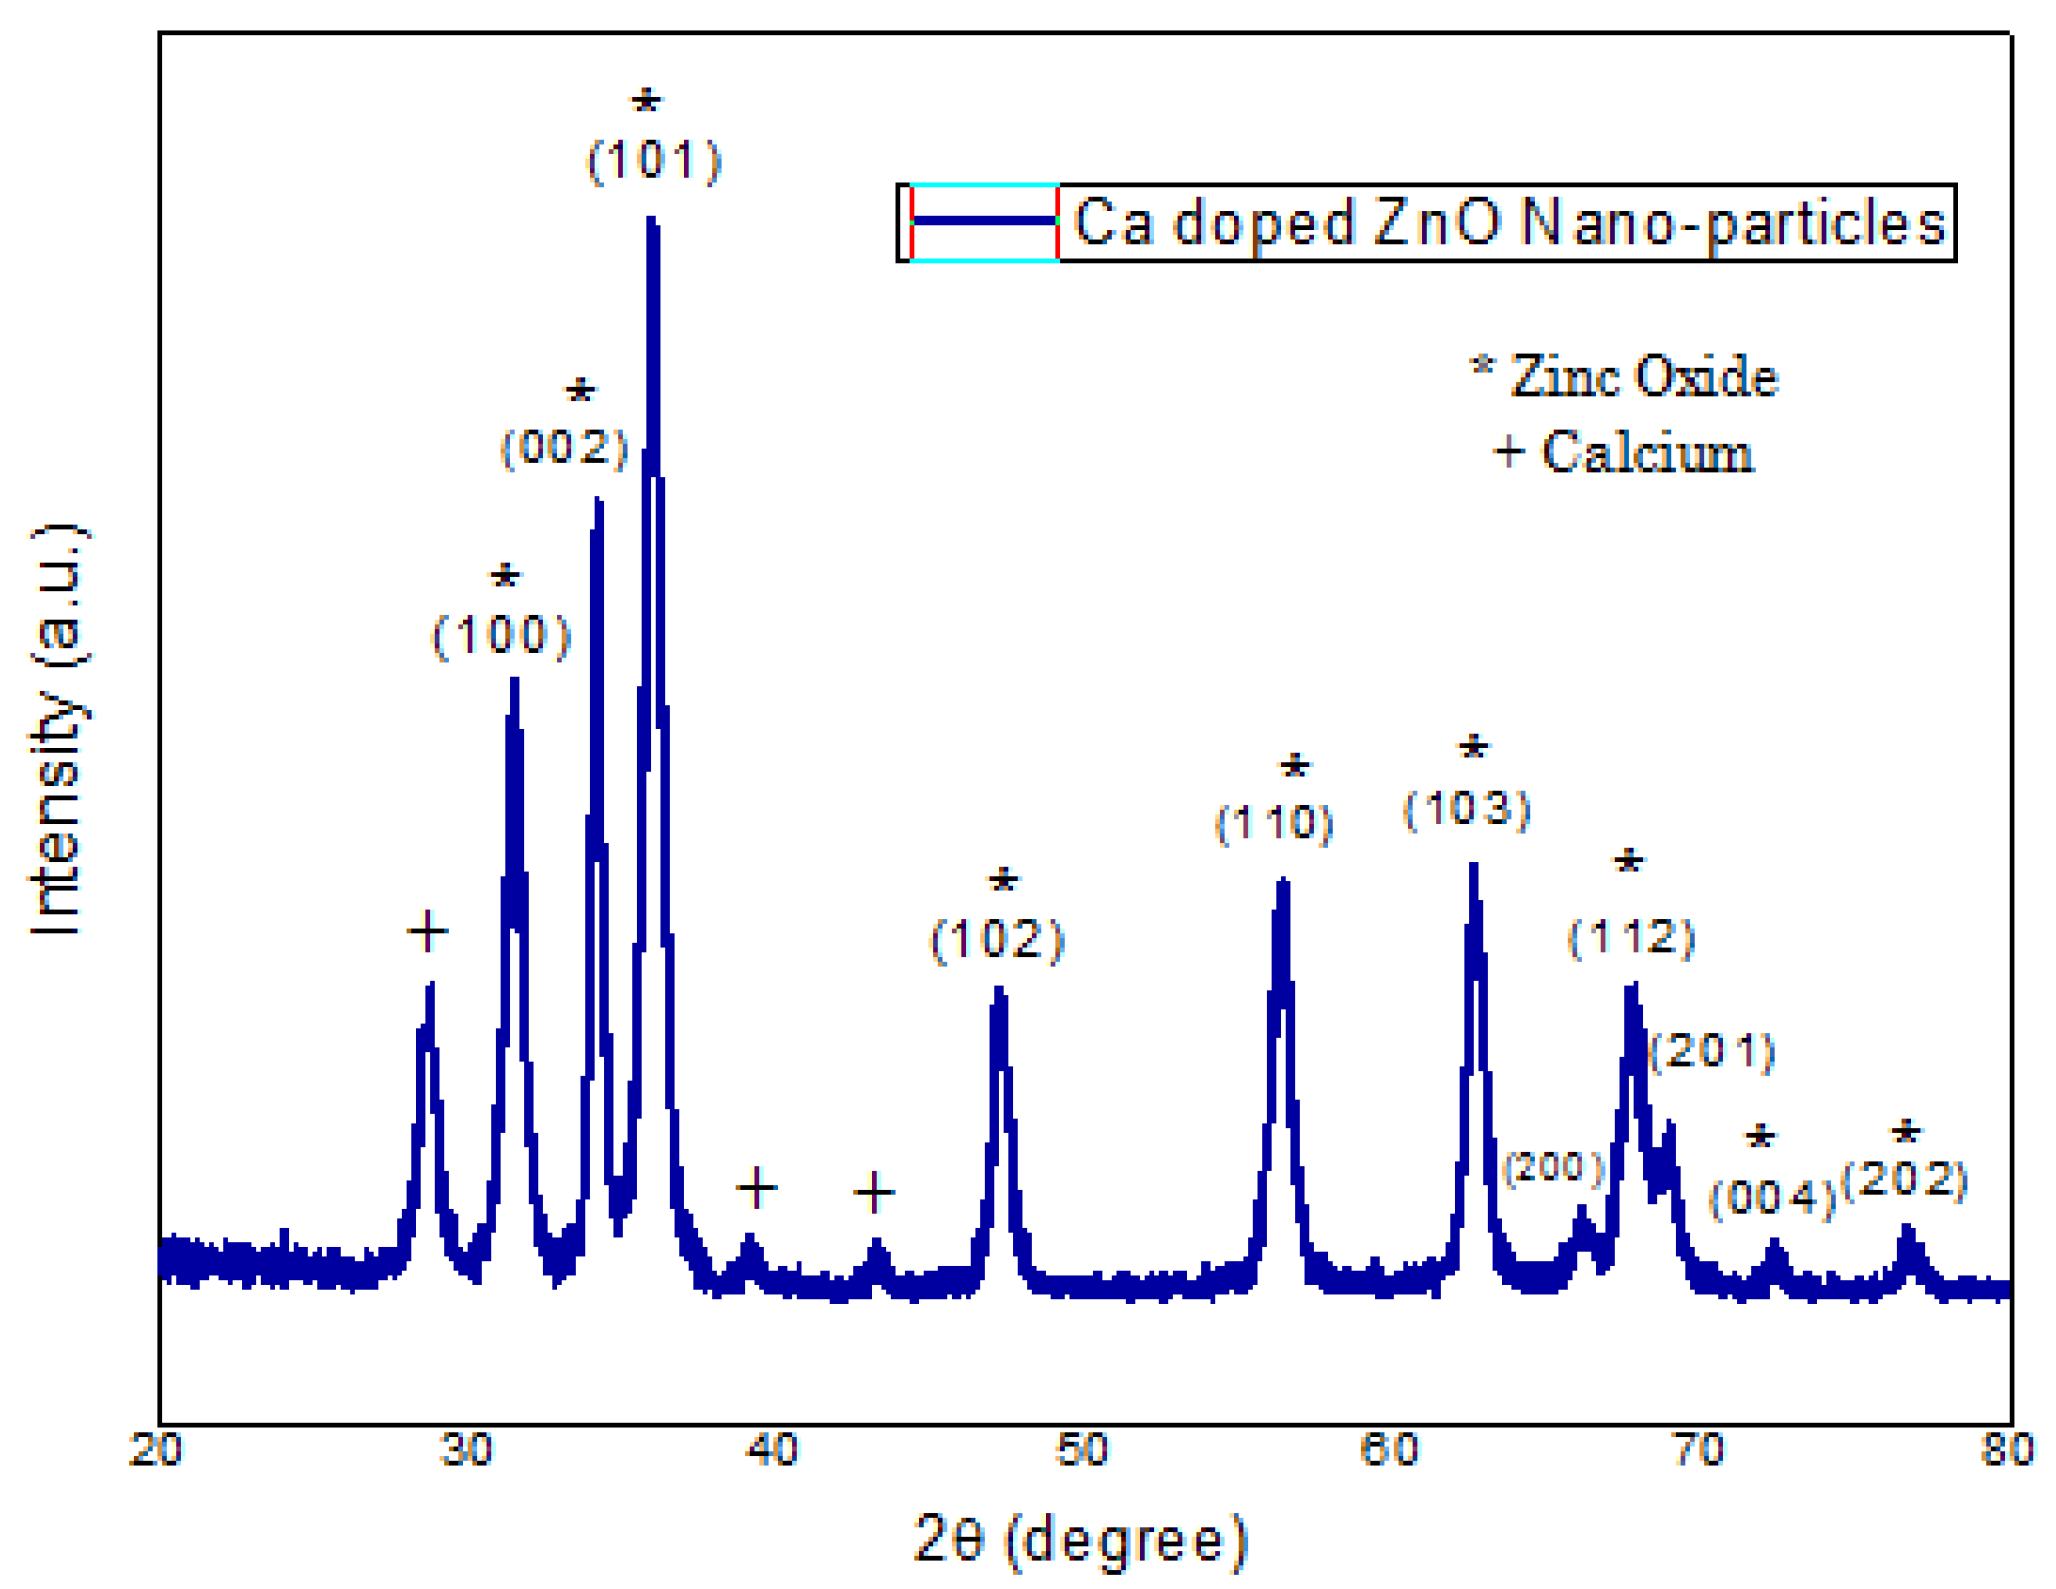
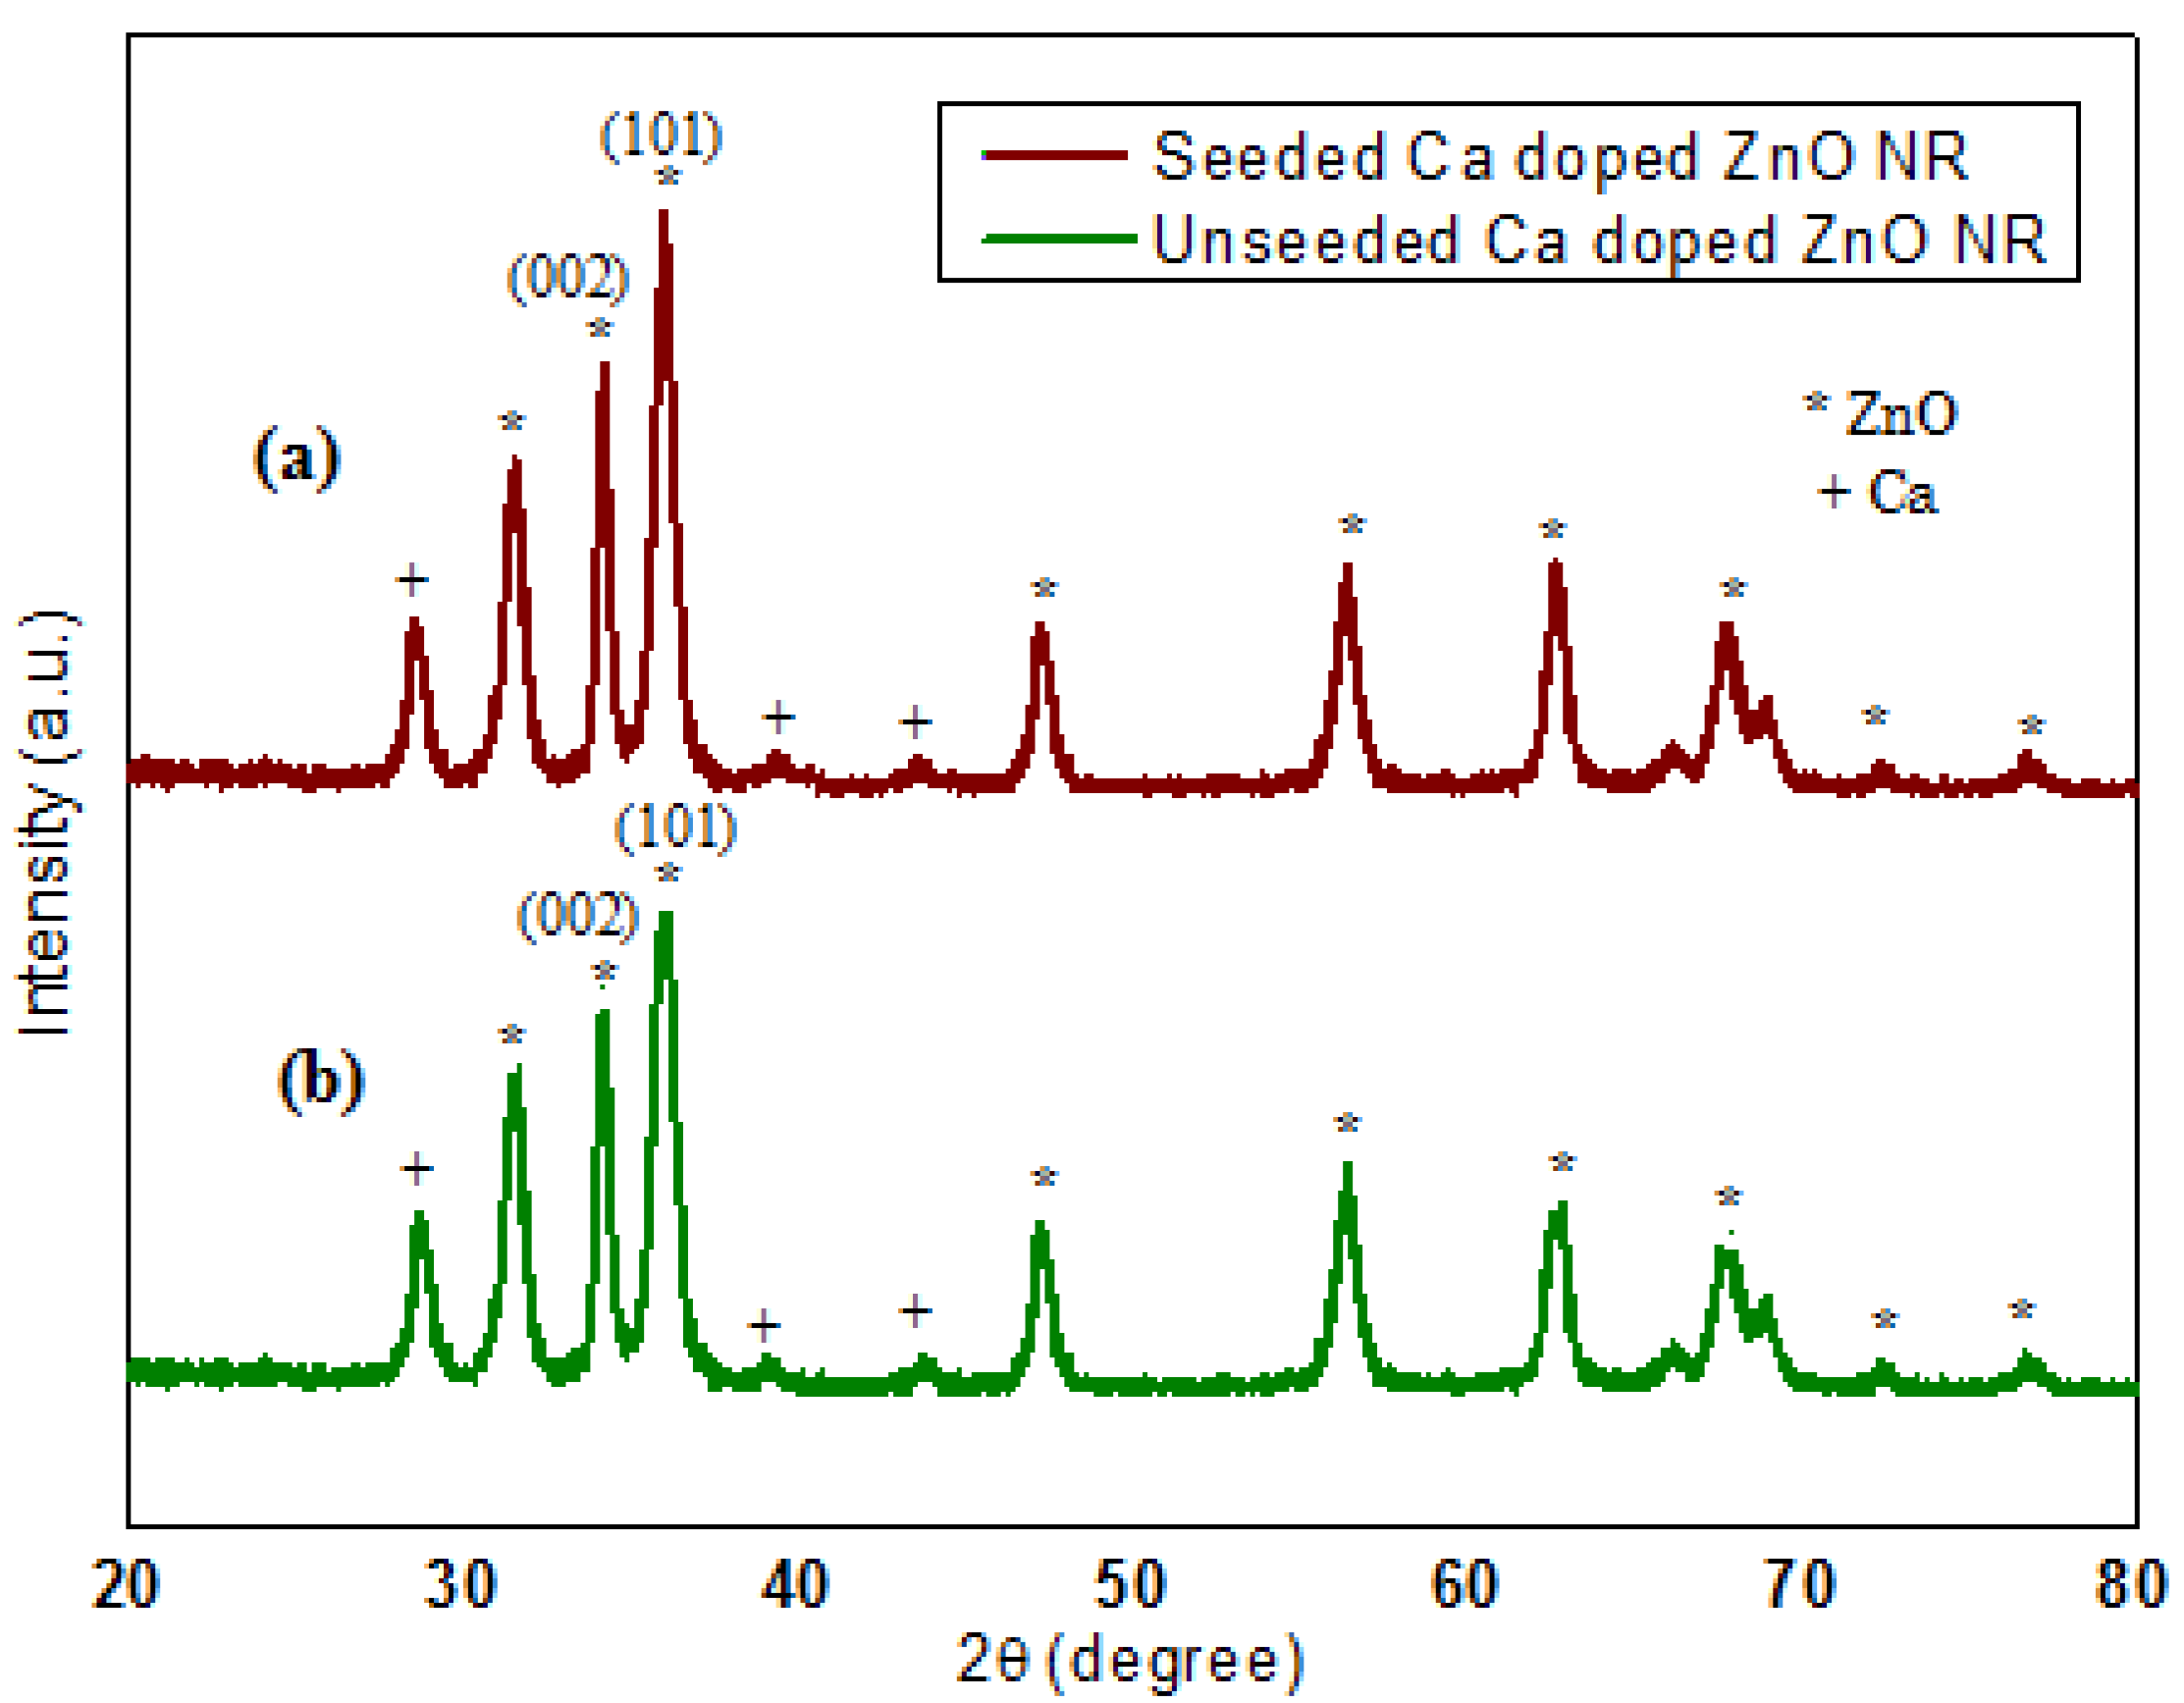
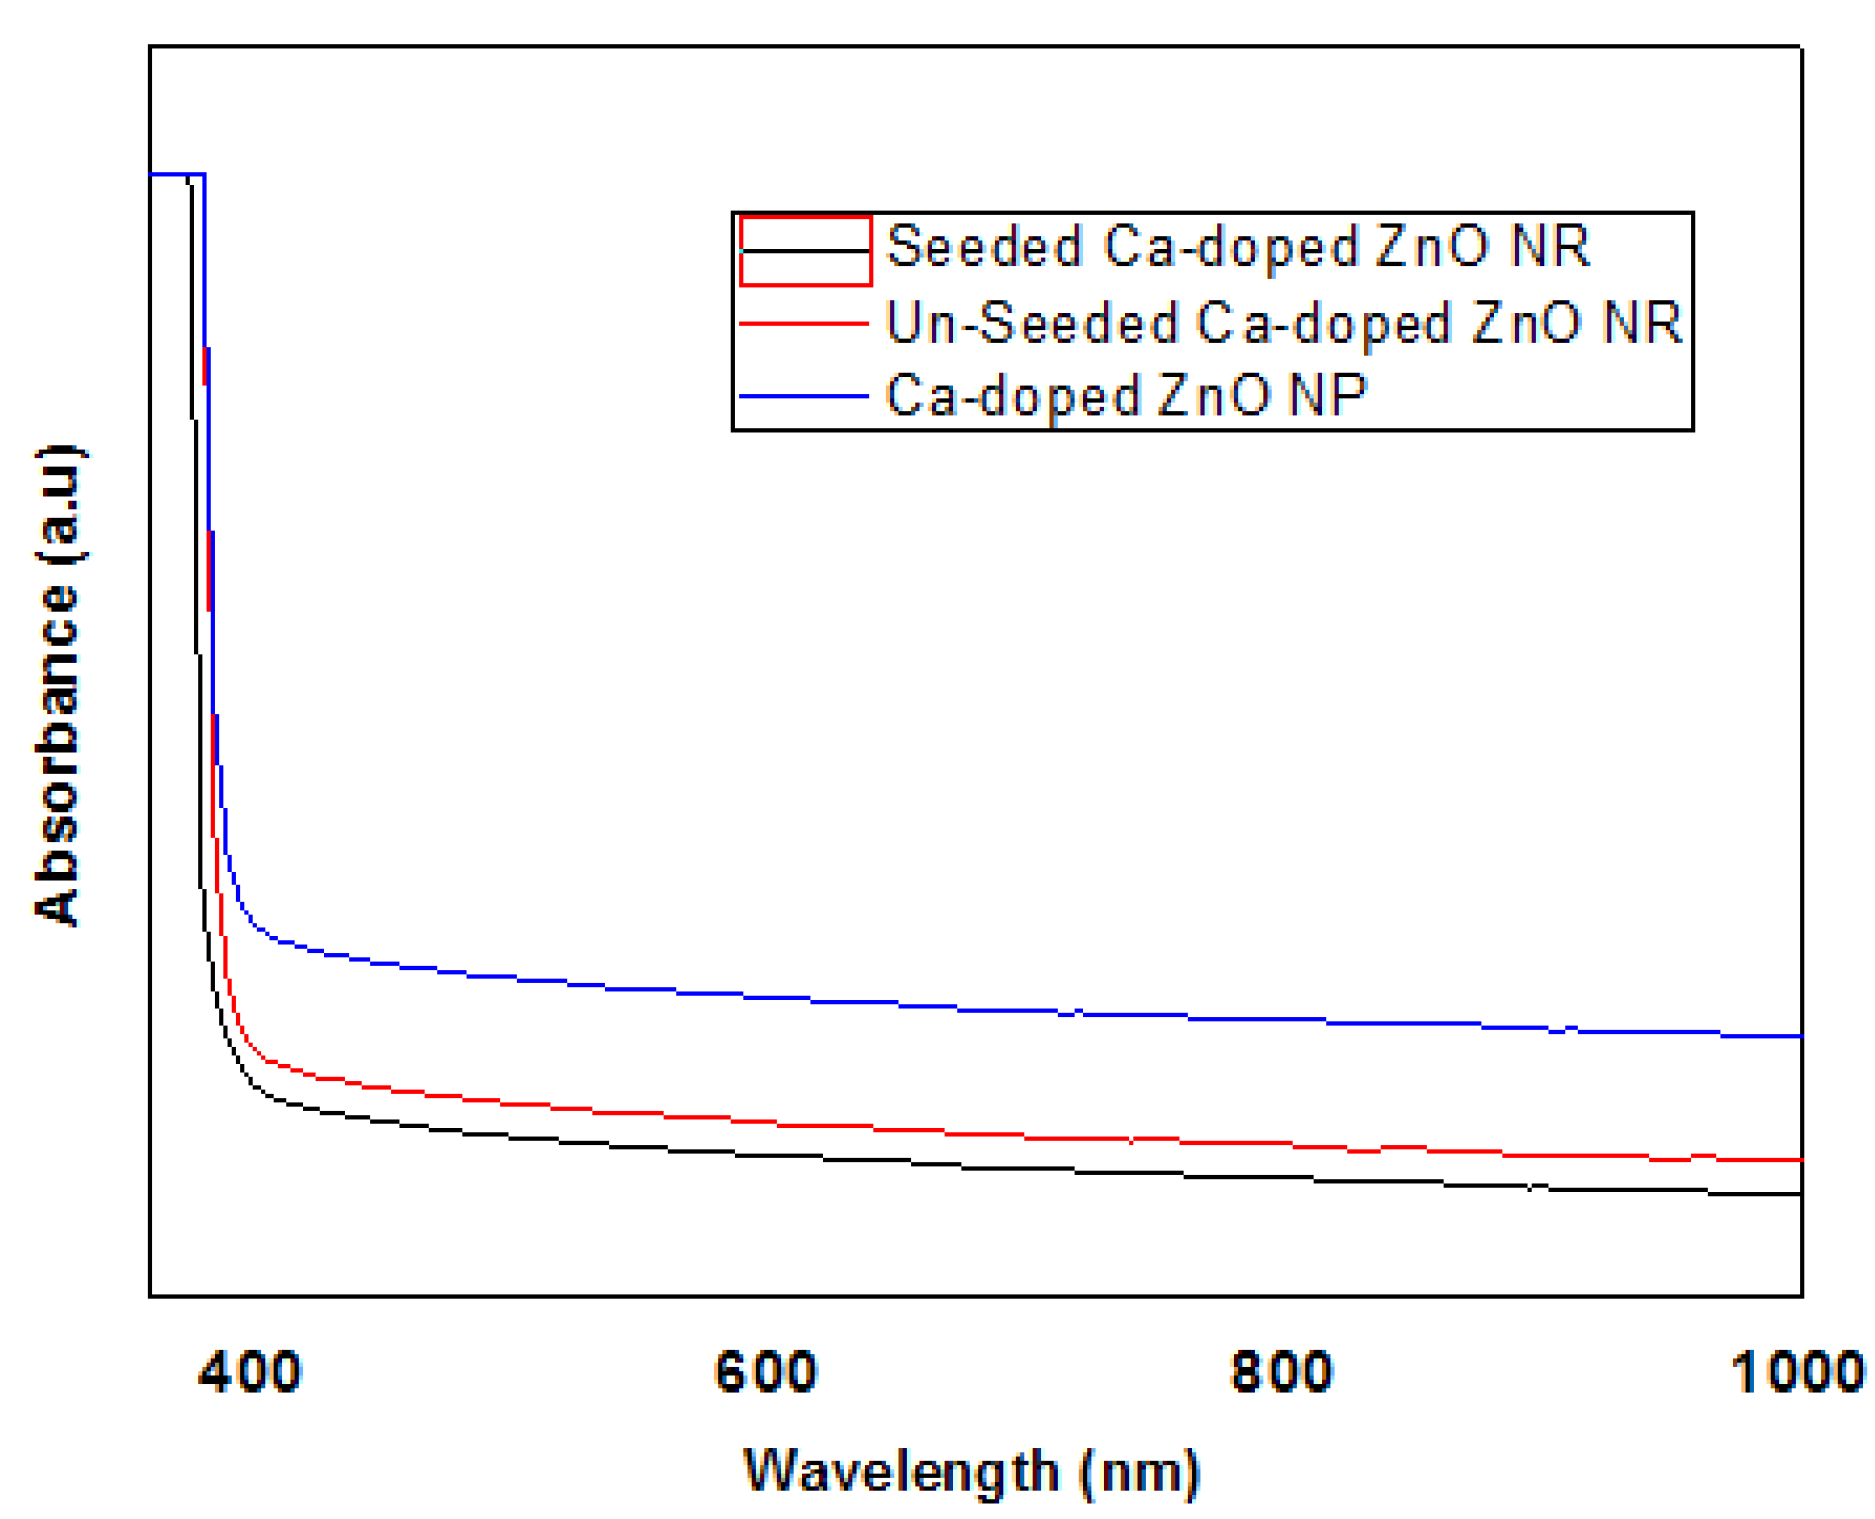
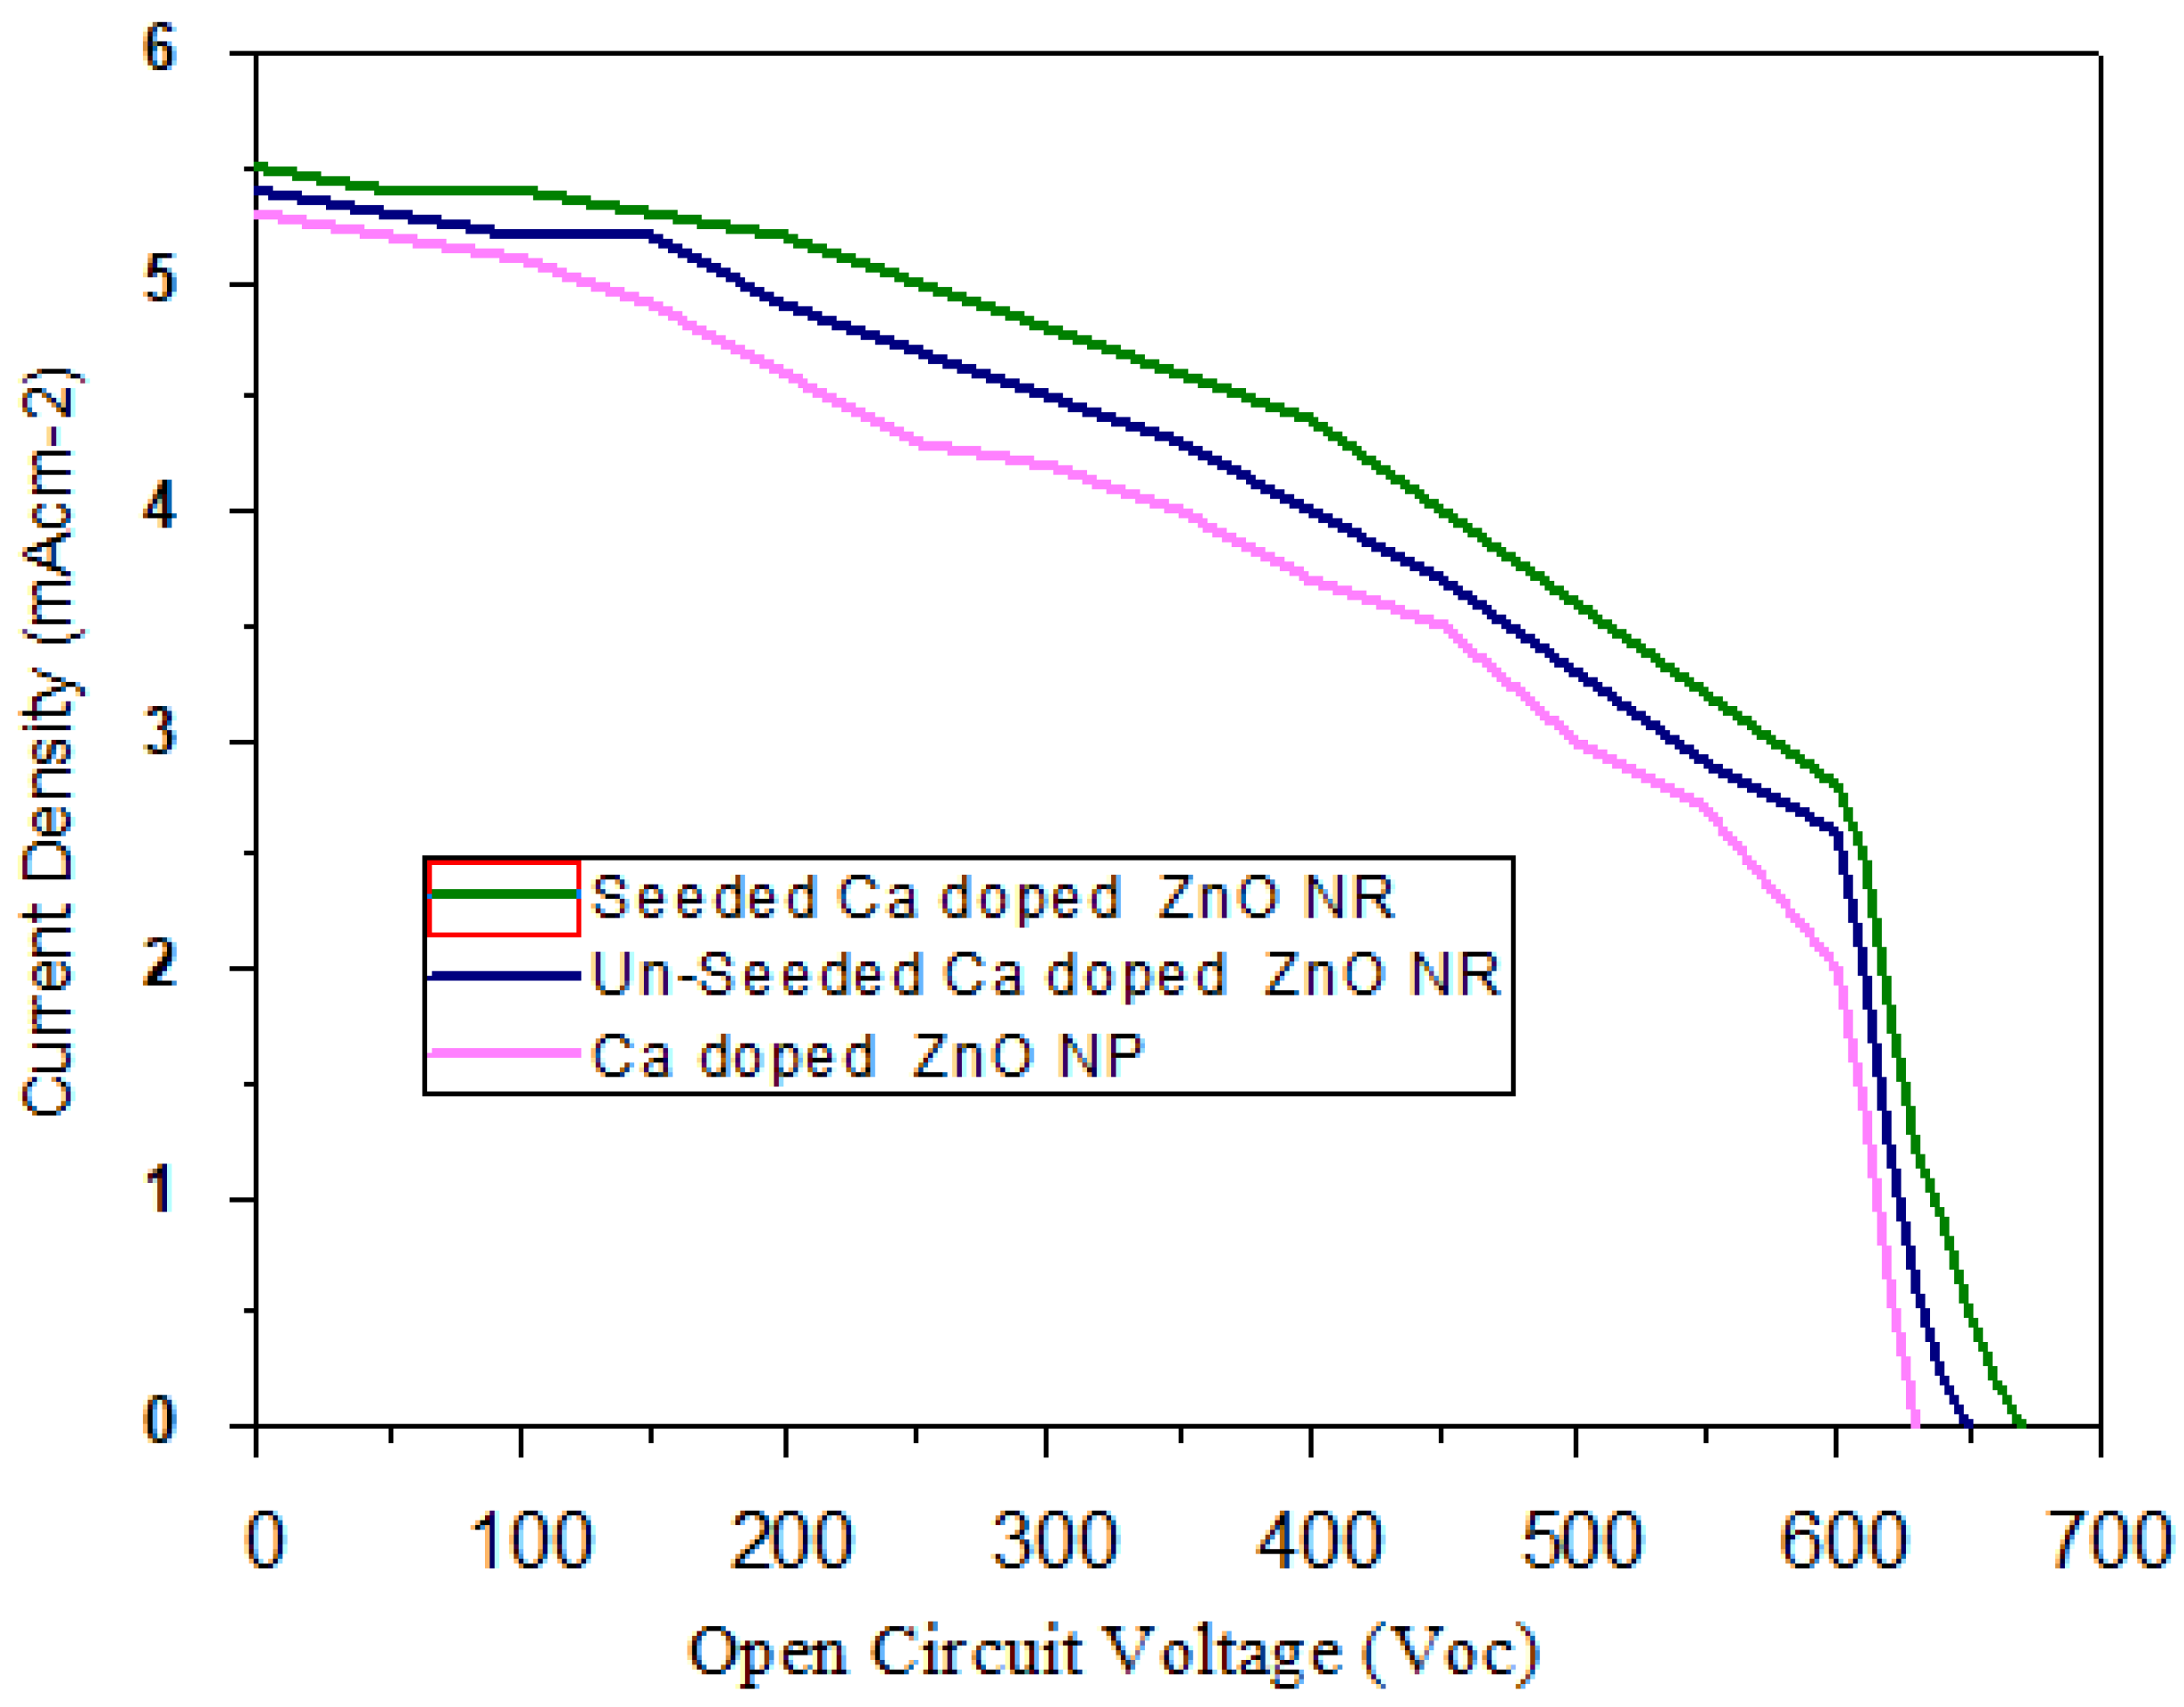
4. Results and Discussion
5. Conclusions
Author Contributions
Funding
Acknowledgments
Conflicts of Interest
References
- Selopal, G.S.; Zhao, H.; Tong, X.; Benetti, D.; Navarro-Pardo, F.; Zhou, Y.; Barba, D.; Vidal, F.; Wang, Z.M.; Rosei, F. Highly Stable Colloidal “Giant” Quantum Dots Sensitized Solar Cells. Adv. Funct. Mater. 2017, 27, 1701468. [Google Scholar] [CrossRef]
- Mehmood, U.; Rahman, S.-U.; Harrabi, K.; Hussein, I.; Reddy, B.V.S. Recent Advances in Dye Sensitized Solar Cells. Adv. Mater. Sci. Eng. 2014, 2014, 1–12. [Google Scholar] [CrossRef] [Green Version]
- O’Regan, B.; Grätzel, M.; Gr, M. A low-cost, high-efficiency solar cell based on dye-sensitized colloidal TiO2 films. Nature 1991, 353, 737–740. [Google Scholar] [CrossRef]
- Ince, M.; Yum, J.-H.; Kim, Y.; Mathew, S.; Grätzel, M.; Torres, T.; Nazeeruddin, M.K. Molecular Engineering of Phthalocyanine Sensitizers for Dye-Sensitized Solar Cells. J. Phys. Chem. C 2014, 118, 17166–17170. [Google Scholar] [CrossRef]
- Ardo, S.; Meyer, G.J. Photodriven heterogeneous charge transfer with transition-metal compounds anchored to TiO2semiconductor surfaces. Chem. Soc. Rev. 2009, 38, 115–164. [Google Scholar] [CrossRef] [PubMed]
- Suhaimi, S.; Mukhzeer, M.S.; Alahmed, Z.; Chyský, J.; Reshak, A.H. Materials for Enhanced Dye-sensitized Solar Cell Performance: Electrochemical Application. Int. J. Electrochem. Sci. 2015, 10, 2859–2871. [Google Scholar]
- Akhlaq, M.; Khan, Z.S. Synthesis and characterization of electro-spun TiO2 and TiO2-SnO2 composite nano-fibers for application in advance generation solar cells. Mater. Res. Express 2020, 7, 015523. [Google Scholar] [CrossRef]
- Dembele, K.T.; Selopal, G.S.; Soldano, C.; Nechache, R.; Rimada, J.C.; Concina, I.; Sberveglieri, G.; Rosei, F.; Vomiero, A. Hybrid Carbon Nanotubes–TiO2 Photoanodes for High Efficiency Dye-Sensitized Solar Cells. J. Phys. Chem. C 2013, 117, 14510–14517. [Google Scholar] [CrossRef]
- Hossain, M.K.; Al Mortuza, A.; Sen, S.K.; Basher, M.; Ashraf, M.; Tayyaba, S.; Mia, M.; Uddin, M.J. A comparative study on the influence of pure anatase and Degussa-P25 TiO2 nanomaterials on the structural and optical properties of dye sensitized solar cell (DSSC) photoanode. Optik 2018, 171, 507–516. [Google Scholar] [CrossRef]
- Rani, R.; Sharma, S. Preparation and Characterization of SnO2 Nanofibers via Electrospinning. Adv. Nanoparticles 2016, 5, 53–59. [Google Scholar] [CrossRef] [Green Version]
- Martinson, A.B.F.; Elam, J.W.; Hupp, J.T.; Pellin, M. ZnO Nanotube Based Dye-Sensitized Solar Cells. Nano Lett. 2007, 7, 2183–2187. [Google Scholar] [CrossRef] [PubMed]
- Gong, J.; Liang, J.; Krishnan, S. Review on dye-sensitized solar cells (DSSCs): Fundamental concepts and novel materials. Renew. Sustain. Energy Rev. 2012, 16, 5848–5860. [Google Scholar] [CrossRef]
- Liu, X.; Yuan, R.; Liu, Y.; Zhu, S.; Lin, J.; Chen, X. Niobium pentoxide nanotube powder for efficient dye-sensitized solar cells. New J. Chem. 2016, 40, 6276–6280. [Google Scholar] [CrossRef]
- Kim, K.H.; Utashiro, K.; Abe, Y.; Kawamura, M. Structural Properties of Zinc Oxide Nanorods Grown on Al-Doped Zinc Oxide Seed Layer and Their Applications in Dye-Sensitized Solar Cells. Materials 2014, 7, 2522–2533. [Google Scholar] [CrossRef]
- Ali, B.; Ashraf, M.W.; Tayyaba, S. Simulation, Fuzzy Analysis and Development of ZnO Nanostructure-based Piezoelectric MEMS Energy Harvester. Energies 2019, 12, 807. [Google Scholar] [CrossRef] [Green Version]
- Basher, M.K.; Khalid Hossain, M.; Afaz, R.; Tayyaba, S.; Akand, M.A.R.; Rahman, M.T.; Eman, N.M. Study and investigation of phosphorus doping time on emitter region for contact resistance optimization of monocrystalline silicon solar cell. Results Phys. 2018, 10, 205–211. [Google Scholar] [CrossRef]
- Yangyang, Z.; Manoj, K.R.; Elias, K.S.; Yogi, D.G. Synthesis, Characterization, and Applications of ZnO Nanowires. J. Nanomater. 2012, 2012, 22. [Google Scholar]
- Umar, A.; Singh, P.; Al-Ghamdi, A.A.; Al-Heniti, S. Direct growth of ZnO nanosheets on FTO substrate for dye-sensitized solar cells applications. J. Nanosci. Nanotechnol. 2010, 10, 6666–6671. [Google Scholar] [CrossRef]
- Wahyuono, R.A.; Schmidt, C.; Dellith, A.; Dellith, J.; Schulz, M.; Seyring, M.; Rettenmayr, M.; Plentz, J.; Dietzek, B. ZnO nanoflowers-based photoanodes: Aqueous chemical synthesis, microstructure and optical properties. Open Chem. 2016, 14, 158–169. [Google Scholar] [CrossRef]
- Sunandan, B.; Joydeep, D. Hydrothermal growth of ZnO nanostructures. Sci. Technol. Adv. Mater. 2009, 10, 13001. [Google Scholar]
- Gupta, A.K.; Kashyap, V.; Gupta, B.K.; Nandi, S.P.; Saxena, K.; Khare, N. Synthesis of ZnO Nanorods by Electrochemical Deposition Method and Its Antibacterial Activity. J. Nanoeng. Nanomanufact. 2013, 3, 348–352. [Google Scholar] [CrossRef]
- Wu, J.-J.; Liu, S.-C. Low-Temperature Growth of Well-Aligned ZnO Nanorods by Chemical Vapor Deposition. Adv. Mater. 2002, 14, 215–218. [Google Scholar] [CrossRef]
- Seung, C.L.; Ye, Z.; Cheol, J.L.; Hyun, R.; Hwack, J.L. Low-Temperature Growth of ZnO Nanowire Array by a Simple Physical Vapor-Deposition Method. Chem. Mater. 2003, 15, 3294–3299. [Google Scholar]
- Mahshid, P.; Pirooz, M.; Davoud, H.F.; Mohammadreza, K.E. Synthesis of ZnO nanorods via chemical bath deposition method: The effects of physicochemical factors. Ceram. Int. 2016, 42, 173–184. [Google Scholar]
- Polat, I.; Yılmaz, S.; Tomakin, M.; Bacaksız, E. Role of Mg doping in the structural, optical, and electrical characteristics of ZnO-based DSSCs. Turk. J. Phys. 2017, 41, 160–170. [Google Scholar] [CrossRef]
- Istrate, A.-I.; Nastase, F.; Mihalache, I.; Comanescu, F.; Gavrila, R.; Tutunaru, O.; Romanitan, C.; Tucureanu, V.; Nedelcu, M.; Müller, R. Synthesis and characterization of Ca doped ZnO thin films by sol–gel method. J. Sol-Gel Sci. Technol. 2019, 92, 585–597. [Google Scholar] [CrossRef]
- Mahdhi, H.; Djessas, K.; Ben Ayadi, Z. Synthesis and characteristics of Ca-doped ZnO thin films by rf magnetron sputtering at low temperature. Mater. Lett. 2018, 214, 10–14. [Google Scholar] [CrossRef]
- Gul, M.; Amin, D.; Abbas, M.; Ilyas, S.; Shah, N. Synthesis and characterization of magnesium doped ZnO nanostructures: Methane (CH4) detection. J. Mater. Sci. Mater. Electron. 2019, 30, 5257–5265. [Google Scholar] [CrossRef]
- Sarwar, G.; Ashraf, M.W. Parametric estimation of Group II element doped zinc oxide nanostructures using fuzzy logic. J. Intell. Fuzzy Syst. 2020, 38, 5865–5875. [Google Scholar] [CrossRef]
- Das, N.; Wongsodihardjo, H.; Islam, S. Modeling of multi-junction photovoltaic cell using MATLAB/Simulink to improve the conversion efficiency. Renew. Energy 2015, 74, 917–924. [Google Scholar] [CrossRef]
- Wasim, M.F.; Tayyaba, S.; Ashraf, M.W.; Ahmad, Z. Modeling and Piezoelectric Analysis of Nano Energy Harvesters. Sensors 2020, 20, 3931. [Google Scholar] [CrossRef] [PubMed]
- Wasim, M.F.; Ashraf, M.W.; Tayyaba, S.; Nazir, A.S. Simulation and synthesis of ZnO nanorods on AAO nano porous template for use in a MEMS devices. Dig. J. Nanomater. Biostruct. 2019, 14, 559–567. [Google Scholar]


| Simulated Value | Calculated Value | Error | ||||
|---|---|---|---|---|---|---|
| Band Gap (eV) | PCE (%) | Band Gap (eV) | PCE (%) | Band Gap (eV) | PCE (%) | |
| Ca-doped ZnO NP | 3.15 | 1.21 | 3.13 | 1.22 | 0.7 | 0.9 |
| Unseeded Ca-doped ZnO NR | 3.15 | 1.34 | 3.15 | 1.35 | 0 | 0.8 |
| Seeded Ca-doped ZnO NR | 3.19 | 1.5 | 3.2 | 1.51 | 0.4 | 0.7 |
| Sample Name | ZnO Seeding Layer | Ca-Doped ZnO NP | Ca-Doped ZnO NR |
|---|---|---|---|
| Z1 | Χ | √ | Χ |
| Z2 | Χ | Χ | √ |
| Z3 | √ | Χ | √ |
| Detail | Atomic % | ||
|---|---|---|---|
| Elements | Zinc | Oxygen | Calcium |
| Ca-doped ZnO nanoparticles | 45.32 | 2.59 | 52.09 |
| Unseeded Ca-doped ZnO nanorods | 48.9 | 2.3 | 48.8 |
| Seeded Ca-doped ZnO nanorods | 46.55 | 1.99 | 51.46 |
| Sample | Voc (V) | Jsc (mAcm−2) | Fill Factor | Efficiency ƞ (%) |
|---|---|---|---|---|
| Ca-doped ZnO NP | 0.63 | 5.3 | 0.36 | 1.20 |
| Unseeded Ca-doped ZnO NR | 0.65 | 5.4 | 0.39 | 1.36 |
| Seeded Ca-doped ZnO NR | 0.67 | 5.5 | 0.42 | 1.55 |
© 2020 by the authors. Licensee MDPI, Basel, Switzerland. This article is an open access article distributed under the terms and conditions of the Creative Commons Attribution (CC BY) license (http://creativecommons.org/licenses/by/4.0/).
Share and Cite
Tayyaba, S.; Ashraf, M.W.; Tariq, M.I.; Akhlaq, M.; Balas, V.E.; Wang, N.; Balas, M.M. Simulation, Analysis, and Characterization of Calcium-Doped ZnO Nanostructures for Dye-Sensitized Solar Cells. Energies 2020, 13, 4863. https://0-doi-org.brum.beds.ac.uk/10.3390/en13184863
Tayyaba S, Ashraf MW, Tariq MI, Akhlaq M, Balas VE, Wang N, Balas MM. Simulation, Analysis, and Characterization of Calcium-Doped ZnO Nanostructures for Dye-Sensitized Solar Cells. Energies. 2020; 13(18):4863. https://0-doi-org.brum.beds.ac.uk/10.3390/en13184863
Chicago/Turabian StyleTayyaba, Shahzadi, Muhammad Waseem Ashraf, Muhammad Imran Tariq, Maham Akhlaq, Valentina Emilia Balas, Ning Wang, and Marius M. Balas. 2020. "Simulation, Analysis, and Characterization of Calcium-Doped ZnO Nanostructures for Dye-Sensitized Solar Cells" Energies 13, no. 18: 4863. https://0-doi-org.brum.beds.ac.uk/10.3390/en13184863