Analysis of the Advanced Turbine System Program on Innovation in Natural Gas Technology


School of Public Administration, University of Central Florida, Orlando, FL 32816, USA
Energies 2020, 13(19), 5057; https://0-doi-org.brum.beds.ac.uk/10.3390/en13195057
Submission received: 25 August 2020
/
Revised: 18 September 2020
/
Accepted: 22 September 2020
/
Published: 25 September 2020
(This article belongs to the Special Issue Advanced Techniques and Technologies in Natural Gas Research and Engineering)
Abstract
:This study evaluates the impact of a U.S. government-sponsored research program on advanced natural gas combined cycle (NGCC) innovations in the 1990s. From 1992–2000, the U.S. Department of Energy (U.S. DOE) partnered with turbine manufacturers General Electric (GE) and Siemens Westinghouse Power Corporation (SWPC) in a cost-sharing partnership called the Advanced Turbine System program to promote efficiency innovations for NGCC technology. Using data from the European Patent Office’s worldwide patent database (PATSTAT), this study evaluates advanced turbine technology innovations by the program participants and their competitors. Using a negative binomial model, this approach shows GE increased the relative quantity of their patents towards the end of the program and afterwards, indicating the program led to more advanced NGCC innovations for GE. SWPC, on the other hand, had higher patent citations for patents filed during the DOE program relative to competitors, indicating SWPC had higher-quality advanced NGCC innovations due to new partnerships from the U.S. DOE program. However, this analysis reveals there was not a lack of this activity taking place before the program started, and that the overall impact of the program appears small based on the patent analysis.
1. Introduction
In 2018, natural gas-fired generators provided just over 35% of all electricity generation in the United States, surpassing coal-fired generation on an annual basis for the first time in history in 2016 [1]. While the increased use of natural gas for generation is attributable to many factors, one important aspect is the technological improvements rendering natural gas-fired combined cycle generators (NGCC) relatively clean, efficient, and cheap. NGCC provide almost 90% of all natural gas-fired generation in the U.S. [2], have lower emissions compared to coal generation, and have the potential to complement intermittent renewable generators with fast ramp speeds. They are projected to remain a predominant source of electricity generation in the U.S. [3] and play a role in deep decarbonization of the electricity sector by replacing coal generation and assisting with integration of intermittent renewable sources of generation [4].
Since the inception of NGCC in the early 1940s, efficiencies of the system have vastly improved from 25% to 62% percent by 2016 [5,6]. According to a report by the U.S. Department of Energy (U.S. DOE) [7], an increase of a single percent point in thermal efficiency for a typical-sized NGCC plant (400–500 MW) can reduce operating costs as much as $20 million over the lifetime of the plant. The DOE study suggests that NGCC efficiencies increased substantially during DOE’s Advanced Turbine System (DOE-ATS) program from 1992–2000. The program was a cost-sharing, public-private partnership with two U.S.-based natural gas manufacturers, General Electric (GE) (Boston, MA, USA) and Siemens Westinghouse Power Corporation (SWPC) (Orlando, FL, USA), to improve the performance of gas turbines and NGCC beyond the current technological limits at that time. The National Research Council [8] argues that “DOE has been instrumental in accelerating the highly cost-shared development of gas turbines that have both high efficiencies and low NOx [nitrogen oxide] emissions.” Curtis describes the innovations during the program as a “breakthrough” and “transitional” for leading to the development of complex technologies significantly different from their predecessors [7]. The final DOE report describes the program as a successful public-private partnership because GE and SWPC commercialized turbines meeting the program objectives during or shortly after the program [7].
The focus on direct outputs by the program, in this case commercialized technology, does not address the common concern regarding public research and development (R&D) programs, which is that they substitute for private R&D that would otherwise take place [9]. Government programs such as this one are often derided as “corporate welfare,” with low social benefit but high private returns for the companies involved. Therefore, it is useful to study the innovative activity in this field before and after the program by the program participants and their competitors for a more informative determination of the program impact.
As a measure of innovation, this study compares patenting activity by the two companies involved with the program to other firms patenting in these fields during the same period in the U.S. Through econometric analysis using patent and citation counts, this research evaluates the claims that the program advanced innovation for the participants relative to their competitors. The results show GE and SWPC responded somewhat differently to the program in terms of quantity and impact of their patents. GE increased their patenting towards the end and after the program, with little to no statistically significant increase in their citation counts. For SWPC, there were a few years during the program when the patents they produced had higher citations, but the patent quantity only increased relative to domestic patenting activity.
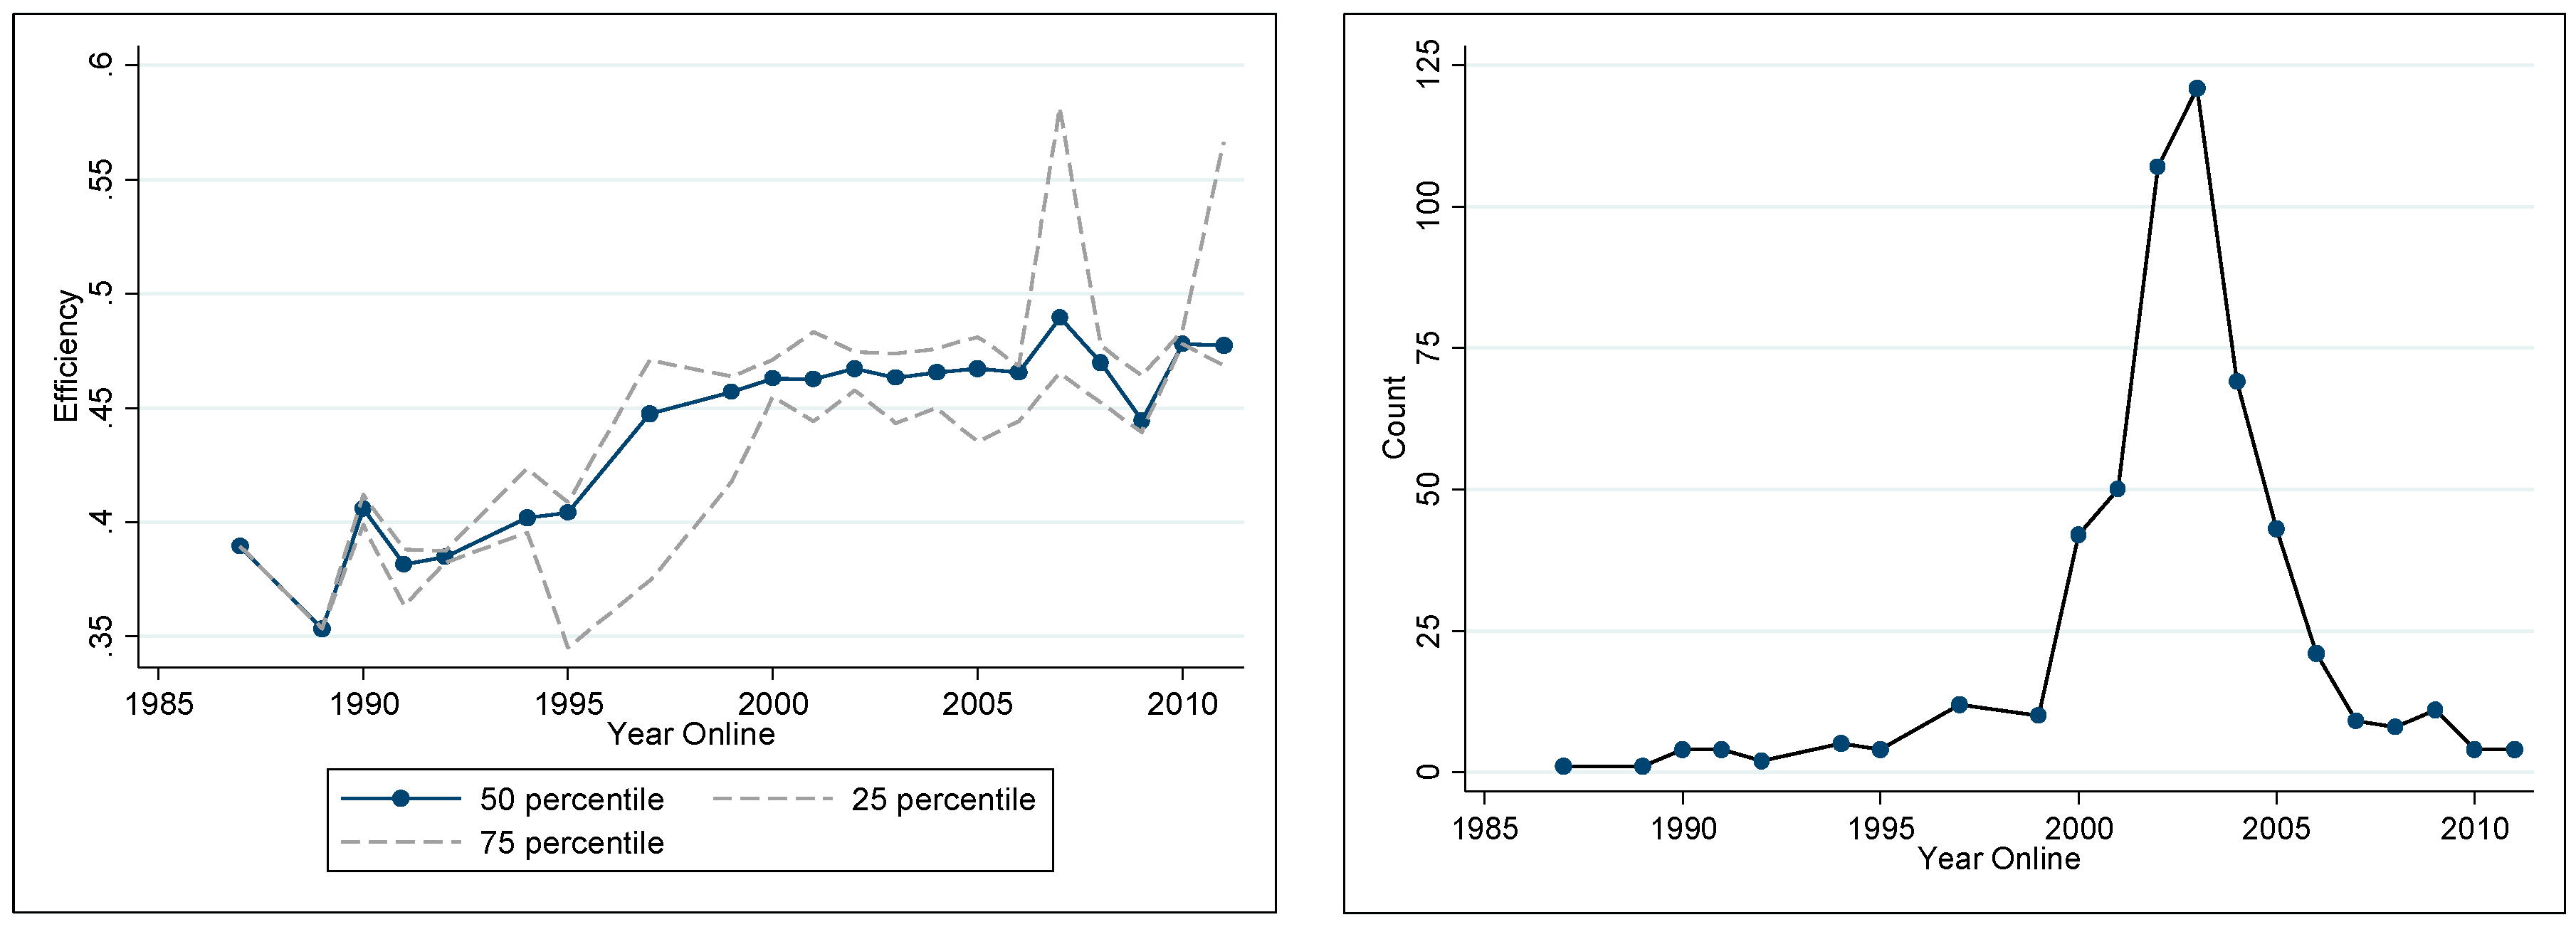
Additionally, this paper sheds light on the efficiency gains by NGCC generators by tracing the technological developments through patent research. The efficiency gains had important consequences when at the turn of the 21st century their popularity exploded in what has been called the natural gas capacity buildout, the largest three-year period of capacity growth in U.S. history (Figure 1) [10]. As a result, different generations of NGCC with improved technology for efficiency and emissions reductions have contributed to lower greenhouse gas and criteria pollutant emissions from the electricity sector as NGCC displaces coal generation [11].
The paper proceeds with an overview of the existing literature on the DOE-ATS program, as well as a brief history on NGCC development and use. Section 3 describes the nature of patent research as an indicator of innovative success, and the hypotheses developed to measure program success using the patent data. Section 4 describes the patent data and econometric method before presenting the results in Section 5. Section 6 discusses these findings with directions for future research.
2. The U.S. Department of Energy Advanced Turbine System (DOE-ATS) Program
In the past, government has played an important role in promotion of new technologies through the innovation, adoption and commercialization stages to address common market failures. One approach is to stimulate or provide research and development funding through various means to overcome barriers to investment such as environmental externalities, market uncertainty, or free-riding on public benefit of knowledge creation [12]. The 1992 Energy Policy Act (EPACT) authorized the DOE-ATS program as a collaborative, cost-sharing program with industry to stimulate U.S. turbine manufacturing, and to overcome market failures for the development of more efficient natural gas-fired generators.
The first market failure DOE-ATS was trying to overcome related to new deregulation and restructuring efforts at the state and national level. In addition to creating the DOE-ATS program, EPACT and several Federal Energy Regulatory Commission (FERC) orders opened transmission lines to competing generators in an attempt to break up vertically integrated utilities. This new set of rules meant utilities were subject to new incentives and optimization decisions. Additionally, multiple states were choosing to go even further to encourage competition by adopting wholesale electricity deregulation. This involved a multi-year process of writing rules for restructuring and setting up electricity markets, which created uncertainty in the timing and effectiveness of the markets being designed [13]. As a result, new capacity growth was suppressed for several years as deregulation was implemented [14], causing electric equipment manufacturers to hesitate on investing in innovations for new technologies [15].
Moreover, natural gas prices were low following deregulation of the natural gas industry in the 1980s. While low prices made natural gas-fired generators more economically attractive, it also reduced incentives for R&D focused on efficiency improvements. Government [16] and industry believed natural gas prices would remain low for years, and anticipated an emphasis on efficiency by utilities and non-utilities as competition reshaped industry dynamics. As noted earlier, this projection came true as new natural gas capacity soared from 2000–2004, with 70% of this new capacity in the form of NGCC generators (Figure 1).
The U.S. government was also concerned about the health of the U.S. turbine manufacturing industry. While U.S. turbine manufacturer GE held the largest global market share at 28%, foreign competitors such as Asea Brown Boveri (ABB) (Zurich, Switzerland), Siemens (Munich, Germany), and Mitsubishi (Tokyo, Japan) held most of the rest of the market [17]. Foreign competitors had bought out two smaller U.S. turbine manufacturers: Combustion Engineering by ABB, and Allison Engine Company by Rolls-Royce (Manchester, UK). Additionally, U.S. anti-trust authorities blocked Westinghouse from selling their heavy electric business to ABB in 1988. These developments created concern about U.S. gas turbine manufacturers staying competitive in the U.S. and international markets [7].
For the reasons discussed above, EPACT authorized the creation of the DOE-ATS program as a cost-sharing partnership with industry to improve performance of gas turbines beyond existing technological limits. The program specifically aimed to achieve: (1) an efficiency of 60% on a lower heating value basis in combined-cycle models, (2) NOx emissions of less than 10 ppm without end-of-pipe controls, (3) a 10% lower cost of electricity, and (4) state-of-the-art reliability, availability, and maintainability levels. These would be significant improvements over 50–53% efficiency and 40–50 ppm NOx emissions for NGCCs then operating [18]. These technological developments would be socially beneficial by decreasing emissions and resource use, which aligned with EPACT’s overall aim for energy security and environmental benefits.
Congress supported the program with appropriations totaling $315 million, while industry provided approximately $155 million in the composite [8]. The goal of this program was to develop utility- and industrial-scale gas turbines that were reliable and available to the market by the year 2000. The ATS project included collaboration among universities, industry, and government laboratories. All aspects of the project were competitively bid; however, GE and Westinghouse prevailed as the two companies to develop improved gas turbine systems from DOE-ATS through the final phase of the program and were the only two companies with patents resulting directly from the program [7]. In 1998 Westinghouse divested its Power Generation business to Siemens, and the company became the Siemens Westinghouse Power Corporation (SWPC) until renaming the company Siemens in 2002. In the acquisition, Siemens inherited Westinghouse’s NGCC designs and the advanced technology that was developed during DOE-ATS. However, new contract clauses with the U.S. government required SWPC to use these intellectual property rights to manufacture U.S. goods [7].
Each of these companies took different approaches during the innovative process with DOE-ATS. GE primarily relied on its own internal capabilities and knowledge from organizations within GE’s company, including GE Aircraft Engines, and mostly benefitted from the additional research funds provided by DOE-ATS. Additionally, GE had already begun work on advanced NGCC for international markets, which they believed would have more immediate demand [7]. By contrast, Westinghouse exited the aircraft engine industry in the 1960s, and relied on alliances and licensing agreements to acquire core capabilities for gas turbine technology. As a result, SWPC depended more heavily on universities, national laboratories and other government testing facilities for their innovative process with DOE-ATS [7].
According to DOE [7], the DOE-ATS program resulted in 55 new patents for the technology between 1995 and 2001, not including patents of spin-off technologies that may also contribute to increases in overall feasibility of new natural gas combustion units. GE’s first fully-integrated advanced NGCC unit was announced in 1995, with the 7H frame at 60 hz for the U.S. market, which was first installed in 2003 [19]. SWPC tested a fully integrated system using the DOE-ATS developed models in a demonstration in 2004 [20]. The fully integrated advanced NGCC line appeared in Siemens’ H-series generators, which was first announced in 2007 and operational in 2013 [21]. While fully integrated systems were later to arrive in the market, the subsystem innovations were introduced in earlier, “conventional” NGCC systems by these companies. SWPC incorporated advanced technologies in their existing products during and shortly after the DOE-ATS program. DOE reports that over 165 gas turbines in North America in the early 2000s employed the improved components from the DOE-ATS program in SWPC generators [22]. From 1999–2002, during the early portion of rapid natural gas capacity growth (but several years before hydraulic fracturing and increased extraction of natural gas from domestic shale resources), GE’s global market share increased to 54%, and Siemens/Siemens Westinghouse Power Corporation from 18% to 22% [17].
Figure 2 contains the normalized granted patent counts for all NGCC technology, as identified through the Cooperative Patent Classification code for combined cycle power plants, or combined cycle gas turbines [23]. There was an increase in NGCC-granted patents authorized in the U.S. and other countries during the program from 1992–2000. However, there was also a later increase in NGCC patents beginning around 2006 that continues increasing for the U.S., but declines in other countries. The increase in patents in the U.S. from 2009 onward may be related to the 2009 American Recovery and Reinvestment Act which provided $4.5 billion U.S. dollars to the U.S. Department of Energy to improve the nation’s energy infrastructure [24]. Additionally, the U.S. DOE Office of Fossil Energy continues to sponsor the University Turbine Systems Research (UTSR) Program and individual funding opportunities to develop advanced gas turbines that have high efficiency, low emissions, and are cost-effective.
In 2018, fully integrated advanced natural gas-fired combined cycle units (ANGCC) made up approximately 62% of all new natural gas capacity additions in the U.S. [25]. Recent capital cost estimates from EIA price advanced and conventional NGCC units as significantly less expensive than coal-fired plants, with ANGCC slightly ahead of NGCC plants in levelized costs. ANGCC have the lowest levelized cost of all generation technologies, besides geothermal, absent tax credits [26].
Based on the DOE report [7] and the commercialization of the advanced turbine system technologies by GE and SWPC, the 1992 DOE-ATS program was successful. However, this report does not consider what innovative activity was taking place before the program or by other turbine manufacturers, which is what I do in this study.
3. Patent Research
In order to evaluate the claims by DOE that the program was successful outside of direct outputs measured in commercialized technology, I conduct a study using U.S. patent data. Patents have long been used as an indicator of innovation in empirical studies in place of, or as a complement to, aggregated R&D values. A patent places a temporary monopoly on an invention for the inventor as a means of encouraging innovation and technological progress [27]. It has been established that patent applications are an appropriate measure for R&D since they are usually filed early in the research process, thereby making patent data sorted by application date a useful indicator of R&D activity to measure innovative activity [28].
Despite their usefulness, patents are an imperfect measure of innovative activity. Not all inventions may be patentable, and the propensity to patent and can vary across industries [28]. In this case, I evaluate patents for the advanced turbine class primarily by gas turbine manufacturers; therefore, the differences in propensity to patent are less of a concern. One study [17] on NGCC industry shakeouts determined patents are a relevant indicator to measure of R&D for NGCC technologies since they fall in the broader category of electrical equipment with some of the highest propensities to patent.
3.1. Patent Counts
This study uses patent counts of unique inventions as an indicator of the quantity of innovative activity taking place for ATS technologies. Previous studies on environmental technologies find 1–3 year lags between the initiation of a program or policy and associated patenting response [15,29]. Since the DOE-ATS report states there was a concern there would be a lack of this type of research in the 1990s, justifying government intervention, I expect to see low patent counts prior to or in the early years of the program. During the program or shortly after, I expect to see higher numbers of patents from the participants relative to non-participants in this field. This would indicate that innovative activity was higher for the participants, possibly as a result of DOE-ATS.
3.2. Patent Citations
Another common concern with patent data is that each patent may not hold the same value, therefore additional consideration must be taken to determine the relative contribution of each patent [13]. Frequently, researchers turn to the information contained in the patent citations to evaluate knowledge flows and approximate the impact of the patent. Citations to the patent (forward citations) contain information on how useful the innovation was for producing additional knowledge and can be considered as an imperfect measure of quality [16].
Like the issues discussed with patent counts, each citation may not provide equal information about knowledge flows. Citations can be identified by the applicant, patent examiner, or lawyer of the innovator or applicant, and sometimes for strategic reasons. Further complicating matters, legal requirements and practices for identifying prior work can vary across different patent offices, and the United States Patenting and Trademark Office (USPTO) is the only patent office where the inventor has a legal duty to declare and cite previous knowledge on which the innovation was built [4]. However, studies on citations to and from USPTO patents have determined a significant portion of the citations represent an important knowledge flow [30], and USPTO citations have been used to measure knowledge diffusion [4] and patent importance [12]. For these reasons, I use USPTO patents for the analysis to determine the relative impact of the patents produced during the DOE-ATS program.
A survey of the patent citation literature [31] reports numerous studies confirming a relationship between citation counts and technological importance and economic value (defined in various but specific ways). Other authors [32] find that university patents are associated with more basic research compared to corporate patents and, therefore, hold a higher importance to future research measured through higher forward citation counts. To be regarded as basic means the innovation answered fundamental scientific questions, rather than focusing on specific technical issues associated with more applied research. Industry is more likely to work on applied innovations that solve problems with their specific technologies in efforts to commercialize them, while basic research will have a major impact on the field and be more fundamental to later work, and thus will have more citations [32]. DOE [7] describes the innovative work in DOE-ATS as “breakthrough” and “transformational,” but “generic” in a sense that the innovations add to technological understanding applicable to all turbine manufacturers. While the patents evaluated in this study are from private industry, I hypothesize that the patents filed by the DOE-ATS program participants during or shortly after the program will have higher technological importance and, therefore, higher citation counts relative to earlier patents by the participants and patenting by non-participants.
4. Materials and Methods
4.1. Data
This study uses the Worldwide Patent Statistical Database (PATSTAT), which is maintained and distributed by the European Patent Office. PATSTAT is a comprehensive source of bibliographic patent data for more than 100 patent offices, including the USPTO, and is a commonly used database for patent research [33,34]. Since DOE-ATS targeted U.S. innovations, only patent applications that were eventually awarded as patents through the USPTO are used for the analysis. (The same analysis used in this study was conducted on patents that were not filed in the U.S. in a “global” dataset, However, since the purpose of the DOE-ATS program was to increase patenting activity in the U.S., this paper only presents the results from the analysis on the U.S. dataset. The global analysis did not add to the analysis and had lower statistical significance, as expected).
In order to gather a more comprehensive picture of advanced NGCC innovation, this study includes patents representing unique inventions in advanced turbine technology beyond the 55 patents provided by DOE [18]. This way, advanced turbine patenting activity taking place outside the program, as well as before and after the program, are included in the analysis to evaluate the impact of the program on advanced turbine innovation. Additionally, DOE [7] states there were spin-off innovations that related to the research undertaken in DOE-ATS but which were not a “direct” result of DOE-ATS and therefore not discussed in his research. The search strategy used in this study is similar to the one used by Lanzi et al. [33] to identify the relevant International Patent Classification (IPC) codes, developed by the World Intellectual Property Organization and used to classify inventions. This approach identifies common IPC codes in the DOE-ATS patents in each of the advanced turbine technology subfields, which are verified as NGCC technologies related to the advanced turbine subfield using the IPC definitions listed in Appendix A. Next, these codes are used to identify other advanced turbine patents to build the full dataset. The search using the chosen IPC codes identifies 43 of the 55 DOE-ATS patents, included in Appendix A (the thermal barrier coating technology subfield was excluded because the applications are broader and there are fewer common IPC codes among these patents).
Inventors often seek patent protection in multiple countries, in which case a priority patent (first application filing) is duplicated and submitted for protection under another patenting authority. The application date of the priority filing is the priority date and assigned to the duplicate patents, which all fall in the same patent family. In order to count unique inventions in the U.S. only, the search strategy identifies patents filed in the U.S. by their families and keeps the earliest patent (i.e., priority patent) based on the application date. The priority year of the patent is assigned as the patent date since that marks when patenting protection begins if the patent is granted, and corresponds with the timing of the inventive activity [27]. This search strategy identifies over 25,000 granted, ATS patents with a priority date between 1980–2008, which reduces to approximately 8000 unique inventions (i.e., families) with a patent filed in the U.S. (this study evaluates granted patent applications rather than all applications because the USPTO only began publishing information in 2001 on applications that were not granted [34]). The descriptive statistics on the families are provided in Table 1.
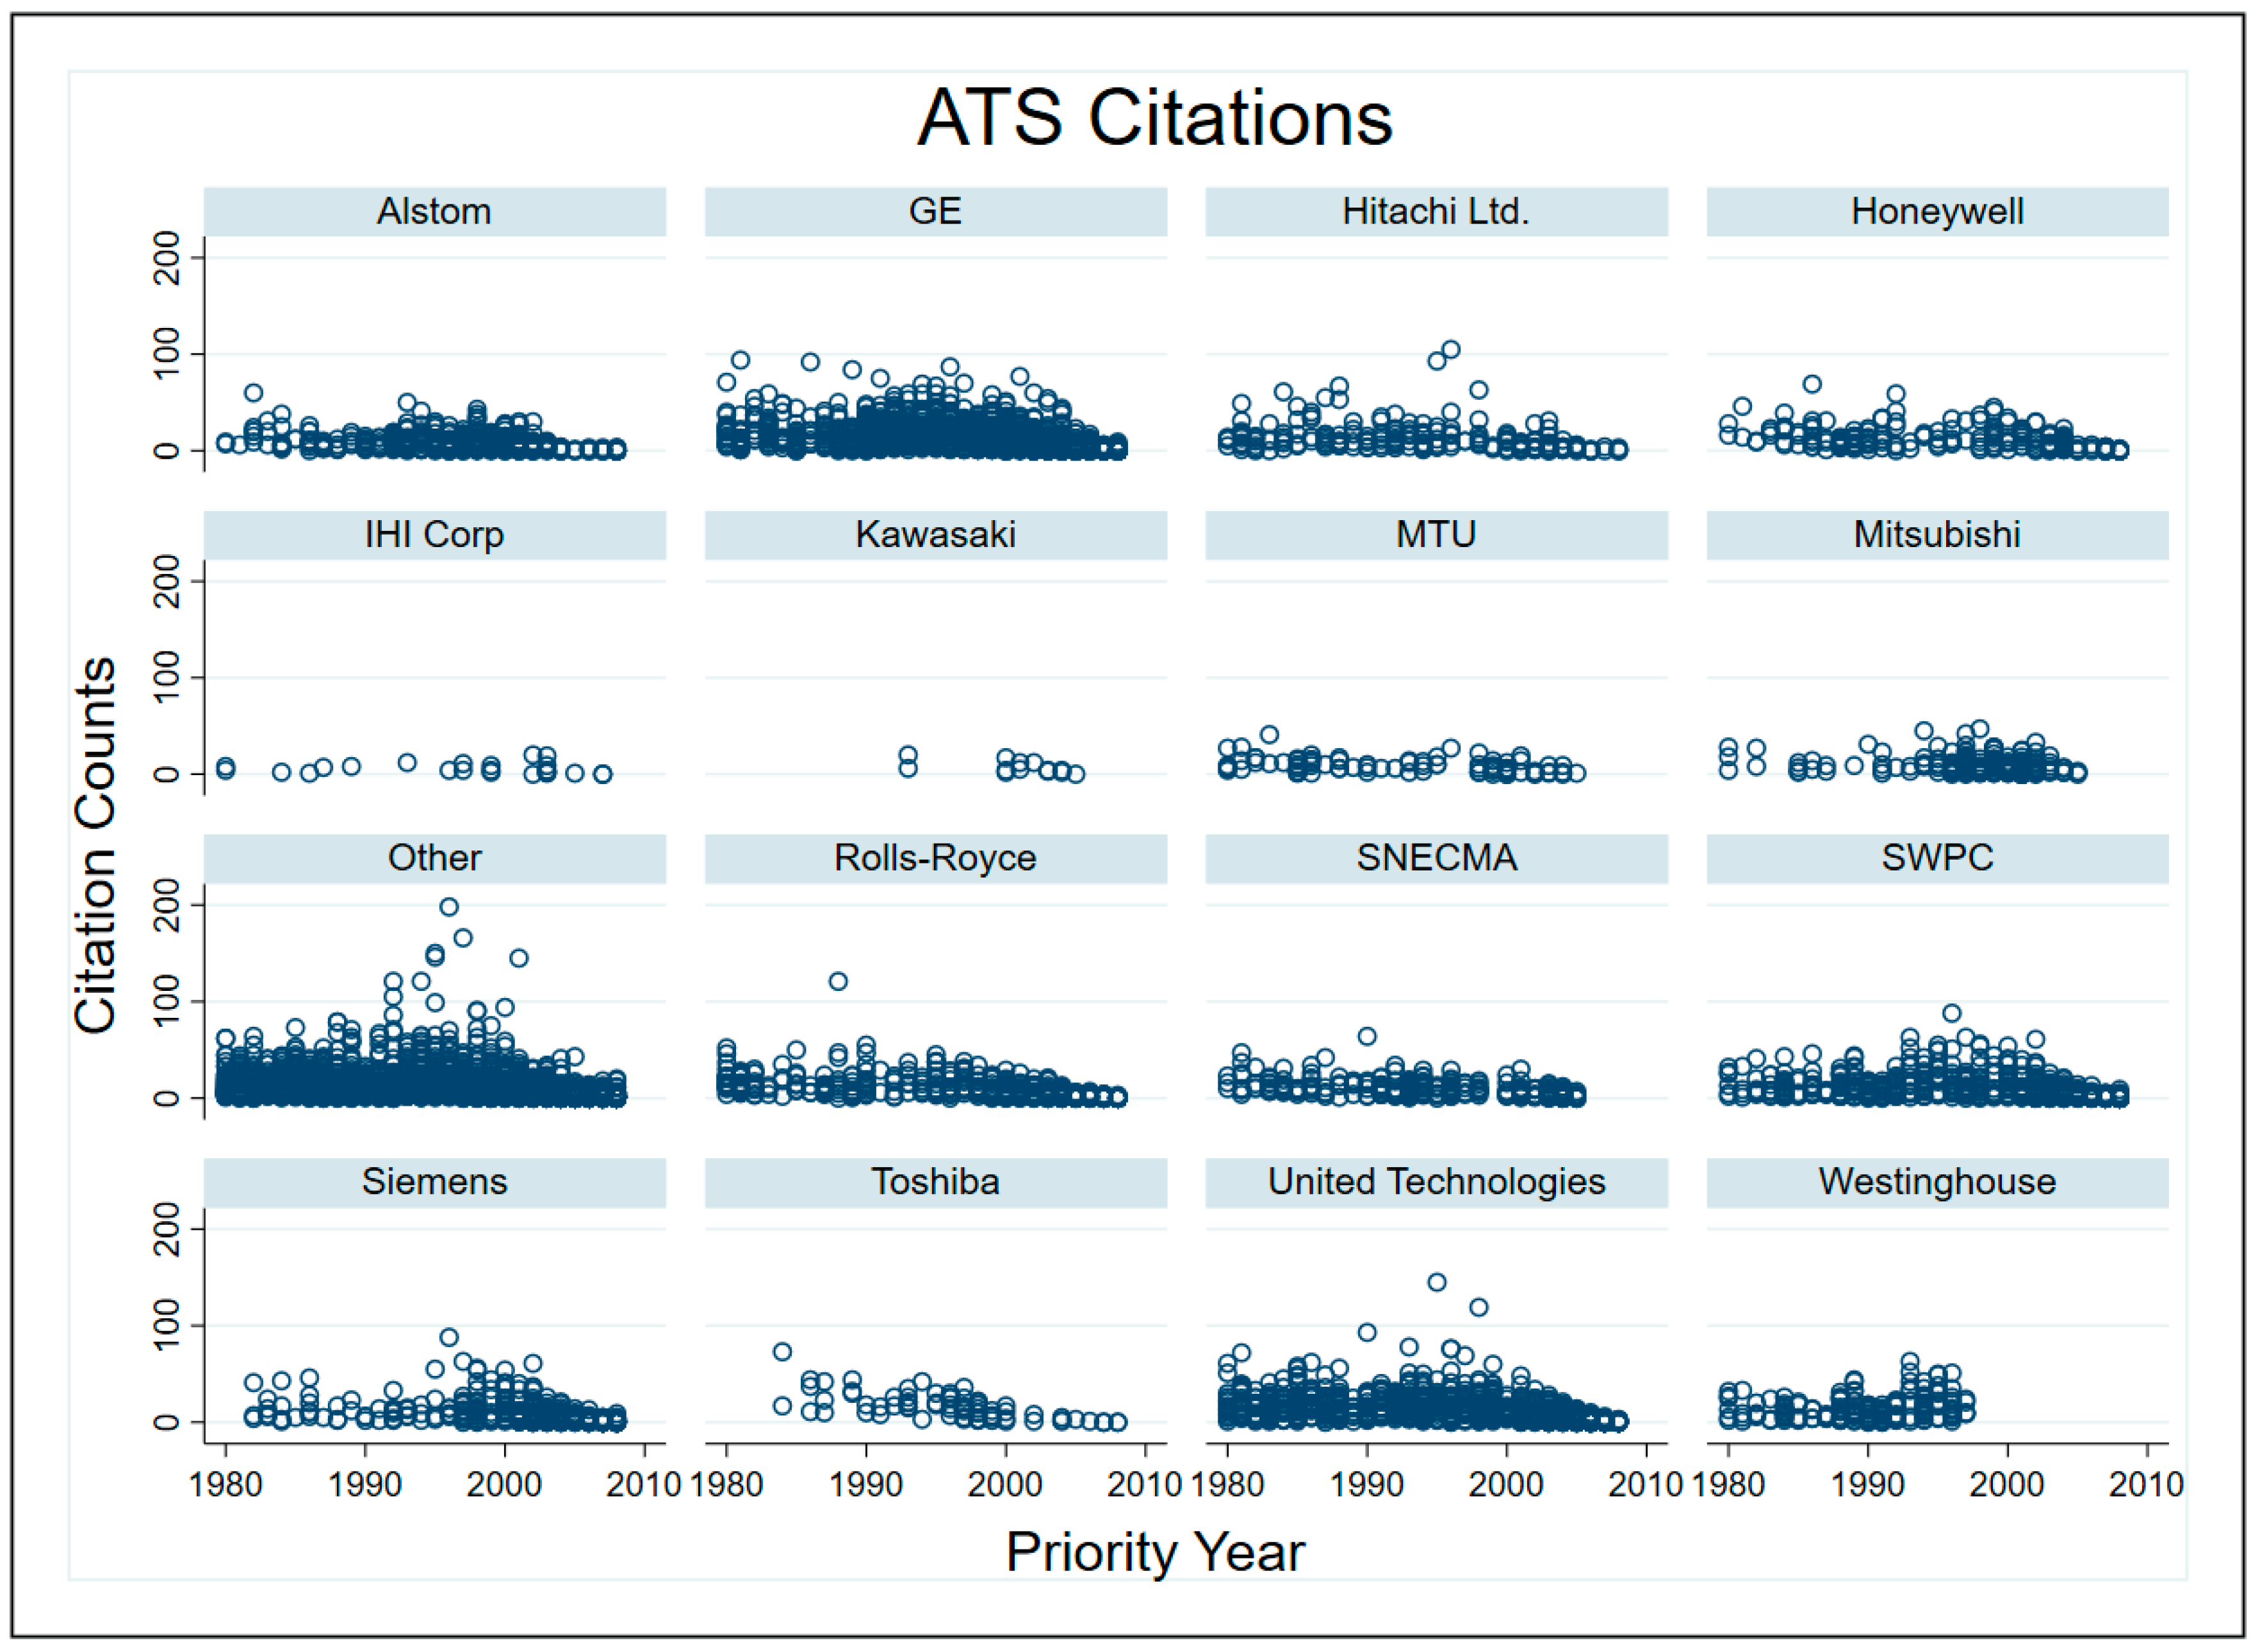
The applicant’s “person data” provided in PATSTAT is used to identify the companies that filed for patent protection for their advanced turbine innovations (this is akin to the USPTO’s “assignee” data). Several companies are merged together based on company mergers and subsidiaries, which results in 14 companies that appear most frequently in the dataset of advanced turbine patents. In some cases, the innovations targeted at jet engines (gas turbines were originally designed in the 1930s for aircraft, and then adapted in the 1950s for power generation [5]. There continue to be some spillovers between R&D work for jet engines to electric generators, as several companies that specialize in aerospace manufacturing also service or manufacture gas turbines for electricity generation [17]) had applications for NGCC turbines as well; therefore, there are some companies that focus on jet engines included in the dataset. Patents by companies that appeared infrequently are placed in the group “Other.” Figure 3 is a plot of advanced turbine patent counts by company, including a separate graph for Westinghouse. SWPC represents Siemens patents before the acquisition of Westinghouse in 1998, then any Siemens or Siemens Westinghouse Power Corporation (SWPC) patents after the merger. This graph also includes “global” advanced turbine patent data, which includes families that did not have a USPTO patent filed. For most companies, there are only a few innovations a year, if any that did not include a USPTO application. This supports this study’s approach to use the USPTO patents only.
For the reasons discussed in Section 3, forward citations for USPTO patents to other USPTO patents are summed for the citation analysis. Self-citations, whereby a company cites its own patent, are removed in order to focus on the external spillover benefit of a patent to determine its value [35]. Otherwise, it is possible a patent may have higher citation counts due to the stock of patents that followed by that company. The citation statistics, based on individual patents, are reported in Table 1, and Figure 4 shows patent citation counts by the priority year. GE had higher patent counts than average, while SWPC had lower than average counts in the time series. In terms of citations, GE and SWPC had close to the average number of citations per ATS patent, but GE also had a very high percentage of self-citations (25%), while SWPC and Westinghouse had much lower self-citation records (8% and 6%, respectively). These self-citation frequencies are similar to those reported by DOE [7] for the 55 patents that directly resulted from DOE-ATS.
4.2. Model
This study used a fixed-effects model, where the coefficients of interest are the interaction of a participant dummy (Equation (1)) or company dummy for program participants (Equation (2)) with individual year dummies ( from 1988–2008 to evaluate the difference in the number of ATS patent applications each company filed compared to non-participants in each year before, during, and after the DOE-ATS program. Fixed-effects was used in to control for characteristics of the companies that did not change across time that were not included in this study, such as the relative size of the company, location, and mission. The first model evaluated changes common to all the participants, while the second model determined if the program affected the participants differently. The participants in this case were GE, Westinghouse (from before the acquisition), and SWPC (Siemens alone before the acquisition, SWPC after the acquisition) (in the participant models (Equations (1) and (3)), SWPC represented all patents from Siemens, Westinghouse, and SWPC as one company.). This way, the model was implicitly imposing no effect from 1980–1987. Since the program was eight years long, this approach revealed how patenting responds to the program during each year. There is a possible lag in the timing between initiation of a program and patenting that can vary among policies [15]. While the 55 DOE-ATS patents were issued from 1995–2001, the DOE report on the program does not state the time period it may have taken for spin-off technologies associated with DOE-ATS work to be patented. Moreover, previous studies have found that policy impacts on patenting counts for environmental technologies have diminishing returns [28], which will be easier to evaluate with this approach. The trade-off of evaluating each year to determine a temporal signature is that degrees of freedom are reduced and, potentially, the significance of the coefficients.
Since the data consisted of count data as the dependent variables with overdispersion (due to the mean being less than the variance), a negative binomial model was used. A negative binomial model uses a Poisson process, which is flexible in the error structure compared to ordinary least squares estimation which assumes a conditional normal error structure. The Poisson process allows transformation of the predicted outcome, letting non-linear relationships be linearized between the dependent variable and predictors. A negative binomial was more appropriate than a Poisson model in this case because it also accounts for overdispersion by way of an additional error parameter [36,37]. However, the fixed-effect in a conditional negative binomial regression applies to the distribution of the dispersion parameter rather than controlling for time-invariant parameters [37]. Therefore, the unconditional maximum likelihood negative binomial model was used with dummy variables for the individual fixed-effects and clustered robust standard errors by company, which Allison [37] recommends as an appropriate alternative to the fixed-effects conditional negative binomial model.
For patent citations, the model was the same structure as the patent count model, but the unit of analysis in this case was each patent (i). The dependent variable was the number of citations (excluding self-citations) the patent received. The year fixed-effects controlled for the amount of time each patent had to be cited, as well as the number of patents afterwards (i.e., opportunities for a citation). Additionally, year fixed-effects control for universal parameters for each year that may have affected a firm’s investment behavior, such as anticipation of low natural gas prices or decreases in coal R&D which may also have increased NGCC innovation. This model also had company fixed-effects and clustered robust standard errors at the company level.
5. Results
The model coefficients and confidence intervals displayed in the figures in this section have been transformed to incidence-rate ratios (IRR), which is the exponentiated version of the negative binomial coefficient (). The IRR is interpreted as the predicted multiplicative effect on the incidence rate, which for patent counts is how many unique inventions were patented in a year by the company. For example, in Figure 5A, the coefficient for the year 1990 interaction for participants is 2.75. This means that DOE-ATS participants patented in the ATS technology field 2.75 times more than non-participants in that year. Using IRR, a coefficient of 1 (rather than 0), indicates no effect. For citations, the IRR represents the multiplicative effect on how many citations the average patent for the participants (or each company) received. I first discuss the results of the count and citation analyses in detail separately, then summarize with a discussion of what the collective results signify in Section 6.
5.1. Count Results
After removing a mostly-linear trend in turbine patenting (Figure 5C), Figure 5A shows program participants of DOE-ATS had a statistically significant higher number of ATS patents in the years leading up to and at the very start of the program, from 1988–1992. The joint treatment effect is statistically significant again in 1994 during the program, then after the program, from 2002–2008. Figure 5B provides more detail on patenting activity by the individual companies involved with DOE-ATS compared to their competitors. For this figure, I separated Westinghouse out before the Siemens acquisition (1998) to focus on the impact of DOE-ATS on the only two participants at that time—GE and Westinghouse. (I conducted sensitivity testing without separating Westinghouse from SWPC for verification. As expected, SWPC’s post-program increase in patenting is a quarter to a third the size of the IRR’s reported in Figure 5B, while still being statistically significant). Figure 5B shows both GE and Westinghouse had approximately three times as many patents as competitors in the ATS category just before the start of the program. Patenting by both companies tapers off in the early years of the program and is mostly statistically insignificant, except for 1994 with a small but statistically significant increase. Prior to 1998, the SWPC coefficient represents patenting activity by Siemens, which is not statistically significant until after the acquisition of Westinghouse. This is expected, as Siemens (a German, multinational company) did not seek U.S. patent protection as frequently as they did after the acquisition of Westinghouse [7].
Towards the later years of the program (1998–2000), Figure 5B shows SWPC (Siemens + Westinghouse) and GE both begin to increase their patenting activity. However, the statistically significant coefficients for SWPC are more of a reflection of the low patenting activity by Siemens in the 1980s, pre-Westinghouse acquisition, which are the base years for the treatment coefficients. In Figure 5A, coefficients are not statistically significant for the joint, participant effect during this time (1998–2000). The statistically significant increase in patenting for SWPC in Figure 5B is a reflection of the increased patenting from adding Westinghouse, since SWPC was required to seek patent protection in the U.S. during DOE-ATS as a condition of their acquisition [7]. Therefore, SWPC patenting in the company figure is relative to their patenting in the 1980s as just Siemens, and not a proper comparison to draw conclusions from for SWPC after the acquisition of Westinghouse. For example, the magnitude of the spike in SWPC patenting activity in 2006 indicating they had 12 times more patents than non-participants is largely reflective of low patenting activity in the U.S. by Siemens during the base years of 1980–1988. Based on Figure 5A, the joint effect of the participants on the U.S. patenting was statistically significant, confirming SWPC patenting was higher after the program in the U.S. relative to Siemens + Westinghouse patenting in the 1980s, just not 12 times higher.
For GE, the increased patenting rate towards the end of the program and after peaks at 4.1 times as high as other companies in 2000. Both companies continue to have high patenting activity following the program, but for GE to a lesser degree, and SWPC for the reasons mentioned above. GE’s peak in 2000 gradually decreases and levels out (with exceptions in 2006 and 2008), which may be evidence of diminishing returns from the DOE-ATS program.
Figure 5C provides more information on the overall trends in ATS patenting in the U.S. from 1988–2008. While there is a linear increase in patenting during the years of the program in the ATS field, there is a significant increase in 2003–2004, which drops from 2005–2008. It is possible DOE-ATS led to more advances in ATS innovation for the field, with field-wide patenting increases several years after the program concluded.
Based on the patent count data, there was not a lack of this type of research being done by the program participants before the program started since both GE and Westinghouse had higher ATS patent counts than their competitors. During the program, there was a lull in patenting activity by the participants, which gradually increased towards the end and after the program for both companies. It is possible the researchers at GE and SWPC transitioned to new projects due to DOE-ATS, causing a temporary lull in their patenting activity. This is analyzed further using citation data in the next section.
5.2. Citation Results
The citation results show more variation in the performance of the two program participants compared to the patent count results. Similar to Section 5.1, I evaluate joint impact by the program participants (Figure 6A), and impact on the program participants separately (Figure 6B). In Figure 6A with the joint treatment effects, 1994, 2004 and 2005 are the only years with statistically significant higher citations than non-participants, on the order of 1.3–1.4 times the average non-participant citations received. The individual company treatment coefficients (Figure 6B) show only Westinghouse had a couple of years with statistically significant higher citations than competitors before the program started. Additionally, Westinghouse was the only participant with higher citations throughout the program from 1993–1997. The citation rate in 1993 was 2.5 times the citing rate of non-participants in that year. The DOE report [3] states that Westinghouse participated in more alliances and government collaborations during DOE-ATS, which may explain why their patents were cited more. The only year GE had a statistically significant higher citation rate was in 1994, followed by lower citations from 1998–2002.
The post-program increase in 2004 and 2005 was shared between GE and SWPC. There is less of a concern comparing post-acquisition SWPC patents to pre-acquisition Siemens patents since the impact on citations may not be as acute as the impact on patent counts when a company size grows. SWPC had a couple other years post-program with higher citations, and higher citations in 1998 and 2000 after merging with Westinghouse. Based on the patent citation analysis, there is not a clear impact of the program on quality of patents produced by the program participants during and after the program, despite some interesting results discussed further in Section 6. The year fixed-effect (Figure 6C) clearly shows growing truncation from 1999–2008 due to less opportunity for newer patents to receive citations, which is controlled for using this year dummy.
6. Discussion and Conclusions
Overall, the DOE-ATS program had a similar impact on the participants in terms of patent counts, but not citations. There were a few years when the joint coefficient for patent counts are statistically significant, but that is primarily before the program began, then several years following the conclusion of the program. The higher patenting activity before the program started does not fit the description of the program in the DOE-ATS report that “this type of research was not taking place at this time” [7], however it is unclear if “at this time” meant before the program or during the early years of the program. The lull in patenting activity during the program is likely attributed to the shift in focus on conducting more basic research funded through DOE-ATS, which may take years before resulting in patentable technologies that have gone through extensive laboratory testing. The increased patent counts at the end of the program indicate that the program was successful in terms of patent quantity, but there are discrepancies in the citation data as an indicator of quality.
The only years in the joint citation analysis with statistically significant coefficients were 1994, at the beginning of the programs, then 2004 and 2005, several years after the conclusion of the DOE-ATS program. However, the citation analysis of each company (Figure 6B) shows Westinghouse had higher citations during the program, but GE had lower citations during this time. Johnstone et al. [29] show firms will focus more on research that is closer to being commercially ready than on basic research (which can be riskier), however basic research tends to have higher citation counts. The low citation count for GE suggests that they were focusing on commercialized technologies during the program and shortly after, which they completed according to the DOE-ATS report [7]. Both Westinghouse and GE released new NGCC models in 1994 and 1995, respectively, which may explain the pre-program increase in patenting. But, under the same argument, they did not release their next NGCC models until 2007 (SWPC) and 2014 (GE), despite increases in ATS patenting from 1998–2000. This activity may be associated with incremental improvements to their mid-1990s models during this time, as they were each experiencing some problems with and modifying the DOE-ATS technologies [7,17].
Yet, the DOE-ATS research was described as transformational, with generic applications to all turbine manufacturers [3], which implies higher citations. Westinghouse had lower patent counts but higher citation rates during the program, which could indicate they were moving from more applied research pertaining to its specific technologies, to more basic research associated with DOE-ATS. It may also reflect that Westinghouse and SWPC (after the acquisition) was more collaborative, corroborating observations in DOE’s post-program report [7].
More coefficients are significant in the analysis of each company separately for the counts and the citations, signifying the companies responded to the program in different ways. The internal characteristics and capacities of the two companies may have influenced the impact of the program’s patenting activity. After the program concluded beginning in 2002, GE and SWPC had a statistically significant higher patenting activity than non-program participants. This peaks for GE in 2000, while SWPC continued to grow which is probably more a reflection of Siemens acquisition of Westinghouse and the new, legal requirement for SWPC to manufacturer U.S. goods with Westinghouse’s intellectual property developed during DOE-ATS. Citations were no higher for GE after the program, with the exception of a small increase in 2004, while SWPC had several years with higher citations between 2000 and 2005.
Additionally, from 2003 to 2004 the year fixed-effects in the count analysis have a positive deviation from the linear trend; this may suggest that GE and SWPC were first to market, 4–6 years ahead of competitors as their patenting activity started increasing around 1998–1999. Accordingly, GE increased its global market share from 28% in 1987–1991, to 54% from 1999–2000. For Siemens, its market share increased from 19% in the early 1990s, to 22% after acquiring Westinghouse [17].
In conclusion, this research adds to the existing literature on the impact of a government-sponsored cost-sharing program on advanced turbine innovations for NGCC generators in the U.S. It also evaluates changes in the field of advanced turbine patenting in the U.S. from 1988–2008, a time of tremendous change in the NGCC and ANGCC industry. The results of a patent analysis show few joint impacts on DOE-ATS participants in the years before, during, and after the program which ran from 1992–2000. The individual company analyses reveal a greater number of statistically significant effects for companies involved with the program; however, there are few clear patterns indicative of the impact of DOE-ATS. There are several suggestive results which require more investigation, possibly of a qualitative nature, to confirm. Future work with more specific data on installed NGCC models and license agreements would be useful for further evaluation on what patent applications led to installed technology. Also, more qualitative research and possibly interviews with members of DOE-ATS and industry participants could add more context to clarify some of the findings from the patent analysis.
The Energy Information Administration anticipates natural gas-fired generators will continue to provide most of the electricity in the U.S. until at least 2050 [38]. With this expectation, the government may continue to be interested in ATS innovation and R&D programs. The fast start-up and shut-down times for NGCC makes it a good complement to intermittent renewable sources of generation, such as wind and solar, which are also expected to grow over the next several decades. There is also a concern that Japanese manufacturers are further ahead of the U.S. in developing even faster ramp-speed technologies. For these reasons, there are renewed calls for further government investment in advanced turbine innovations in the U.S. Lessons learned from the DOE-ATS program can be useful in developing future programs for NGCC and ANGCC technological change.
Funding
This research received no external funding.
Acknowledgments
I would like to thank David Popp, Peter Wilcoxen, Sarah Hamersma, and W. Henry Lambright for feedback on earlier versions of this paper.
Conflicts of Interest
The authors declare no conflict of interest.
Appendix A. International Patent Classification (IPC) Codes Used

Table A1.
International Patent Classification (IPC) codes used in this study to identify advanced NGCC technology, and a short description of each.
Table A1.
International Patent Classification (IPC) codes used in this study to identify advanced NGCC technology, and a short description of each.
| IPC Codes | Definition |
|---|---|
| Cycles: | |
| F01K 21/04 | Using mixtures of steam and gas; Plants generating or heating steam by bringing water or steam into direct contact with hot gas (direct-contact steam generators in general |
| F01K 23/02,04,06,08,10 * | Plants characterized by more than one engine delivering power external to the plant, the engines being driven by different fluids, the engine cycles being thermally coupled |
| F02C 3/20, 22, 24, 26,28, 30, 32, 34, 36 * | Gas-turbine plants characterized by the use of combustion products as the working fluid, using a special fuel, oxidant, or dilution fluid to generate the combustion products |
| F02C 6/10,12 * | Plural gas-turbine plants; Combinations of gas-turbine plants with other apparatus, |
| supplying working fluid to a user, e.g. a chemical process, which returns working fluid to a turbine of the plant | |
| F02C6/ | Combinations of gas-turbine plants with other apparatus |
| F02C6/02 | Plural gas-turbine plants having a common power output |
| Compressor: | |
| F01D 25/24 | Casings (modified for heating or cooling) |
| Combustor: | |
| F23R 3/28, 34,00 | Generating combustion products of high pressure or high velocity, e.g. gas-turbine combustion chambers, continuous combustion chambers using liquid or gaseous fuel |
| Closed loop steam cooling: | |
| F01D 25/24, 12 | e.g. Steam Turbines, component parts, for cooling (casings or general) |
| F01D 5/18 | Blades, hollow blades; heating or cooling means on blades |
| F01D 5/08 | Blade carrying members for heating or cooling |
| F02C 7/08 | Gas turbine plants, features, component parts, heating air supply before combustion |
| F02C 7/12, 16, 18 | Gas turbine plants, component parts, cooling of plants |
| Seals: | |
| F01D 5/02, 06 | Steam engines, steam turbines, blades, members, rotors |
| F01D 11/00, 08 | Minimalizing internal leakage of working fluid, for sealing space between rotor blade and stator |
| Removable inner turbine shell: | |
| F01D 25/14 | Steam turbines, component parts, casings modified |
| Single Crystal: | |
| F01D 5/00 | Non-positive-displacement machines and engines: blades |
* also in Lanzi et al. Note: The thermal barrier coating subfield was eliminated because there are fewer common IPC codes in this subfield and the technical applications are fairly broad.
References
- U.S. Energy Information Administration, Electricity Data Browser. Available online: http://www.eia.gov/electricity/data/browser (accessed on 10 July 2020).
- U.S. Energy Information Administration, Today in Energy, 10 April 2019. Available online: https://www.eia.gov/todayinenergy/detail.php?id=39012 (accessed on 10 July 2020).
- U.S. Energy Information Administration, Today in Energy, 6 February 2019. Available online: https://www.eia.gov/todayinenergy/detail.php?id=38252 (accessed on 10 July 2020).
- Verdolini, E.; Galeotti, M. At home and abroad: An empirical analysis of innovation and diffusion in energy technologies. J. Environ. Econ. Manag. 2011, 61, 119–134. [Google Scholar] [CrossRef]
- Hirsh, R.F. Power Loss: The Origins of Deregulation and Restructuring in the American Electric Utility System; The MIT Press: Cambridge, MA, USA, 1999. [Google Scholar]
- General Electric, 7HA NGCC Product Line Brochure. Available online: https://powergen.gepower.com/products/heavy-duty-gas-turbines/7ha-gas-turbine.html (accessed on 10 July 2020).
- Curtis, M.R. The Innovation of Energy Technologies and the U.S. National Innovation System—The Case of the Advanced Turbine System; U.S. Department of Energy, Office of Policy and International Affairs: Washington, DC, USA, 2003.
- National Research Council. Energy Research at DOE; The National Academies Press: Washington, DC, USA, 2001. [Google Scholar]
- David, P.A.; Hall, B.H.; Toole, A.A. Is public R & D a complement or substitute for private R & D? A review of the econometric evidence. Res. Policy 2000, 29, 497–529. [Google Scholar] [CrossRef] [Green Version]
- Joskow, P.L. Markets for Power in the United States: An Interim Assessment. Energy J. 2006, 27, 1–36. [Google Scholar] [CrossRef] [Green Version]
- Cullen, J.A.; Mansur, E.T. Inferring Carbon Abatement Costs in Electricity Markets: A Revealed Preference Approach Using the Shale Revolution. Am. Econ. J. Econ. Policy 2017, 9, 106–133. [Google Scholar] [CrossRef] [Green Version]
- Popp, D. From science to technology: The value of knowledge from different energy research institutions. Res. Policy 2017, 46, 1580–1594. [Google Scholar] [CrossRef] [Green Version]
- Craig, J.D.; Savage, S.J. Market Restructuring, Competition and the Efficiency of Electricity Generation: Plant-level Evidence from the United States 1996 to 2006. Energy J. 2013, 34, 1–31. [Google Scholar] [CrossRef]
- U.S. Energy Information Administration, Annual Energy Outlook. 1995. Available online: http://www.eia.gov/forecasts/aeo/archive.cfm (accessed on 10 July 2020).
- Sanyal, P.; Ghosh, S. Product Market Competition and Upstream Innovation: Evidence from the U.S. Electricity Market Deregulation. Rev. Econ. Stat. 2013, 95, 237–254. [Google Scholar] [CrossRef]
- U.S. Energy Information Administration, Annual Energy Outlooks for years 1992–1996. Available online: http://www.eia.gov/forecasts/aeo/archive.cfm (accessed on 10 July 2020).
- Bergek, A.; Tell, F.; Berggren, C.; Watson, J. Technological capabilities and late shakeouts: Industrial dynamics in the advanced gas turbine industry, 1987–2002. Ind. Corp. Chang. 2008, 17, 335–392. [Google Scholar] [CrossRef] [Green Version]
- Curtis, M.R. Technological Innovation and Public Private Sector Collaborations: The Case of the Advanced Turbine System Program. PhD Dissertation, George Mason University, Fairfax, VA, USA, 2002. [Google Scholar]
- Modern Power Systems, First 7H turbines go to Heritage Station, Scriba. Available online: http://www.modernpowersystems.com/features/featurefirst-7h-turbines-go-to-heritage-station-scriba/ (accessed on 20 July 2020).
- Siemens Westinghouse Power Corporation. Advanced Turbine Systems Program Phase III Technical Progress Final Report; Siemens Westinghouse Power Corporation: Pittsburgh, PA, USA, 2004. [Google Scholar] [CrossRef]
- Ray, R. A Report on Combined Cycle Projects in North America. Power Engineering. 3 February 2014. Available online: http://www.power-eng.com/articles/2014/02/a-report-on-combined-cycle-projects-in-north-america.html (accessed on 20 August 2020).
- U.S. Department of Energy, DOE Technology Successes – “Breakthrough” Gas Turbines, Office of Fossil Energy. Available online: https://www.energy.gov/fe/doe-technology-successes-breakthrough-gas-turbines (accessed on 20 August 2020).
- USPTO, Coordinate Patent Classification Codes (CPC). Available online: https://www.uspto.gov/web/patents/classification/cpc/html/cpc-Y02E.html (accessed on 20 July 2020).
- U.S. Department of Energy. 2009 American Recovery and Reinvestment Act. Available online: https://www.energy.gov/oe/information-center/recovery-act#:~:text=The%20American%20Recovery%20and%20Reinvestment,infrastructure%20and%20enhance%20energy%20independence (accessed on 20 July 2020).
- U.S. Energy Information Administration, Today in Energy, More New Natural Gas Combined-Cycle Power Plants Are Using Advanced Designs, 19 June 2019. Available online: https://www.eia.gov/todayinenergy/detail.php?id=39912 (accessed on 20 August 2020).
- U.S. Department of Energy, Levelized Cost and Levelized Avoided Cost of New Generation Resources in the Annual Energy Outlook 2019. Available online: https://www.eia.gov/outlooks/aeo/pdf/electricity_generation.pdf (accessed on 20 January 2020).
- Griliches, Z. Patent Statistics as Economic Indicators: A Survey. J. Econ. Lit. 1990, 28, 1661–1707. [Google Scholar] [CrossRef]
- Popp, D. Lessons from patents: Using patents to measure technological change in environmental models. Ecol. Econ. 2005, 54, 209–226. [Google Scholar] [CrossRef] [Green Version]
- Johnstone, N.; Hascic, I.; Popp, D. Renewable Energy Policies and Technological Innovation: Evidence Based on Patent Counts. Environ. Resour. Econ. 2009, 45, 133–155. [Google Scholar] [CrossRef]
- Jaffe, A.B.; Trajtenberg, M.; Fogarty, M.S. Knowledge Spillovers and Patent Citations: Evidence from a Survey of Inventors. Am. Econ. Rev. 2000, 90, 215–218. [Google Scholar] [CrossRef]
- Jaffe, A.B.; De Rassenfosse, G. Patent citation data in social science research: Overview and best practices. J. Assoc. Inf. Sci. Technol. 2017, 68, 1360–1374. [Google Scholar] [CrossRef]
- Trajtenberg, M.; Henderson, R.; Jaffe, A.B. University Versus Corporate Patents: A Window On The Basicness Of Invention. Econ. Innov. N. Technol. 1997, 5, 19–50. [Google Scholar] [CrossRef]
- Lanzi, E.; Verdolini, E.; Hascic, I. Efficiency-improving fossil fuel technologies for electricity generation: Data selection and trends. Energy Policy 2011, 39, 7000–7014. [Google Scholar] [CrossRef] [Green Version]
- De Rassenfosse, G.; Dernis, H.; Guellec, D.; Picci, L.; van Pottelsberghe de la Potterie, B. The worldwide count of priority patents: A new indicator of inventive activity. Res. Policy 2013, 42, 720–737. [Google Scholar] [CrossRef] [Green Version]
- Jaffe, A.B.; Trajtenberg, M.; Henderson, R. Geographic Localization of Knowledge Spillovers as Evidenced by Patent Citations. Q. J. Econ. 1993, 108, 577–598. [Google Scholar] [CrossRef]
- Coxe, S.; West, S.G.; Aiken, L.S. The Analysis of Count Data: A Gentle Introduction to Poisson Regression and Its Alternatives. J. Pers. Assess. 2009, 91, 121–136. [Google Scholar] [CrossRef] [PubMed]
- Allison, P. Fixed Effects Regression Models; SAGE Publications: Los Angeles, CA, USA, 2009. [Google Scholar]
- U.S. Energy Information Administration, Annual Energy Outlook for 2019. Available online: https://www.eia.gov/outlooks/aeo/pdf/aeo2019.pdf (accessed on 10 July 2020).
Figure 1.
(Left) Percentiles for natural gas-fired combined cycle generator (NGCC) plant efficiency based on a sample of NGCC plants in Table 2005. 2007, 2009, and 2012, and organized by the year the plant came online. It is important to note that there were a different number of plants and observations by year online, which is represented as the count of observations (Right).

Figure 2.
Normalized count of granted NGCC patents for the U.S. and all countries (global) before, during (1992–2000), and after the U.S. Department of Energy Advanced Turbine System (DOE-ATS) program using data from the Worldwide Patent Statistical Database (PATSTAT).
Figure 2.
Normalized count of granted NGCC patents for the U.S. and all countries (global) before, during (1992–2000), and after the U.S. Department of Energy Advanced Turbine System (DOE-ATS) program using data from the Worldwide Patent Statistical Database (PATSTAT).

Figure 3.
Patent counts (inventions) for unique ATS inventions filed in the U.S. and elsewhere (Global) as a result of the search strategy used in this paper (Section 4.1) from the PATSTAT database.
Figure 3.
Patent counts (inventions) for unique ATS inventions filed in the U.S. and elsewhere (Global) as a result of the search strategy used in this paper (Section 4.1) from the PATSTAT database.

Figure 4.
Citation counts for United States Patenting and Trademark Office (USPTO) ATS patents by each company using the search strategy described in this study (Section 4.1) with the PATSTAT database.
Figure 4.
Citation counts for United States Patenting and Trademark Office (USPTO) ATS patents by each company using the search strategy described in this study (Section 4.1) with the PATSTAT database.

Figure 5.
The coefficient results from the models on patent counts with 95% confidence intervals, represented as incidence-rate ratios. (A) is the joint treatment effect for the program participants, while (B) represents coefficients for participant companies separately. (C) is the year fixed-effects indicating overall patterns in ATS patenting by all companies during these years.

Figure 6.
The coefficient results from the citation models with 95% confidence intervals, represented as incidence-rate ratios, and the years of the program outlined in red. (A) is the joint treatment effect for the program participants, while (B) represents coefficients for participant companies separately. (C) is the year fixed-effects for the citation data.

Table 1.
Summary statistics for patent groups used in this study.
| Group | n | Mean | St. Dev. | Min | Max | % Self |
|---|---|---|---|---|---|---|
| Counts | ||||||
| Aero 1 | 29 | 36.3 | 21.8 | 16 | 109 | |
| Alstom | 29 | 16 | 12.7 | 1 | 44 | |
| GE | 29 | 66.6 | 50 | 8 | 185 | |
| Japanese 2 | 29 | 10.5 | 4 | 4 | 23 | |
| Mitsubishi | 29 | 8.1 | 11.6 | 0 | 43 | |
| Other | 29 | 84.4 | 32.6 | 49 | 187 | |
| SWPC | 29 | 20 | 11.7 | 4 | 43 | |
| United Tech. | 29 | 34.4 | 17.2 | 9 | 92 | |
| All | 232 | 34.5 | 35.4 | 0 | 187 | |
| Citations | ||||||
| Aero | 1048 | 11.3 | 12.2 | 0 | 132 | 7% |
| Alstom | 461 | 9.7 | 10.2 | 0 | 94 | 8% |
| GE | 1914 | 13.3 | 14.1 | 0 | 117 | 25% |
| Japanese | 302 | 15.4 | 17.1 | 0 | 119 | 8% |
| Mitsubishi | 232 | 9.6 | 9 | 0 | 50 | 9% |
| Other | 2424 | 13.6 | 19.9 | 0 | 494 | 3% |
| SWPC | 574 | 11.8 | 14 | 0 | 95 | 9% |
| United Tech. | 988 | 14.6 | 16.1 | 0 | 158 | 15% |
| All | 7943 | 12.9 | 16 | 0 | 494 | 12% |
1 For the purpose of the descriptive statistics only, the Aero group represents four aerospace manufacturing companies with smaller contributions to the dataset: Honeywell, MTU, Rolls-Royce, and Société nationale d’études et de construction de moteurs d’aviation (SNECMA). 2 For the purpose of the descriptive statistics only, the Japanese group represents four Japanese gas turbine manufacturing companies: Hitachi, IHI Corporation, Kawasaki Heavy Industries, and Toshiba.
© 2020 by the author. Licensee MDPI, Basel, Switzerland. This article is an open access article distributed under the terms and conditions of the Creative Commons Attribution (CC BY) license (http://creativecommons.org/licenses/by/4.0/).
Share and Cite
MDPI and ACS Style
Stevens, K.A. Analysis of the Advanced Turbine System Program on Innovation in Natural Gas Technology. Energies 2020, 13, 5057. https://0-doi-org.brum.beds.ac.uk/10.3390/en13195057
AMA Style
Stevens KA. Analysis of the Advanced Turbine System Program on Innovation in Natural Gas Technology. Energies. 2020; 13(19):5057. https://0-doi-org.brum.beds.ac.uk/10.3390/en13195057
Chicago/Turabian StyleStevens, Kelly A. 2020. "Analysis of the Advanced Turbine System Program on Innovation in Natural Gas Technology" Energies 13, no. 19: 5057. https://0-doi-org.brum.beds.ac.uk/10.3390/en13195057
Note that from the first issue of 2016, this journal uses article numbers instead of page numbers. See further details here.