Development and Application of a Flexible Modeling Approach to Reference Buildings for Energy Analysis

1
Department of Architecture, University of Seoul, Seoul 02504, Korea
2
Department of Architectural Engineering, University of Seoul, Seoul 02504, Korea
3
Green Building Research Center, Department of Living and Built Environment Research, Korea Institute of Civil Engineering and Building Technology, Goyang 10223, Gyeonggi, Korea
*
Author to whom correspondence should be addressed.
Energies 2020, 13(21), 5815; https://0-doi-org.brum.beds.ac.uk/10.3390/en13215815
Submission received: 8 October 2020
/
Revised: 31 October 2020
/
Accepted: 5 November 2020
/
Published: 6 November 2020
(This article belongs to the Special Issue Designing, Modeling and Optimizing Energy and Environmental Systems for Buildings)
Abstract
:This paper proposes a flexible modeling approach to develop a theoretical reference building (RB) for energy analysis. We designed an RB for five non-residential buildings, using dynamic simulation from statistically analyzed data of building stock in South Korea. For modeling, four subsets of data—form, envelope, system, and operation—were assessed. This study uses the autosizing function within EnergyPlus, to develop the RB. The proposed approach allows for a flexible design where capacities and flow rates of the heating, ventilation, and air-conditioning (HVAC) system match the newly defined RB model. This approach would be ideal for closing the gap between the architectural data and equipment elements. The RB developed in this study allows for performing energy performance analysis by end-use. The analysis results by the end-use can provide support for country-level greenhouse gas (GHG)-mitigation-strategy development.
1. Introduction
Building emission is gaining considerable attention as a potential field for minimizing the effect of climate change and greenhouse gas (GHG) emissions [1]. Such an objective requires a strong understanding of end-use based on energy demand and performance analyses of buildings, which is a complex process encompassing a massive amount of information. Such analyses can be conducted via computer programs that employ actual building data; however, a large number of buildings must be analyzed (i.e., on the country-level), which requires considerable time and effort. This requirement can be a limitation to achieving the previously mentioned research goals.
An alternative approach is to use reference buildings (RB) designed based on building samples extracted through statistical data analyses [2]. However, developing an RB is an extremely complex process, and its accuracy depends on the level of specificity employed to define a building [3]. The development of an RB demands high-level understanding and considerable data related to building stock [4]. In fact, most RB development begins with the analysis of building stock to acquire basic elements [5,6,7]. A common approach is to extract these data from official country- or region-level statistics. However, finding credible sources is a problem, and this leads to a lack of data required to define a standard model. Nevertheless, a standard model needs to be developed that can represent existing buildings as accurately as possible from an average building stock [3]. Even in the US, where the largest amount of RB research has been conducted, RB models account for only 65% of non-residential buildings [8].
Real-life limitations make it impossible to collect all building data that are necessary to define the values that comprise an RB. Therefore, research on RBs has been aimed at achieving limited goals, using specific types of building, as listed in Table 1.
Previous studies demonstrate that RBs are developed in various countries, using different methods and for multiple objectives. Studies employ both top-down or bottom-up approaches to modeling; top-down modeling approaches are often used for large-scale projects, such as macroeconomic analyses. Conversely, bottom-up modeling approaches are used to predict end-use by developing models for individual buildings to represent the building stock [22]. Furthermore, bottom-up approaches allow for specific energy analysis, thereby making macro-level analysis possible.
Engineering is a commonly used method in bottom-up approaches [18,22]. The bottom-up approach collects quantifiable data for variables that can be measured as input data for calculating building energy use in the existing building stock. The Department of Energy (DOE) in the US recommends using the bottom-up engineering model for improving building energy efficiency [8]. Furthermore, this model is popularly used in Europe, and it is most favored by policymakers [4]. In fact, the EU introduced a requirement that its member states should employ this approach to define an RB that represents the average building type [26].
Other studies on RBs, using the bottom-up approach, employ a dynamic model [3,4,8,16] based on existing data and building stock; regression model [19], clustering [27,28,29], and classification [30,31] have also been used.
However, a standardized method on RB development is yet to be established, resulting in a myriad of different methods. Corgnati et al. [3] classified the methods of standardized model development into three categories: (I) example building, (II) real building, and (III) theoretical building. Example building method is utilized when statistical data cannot be gathered, demanding reliance on professional assumptions and research in combination with data from other sources. Real building method is defined as an existing building which has the average characteristics based on statistical analysis. Theoretical building method is a statistical synthesis of found characteristics from the building stock.
This study aimed to develop an RB, using a bottom-up approach that employs dynamic simulation, using real building and theoretical building methods. This study uses methods II and III proposed by Corgnati et al. [3] and is identical to the RB development approach suggested by the DOE [8].
Applying dynamic simulation requires four subsets of data: form, envelope, system, and operation of the building [3]. Among these, form, envelope, and system can be defined based on the statistical analysis of the building stock. However, there is often a mismatch between the newly defined theoretical building (i.e., form and envelope) and heating, ventilation, and air-conditioning (HVAC) capacities and flow rates. Therefore, to determine HVAC capacities and flow rates that match the form and envelope of the theoretical building, building loads (i.e., cooling and heating loads) needs to be calculated first. Furthermore, it is difficult to calculate capacities that match the HVAC type and to design flow rates accordingly. However, because the RB needs the end-use of the building to be defined, it is critical to determine the performance and flow rate of the HVAC system. Therefore, this study uses the autosizing function within EnergyPlus [32]—provided by the dynamic simulation—to develop the RB. This approach is extremely flexible as the function automatically matches the capacities and flow rates of HVAC systems regardless of the form, envelope, and HVAC type. Moreover, it would be ideal for closing the gap between the architectural data and equipment elements.
This study derived energy performance specified by end-use of non-residential buildings. We expect that this study would have applications to sensitivity analyses of parameters when designing policy plans or calculating energy performance.
The rest of this paper is organized as follows. The research materials and method are described in Section 2. In Section 3, the results of the RB development process are provided. Discussion on review of energy performance, contributions, and applications are presented in Section 4. Finally, the conclusions are listed in Section 5.
2. Materials and Methods
2.1. Research Method and Scope
The European Parliament and the Council of the European Union [33] defines RBs as “buildings characterized by and representative of their functionality and geographic location, including indoor and outdoor climate conditions”. The RB aims to represent the typical and average building stock in terms of climatic conditions and functionality (i.e., residential buildings and schools) [3]. This study adds “a theoretical building that has representative energy performance” to the existing definition of the RB; this is a partial modification of the definition for a prototype building [34]. Therefore, this study aims to analyze and characterize the energy performance in an RB.
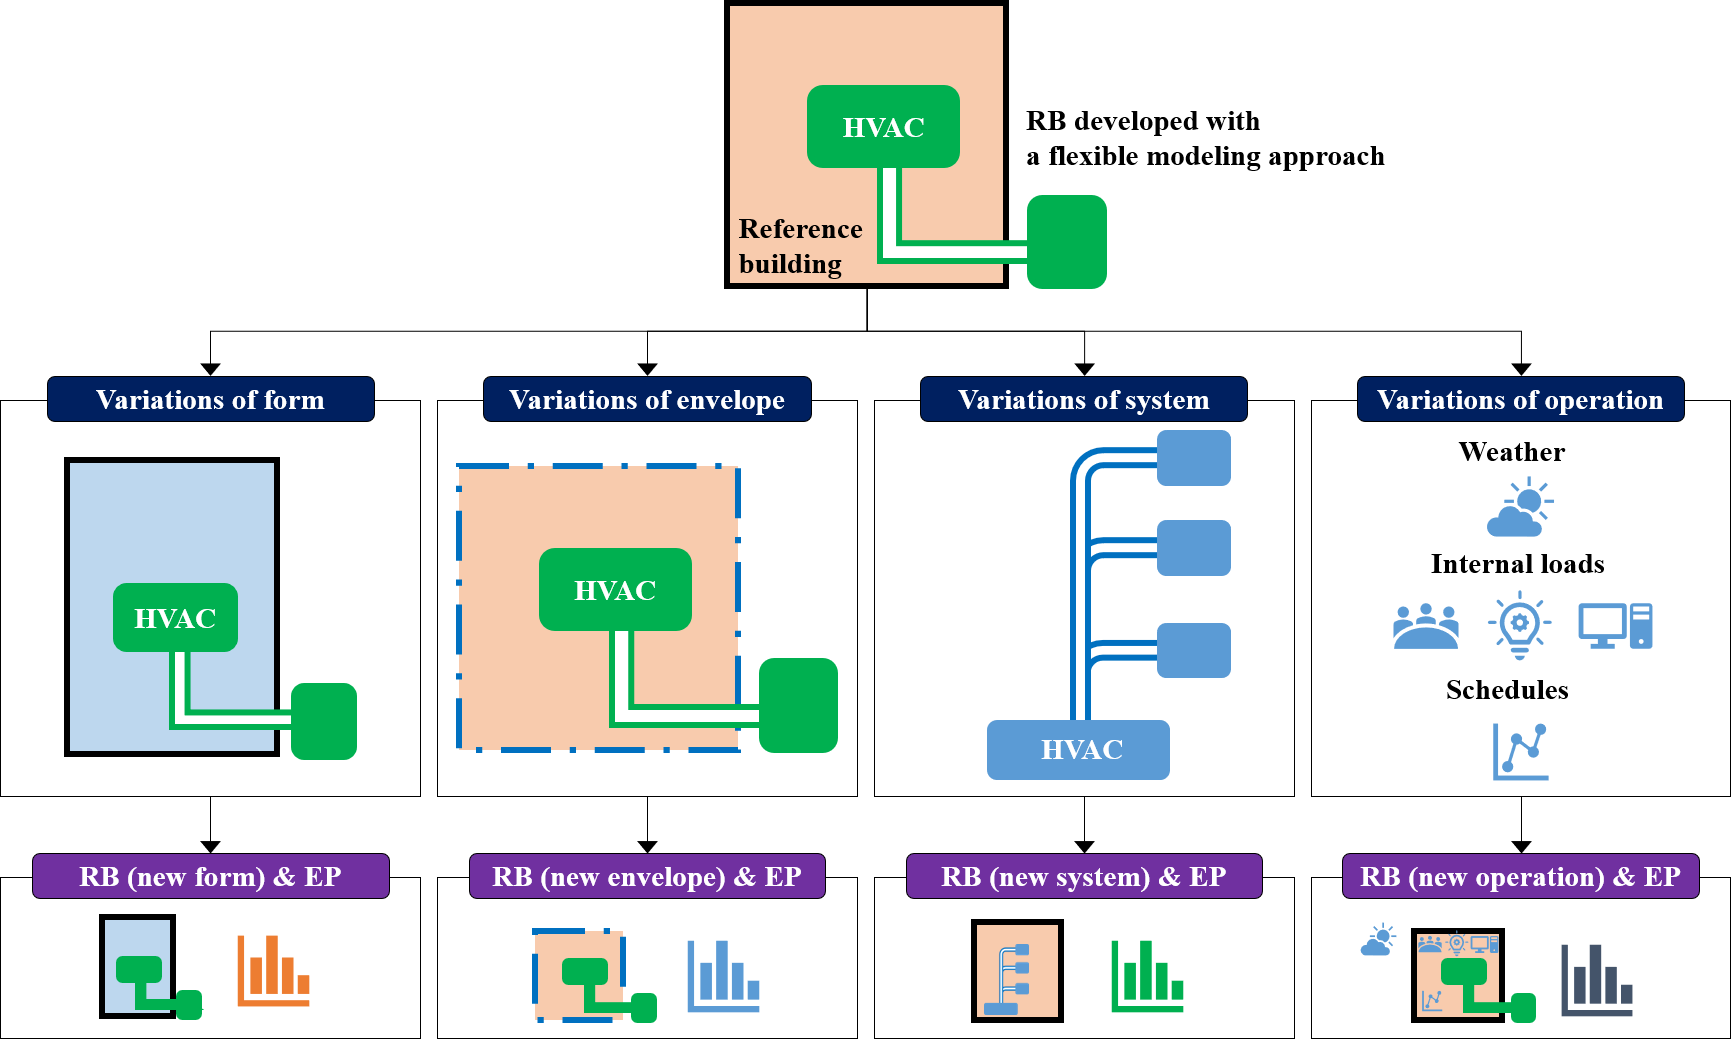
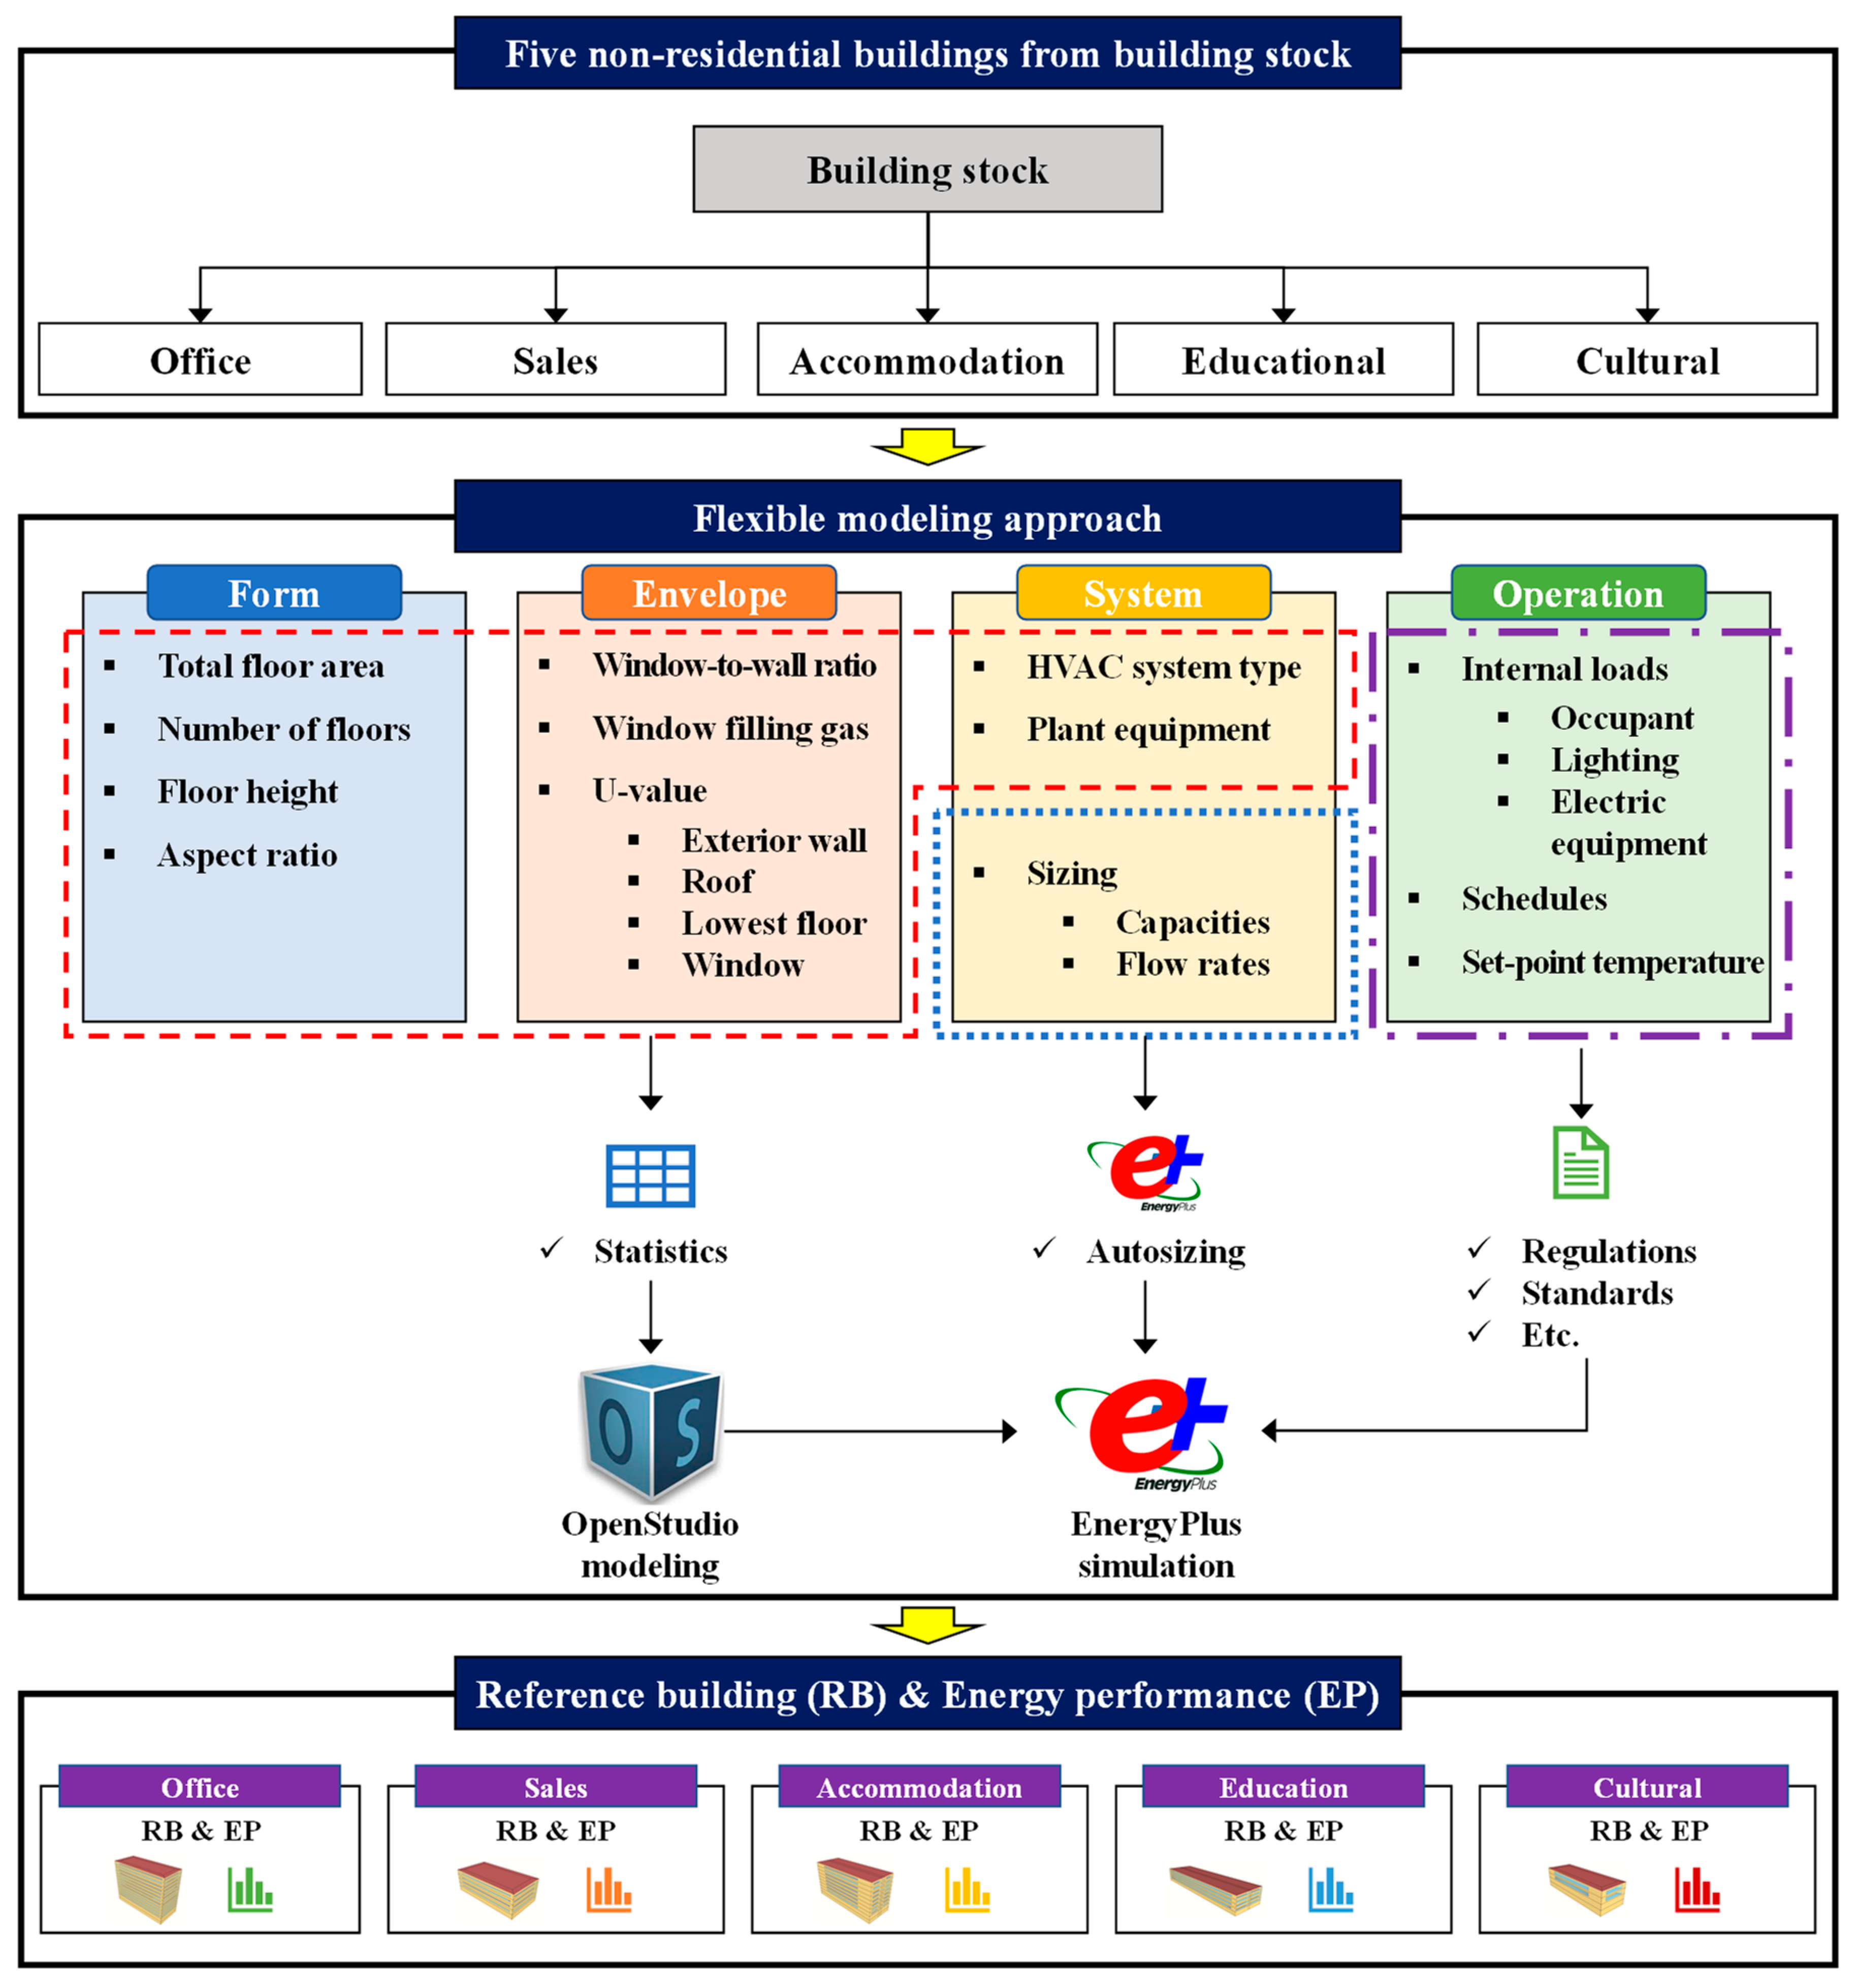
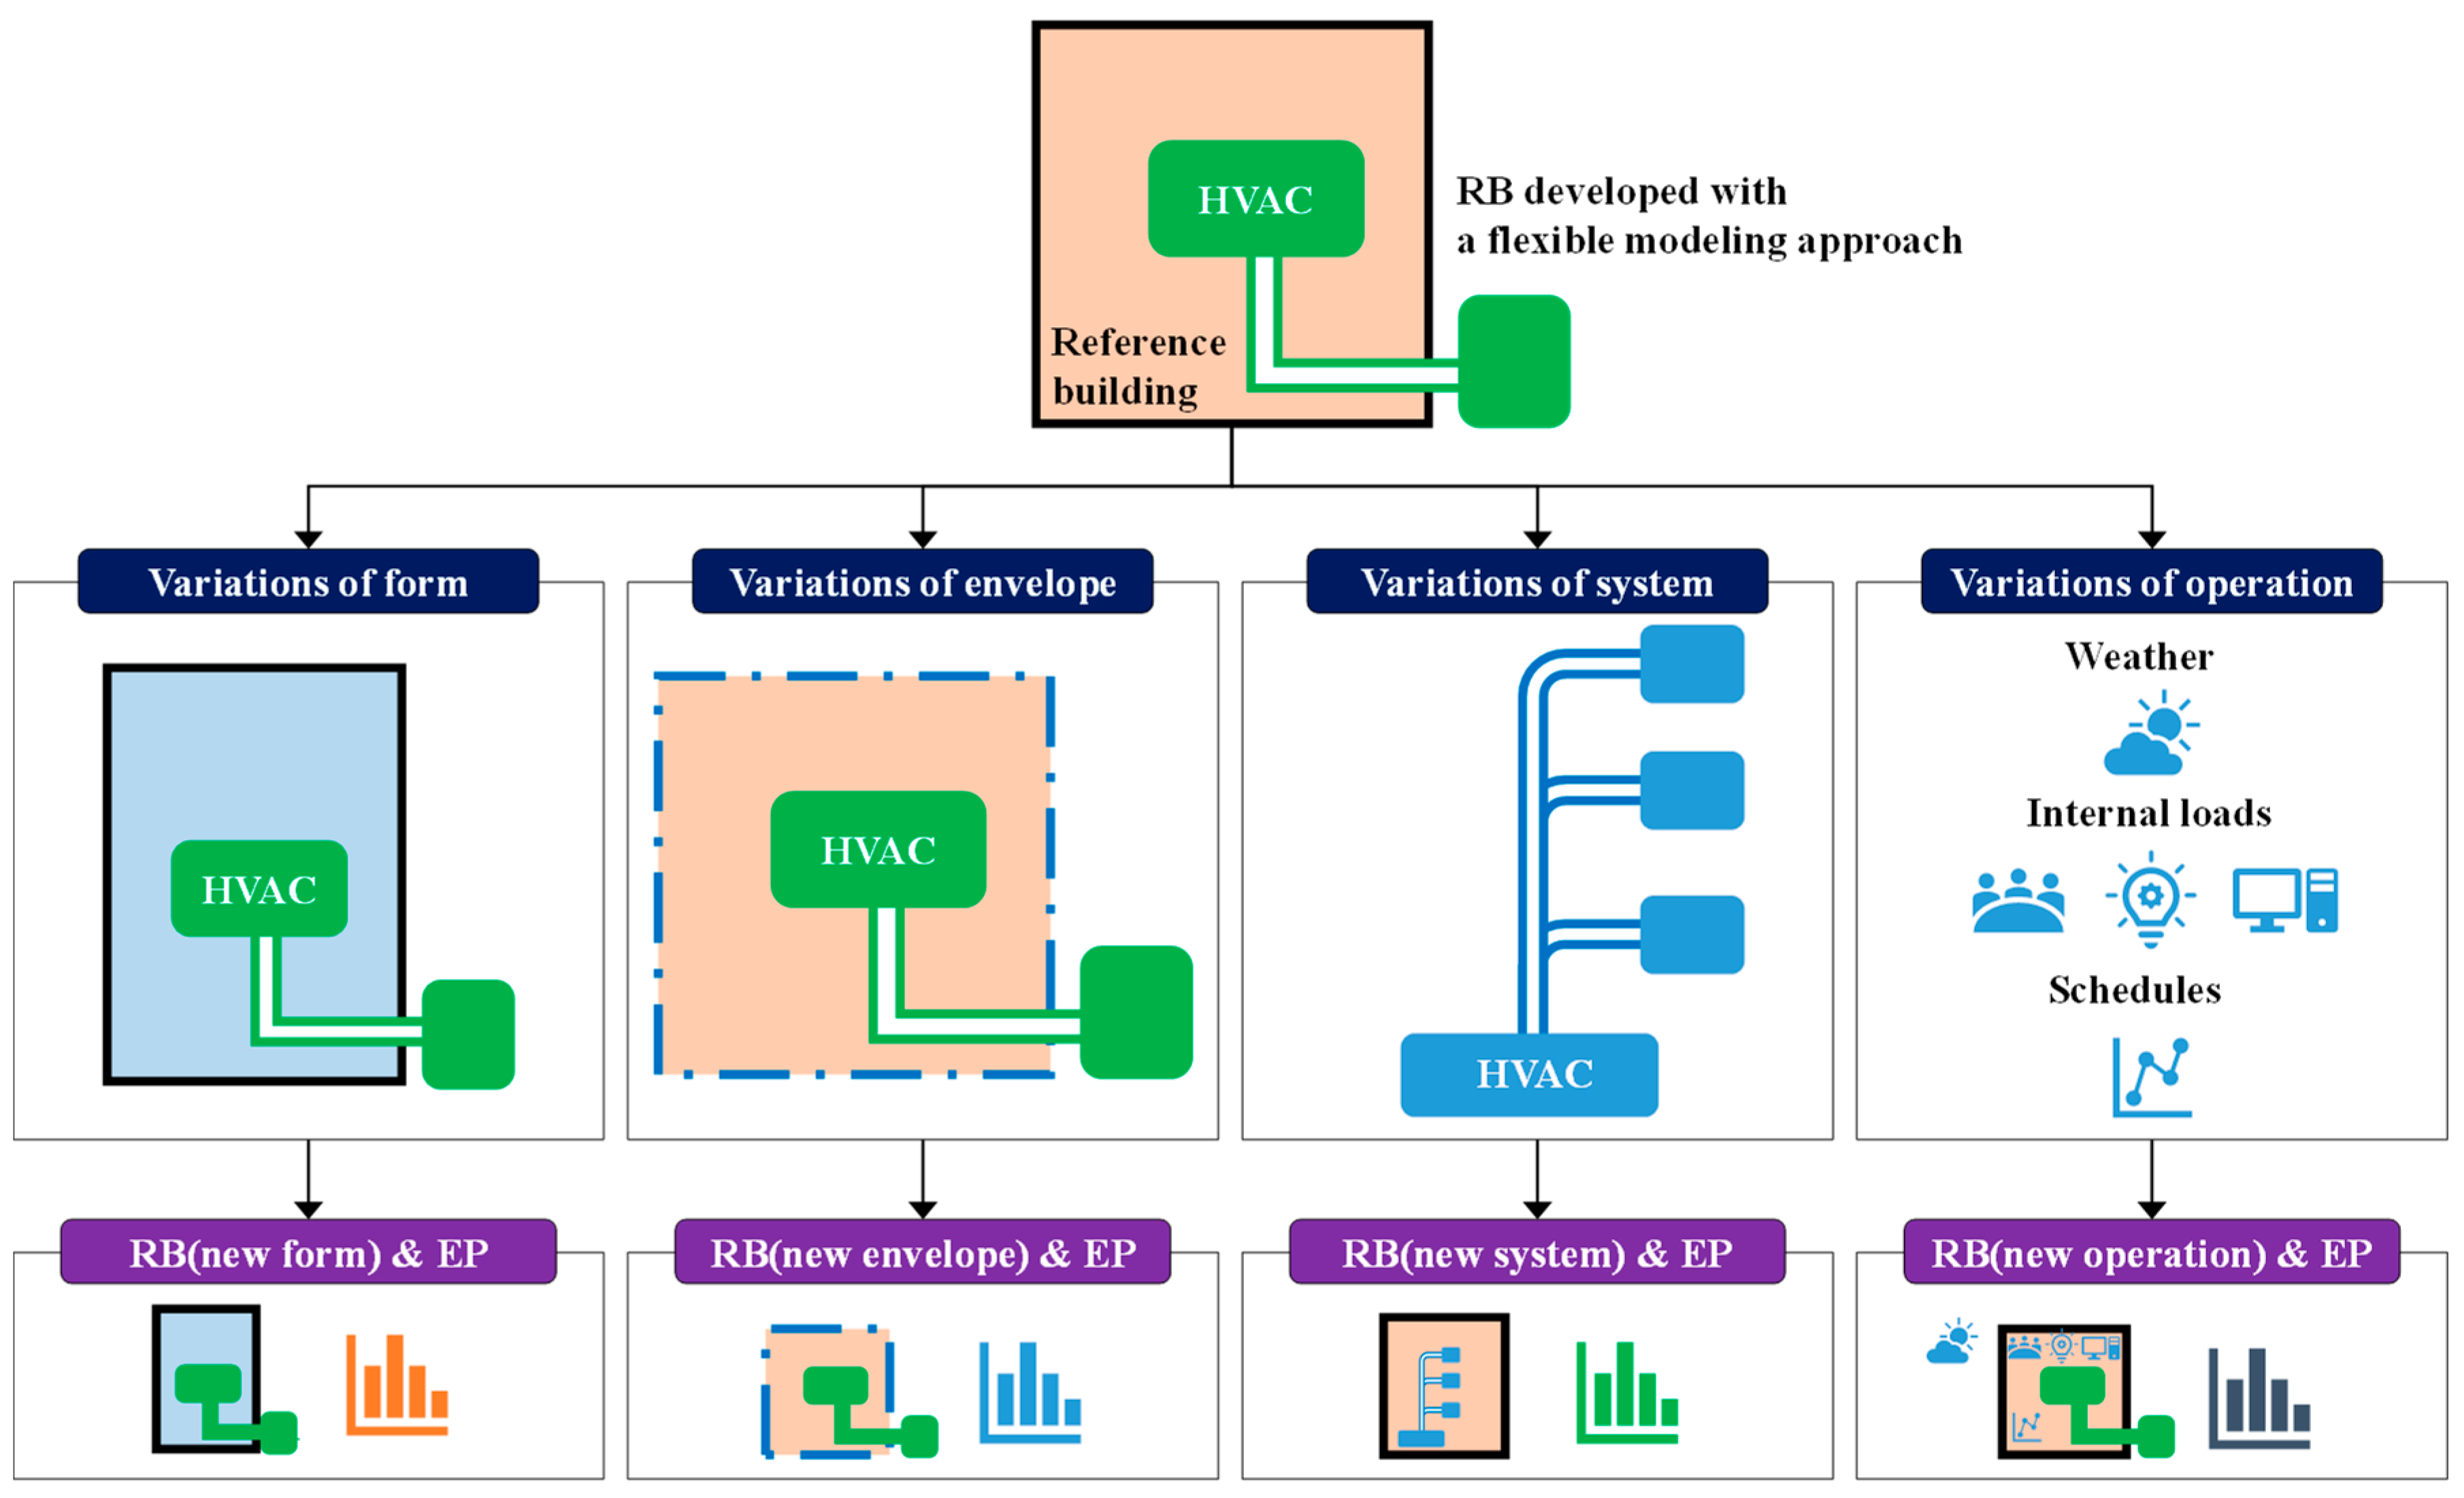
The inputs for four subset data [3] are required to complete the modeling process, using the proposed simulation method. Corgnati et al. [3] were inspired by the DOE [8] for their four subset data inputs, and this study follows the same approach. In this study, the form, envelope, and the HVAC system type define the representative values for the statistical analysis of the building stock. Furthermore, the system first classifies whether the HVAC system is a central system or an individual system, which is then used as input in the autosizing function of EnergyPlus to determine the HVAC system type. Unlike other studies, the method employed in this study is ideal for flexible modeling and utilizes a novel approach. The operation data employ input data based on South Korean regulations (building energy code) and standards; in addition, the related literature is investigated to obtain input data. The approach and scope of this study are illustrated in Figure 1.
For a reliable long-term scenario analysis at the country-level, the RBs of subdivided non-residential buildings is required. Buso and Corgnati [4] mentioned that office buildings cannot represent all non-residential buildings and they cannot alone provide a realistic building energy perspective. In other words, without the subdivision of non-residential buildings, the understanding of all energy systems is inevitably weakened. Therefore, this study aims to develop the RBs of five subdivisions of non-residential buildings (office, sales, accommodation, educational, and cultural buildings) such that these RBs can be utilized at the country-level.
At the 21st Conference of Parties, South Korea indicated the intended nationally determined contribution to reduce GHG emissions by 37% compared to business as usual (BAU) by 2030 [1,35]. Therefore, this study collected and statistically analyzed the data of new buildings designed in 2016 and 2017, including 2015—the base year for setting national reduction targets—from building stock.
2.2. Building Energy Simulation: EnergyPlus
The EU recommends the use of dynamic energy simulation for the development of credible RB [26,33]. Thus, existing studies have developed RB by using dynamic energy simulation methods [3,4,8,16]. This study uses the most adequate dynamic energy simulation (i.e., EnergyPlus) to conduct an energy performance analysis by end-use.
EnergyPlus is a whole-building performance simulation tool. It is a console-based program that is developed and managed by DOE and National Renewable Energy Laboratory with an aim to create models of a building’s energy use. This system can model heating, ventilation, cooling, lighting, water use, renewable energy generation, and other building energy flows. Furthermore, it incorporates a variety of innovative simulation functions including sub-hourly time-steps, modular systems, plant systems integrated with heat balance-based zone simulation, multizone air flow, thermal comfort, water use, natural ventilation, renewable energy systems, and user-customizable energy management systems [36].
EnergyPlus can process high-dimension building energy models that include detailed data of the functions and physical characteristics of buildings; furthermore, it can simulate a large number of subroutines simultaneously to arrive at a more accurate estimate of the performance of the entire building [36,37]. In addition, EnergyPlus allows building experts, scientists, and engineers to determine optimal building plans and operations, thereby contributing to energy savings [36]. Given these characteristics, several researchers use EnergyPlus in a variety of fields including early design [38,39], operations [40], development of controllers [41], energy efficiency measures [42], renewable energy [43], fault modeling [44], and occupant behavior [45].
OpenStudio [46] is a graphic interface software based on EnergyPlus. It is plugged into the architectural modeling program SketchUp [47], thereby allowing to run a simulation of the building form. EnergyPlus and OpenStudio allow the user to input specific settings for the HVAC system, internal load, operation schedule, and building materials.
This study used both EnergyPlus 8.9 and OpenStudio 2.5 to analyze the energy performance and its characteristics. There exist several material “types” that may be used to describe layers within opaque construction elements in EnergyPlus [32]. Among them, the “NoMass” type, which can be defined when only the thermal resistance (R-value) is known, was used herein. Although the wall structures in actual buildings are critical, only the U-value (strictly, the thermal resistance (R-value)) was used in this study rather than variables such as thickness, thermal conductivity, density, and specific heat. This type is similar in nature, and the load calculation is performed assuming steady state heat conduction [32]. Additional details of the capacities and flow rates of the HVAC system were addressed, using the autosizing function in EnergyPlus.
2.3. Building Stock
The South Korean government [48,49] introduced regulations and standards to decrease energy consumption in the building sector. Policies to save energy by improving energy efficiency such as the Green Buildings Construction Support Act [48] have been implemented, and these policies mandate an energy performance index to prevent heat loss and the use of energy-saving equipment for efficiently managing the energy consumption of the building. To this end, when requesting permission to build a new structure that crosses a certain size (i.e., total floor area 500 m2), documents for the energy saving plans of the building need to be submitted [49]. The key contents of this document include the average U-value of the structure, airtight windows, use of high-efficiency mechanical and electronic equipment, energy-saving controller, and renewable HVAC system use. The document contains a basic architectural profile, a checklist of the standard requirements of the energy-saving plan, and an attachment of the energy performance index review. The energy performance index is categorized into architecture, mechanical equipment, electrical equipment, and renewable energy.
The region is determined by climate conditions of South Korea, categorized into central region (Seoul, Incheon, Gyeonggi, and Northern Chungcheong), southern region (Busan, Daegu, Daejeon, Gwangju, Southern Chungcheong, Northern Jeolla, Southern Jeolla, Northern Gyeongsang, and Southern Gyeongsang), and Jeju region (Jeju Island). The national standards set thermal requirements (U-values) for the building’s exterior walls, roof, lowest floor, and windows. Table 2 lists the standard U-values for new non-residential buildings constructed during the timeframe of this study (2015–2017).
The South Korean government has set up a road map to minimize the energy consumption of new buildings to zero by 2025 gradually [50,51]. Hence, building energy-saving plans have strengthened insulation performance criteria from 2008 until recently (September 2018).
This study collected data on five types of non-residential buildings from the building stock (i.e., permitted new buildings in 2015–2017 from Electronic Architectural Administration Information System (EAIS) [52]). The collected data—form (i.e., total floor area, number of floors, floor height, and aspect ratio (building length/building width)), envelope (i.e., window-wall ratio (WWR), window filling gas, and U-values), and system (i.e., HVAC system type and plant equipment)—were analyzed, and a database (DB) was created.
2.4. Autosizing of HVAC System
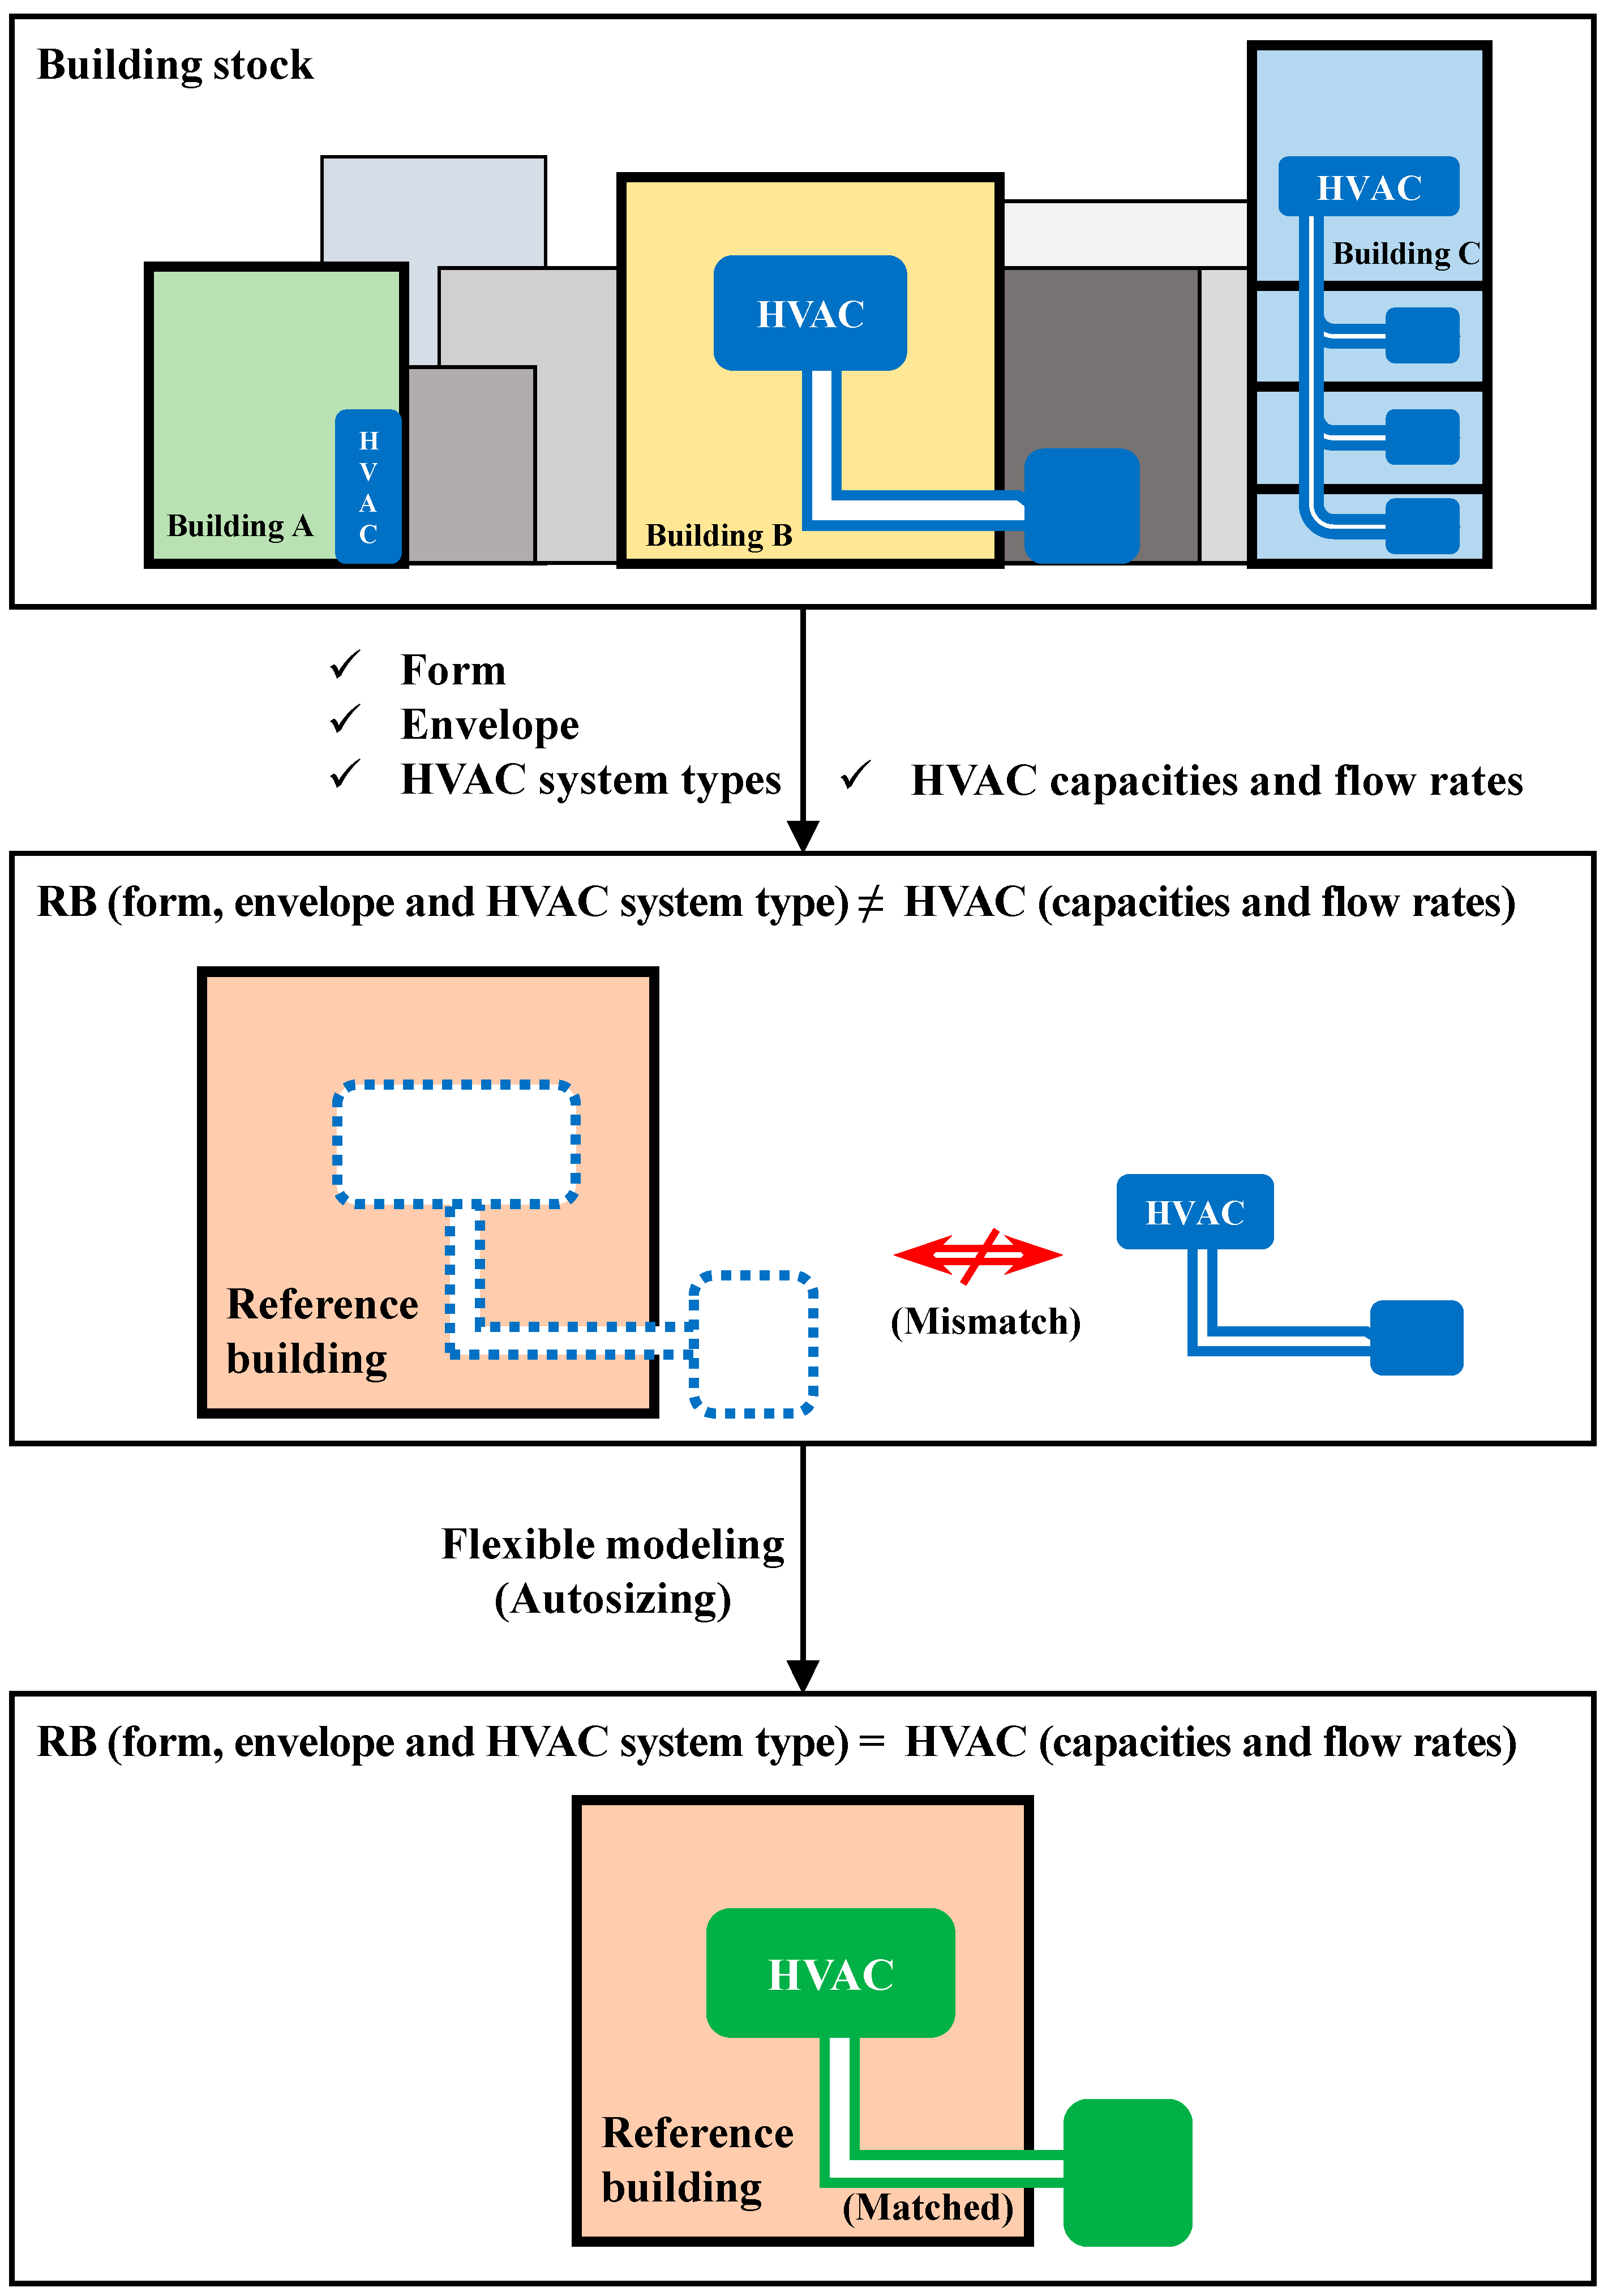
Even after the HVAC system type is determined, complications persist because all relevant parameters (i.e., capacities and flow rates) need to be defined. These data cannot be statistically analyzed and extracted from the building stock because the RB developed from using the newly defined form and envelope may not match the capacities and flow rates of the HVAC systems analyzed from the building stock (see Figure 2). An HVAC system that matches the theoretical building needs to be generated by calculating the building loads (i.e., cooling/heating load). Based on these calculations, researchers must choose the equipment and determine its capacities.
However, this study suggests using the autosizing function within EnergyPlus to design the capacities and flow rates of HVAC system. This approach automatically calculates the capacities and flow rates of the HVAC systems that match the building load calculated from the design day [53]. Therefore, it enables the analysis of the energy performance by completing the optimal HVAC system for the RB, a theoretical building. The use of this approach provides flexibility in terms of the response to the energy performance even if the form, envelope, and the HVAC system type of a building are changed. In this study, the autosizing function was applied to the parameters of the HVAC systems, as listed in Table 3.
2.5. Operation
There are a wide variety of non-residential buildings. In fact, energy performance can vary widely according to the services provided in the building [4]. Non-residential buildings can be classified into office, sales, accommodation, educational, cultural, and medical buildings; the South Korean government classifies non-residential buildings into 25 categories [54]. This study developed an RB for five representative non-residential buildings in South Korea. To this end, the study considered operations data, which are the last of the subsets. This subset is represented by internal loads and schedules. The internal loads and schedules inputs into dynamic simulation are a crucial part of energy performance analysis. In particular, the data require occupant, lighting, and electric equipment density and schedule, as well as the data and schedules for infiltration, ventilation, and hot water. Furthermore, data on set-point temperature and operation schedule for heating and cooling system use are necessary.
For the aforementioned data, this study first used data that could be obtained from the building stock [52]; data that could not be gathered this way used the South Korean regulations and standards for the building design [55,56], in addition to the recent report [57]. Other data were surveyed by studying the DOE commercial-reference-building data [8,58].
3. Results
3.1. Reference Buildings
3.1.1. Collection of Data from Building Stock
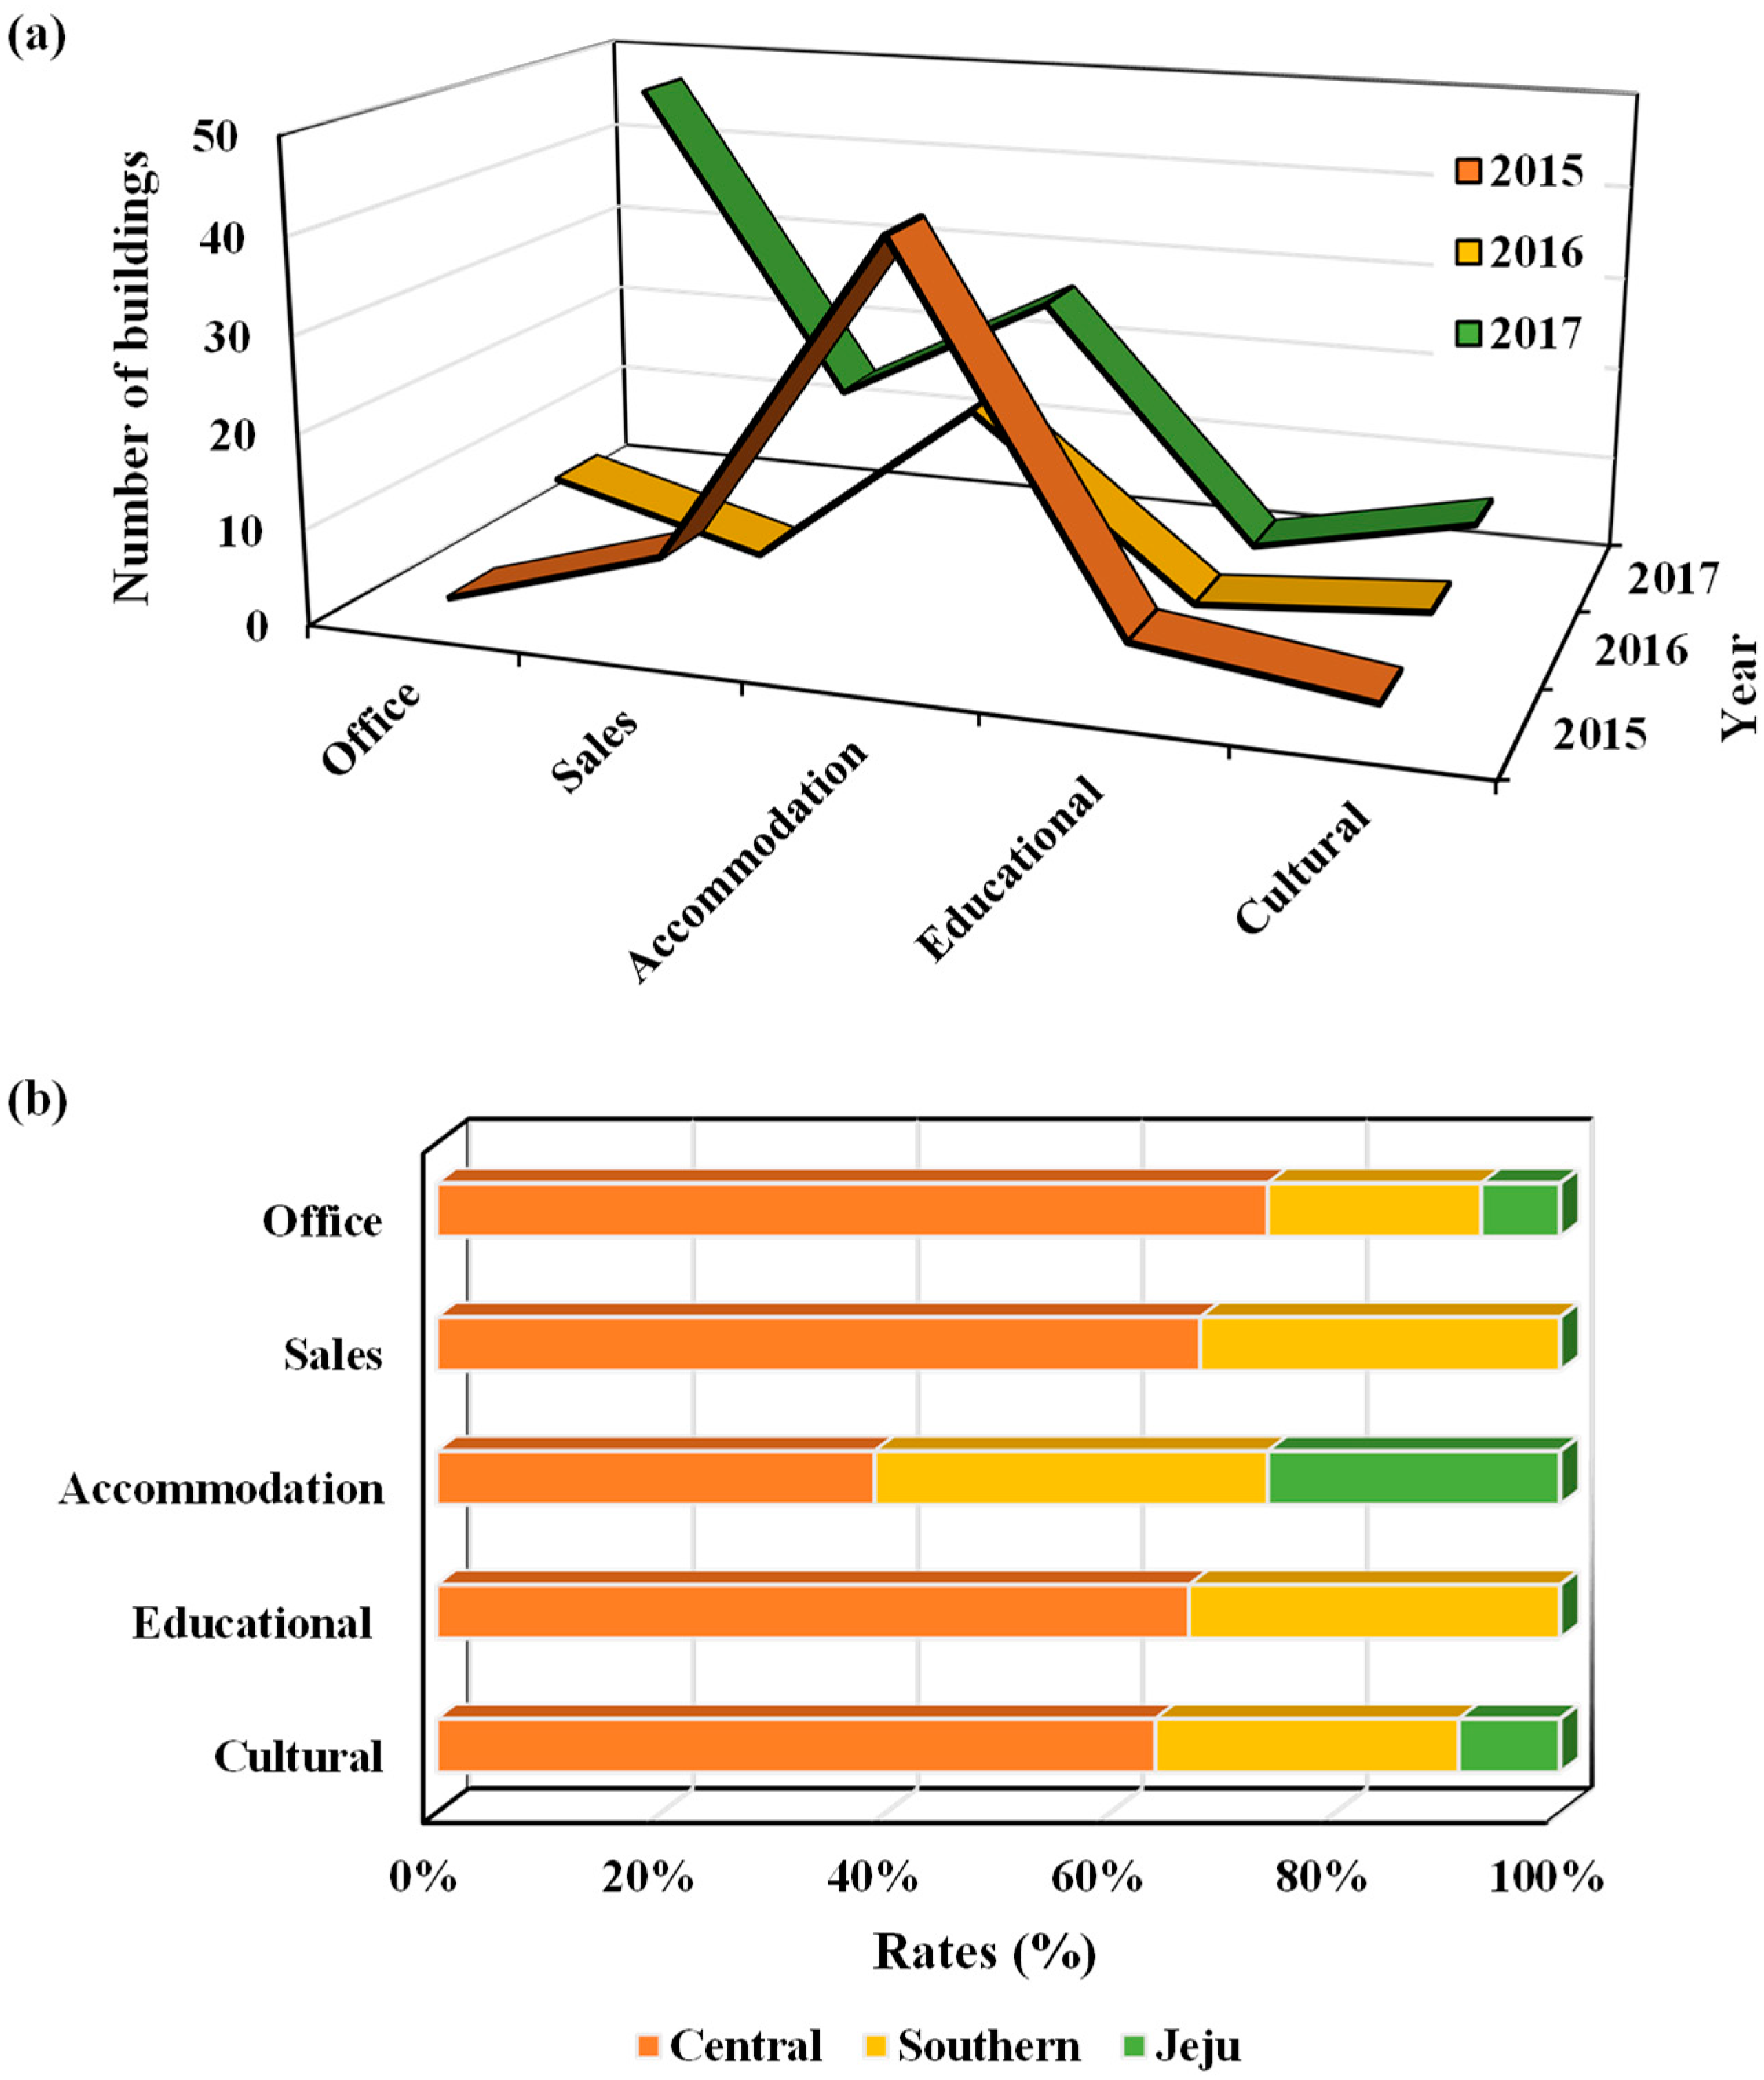
Figure 3a shows the 193 buildings collected from EAIS [52] for data analysis. There were 57, 25, 89, 9, and 13 office, sales, accommodation, education, and cultural buildings, respectively. The distribution of the buildings in regions by climate (central, southern, and Jeju) is shown in Figure 3b.
The central region has the largest number of all five types of buildings because more than half the Korean population (50.1%) lives in the capital area (Seoul, Incheon, and Gyeonggi), which is located in the central region. Accommodation buildings are more densely distributed in the Jeju region because a large number of these buildings are built on Jeju island, a UNESCO world heritage site (i.e., Jeju volcanic and lava tubes).
In this study, the statistical values (i.e., average values) of the raw data were used for all the parameters of (i) the form, (ii) the envelope, and (iii) the system—except for the autosizing part—as shown in Figure 1. The raw data were provided by EAIS [52], and the statistical values of these data are shown in Table 4, Table 5, Table 6 and Table 7, in Section 3.1.2.
3.1.2. Four Subsets of Reference Buildings
The four subsets defined for the development of RBs are listed below.
- Form. The parameters necessary for defining geometry and size were acquired through a statistical analysis of the building stock [52]. Five types of form were defined and they are listed in Table 4. The floor plan attributed to the function of the non-residential building was selected as the standard floor plan. As this study aims to develop an RB for energy analysis, conditioned and unconditioned zones in the plan were specified instead of having no specified zones. Hence, representative floor plans of office, sales, and cultural buildings had five zones (four perimeter zones and one core zone), and accommodation and educational buildings representative floor plans were divided into three zones (central corridor, south zone, and north zone).
- Envelope. To define the window-to-wall ratio (WWR), window filling gas, and U-values, statistical data from EAIS [52] were utilized. Envelope characteristics were defined based on the five types of RBs listed in Table 5 and Table 6. For the existing buildings, the gas charged in the gap of the double glazing was air. However, for the target buildings considered in this study, i.e., the latest (2015–2017) buildings, it was found that argon gas with a higher insulation performance than that of air was charged in the gap of the double glazing. Table 2 shows the U-value that is used as the standard during the design of new buildings. For the target new (2015–2017) buildings considered in this study, the U-value of the buildings designed in 2015 had to be designed such that it was lower than the 2013 design standard value, and the U-value of the buildings designed in 2016 and 2017 had to be designed such that it was lower than the 2016 design standard value, as shown in Table 2, depending on the region. Therefore, the U-value must be located between the standard values of 2013 and 2016 for each region shown in Table 2. This is because the U-value calculated in this study was analyzed for the entire country rather than for each region. For example, it can be said that the U-value (0.331) of the exterior walls of the accommodation building, as in Table 6, was reasonably calculated because it is located between the 2016 U-value (0.430) of Jeju and the 2013 U-value (0.270) of central shown in Table 2. In addition, the U-value (0.240) of the exterior walls of the office building was lower than the 2016 standard U-value (0.260) of the central region, which is the most severe condition, indicating that the insulation performance was designed to be much higher than the reasonable level for the latest new buildings. Overall, the U-values in Table 6 are reasonable when compared to the standard values in Table 2. Meanwhile, there are several parameters associated with high uncertainty during the envelope modeling of a building, deriving the best correction results through an optimization technique can be attempted, as Ramos Ruiz and Fernández Bandera [59] did. Our study, however, targeted a number of recently designed (2015–2017) buildings rather than a specific building. In addition, an attempt was made to represent the buildings as per statistical values. Herein, a level of uncertainty was involved because the aim was to develop RBs that can represent the correction of all the buildings rather than for a specific building.
- System. The energy performance can be analyzed, using the RB in two phases. In the first phase, the HVAC system type and the plant equipment are defined. In the second phase, the capacities and flow rates of the HVAC system and plant equipment are defined.
- ①
- First phase: The following three steps were performed to define the HVAC system type and the plant equipment.
- (1)
- Step 1. Statistical analysis based on the data obtained from the EAIS [52]: For the HVAC system type, the office was identified as the central type, while the sales, accommodation, educational, and cultural buildings were all identified as an individual type—electric heat pump (EHP). The core zone of the office was identified as the constant air volume (CAV), while the perimeter zones were identified as the fan coil unit (FCU), thereby making it a hybrid system. Among the central types, the plant equipment in the office was identified as the absorption chiller–heater (ACH) and cooling tower (CT). All buildings other than office buildings were individual system types; no further identification of plant equipment was conducted.
- (2)
- Step 2. Review of compliance with domestic building equipment regulations [55]: The HVAC system type varies according to the type of building; however, it can also vary among the same type of buildings. In addition, region or policy may contribute to differences; in the case of South Korea, the regulations require thermal energy storage or gas-type HVAC systems to be installed based on the type of building and floor area [55]. This is not necessary when it is not a centralized HVAC system. The possibility of applying the identified equipment in the first step was reviewed in accordance with the regulation. The review analysis determined that the HVAC system type and the plant equipment identified in Step 1 do comply with the domestic regulations and can thus be applied.
- (3)
- Step 3. Comparative analysis between the RB developed in this study and a building from the building stock, which is most similar to the RB: A building comparable in size to that of the RB developed in this study was selected from the EAIS [52]. Afterward, the HVAC system type identified in Steps 1 and 2 was compared with the building’s main equipment for analysis. Essentially, a building that had a floor space closest to the total floor area of the RB was used for comparison. We compared the RB with a real building most similar to it to analyze and determine whether the RB was realistic or not. The result confirmed that the HVAC system type and the plant equipment identified in Steps 1 and 2 are valid, and they are defined as shown in Table 7.
- ②
- Second phase: The capacities and flow rates that correspond to the HVAC system type and the plant equipment determined in the first phase need to be designed. As mentioned earlier, this task was addressed, using the autosizing function in EnergyPlus, and the result thereof is shown in Table 8.
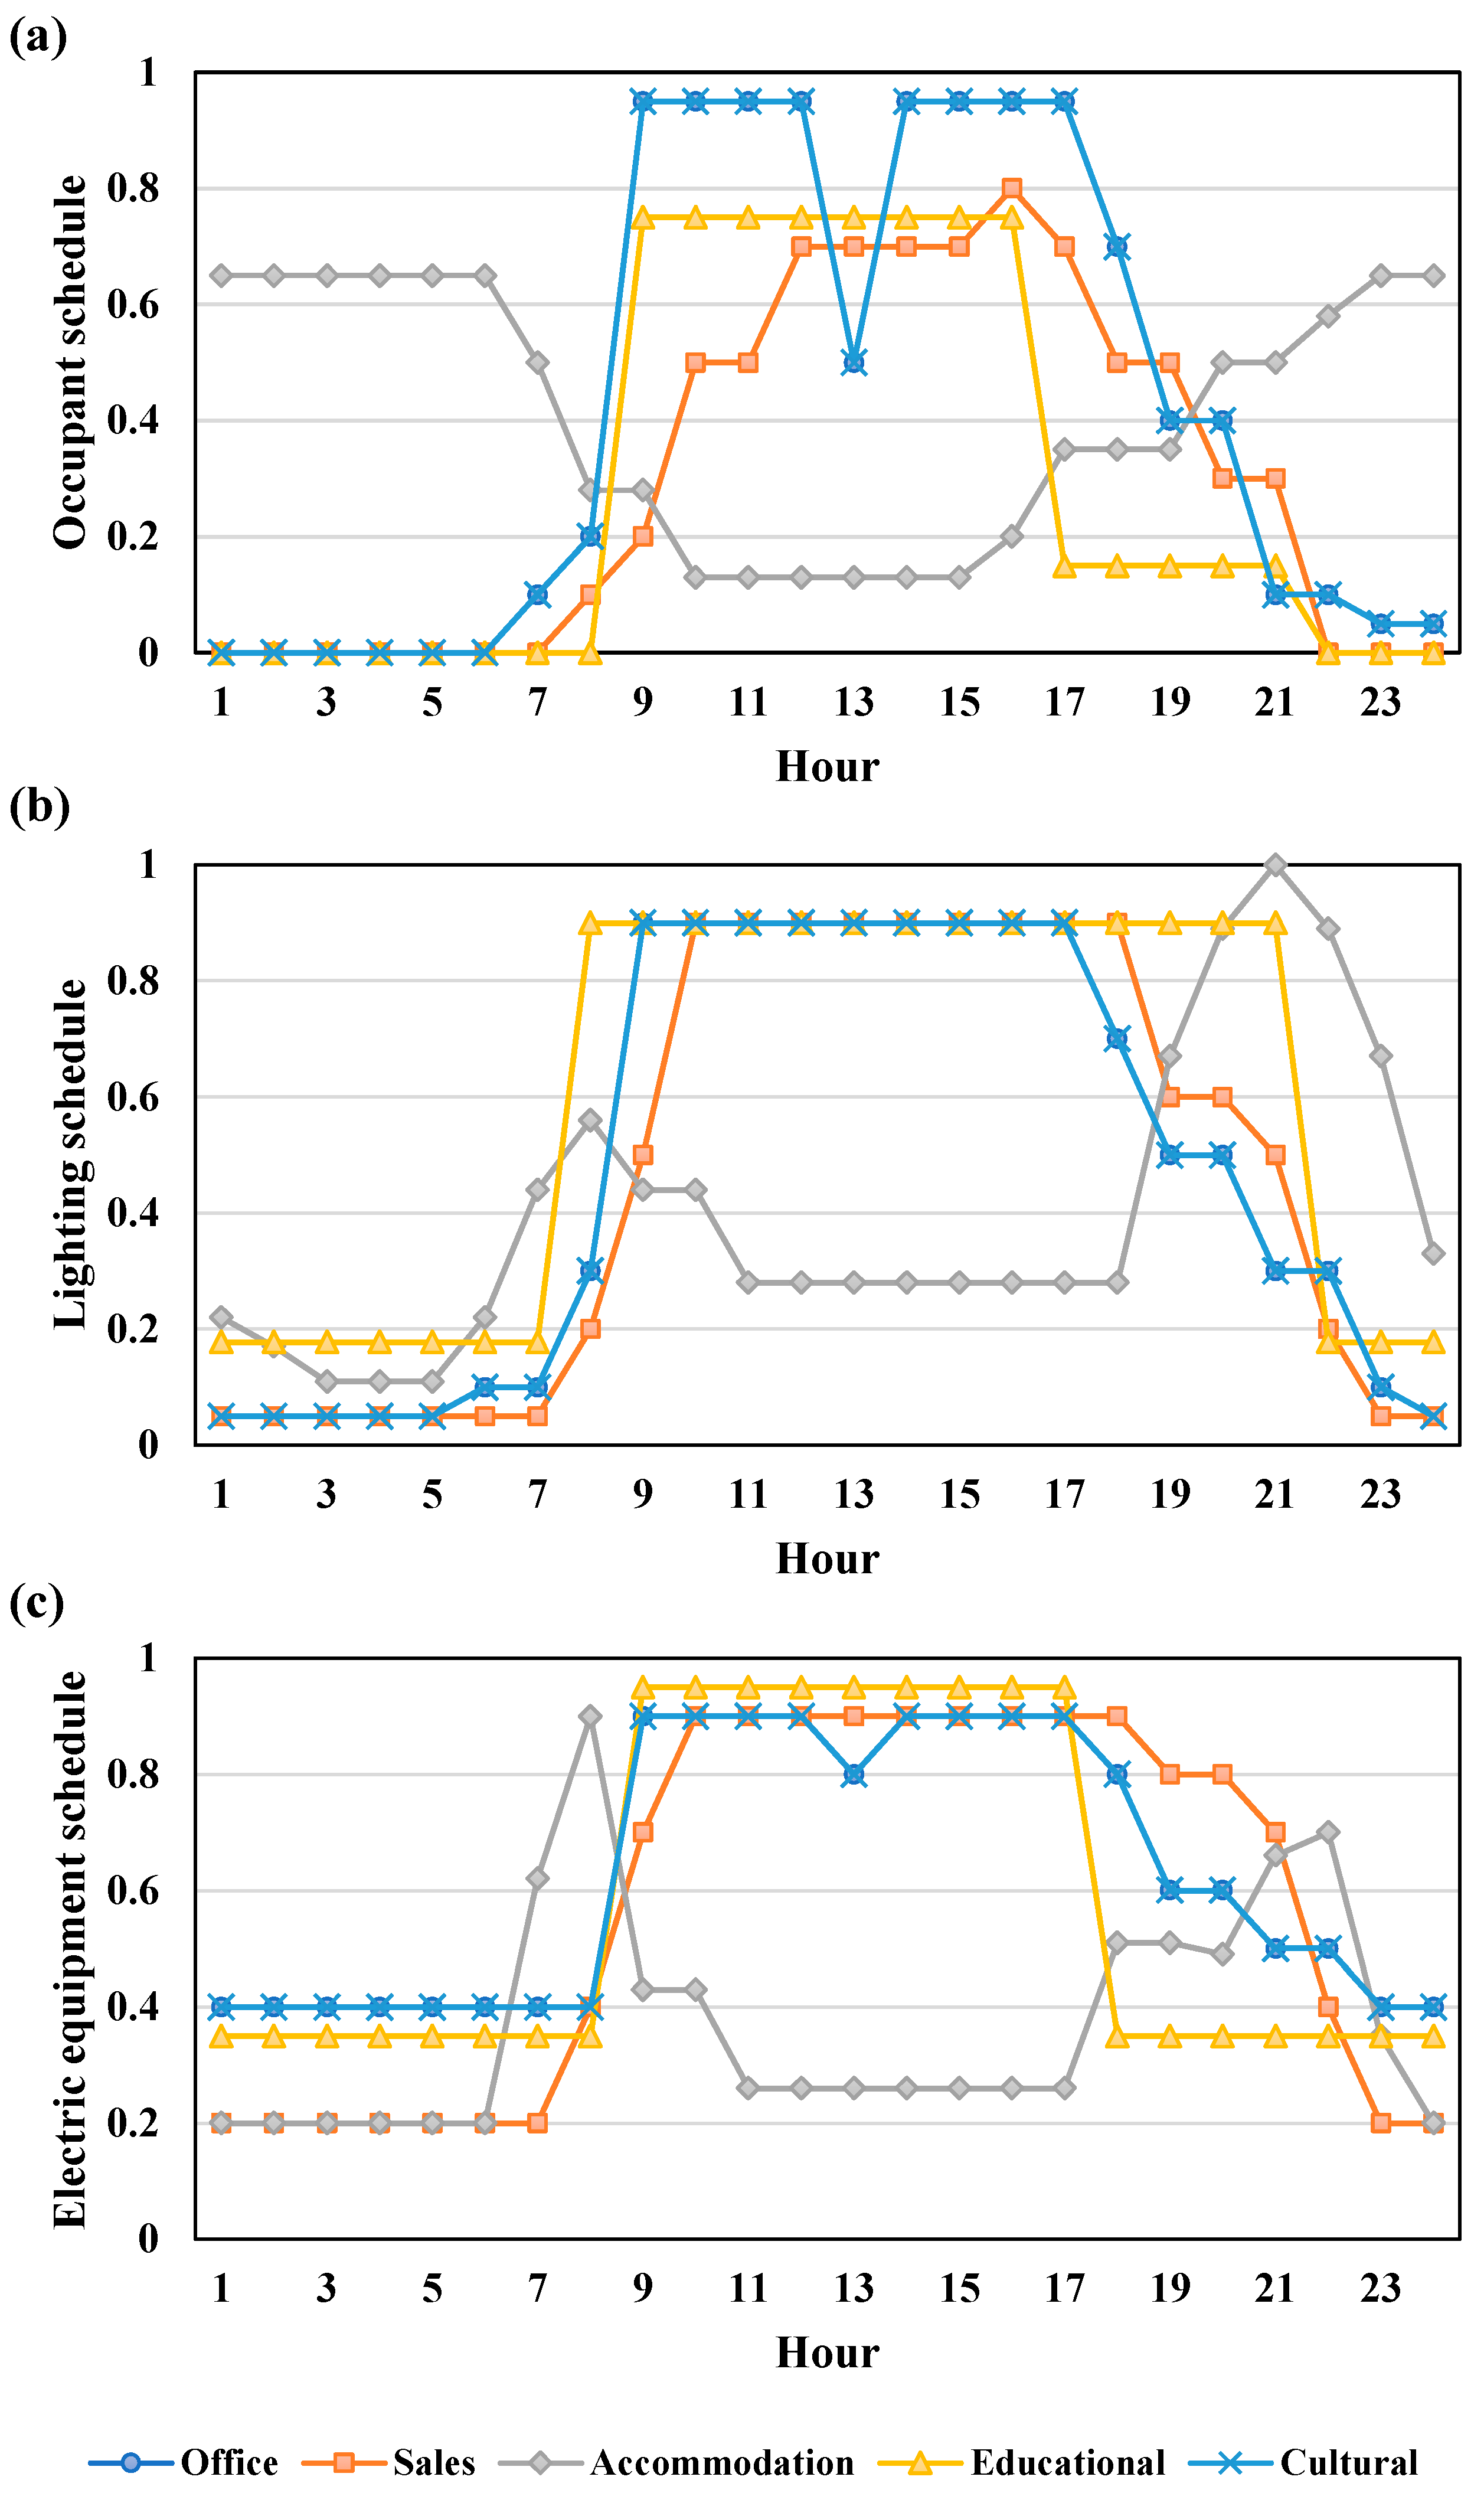
- Operation. The internal loads and schedules used in the dynamic simulation are listed in Table 9. Lighting density was determined by using statistical data from EAIS [52]. South Korean regulations and standards [55,56] and recent reports [57] were used as a reference for infiltration, ventilation, hot water, set-point temperature, and operation schedule. Finally, occupant density, electric equipment density, and schedules used data from the RB of DOE; the data of the building that were most similar in building function and characteristic were used. That is, schedule data for office, sales, accommodation, educational, and cultural buildings correspond to those of large office, retail, large hotel, primary school, and medium office building data in the RB of DOE [8,58]. Figure 4 [8,58] shows the weekday schedules of occupant, lighting, and electric equipment for the five types of buildings, expressed as a ratio between 0 to 1. Here, the educational building schedule refers to weekday schedules while school is in session. In addition, cultural buildings are classified as public buildings in South Korea. Therefore, it was assumed that the schedules of such cultural buildings were identical to those of office buildings for the purpose of comparing the energy performance in Section 4.1.
However, the RB considered in this study is a theoretical reference building developed as per the statistical values (precisely, the average values) of several buildings to analyze macroscopic energy consumption behavior at the national level. As RBs were developed by using recent designs and reports, they still present limitations in terms of the investigation of precise schedules in the operation stage. Specifically, it is necessary to investigate schedules when buildings are in operation and use them as the input data for the simulation, as in the case of Eguaras-Martínez et al. [60]. In our study, however, it is inevitable to input representative values for the use of a building, rather than the schedules for a specific building. As mentioned earlier, the RBs in this study were developed by using recent designs and reports, which are not currently being practically applied in operation yet. This is because this methodology facilitates examination of policies and measures to reduce national greenhouse gas emissions in the period following the post-2020 era.
3.2. Energy Performance of Reference Buildings
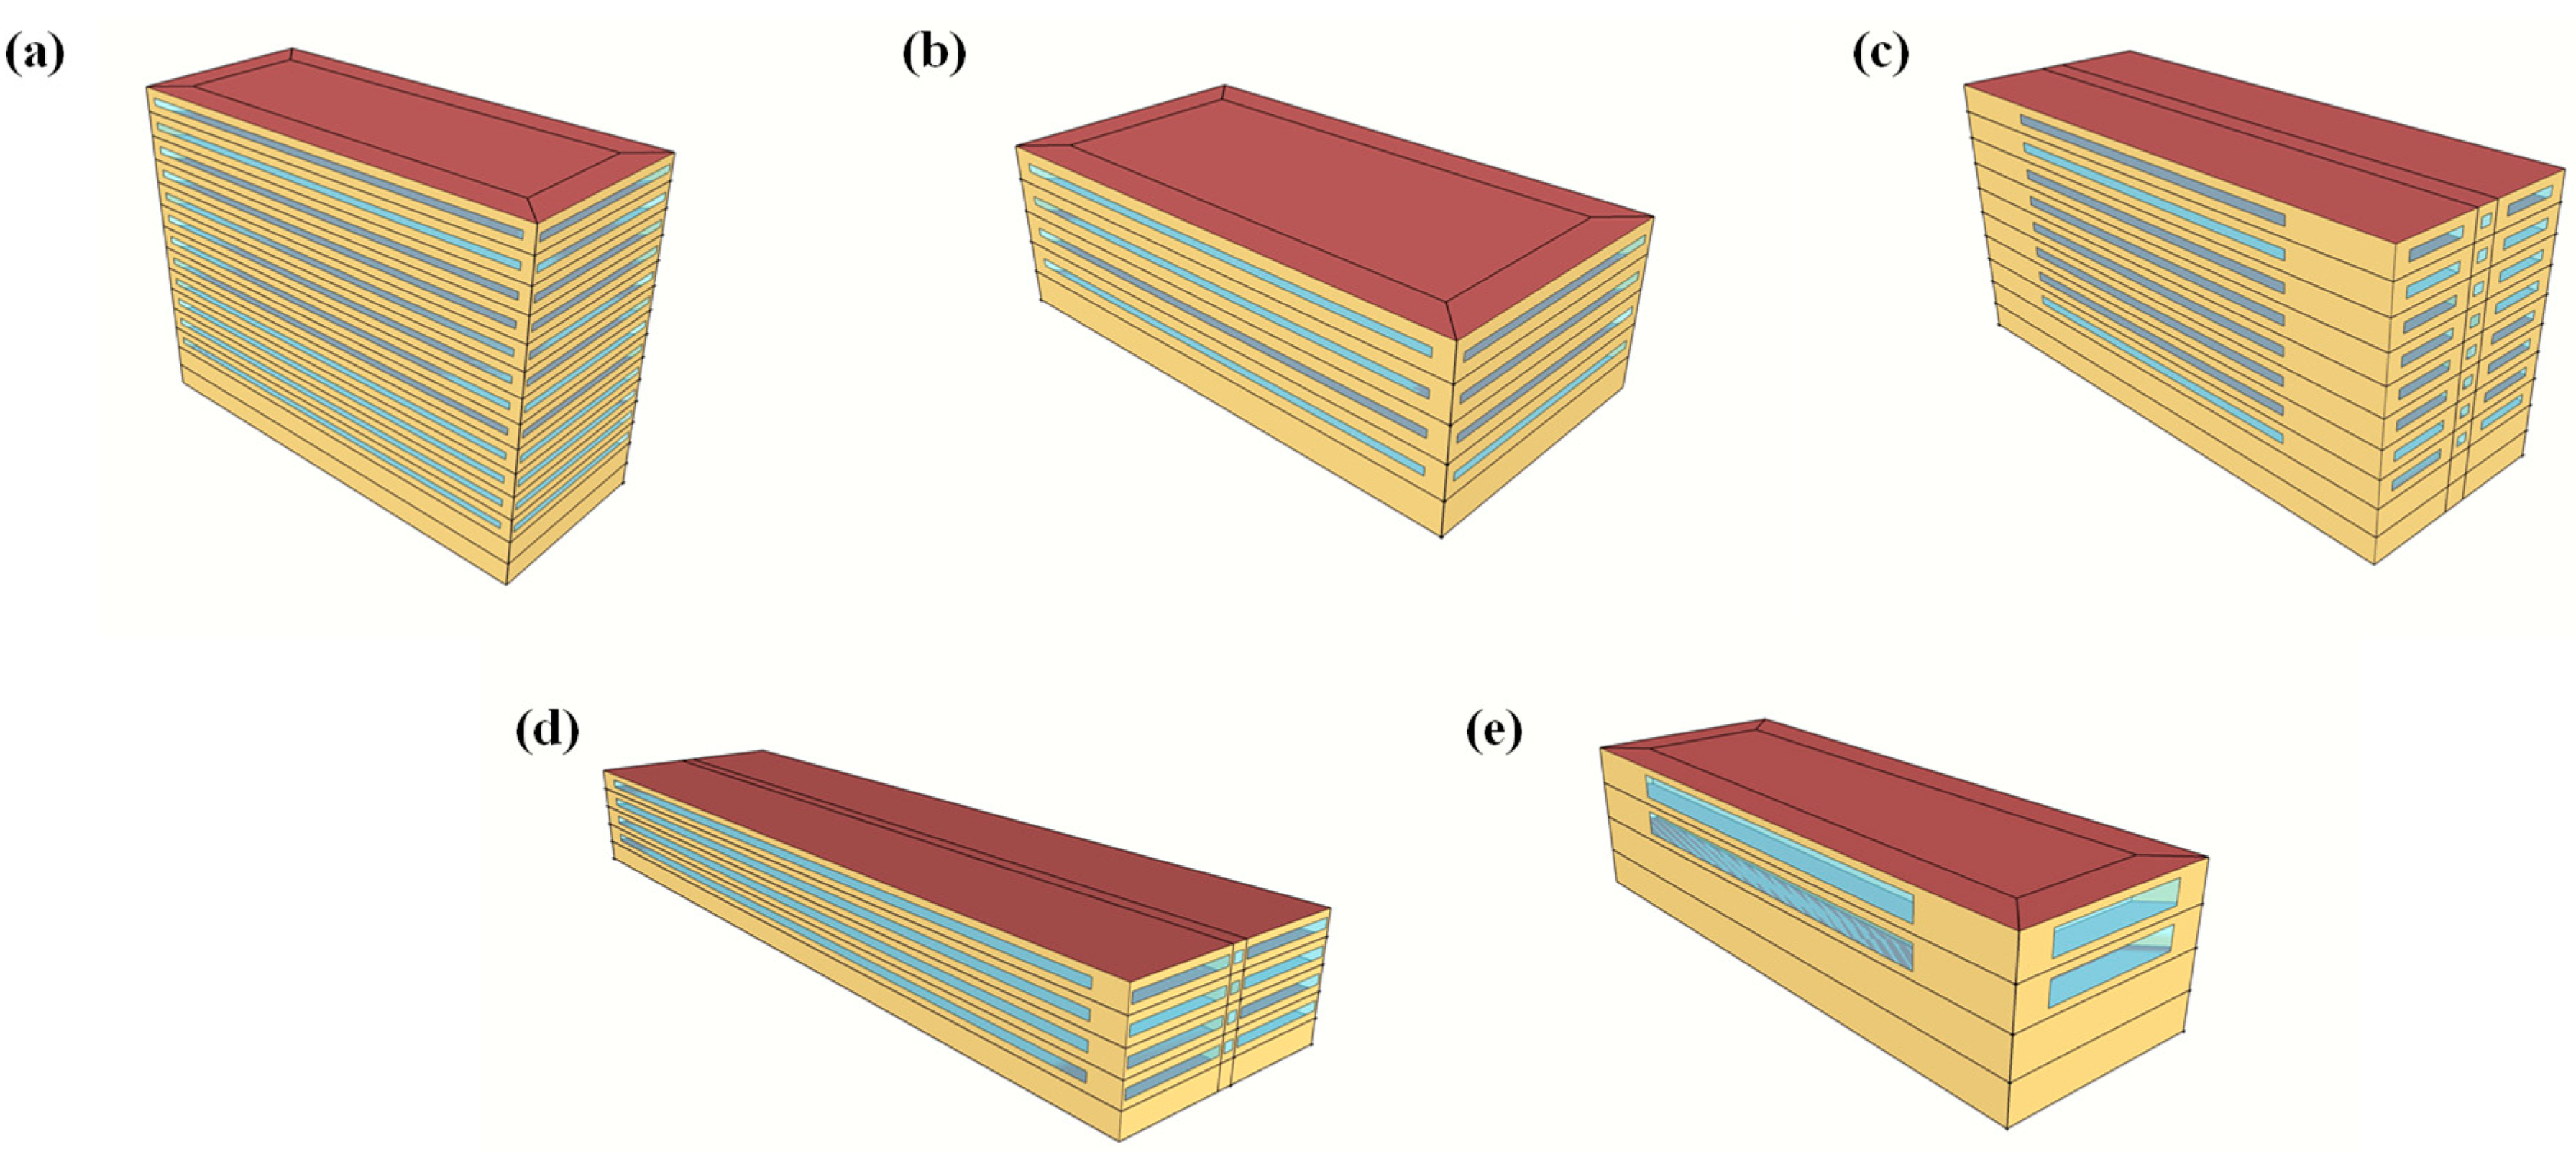
RB modeling based on the key characteristics (defined above) is shown in Figure 5. Basic information of form, envelope, system, and operation was input through OpenStudio [46], and a detailed system was completed by autosizing function of EnergyPlus [32].
Running a building energy simulation requires weather data for the region, along with energy modeling. As most buildings were in the central region of South Korea, this study used the weather data of its main city, Seoul. The Asia–South Korea–Seoul region data were downloaded from OneBuilding [61]—with the data files on the weather for the whole world—and they were input into the simulation. Table 10 lists the results indicating the energy performance by end-use (i.e., cooling, heating, hot water, lighting, ventilation, and electric equipment). In these data, electric equipment refers to indoor office equipment and excludes elevators and external lighting. These results show the total annual energy divided by the sum of the conditioned zone for each end-use, as illustrated by Equation (1).
where, is the annual energy performance by area (kWh/m2.a),
is the annual energy performance (kWh),
is the area of conditioned zone (m2), and
is the end-use (i.e., cooling, heating, hot water, lighting, ventilation, and electric equipment) of the building.
4. Discussion
4.1. Review of Energy Performance
The South Korean government triennially publishes the results of energy consumption surveys (ECS) [62]. The ECS is supervised by the Ministry of Trade, Industry and Energy, and it surveys the energy consumption status in general fields in South Korea such as in industries (agriculture, forestry, fishery, and construction), commercial and public buildings, large buildings, residences, and in transportation facilities. The report published through this process is considered as statistics approved by the government under Article 8 of the Statistics Act (approval number: 115005). The latest ECS (published in 2018) was conducted in 2017 by extracting 40,000 samples based on the energy consumption for a year from January 1 to December 31, 2016. This survey aims to provide baseline data required for setting the national energy policy by understanding the energy consumption status of the fields in South Korea [62].
The RBs developed in this study were used to examine the validity of the flexible modeling approach proposed in this study by comparing data with the latest ECS, as shown in Figure 6. The energy consumption survey in Figure 6 indicates that the electric energy consumption per area, i.e., total electric energy consumption divided by total floor area (i.e., conditioned and unconditioned zones) from ECS [62]. The RB_conditioned zone represents the energy consumption per area as listed in Table 10, i.e., total energy of the developed RB divided by the conditioned zone area. In addition, the RB_floor_area represents the energy per area, i.e., the total energy of the developed RB divided by the total floor area (i.e., conditioned and unconditioned zones). This value has been re-calculated by retaining the energy performance of the denominator and replacing the conditioned zone of the numerator with the total floor area, during the calculation of the values shown in Table 10. The Rate_conditioned zone and Rate_floor indicate the energy consumption ratio of the RB_conditioned_zone and the RB_floor_area, respectively, based on the ECS. For example, if the value of rate is −30%, it means the RB energy consumption is 30% lower than the ECS.
In Figure 6, the office building of the ECS [62] data indicates the average of the energy consumption of general office buildings and research centers because offices from the RB developed in the study were surveyed by classifying general office buildings and research centers as office. Furthermore, accommodation buildings in the ECS [62] show high energy consumptions in heating and hot water. Among the RBs developed in the study, the HVAC system type of accommodations is individual (EHP); thus, it is expected to show significant differences from the ECS [62]. Therefore, the comparison between the ECS [62] and developed RBs was performed excluding the energy consumption of the heat and hot water from the ECS [62], and the energy consumption of hot water from the developed RBs. Finally, the cultural building was included in the public building of the ECS [62]. Therefore, the public building of the ECS [62] was compared with the cultural building of the RBs developed in the study.
The developed RBs (conditioned zone) have −17.3%, −18.5%, −6.8%, −24.4%, and 4.8% of office, sales, accommodation, educational, and cultural buildings, respectively, which indicates low energy consumption, besides the cultural buildings, when compared with the ECS [62]. However, when the RBs were recalculated, using the total floor area in the same manner as the ECS [62] calculation, the result was −32.1%, −34.3%, −24.1%, −32.5%, and −34.5%, respectively (see Figure 6).
As listed in Table 11, the preceding research shows high energy reduction by only retrofitting the building envelope. In particular, old buildings (aged 30 years or more) had greater energy reductions [63,64]. Meanwhile, buildings designed between 2015 and 2017 showed an energy reduction of 13% by changing only the envelope design (i.e., insulation reinforcement) compared with the buildings designed between 2007 and 2011 [65]. The RBs developed in the study were analyzed based on the buildings designed between 2015 and 2017, and ECS [62] was performed based on all buildings from old buildings constructed before 1970 to those built recently (2016). Therefore, it can be estimated that RBs have low-energy consumptions from minimum 10% to maximum 60% compared to the ECS [62]. In other words, considering that (1) the developed RBs were analyzed based on only recently constructed buildings, (2) the general power (i.e., elevators and external lighting, etc.) was excluded, (3) and approximately 31% of energy was reduced by retrofitting the building envelope in South Korea [66], a low energy reduction ratio of 30% in the comparison of the ECS [62] with RB_floor_area is considered reasonable. Therefore, flexible modeling approaches are ideal for closing the gap between architectural data and equipment elements to determine the parameter of the theoretical RB, using dynamic simulation.
4.2. Contributions and Applications
As mentioned in COP21, the world is currently in the post-2020 era. This study investigates buildings designed between 2015 to 2017. Given that 2015 is the base year for calculating post-2020 BAU [65], this study can be used as the base data for studies aimed at predictions for GHG emissions, thereby contributing to studies related to energy saving and GHG emission mitigation references. It is possible to enable continuous planning and follow-up studies of GHG emissions reductions [27,72,73]. The findings in this study can be applied for developing approaches to achieve GHG mitigation goals and for establishing the policy basis for GHG mitigation technology according to post-2020 goals.
In addition, the Korean government constructed a roadmap to provide the energy demand of new buildings down to zero, thereby outlining a step-by-step process until 2025 [50,51]. This study helps predict the point on the roadmap we are at, and it provides the direction of policies necessary in the future.
Furthermore, the possible application and expected effect of the results of this study are as follows:
- Objectifying and setting a standard value for researchers and engineers;
- Goal-setting for energy performance improvement and management for non-residential buildings;
- Analyzing technological impacts and economy for energy performance enhancement;
- Assessing the economy and business potential for energy management technology;
- Predicting and improving the government-supported certification system for green buildings;
- Establishing strengthened green-building policy and determining the scope of incentives.
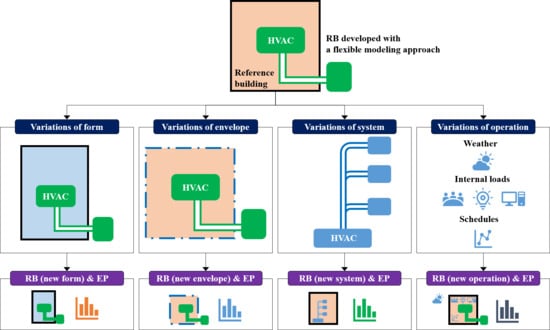
Meanwhile, it is important to note that defining the parameters for HVAC systems as the value of site may cause difficulties in energy performance analysis in revisions and applications of RB [4]. Chaudhary et al. [74] found highly accurate energy performance results through the sensitivity analysis of variables through autotune; however, such methods are adequate only for the calibration for previously existing buildings. The use of a flexible modeling approach as proposed by this study—where an ideal HVAC system can be constructed—allows for energy performance assessment regardless of the circumstances. Thus, rather than defining the parameters to be input into HVAC system, autosizing calculates building loads (i.e., cooling/heating load) that would determine the zone and system sizing. This allows for flexibility even if there are changes to form, envelope, system, and operation as shown in Figure 7. For example, if the form or envelope changes (holding HVAC system parameters) because of changes in the quantity of data, scope of the study, or subject building for study, energy performance can be analyzed easily. Furthermore, even if the HVAC system is identified as a different system, the parameters can be autosized rather than set as fixed for the energy performance analysis. For example, when engineers and architects change (i) the design plan or (ii) the HVAC type from the existing HVAC system to those of a future HVAC system, they do not need to design parameters such as capacities and flow rates. This is because the parameters that correspond to the newly modified HVAC system are generated when the autosizing function is used. This flexibility to cope with the changes in the HVAC system enables conduction of the energy performance analysis. Internal loads and schedules may change because of climate change or design data (holding HVAC system parameters); however, energy performance can be adapted accordingly. When developing RB, data are collected from the building stock, and they are used to define architectural data, after which the parameters of the equipment elements are determined. This approach would be ideal for closing the gap between the architectural data and equipment elements.
5. Conclusions
There has existed a continuous demand for the development of RBs for the purpose of examining and referring to energy-saving effects according to the planned elements and applied technologies of a building during its planning and design stages [75]. The RB is necessary for the analysis of energy performance that will help designers, builders, and owners to create decisions on design alternatives according to the architectural elements of the buildings and applied technologies when planning and designing stage. This study developed RB by using data from South Korean building stock, using a bottom-up approach. The RB developed in this study allows for the performing of an energy-performance analysis by end-use.
This study was developed based on the buildings that are distributed in all regions in the country, making it useful for conducting a country-level assessment of energy performance. However, conducting an analysis of a lower level would require a more specified approach. The architectural plan for each building must be analyzed to generate a representative plan, which would then be divided into zones (i.e., conditioned and unconditioned zones), to construct an energy plan. The decision on how to define conditioned and unconditioned zones can mean significant differences for energy performance. Composing a representative plan for zoning purposes may prove difficult in that it requires an analysis of a large number of cases. Next, subsets of operation (i.e., internal loads and schedules) must be applied through a specified study. Elements of operation are crucial to understanding the energy performance of a building, but the application of details requires backing of much of the study in the field. Just as there is difficulty in constructing a representative plan, field study requires just as much work. Lastly, determining parameters for the HVAC system is challenging, as well. Building loads (i.e., cooling/heating load) must be calculated for the theoretically constructed RB, and the capacities and flow rates of need be designated. However, the capacities and flow rates cannot be adopted directly from the calculations; rather, it should be determined by the equipment of the manufacturer. For example, let us assume that the calculation determined the cooling capacity of 250 refrigeration tonnage (RT). As a next step, the chiller capacity of various manufacturers would need to be assessed, and an adequate product would need to be selected. If the manufacturer is producing a chiller of 200, 300, and 500 RT, the model would inevitably choose the 300 RT chiller. This is a similar process to designing the equipment elements of a building. The cooling in actual buildings has energy performances that reflect the chiller, chosen through the above processes. As such, the theoretically developed RB must then go through a complex and difficult process where the parameters of the HVAC system must be separately designed. This study aimed not to model an actual building, but to assess the energy performance of theoretical RB. Hence, this research took a flexible approach to the parameters of the HVAC system by using the autosizing function of EnergyPlus.
The analysis results, by the end-use, can provide support for country-level GHG mitigation strategy development. Acquiring a large amount of credible regional building-stock would ease the process of regional-level RB development. Furthermore, using the methods in this study would allow for the development of RB for not only the five types of non-residential building from this study, but also multifunctional buildings that provide various services, thereby contributing to the collection of basic data for the country-level policy.
Author Contributions
Conceptualization, Y.K., S.-H.M., Y.-S.J., and J.-H.H.; methodology, Y.-S.J.; software, Y.K. and J.K.; validation, Y.K.; formal analysis, Y.K., J.K., and S.-H.M.; investigation, Y.K. and J.K.; resources, Y.-S.J.; data curation, Y.-S.J.; writing—original draft preparation, Y.K., J.K., and S.-H.M.; writing—review and editing, Y.K., Y.-S.J., and H.-J.H.; visualization, Y.K. and J.K.; supervision, Y.-S.J. and J.-H.H.; project administration, Y.K.; funding acquisition, Y.K. and Y.-S.J. All authors have read and agreed to the published version of the manuscript.
Funding
This work was supported by the National Research Foundation of Korea (NRF) grant, funded by the Korea government (No. NRF-2019R1I1A1A01060283), and the Urban Architecture Research Program, funded by the Ministry of Land, Infrastructure and Transport (No. 17AUDP-C127876-02).
Conflicts of Interest
The authors declare no conflict of interest.
Nomenclature
| Symbols | |
| Annual energy performance by area (kWh/m2.a) | |
| Annual energy performance (kWh) | |
| Area of conditioned zone (m2) | |
| Subscript | |
| End-use (i.e., cooling, heating, hot water, lighting, ventilation, and electric equipment) of building | |
Acronyms and Abbreviations
| ACH | Absorption chiller–heater |
| BAU | Business as usual |
| CAV | Constant air volume |
| C/T | Cooling tower |
| DB | Database |
| DOE | Department of Energy, USA |
| EAIS | Electronic architectural administration information system |
| ECS | Energy consumption survey |
| EP | Energy performance |
| EHP | Electric heat pump |
| FCU | Fan coil unit |
| GHG | Greenhouse gas |
| GIR | Greenhouse gas inventory and research center of Korea |
| HVAC | Heating, ventilation, and air-conditioning |
| IEA | International Energy Agency |
| KEA | Korea energy agency |
| MOLIT | Ministry of land, infrastructure and transport of Korea |
| MOTIE | Ministry of of trade, industry and energy |
| RB | Reference building |
| RT | Refrigeration tonnage |
| U-value | Thermal transmittance (Thermal insulation performance) |
| WWR | Window to wall ratio |
References
- Jeong, Y.-S. Assessment of Alternative Scenarios for CO2 Reduction Potential in the Residential Building Sector. Sustainability 2017, 9, 394. [Google Scholar] [CrossRef] [Green Version]
- Famuyibo, A.A.; Duffy, A.; Strachan, P. Developing archetypes for domestic dwellings—An Irish case study. Energy Build. 2012, 50, 150–157. [Google Scholar] [CrossRef] [Green Version]
- Corgnati, S.P.; Fabrizio, E.; Filippi, M.; Monetti, V. Reference buildings for cost optimal analysis: Method of definition and application. Appl. Energy 2013, 102, 983–993. [Google Scholar] [CrossRef]
- Buso, T.; Corgnati, S.P. A customized modelling approach for multi-functional buildings—Application to an Italian Reference Hotel. Appl. Energy 2017, 190, 1302–1315. [Google Scholar] [CrossRef]
- Dino, I.G.; Stouffs, R. Evaluation of reference modeling for building performance assessment. Autom. Constr. 2014, 40, 44–59. [Google Scholar] [CrossRef]
- Moschetti, R.; Mazzarella, L.; Nord, N. An overall methodology to define reference values for building sustainability parameters. Energy Build. 2015, 88, 413–427. [Google Scholar] [CrossRef] [Green Version]
- Stankevicius, V.; Karbauskaite, J.; Monstvilas, E. The development of reference values for energy certification of buildings in Lithuania. Energy Build. 2007, 39, 284–288. [Google Scholar] [CrossRef]
- Deru, M.; Field, K.; Studer, D.; Benne, K.; Griffith, B.; Torcellini, P.; Liu, B.; Halverson, M.; Winiarski, D.; Rosenberg, M.; et al. U.S. Department of Energy Commercial Reference Building Models of the National Building Stock; NREL Report No. TP-5500-46861; National Renewable Energy Laboratory: Golden, CO, USA, 2011; pp. 1–118.
- TABULA Project Team, Typology Approach for Building Stock Energy Assessment—Main Results of the TABULA Project. 2012, p. 43. Available online: https://ec.europa.eu/energy/intelligent/projects/sites/iee-projects/files/projects/documents/tabula_final_report_en.pdf (accessed on 28 February 2020).
- Spiekman, M. Comparison of Energy Performance Requirements Levels: Possibilities and Impossibilities; ASIEPI Proj: Brussel, Belgium, 2010. [Google Scholar]
- EPISCOPE. Monitor Progress towards Climate Targets in European Housing Stocks Main Results of the EPISCOPE Project—Final Project Report—(Deliverable D1.2); Institut Wohnen und Umwelt: Darmstadt, Germany, 2016; ISBN 9783941140561. [Google Scholar]
- Csoknyai, T.; Hrabovszky-Horváth, S.; Georgiev, Z.; Jovanovic-Popovic, M.; Stankovic, B.; Villatoro, O.; Szendrő, G. Building stock characteristics and energy performance of residential buildings in Eastern-European countries. Energy Build. 2016, 132, 39–52. [Google Scholar] [CrossRef]
- Schaefer, A.; Ghisi, E. Method for obtaining reference buildings. Energy Build. 2016, 128, 660–672. [Google Scholar] [CrossRef]
- Bhatnagar, M.; Mathur, J.; Garg, V. Development of reference building models for India. J. Build. Eng. 2019, 21, 267–277. [Google Scholar] [CrossRef]
- Li, J.; Ng, S.T.; Skitmore, M. Review of low-carbon refurbishment solutions for residential buildings with particular reference to multi-story buildings in Hong Kong. Renew Sustain. Energy Rev. 2017, 73, 393–407. [Google Scholar] [CrossRef] [Green Version]
- Kim, D.W.; Kim, Y.M.; Lee, S.H.; Park, W.Y.; Bok, Y.J.; Ha, S.K.; Lee, S.E. Development of Reference Building Energy Models for South Korea. In Proceedings of the 15th IBPSA Conference, San Francisco, CA, USA, 7–9 August 2017; pp. 2693–2700. [Google Scholar]
- Jung, H.K.; Jeong, Y.S. A Study on the Reference Building base on the Building Design Status in Apartments. In Proceedings of the Architectural Institute of Korea 2017 Autumn Annual Conference, Gyeongsangbuk-do, Korea, 10 October 2017; Volume 37, pp. 226–227. [Google Scholar]
- Nägeli, C.; Jakob, M.; Catenazzi, G.; Ostermeyer, Y. Towards agent-based building stock modeling: Bottom-up modeling of long-term stock dynamics affecting the energy and climate impact of building stocks. Energy Build. 2020, 211. [Google Scholar] [CrossRef]
- Xikai, M.; Lixiong, W.; Jiwei, L.; Xiaoli, Q.; Tongyao, W. Comparison of regression models for estimation of carbon emissions during building’s lifecycle using designing factors: A case study of residential buildings in Tianjin, China. Energy Build. 2019, 204, 109519. [Google Scholar] [CrossRef]
- Mata, É.; Medina, B.G.; Sasic, K.A.; Johnsson, F. Modelling opportunities and costs associated with energy conservation in the Spanish building stock. Energy Build. 2015, 88, 347–360. [Google Scholar] [CrossRef]
- Brandão De Vasconcelos, A.; Pinheiro, M.D.; Manso, A.; Cabaço, A. EPBD cost-optimal methodology: Application to the thermal rehabilitation of the building envelope of a Portuguese residential reference building. Energy Build. 2016, 111, 12–25. [Google Scholar] [CrossRef]
- Krarti, M.; Aldubyan, M.; Williams, E. Residential building stock model for evaluating energy retrofit programs in Saudi Arabia. Energy 2020, 195, 116980. [Google Scholar] [CrossRef]
- Ye, Y.; Hinkelman, K.; Zhang, J.; Zuo, W.; Wang, G. A methodology to create prototypical building energy models for existing buildings: A case study on U.S. religious worship buildings. Energy Build. 2019, 194, 351–365. [Google Scholar] [CrossRef]
- Brandão de Vasconcelos, A.; Cabaço, A.; Pinheiro, M.D.; Manso, A. The impact of building orientation and discount rates on a Portuguese reference building refurbishment decision. Energy Policy 2016, 91, 329–340. [Google Scholar] [CrossRef]
- Brandão de Vasconcelos, A.; Pinheiro, M.D.; Manso, A.; Cabaço, A. A Portuguese approach to define reference buildings for cost-optimal methodologies. Appl. Energy 2015, 140, 316–328. [Google Scholar] [CrossRef]
- European Commission Guidelines accompanying Commission Delegated Regulation (EU) No 244/2012 of 16 January 2012 supplementing Directive 2010/31/EU of the European Parliament and of the Council. Off. J. Eur. Union 2012, 55, 1–28. [CrossRef]
- Pieri, S.P.; Tzouvadakis, I.; Santamouris, M. Identifying energy consumption patterns in the Attica hotel sector using cluster analysis techniques with the aim of reducing hotels’ CO2 footprint. Energy Build. 2015, 94, 252–262. [Google Scholar] [CrossRef]
- Gao, X.; Malkawi, A. A new methodology for building energy performance benchmarking: An approach based on intelligent clustering algorithm. Energy Build. 2014, 84, 607–616. [Google Scholar] [CrossRef]
- Santamouris, M.; Mihalakakou, G.; Patargias, P.; Gaitani, N.; Sfakianaki, K.; Papaglastra, M.; Pavlou, C.; Doukas, P.; Primikiri, E.; Geros, V.; et al. Using intelligent clustering techniques to classify the energy performance of school buildings. Energy Build. 2007, 39, 45–51. [Google Scholar] [CrossRef]
- Farrou, I.; Kolotroni, M.; Santamouris, M. A method for energy classification of hotels: A case-study of Greece. Energy Build. 2012, 55, 553–562. [Google Scholar] [CrossRef]
- Filogamo, L.; Peri, G.; Rizzo, G.; Giaccone, A. On the classification of large residential building stocks by sample typologies for energy planning purposes. Appl. Energy 2014, 135, 825–835. [Google Scholar] [CrossRef]
- EnergyPlus. Available online: https://energyplus.net/ (accessed on 28 February 2020).
- The European Parliament and the Council of the European Union. Directive 2010/31/EU of the European parliament and of council of 19 May 2010 on the energy performance of buildings (recast). Off. J. Eur. Union 2010, 18, 2010. [Google Scholar]
- Seo, D.; Noh, B.; Ihm, B. A Research on Prototypical Apartment House Definition for Detailed Building Energy Simulation. J. Reg. Assoc. Archit. Inst. Korea 2014, 16, 285–296. [Google Scholar]
- Korean Government. Amendment of 2030 National GHG Emissions Reduction Roadmap; Korean Government: Sejong, Korea, 2018.
- Crawley, D.B.; Lawrie, L.K.; Winkelmann, F.C.; Buhl, W.F.; Huang, Y.J.; Pedersen, C.O.; Strand, R.K.; Liesen, R.J.; Fisher, D.E.; Witte, M.J.; et al. EnergyPlus: Creating a new-generation building energy simulation program. Energy Build. 2001, 33, 319–331. [Google Scholar] [CrossRef]
- U.S. Department of Energy. EnergyPlus Version 8.9 Documentation, Engineering Reference; U.S. Department of Energy: Washington, DC, USA, 2018.
- Picco, M.; Lollini, R.; Marengo, M. Towards energy performance evaluation in early stage building design: A simplification methodology for commercial building models. Energy Build. 2014, 76, 497–505. [Google Scholar] [CrossRef]
- Hygh, J.S.; DeCarolis, J.F.; Hill, D.B.; Ranji Ranjithan, S. Multivariate regression as an energy assessment tool in early building design. Build. Environ. 2012, 57, 165–175. [Google Scholar] [CrossRef]
- Kamal, R.; Moloney, F.; Wickramaratne, C.; Narasimhan, A.; Goswami, D.Y. Strategic control and cost optimization of thermal energy storage in buildings using EnergyPlus. Appl. Energy 2019, 246, 77–90. [Google Scholar] [CrossRef]
- Cetin, K.S.; Fathollahzadeh, M.H.; Kunwar, N.; Do, H.; Tabares-Velasco, P.C. Development and validation of an HVAC on/off controller in EnergyPlus for energy simulation of residential and small commercial buildings. Energy Build. 2019, 183, 467–483. [Google Scholar] [CrossRef]
- Dahanayake, K.W.D.K.C.; Chow, C.L. Studying the potential of energy saving through vertical greenery systems: Using EnergyPlus simulation program. Energy Build. 2017, 138, 47–59. [Google Scholar] [CrossRef]
- Wang, M.; Peng, J.; Li, N.; Lu, L.; Ma, T.; Yang, H. Assessment of energy performance of semi-transparent PV insulating glass units using a validated simulation model. Energy 2016, 112, 538–548. [Google Scholar] [CrossRef]
- Zhang, R.; Hong, T. Modeling of HVAC operational faults in building performance simulation. Appl. Energy 2017, 202, 178–188. [Google Scholar] [CrossRef]
- Mun, S.H.; Kwak, Y.; Huh, J.H. A case-centered behavior analysis and operation prediction of AC use in residential buildings. Energy Build. 2019, 188–189, 137–148. [Google Scholar] [CrossRef]
- OpenStudio. Available online: https://www.openstudio.net/ (accessed on 28 February 2020).
- Sketchup. Available online: https://www.sketchup.com/ (accessed on 28 February 2020).
- Ministry of Land, Infrastructure and Transport (MOLIT). Green Buildings Construction Support Act; Korean Government: Sejong, Korea, 2019.
- Ministry of Land, Infrastructure and Transport (MOLIT). The Building Energy Saving Design Standards; Korean Government: Sejong, Korea, 2017.
- International Energy Agency (IEA). Energy Policies of IEA Countries: Republic of Korea 2012 Review; International Energy Agency: Paris, France, 2012. [Google Scholar]
- Ministry of Land, Infrastructure and Transport (MOLIT). Zero-Energy Building, Beyond Architecture, into the City! START Now; Korean Government: Sejong, Korea, 2019.
- Electronic Architectural Administration Information System (EAIS). Available online: https://www.eais.go.kr/ (accessed on 28 February 2020).
- U.S. Department of Energy. EnergyPlus Version 8.9 Documentation, Input Output Reference; U.S. Department of Energy: Washington, DC, USA, 2018.
- Ministry of Land, Infrastructure and Transport (MOLIT). Building Act; Korean Government: Sejong, Korea, 2019.
- Ministry of Land, Infrastructure and Transport (MOLIT). Rules on the Building Equipment Standards, etc.; Korean Government: Sejong, Korea, 2017.
- Korea Energy Agency (KEA). Building Energy Efficiency Rating Certification Scheme Operation Rules; Korea Energy Agency: Ulsan, Korea, 2016.
- Greenhouse Gas Inventory and Research Center (GIR). Establishment of Standard Model DB for GHG Reduction Potential Model Analysis in Buildings (I); Greenhouse Gas Inventory and Research Center: Seoul, Korea, 2016. [Google Scholar]
- DOE, Commercial Reference Building. Available online: http://www.energy.gov/eere/buildings/commercial-reference-buildings/ (accessed on 28 February 2020).
- Ramos Ruiz, G.; Fernández Bandera, C. Analysis of uncertainty indices used for building envelope calibration. Appl. Energy 2017, 185, 82–94. [Google Scholar] [CrossRef]
- Eguaras-Martínez, M.; Vidaurre-Arbizu, M.; Martín-Gómez, C. Simulation and evaluation of building information modeling in a real pilot site. Appl. Energy 2014, 114, 475–484. [Google Scholar] [CrossRef] [Green Version]
- OneBuilding. Available online: http://climate.onebuilding.org/WMO_Region_2_Asia/KOR_South_Korea/index.html/ (accessed on 28 February 2020).
- Ministry of Trade, Industry and Energy (MOTIE). 2017 Energy Consumption Survey; Korean Government: Sejong, Korea, 2018.
- Krawczyk, D.A. Theoretical and real effect of the school’s thermal modernization—A case study. Energy Build. 2014, 81, 30–37. [Google Scholar] [CrossRef]
- Ali, H.; Hashlamun, R. Envelope retrofitting strategies for public school buildings in Jordan. J. Build. Eng. 2019, 25, 100819. [Google Scholar] [CrossRef]
- Kwak, Y.; Kang, J.A.; Huh, J.H.; Kim, T.H.; Jeong, Y.S. An analysis of the effectiveness of greenhouse gas reduction policy for office building design in South Korea. Sustainability 2019, 11, 7172. [Google Scholar] [CrossRef] [Green Version]
- Lee, J.; McCuskey Shepley, M.; Choi, J. Exploring the effects of a building retrofit to improve energy performance and sustainability: A case study of Korean public buildings. J. Build. Eng. 2019, 25. [Google Scholar] [CrossRef]
- Dascalaki, E.; Santamouris, M. On the potential of retrofitting scenarios for offices. Build. Environ. 2002, 37, 557–567. [Google Scholar] [CrossRef]
- Song, X.; Ye, C.; Li, H.; Wang, X.; Ma, W. Field study on energy economic assessment of office buildings envelope retrofitting in southern China. Sustain. Cities Soc. 2017, 28, 154–161. [Google Scholar] [CrossRef]
- Dimoudi, A.; Kostarela, P. Energy monitoring and conservation potential in school buildings in the C′ climatic zone of Greece. Renew. Energy 2009, 34, 289–296. [Google Scholar] [CrossRef]
- Liu, Q.; Ren, J. Research on the Building Energy Efficiency Design Strategy of Chinese Universities Based on Green Performance Analysis. Energy Build. 2020, 224, 110242. [Google Scholar] [CrossRef]
- Chung, M.H.; Rhee, E.K. Potential opportunities for energy conservation in existing buildings on university campus: A field survey in Korea. Energy Build. 2014, 78, 176–182. [Google Scholar] [CrossRef]
- Nagpal, S.; Hanson, J.; Reinhart, C. A framework for using calibrated campus-wide building energy models for continuous planning and greenhouse gas emissions reduction tracking. Appl. Energy 2019, 241, 82–97. [Google Scholar] [CrossRef]
- Shorrock, L.D.; Dunster, J.E. The physically-based model BREHOMES and its use in deriving scenarios for the energy use and carbon dioxide emissions of the UK housing stock. Energy Policy 1997, 25, 1027–1037. [Google Scholar] [CrossRef]
- Chaudhary, G.; New, J.; Sanyal, J.; Im, P.; O’Neill, Z.; Garg, V. Evaluation of “Autotune” calibration against manual calibration of building energy models. Appl. Energy 2016, 182, 115–134. [Google Scholar] [CrossRef] [Green Version]
- Jeong, Y.S.; Jung, H.K.; Jang, H.K.; Yu, K.H. A Study on the Reference Building based on the Building Design Trends for Non-residential Buildings. J. Korean Sol. Energy Soc. 2014, 34, 1–11. [Google Scholar] [CrossRef]
Figure 1.
Approach and scope of this study (RB, reference building; EP, energy performance).

Figure 2.
Flexible modeling approach for development of RB. HVAC = heating, ventilation, and air-conditioning.
Figure 2.
Flexible modeling approach for development of RB. HVAC = heating, ventilation, and air-conditioning.

Figure 3.
Sampling buildings of building stock for the development of reference buildings. (a) Number of buildings by year. (b) Rates by region.
Figure 3.
Sampling buildings of building stock for the development of reference buildings. (a) Number of buildings by year. (b) Rates by region.


Figure 5.
Modeling of the developed RBs: (a) office, (b) sales, (c) accommodation, (d) educational, and (e) cultural.
Figure 5.
Modeling of the developed RBs: (a) office, (b) sales, (c) accommodation, (d) educational, and (e) cultural.

Figure 6.
Comparison of energy consumption per area. (ECS (Energy consumption survey) [62]: general electric energy/total floor area, i.e., conditioned and unconditioned zones; RB_conditioned zone: total energy/total conditioned zone area; and RB_floor area: total energy/total floor area, i.e., conditioned and unconditioned zones.).

Figure 7.
Flexibility of HVAC system by the change in RB. As HVAC system is not set as parameters, it is possible to analyze the energy performance of RB, despite the changes in form, envelope, system, and operation.
Figure 7.
Flexibility of HVAC system by the change in RB. As HVAC system is not set as parameters, it is possible to analyze the energy performance of RB, despite the changes in form, envelope, system, and operation.


Table 1.
Research goals and building types of reference building.
| Research Goals | Research | Building Types | Countries |
|---|---|---|---|
| Energy analysis and efficiency evaluation | Deru et al. [8] | 1 residential building; 15 non-residential buildings | US |
| TABULA Project Team [9] Spiekman [10] EPISCOPE [11] | Residential building | Europe | |
| Csoknyai et al. [12] | Residential building | Eastern-European countries (Bulgaria, Serbia, Hungary, and Czech Republic) | |
| Schaefer and Ghisi [13] | Residential building | Brazil | |
| Bhatnagar et al. [14] | Non-residential building (office) | India | |
| Li et al. [15] | Residential building | Hong Kong | |
| Promoting national policy and technological development, GHG emission mitigation | Kim et al. [16] | 2 residential buildings; 8 non-residential buildings | South Korea |
| Jung and Jeong [17] | Apartment (Multifamily dwelling) | South Korea | |
| Quantitative assessment of energy demand and GHG emissions | Nägeli et al. [18] | Residential building | Switzerland |
| Estimate carbon emissions | Xikai et al. [19] | Residential building | China |
| Assessment the potential of energy conservation measures and GHG emissions | Mata et al. [20] | 6 building types (single-family dwellings, multifamily dwellings, commercial, culture and leisure, offices, and other services), | Spain |
| Building envelope optimization | Brandão et al. [21] | Residential building | Portugal |
| Evaluating energy retrofit | Krarti et al. [22] | Residential building | Saudi Arabia |
| Building energy saving potentials | Ye et al. [23] | Non-residential building (religious worship building) | US |
| Support to policies | Buso and Corgnati [4] | Non-residential building (hotel) | Italy |
| Brandão et al. [24] | Residential building | Portugal | |
| Cost optimal analysis | Corgnati et al. [3] | Non-residential building (office) | Italy |
| Brandão et al. [25] | Residential building | Portugal |
GHG = greenhouse gas.
Table 2.
U-values of non-residential buildings, according to the climate conditions of South Korea (2015–2017).
Table 2.
U-values of non-residential buildings, according to the climate conditions of South Korea (2015–2017).
| Enforcement Date | Region | Thermal Insulation of Building Envelope (W/m2·K) | |||
|---|---|---|---|---|---|
| Exterior Wall | Roof | Lowest Floor | Window | ||
| Oct. 2013 | Central | 0.270 | 0.180 | 0.410 | 2.100 |
| Southern | 0.340 | 0.220 | 0.470 | 2.400 | |
| Jeju | 0.440 | 0.280 | 0.550 | 3.000 | |
| Jan. 2016 | Central | 0.260 | 0.150 | 0.300 | 1.500 |
| Southern | 0.320 | 0.180 | 0.350 | 1.800 | |
| Jeju | 0.430 | 0.250 | 0.470 | 2.400 | |
Table 3.
Autosizing parameters for the development of RBs.
| Component | Autosizing Parameters |
|---|---|
| Design capacity | Cooling capacity |
| Heating capacity | |
| Design water flow rate | Chilled water |
| Condenser water | |
| Hot water | |
| Design air flow rate | Supply air |
| Cooling tower |
Table 4.
Main characteristics of form for the development of RBs.
| Elements | Office | Sales | Accommodation | Educational | Cultural | |
|---|---|---|---|---|---|---|
| Total floor area (m2) | 30,842 | 13,060 | 13,440 | 24,185 | 9120 | |
| Number of floors | Ground | 12 | 4 | 8 | 4 | 2 |
| Basement | 2 | 1 | 2 | 1 | 2 | |
| Floor height (m) | 3.9 | 4.6 | 3.3 | 3.6 | 5.0 | |
| Aspect ratio (building length/building width) | 2.43:1 | 1.96:1 | 2.67:1 | 3.85:1 | 2.90:1 | |
Table 5.
Main characteristics of envelope (window) for the development of RBs.
| Elements | Office | Sales | Accommodation | Educational | Cultural |
|---|---|---|---|---|---|
| Window-to-wall ratio (%) | 26.83 | 17.72 | 19.97 | 28.82 | 20.05 |
| Window filling gas | Argon | Argon | Argon | Argon | Argon |
Table 6.
Main characteristics of envelope (U-value) for the development of RBs.
| Elements | Office | Sales | Accommodation | Educational | Cultural |
|---|---|---|---|---|---|
| (W/m2·K) | |||||
| Exterior walls | 0.240 | 0.259 | 0.331 | 0.262 | 0.274 |
| Roof | 0.138 | 0.147 | 0.170 | 0.175 | 0.144 |
| Lowest floor | 0.193 | 0.204 | 0.259 | 0.323 | 0.200 |
| Windows | 1.403 | 1.752 | 1.612 | 1.825 | 1.333 |
Table 7.
Main elements of HVAC system type and plant equipment for the development of RBs (CAV, constant air volume; FCU, fan coil unit; EHP, electric heat pump; ACH, absorption chiller–heater; CT, cooling tower).
Table 7.
Main elements of HVAC system type and plant equipment for the development of RBs (CAV, constant air volume; FCU, fan coil unit; EHP, electric heat pump; ACH, absorption chiller–heater; CT, cooling tower).
| Elements | Office | Sales | Accommodation | Educational | Cultural |
|---|---|---|---|---|---|
| HVAC system type | Central | Individual | Individual | Individual | Individual |
| (CAV+FCU) | (EHP) | (EHP) | (EHP) | (EHP) | |
| Plant equipment | ACH+CT | - | - | - | - |
Table 8.
Main values of autosizing parameters of HVAC system for the development of RBs.
| Component | Parameters of HVAC System | Office | Sales | Accommodation | Educational | Cultural |
|---|---|---|---|---|---|---|
| Design Capacity | Cooling capacity (kW) 1 | 3157 | 926 | 869 | 1142 | 839 |
| Heating capacity (kW) 1 | 906 | 609 | 3320 | 322 | ||
| Design Water Flow Rate | Chilled water (m3/s) | 0.149 | - | - | - | - |
| Condenser water (m3/s) | 0.296 | - | - | - | - | |
| Hot water (m3/s) | 0.026 | - | - | - | - | |
| Design Air Flow Rate | Supply air (m3/s) 1 | 148.67 | 51.78 | 52.52 | 45.98 | 53.83 |
| Cooling tower (m3/s) | 172.73 | - | - | - | - |
1 Sum of all conditioned zones.
| Component | Elements | Office | Sales | Accommodation | Educational | Cultural |
|---|---|---|---|---|---|---|
| Internal loads | Occupants (m2/person) | 18.58 | 6.19 | 26.01 | 4.00 | 18.58 |
| Lighting (W/m2) | 7.13 | 8.95 | 5.68 | 6.91 | 6.27 | |
| Electric equipment (W/m2) | 10.76 | 3.23 | 14.30 | 4.00 | 10.76 | |
| Others | Infiltration (Air change per hour) | 0.90 | 0.80 | 0.90 | 0.80 | 0.90 |
| Ventilation (m3/person.h) | 29.0 | 29.0 | 29.0 | 36.0 | 29.0 | |
| Hot water (Wh/m2d) | 30.0 | 30.0 | 30.0 | 30 | 30.0 | |
| Set-point temperatures | Cooling (°C) | 26.0 | 26.0 | 26.0 | 26.0 | 26.0 |
| Heating (°C) | 20.0 | 20.0 | 20.0 | 20.0 | 20.0 | |
| Operation schedules | Cooling (day/mon.) | 1st January–31st December | 1st January–31st December. | 1st January–31st December | 1st January–31st December 1 | 1st January–31st December |
| Heating (day/mon.) | 1st January–31st December | 1st January–31st December | 1st January–31st December | 1st January–31st December 1 | 1st January–31st December |
1 Excluding summer and winter vacation periods of educational buildings.
Table 10.
Energy performance by end-use of the developed RBs.
| End-Use | Energy Performance (kWh/m2.a) | ||||
|---|---|---|---|---|---|
| Office | Sales | Accommodation | Educational | Cultural | |
| Cooling | 47.5 | 15.9 | 13.0 | 6.9 | 13.7 |
| Heating | 45.8 | 38.0 | 54.5 | 12.6 | 39.5 |
| Hot water | 15.7 | 10.7 | 43.9 | 2.9 | 16.9 |
| Lighting | 22.9 | 32.9 | 20.3 | 25.7 | 20.5 |
| Ventilation | 13.9 | 12.7 | 19.1 | 3.3 | 12.5 |
| Electric equipment 1 | 43.7 | 11.9 | 36.5 | 12.9 | 25.5 |
| Total | 189.5 | 122.1 | 187.3 | 64.3 | 128.6 |
1 Electric equipment refers to office equipment used indoors, excluding general power (e.g., elevators, external lighting, etc.).
Table 11.
Preceding research that achieved energy savings by retrofitting existing buildings.
| Buildings | Research | Retrofit | Energy Savings |
|---|---|---|---|
| Office | Dascalaki and Santamouris [67] | Improve exterior building envelope | 40–60% |
| Use energy saving lighting | |||
| Enhance HVAC system | |||
| Song et al. [68] | Improve exterior building envelope | 16.47% | |
| Lee et al. [66] | Improve exterior building envelope | 31% | |
| Kwak et al. [65] | Improve exterior building envelope | 13% | |
| School | Krawczyk [63] | Improve exterior building envelope | 33% |
| Dimoudi and Kostarela [69] | Improve insulation and air tightness | 28.75% | |
| Ali and Hashlamun [64] | Improve exterior building envelope | 54% | |
| Campus | Liu and Ren [70] | Improve exterior building envelope | 47.4% |
| Chung and Rhee [71] | Improve exterior building envelope | 10–22% |
Publisher’s Note: MDPI stays neutral with regard to jurisdictional claims in published maps and institutional affiliations. |
© 2020 by the authors. Licensee MDPI, Basel, Switzerland. This article is an open access article distributed under the terms and conditions of the Creative Commons Attribution (CC BY) license (http://creativecommons.org/licenses/by/4.0/).
Share and Cite
MDPI and ACS Style
Kwak, Y.; Kang, J.; Mun, S.-H.; Jeong, Y.-S.; Huh, J.-H. Development and Application of a Flexible Modeling Approach to Reference Buildings for Energy Analysis. Energies 2020, 13, 5815. https://0-doi-org.brum.beds.ac.uk/10.3390/en13215815
AMA Style
Kwak Y, Kang J, Mun S-H, Jeong Y-S, Huh J-H. Development and Application of a Flexible Modeling Approach to Reference Buildings for Energy Analysis. Energies. 2020; 13(21):5815. https://0-doi-org.brum.beds.ac.uk/10.3390/en13215815
Chicago/Turabian StyleKwak, Younghoon, Jeonga Kang, Sun-Hye Mun, Young-Sun Jeong, and Jung-Ho Huh. 2020. "Development and Application of a Flexible Modeling Approach to Reference Buildings for Energy Analysis" Energies 13, no. 21: 5815. https://0-doi-org.brum.beds.ac.uk/10.3390/en13215815
Note that from the first issue of 2016, this journal uses article numbers instead of page numbers. See further details here.