Article

Virtual Sensors for Estimating District Heating Energy Consumption under Sensor Absences in a Residential Building

1
Division of Architecture and Urban Design, Incheon National University, Incheon 22012, Korea
2
Institute of Urban Science, Incheon national University, Incheon 22012, Korea
3
Center for Building Environment, Sungkyunkwan University, 2066 Seobu-ro, Jangan-gu, Suwon 16419, Korea
*
Author to whom correspondence should be addressed.
Submission received: 30 October 2020 / Revised: 12 November 2020 / Accepted: 13 November 2020 / Published: 18 November 2020

Abstract

:
District heating (DH) is an energy efficient building heating system that entails low primary energy consumption and reduced environmental impact. The estimation of the required heating load provides information for operators to control district heating systems (DHSs) efficiently. It also yields historical datasets for intelligent management applications. Based on the existing virtual sensor capabilities to estimate physical variables, performance, etc., and to detect the anomaly detection in building energy systems, this paper proposes a virtual sensor-based method for the estimation of DH energy consumption in a residential building. Practical issues, including sensor absences and limited datasets corresponding to actual buildings, were also analyzed to improve the applicability of virtual sensors in a building. According to certain virtual sensor development processes, model-driven, data-driven, and grey-box virtual sensors were developed and compared in a case study. The grey-box virtual sensor surpassed the capabilities of the other virtual sensors, particularly for operation patterns corresponding to low heating, which were different from those in the training dataset; notably, a 16% improvement was observed in the accuracy exhibited by the grey-box virtual sensor, as compared to that of the data-driven virtual sensor. The former sensor accounted for a significantly wider DHS operation range by overcoming training data dependency when estimating the actual DH energy consumption. Finally, the proposed virtual sensors can be applied for continuous commissioning, monitoring, and fault detection in the building, since they are developed based on the DH variables at the demand side.

Graphical Abstract

1. Introduction

1.1. District Heating Systems in a Building

District heating systems (DHSs) are widely adopted for heating buildings, especially in urban areas of several countries worldwide. This is because DHSs can provide efficient heating, with low primary energy resource consumption and less impact on the environment [1]. With the advancement of sensor networks, data analysis, and data-driven applications entailing building energy systems, various management and control technologies have been recently studied with regard to district heating (DH) substations [2]. The monitoring of DH energy consumption in a building can provide: (1) information regarding efficiently controlling the system and (2) historical energy datasets for predictive control methods, fault detection and diagnosis (FDD), and system operation pattern analysis. Therefore, continuous monitoring of building energy consumption is essential for optimal DHS control and operation, and for advanced application development.

1.2. Virtual Sensing Technologies in Building Energy Systems

Virtual sensing technologies have been used for various purposes in building energy systems [3]. Virtual sensors can be substituted for existing physical sensors, expensive sensors, and malfunctioning sensors. Backup virtual sensors are usually used in FDD systems, and they can provide information regarding the residual errors between virtual and physical measurements for decision making. The observation virtual sensors estimate the system conditions, performance, and information that is difficult to measure using existing sensors. They employ mathematical models to estimate target values, and are modeled using three approaches (model-driven, data-driven, and grey-box approaches). Based on the capabilities of virtual sensors, and considering the practical difficulties of accessing heat meters in all households, virtual sensor methods can be applied for DH energy estimation in a building.

1.3. Literature Review and Limitations

Several studies focused on the application of virtual sensors in building energy systems have been conducted [4,5,6,7,8,9]. Qian et al. [6] suggested virtual power consumption sensors for variable refrigerant flow (VRF) systems using a multiple linear regression model developed with laboratory datasets. Cheung and Braun [7] developed virtual power consumption sensors for rooftop units using model calibration. Furthermore, Guo et al. [8] developed a virtual variable-speed compressor power sensor for a VRF air conditioning system. Notably, Ploennigs et al. [9] proposed virtual sensors for energy consumption and thermal comfort in buildings with an underfloor heating system (where heat is primarily supplied by a geothermal heat pump). For the DHS, some studies proposed models to estimate or predict the energy consumption or the DH system variables [10,11]. Fang and Lahdelma [10] presented the new model for the district heating state estimation including water flows, supply and return temperatures, and heat losses based on customer measurements. Sajjadi et al. [11] established the DH load prediction model using the extreme learning machine (ELM). Although several studies have provided model-driven, data-driven, and grey-box virtual sensor methods or estimation models for energy consumption in buildings, a few challenges remain:
  • The estimation models for the DH states and variables were usually proposed for the DH networks or primary sides without the relationships with the demand side of a terminal building (such as a multiunit building).
  • Limited studies have been conducted on virtual sensors regarding the DH energy consumption.
  • Previous studies typically involved laboratory experimental setups (because it is difficult to obtain various operational datasets in a real DH substation or to perform sensing in actual buildings).
  • Key sensors for system control are usually installed or managed in real systems. The absence of sensors makes it difficult (or impossible) to develop virtual sensors.
  • The previous methods were usually evaluated under testing conditions that are similar to the training datasets used or under representative operative conditions. This is because it is difficult to obtain various testing datasets in the development of building-level virtual sensors. In this situation, the way to define the different operation patterns or several testing conditions should be proposed to determine the better virtual sensor under the limited data and sensing environments.

1.4. Purpose and Contributions

To overcome these challenges, this study provided a virtual sensing method for estimating the DH energy consumption in a residential building. We also proposed a method to define various operation patterns or testing conditions to develop a better virtual sensor under limited datasets. The contribution of this study is to present a virtual sensing method applicable for a residential building with the limited or general sensing environment of DHS. To the best of our knowledge, this is the first virtual sensor-based study for estimating the DH energy consumption in a multi-unit residential building. The suggested method included two main stages: (1) development stage and (2) validation stage. In the first phase, a virtual sensor development process entailing three virtual sensor modeling approaches was employed (under the sensor absences in the real systems). Testing methods were proposed to evaluate the available virtual sensors considering limited testing datasets. To develop and evaluate the proposed virtual sensors with regard to the heating energy consumption for a DHS, case studies were conducted for a high-rise residential building served by the DHS. The system variables in the DHS, heating energy consumption in the building, and outdoor air temperature and humidity data were gathered for approximately four months using a building automation system (BAS).

2. Methods

2.1. System Description

The proposed virtual sensor method was applied to a DHS serving a multifamily residential building in Korea. The target DHS consisted of a heat exchanger, two circulating pumps, a differential pressure valve (DPV), a temperature control valve (TCV), and several physical temperature and pressure sensors, as shown in Figure 1. The DHS had two setpoints: the supply water temperature (TH,sup) and the pressure difference between the heating supply (PH,sup) and return (PH,ret) pipes at the secondary side. The supply water temperature setpoint was continuously redefined based on the outdoor reset control method [12], and the TCV was controlled to meet the defined setpoints. The pressure difference setpoint was fixed by operators and achieved by controlling the circulating pumps under the working of the DPV. The sensors for mass flow rates at the primary and secondary sides and for the primary return temperature were not installed in the control system, because they were unnecessary variables in terms of the control method (exemplifying the real situation of sensor absences in a residential building DHS). All system variables in the automatic control system of the DHS are specified in Figure 1.

2.2. Gathering Operational Datasets under the Sensor Absences of DHS

Target DHS variables were collected every minute through the building automation system. As mentioned above, the water flow rates and return water temperature at the supply side were not obtained because these variables were not necessary for DHS control. The heating energy consumptions in the target building, obtained by a heat meter, were recorded every hour. To align the minute-to-minute data for the system variables to the hourly metered consumptions, the system value trends were averaged hourly.

2.3. Virtual Sensor Development Process under Sensor Absences

As shown in Figure 2, the proposed method included two parts: (1) virtual sensor development and (2) virtual sensor evaluation. In the development phase, regarding the DH energy consumption estimation, several virtual sensor modeling methods can be employed (such as model-driven, data-driven, and grey-box methods) according to the conventional virtual sensor framework [3]. To produce effective virtual sensors, various system variables were deemed necessary inputs for modeling. If key sensors for temperature and mass flow rates were absent, control signals were obtained from the BAS (when possible). Based on first principles, affinity laws, and other domain knowledge, the unmeasured variables were estimated before virtual sensor development. For the virtual sensor evaluation, the testing conditions were defined by the different operation patterns of the DHS. The clustering method was used to determine the operation patterns in the given datasets. Thus, the three virtual sensors were developed using the estimated variables and then evaluated under different testing conditions. This method provided better virtual sensors that can be developed using limited training and testing datasets and employed in spite of real sensor absences in buildings.

2.4. Virtual Sensor Modeling

According to the suggested virtual sensor method (Figure 2), the model-driven, data-driven, and grey-box virtual sensors for estimating heating energy consumption were developed for the target system. Each virtual sensor was defined as a different case.
The model-driven virtual sensor (Case 1) was formulated (Equation (1)) based on the heat equation in the DH substation. It is important to note that the temperature differences were measured, but the water flow rates were not measured by the control system. To overcome the sensor absence, the design information and the control signal (fH) for the pumps were used to estimate the unmeasured water flow rates. During the design phase, the water flow rate was defined as 2120 LPM at a pump signal of 60 Hz. Based on the affinity law between revolutions per minute (RPM) and water flow rates, assuming the pump head is constant in operation, the water flow rates were calculated as in Equation (2) using the designed flow rates at the design frequency (fdesign). This is an example of overcoming sensor absences using domain knowledge for developing virtual sensors in a real building.
The data-driven virtual sensor (Case 2) was modeled, as in Equation (3), by incorporating the relevant variables using a multilayer perceptron (MLP) neural network [13]. As shown in Figure 3, the relevant variables were divided into two categories, namely system variables (xsys) and environmental variables (xenv). System variables were internal information of the system, including pressures, temperatures, and control signals. Additionally, the calculated pressure difference (ΔPH) and temperature difference (ΔTH) at the secondary supply and return side were defined as the MLP input variables. The environmental variables, that is, the outdoor air temperature (TOA), relative humidity (RHOA), and operation hours (t), were also defined as the MLP input variables. The metered heating energy consumption was used as the MLP output.
The grey-box virtual sensor (Case 3) was defined as the second-degree polynomial function of the model-driven value (Qmodel), as in Equation (4). Three coefficients ( α ) of the function were considered as the operational unknown factors between the model-driven virtual sensor value and the metered energy consumption value. Coefficients were calculated by the least squares method, which is the popular regression method for polynomial functions.
Q m o d e l = C p , H × M H × ( T H , s u p T H , r e t )
M H = M H , d e s i g n × f H f d e s i g n
Q D a t a = M L P C a s e 2 ( x s y s , 1 , x s y s , 2 , x s y s , k , x E n v , 1 , x E n v , 2 , , x E n v , l )
Q G r e y = α 1 ( Q m o d e l ) 2 + α 2 ( Q m o d e l ) + α 3
As shown in Table 1, identical MLP structures and settings were used for training the data-driven model. The structure consisted of an input layer, three hidden layers, and an output layer. In the layers, ReLU and linear activation functions were used, as shown in Figure 3, and the weights of neurons were initialized using the Kaiming initializer [14]. For enhanced training, bias neurons were applied at the input layer and in each hidden layer with zero initialization. Optimization was performed using the Adam optimizer [15], and early stopping was employed, to prevent overfitting, when the validation loss decreased by less than 1% during 10 epochs. The hourly operational dataset corresponding to January was employed in this study. This dataset was split to 15% and 85% for the validation and training of the models, respectively. For the regression in Case 3, the defined regression parameters were listed in Table 2. The trained models were evaluated using three indices, shown in Equations (5)–(7).
RMSE = i = 1 n ( a i p i ) 2 n
MAE = i = 1 n | a i p i | n
RAE = i = 1 n | a i p i | i = 1 n | a i a ¯ |
where a is the actual (true) value, p is the predicted value from the MLP neural network, a ¯ is the mean of the actual value, n is the total number of the dataset time steps, and i is the time step.

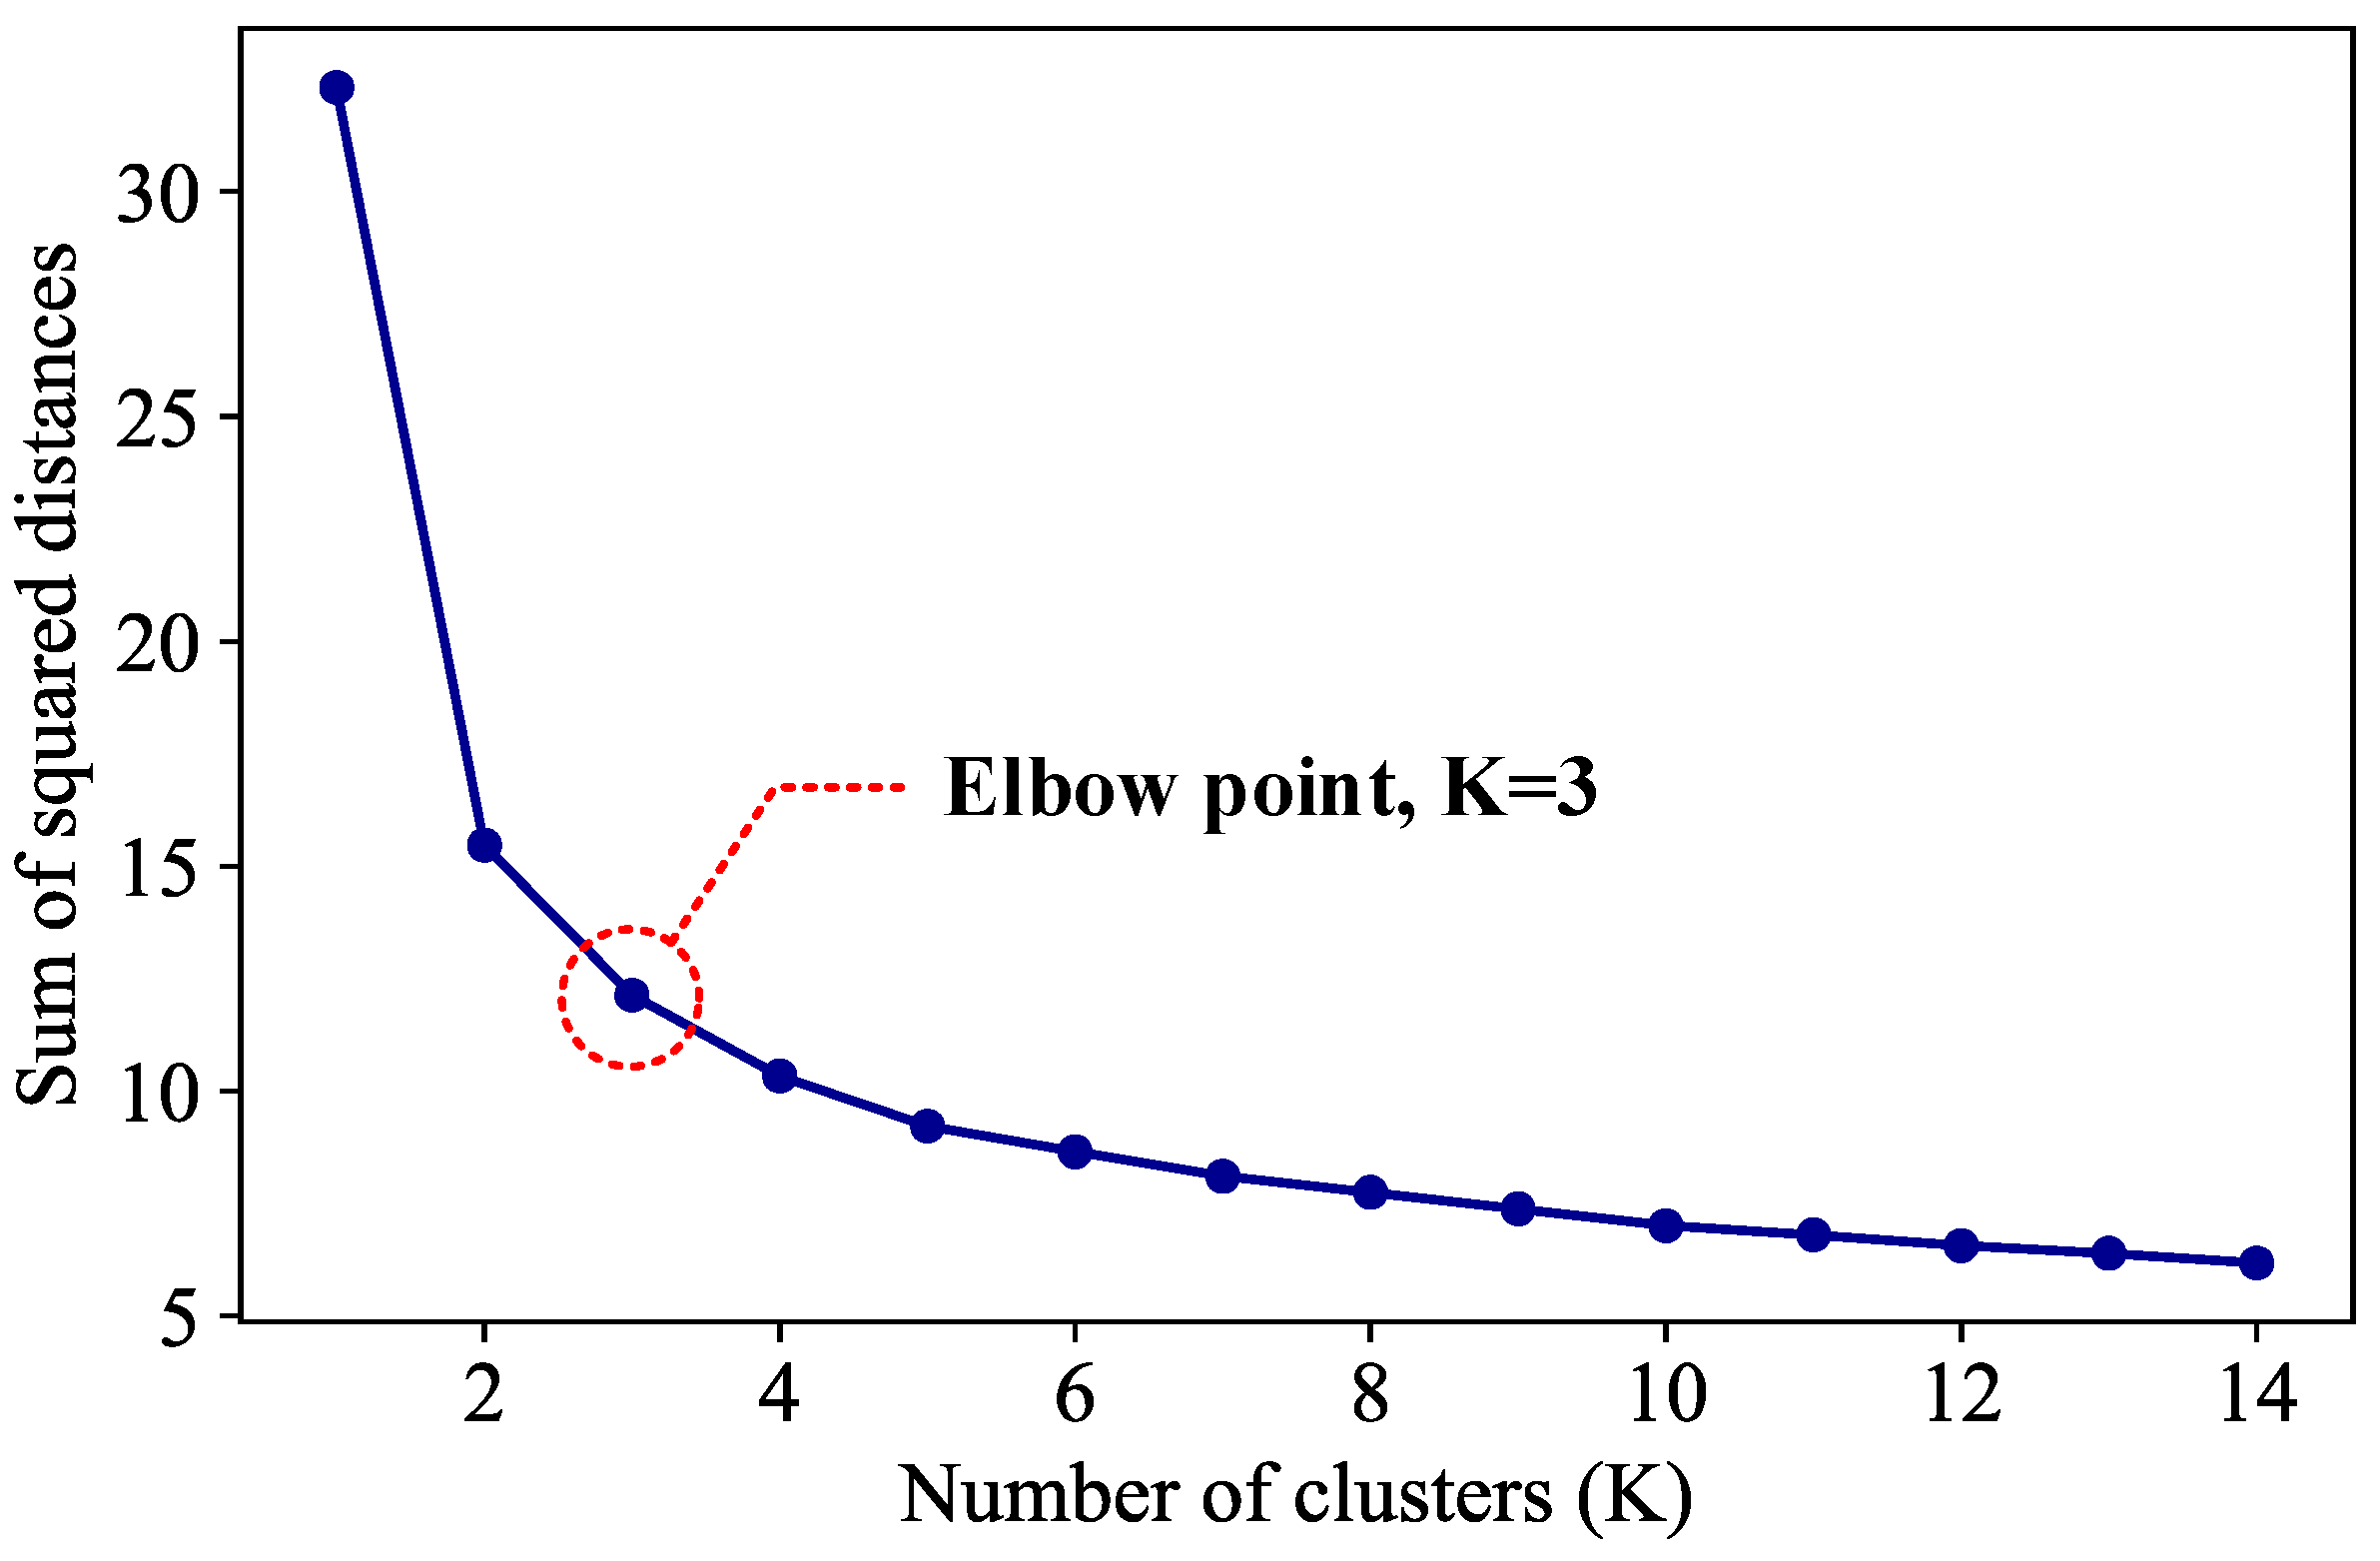
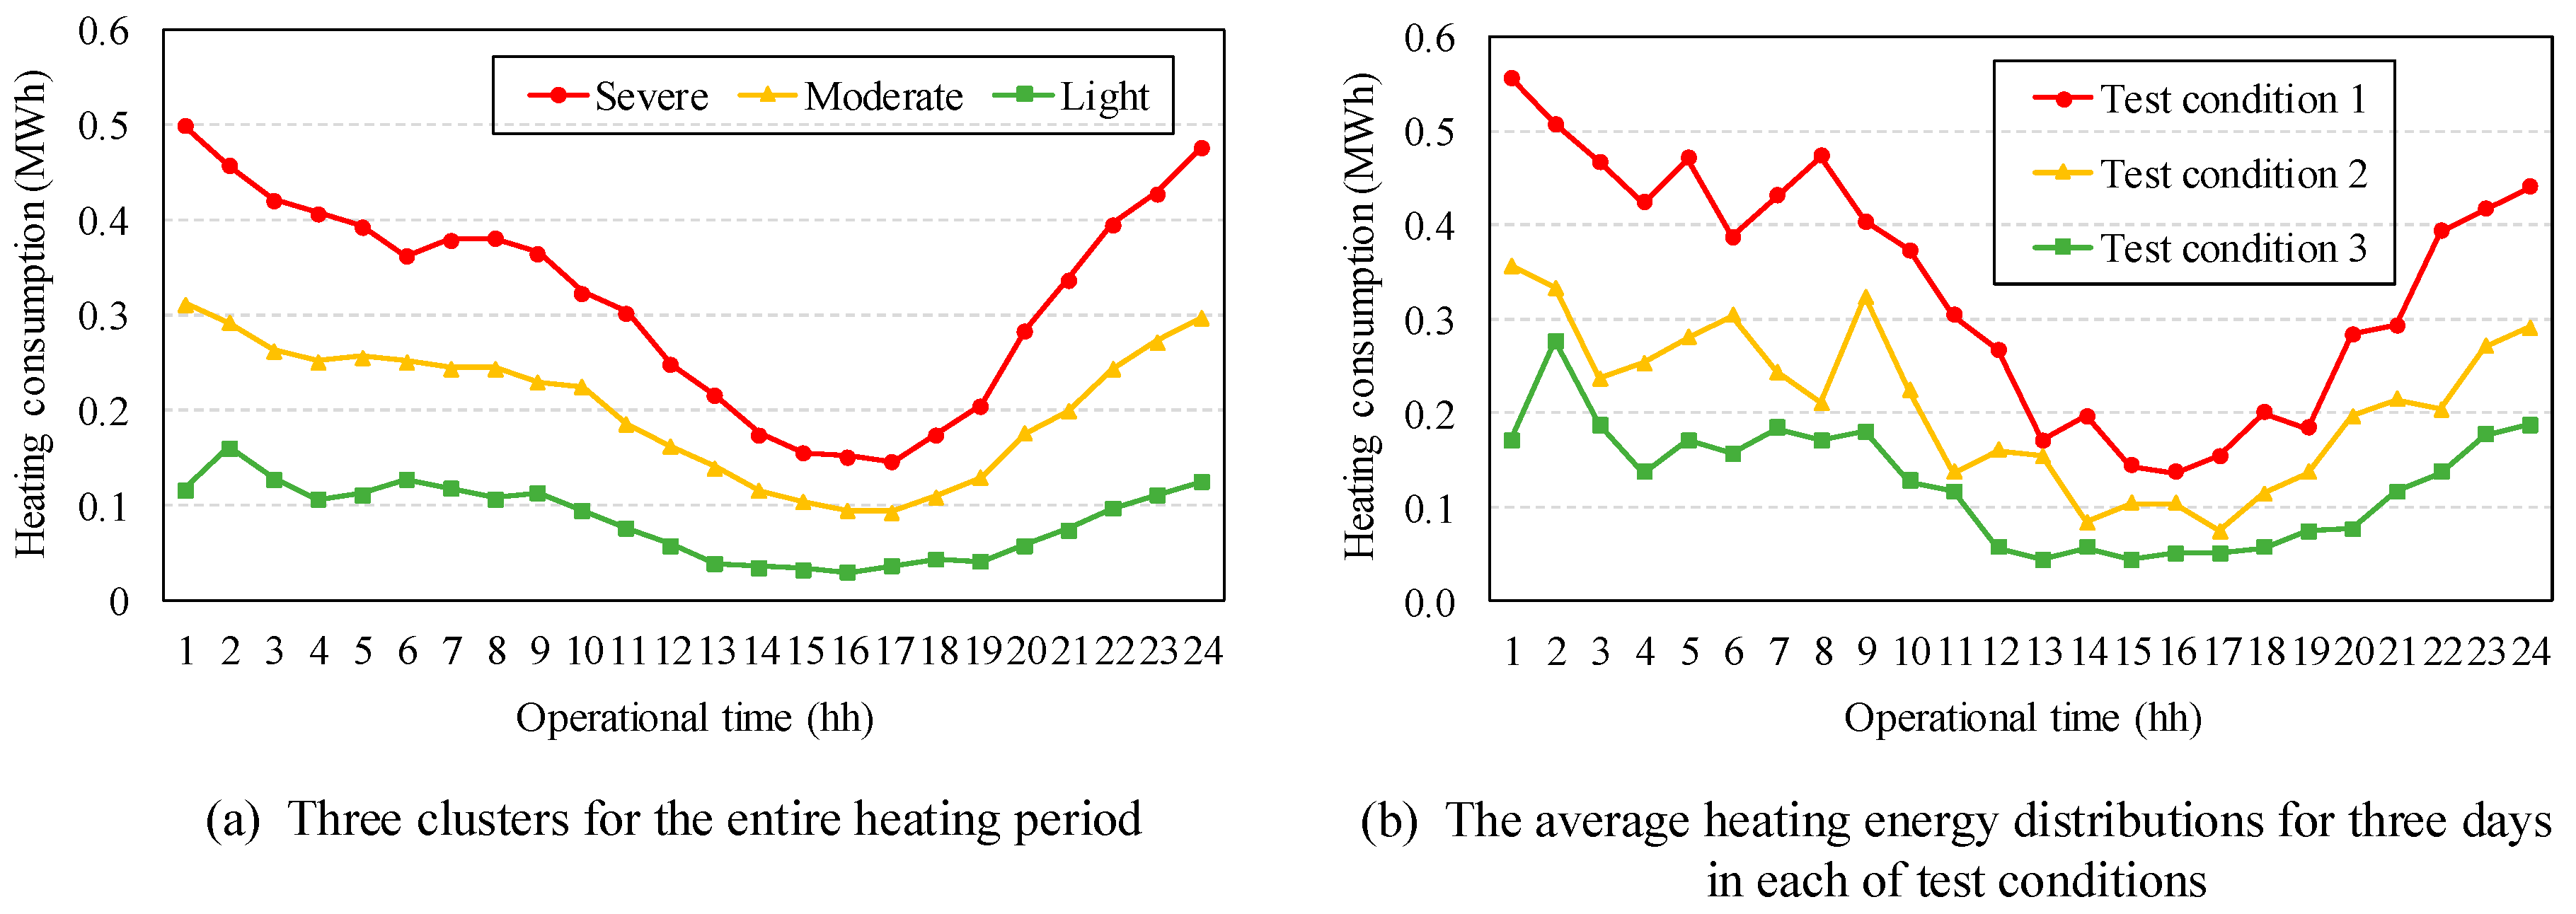
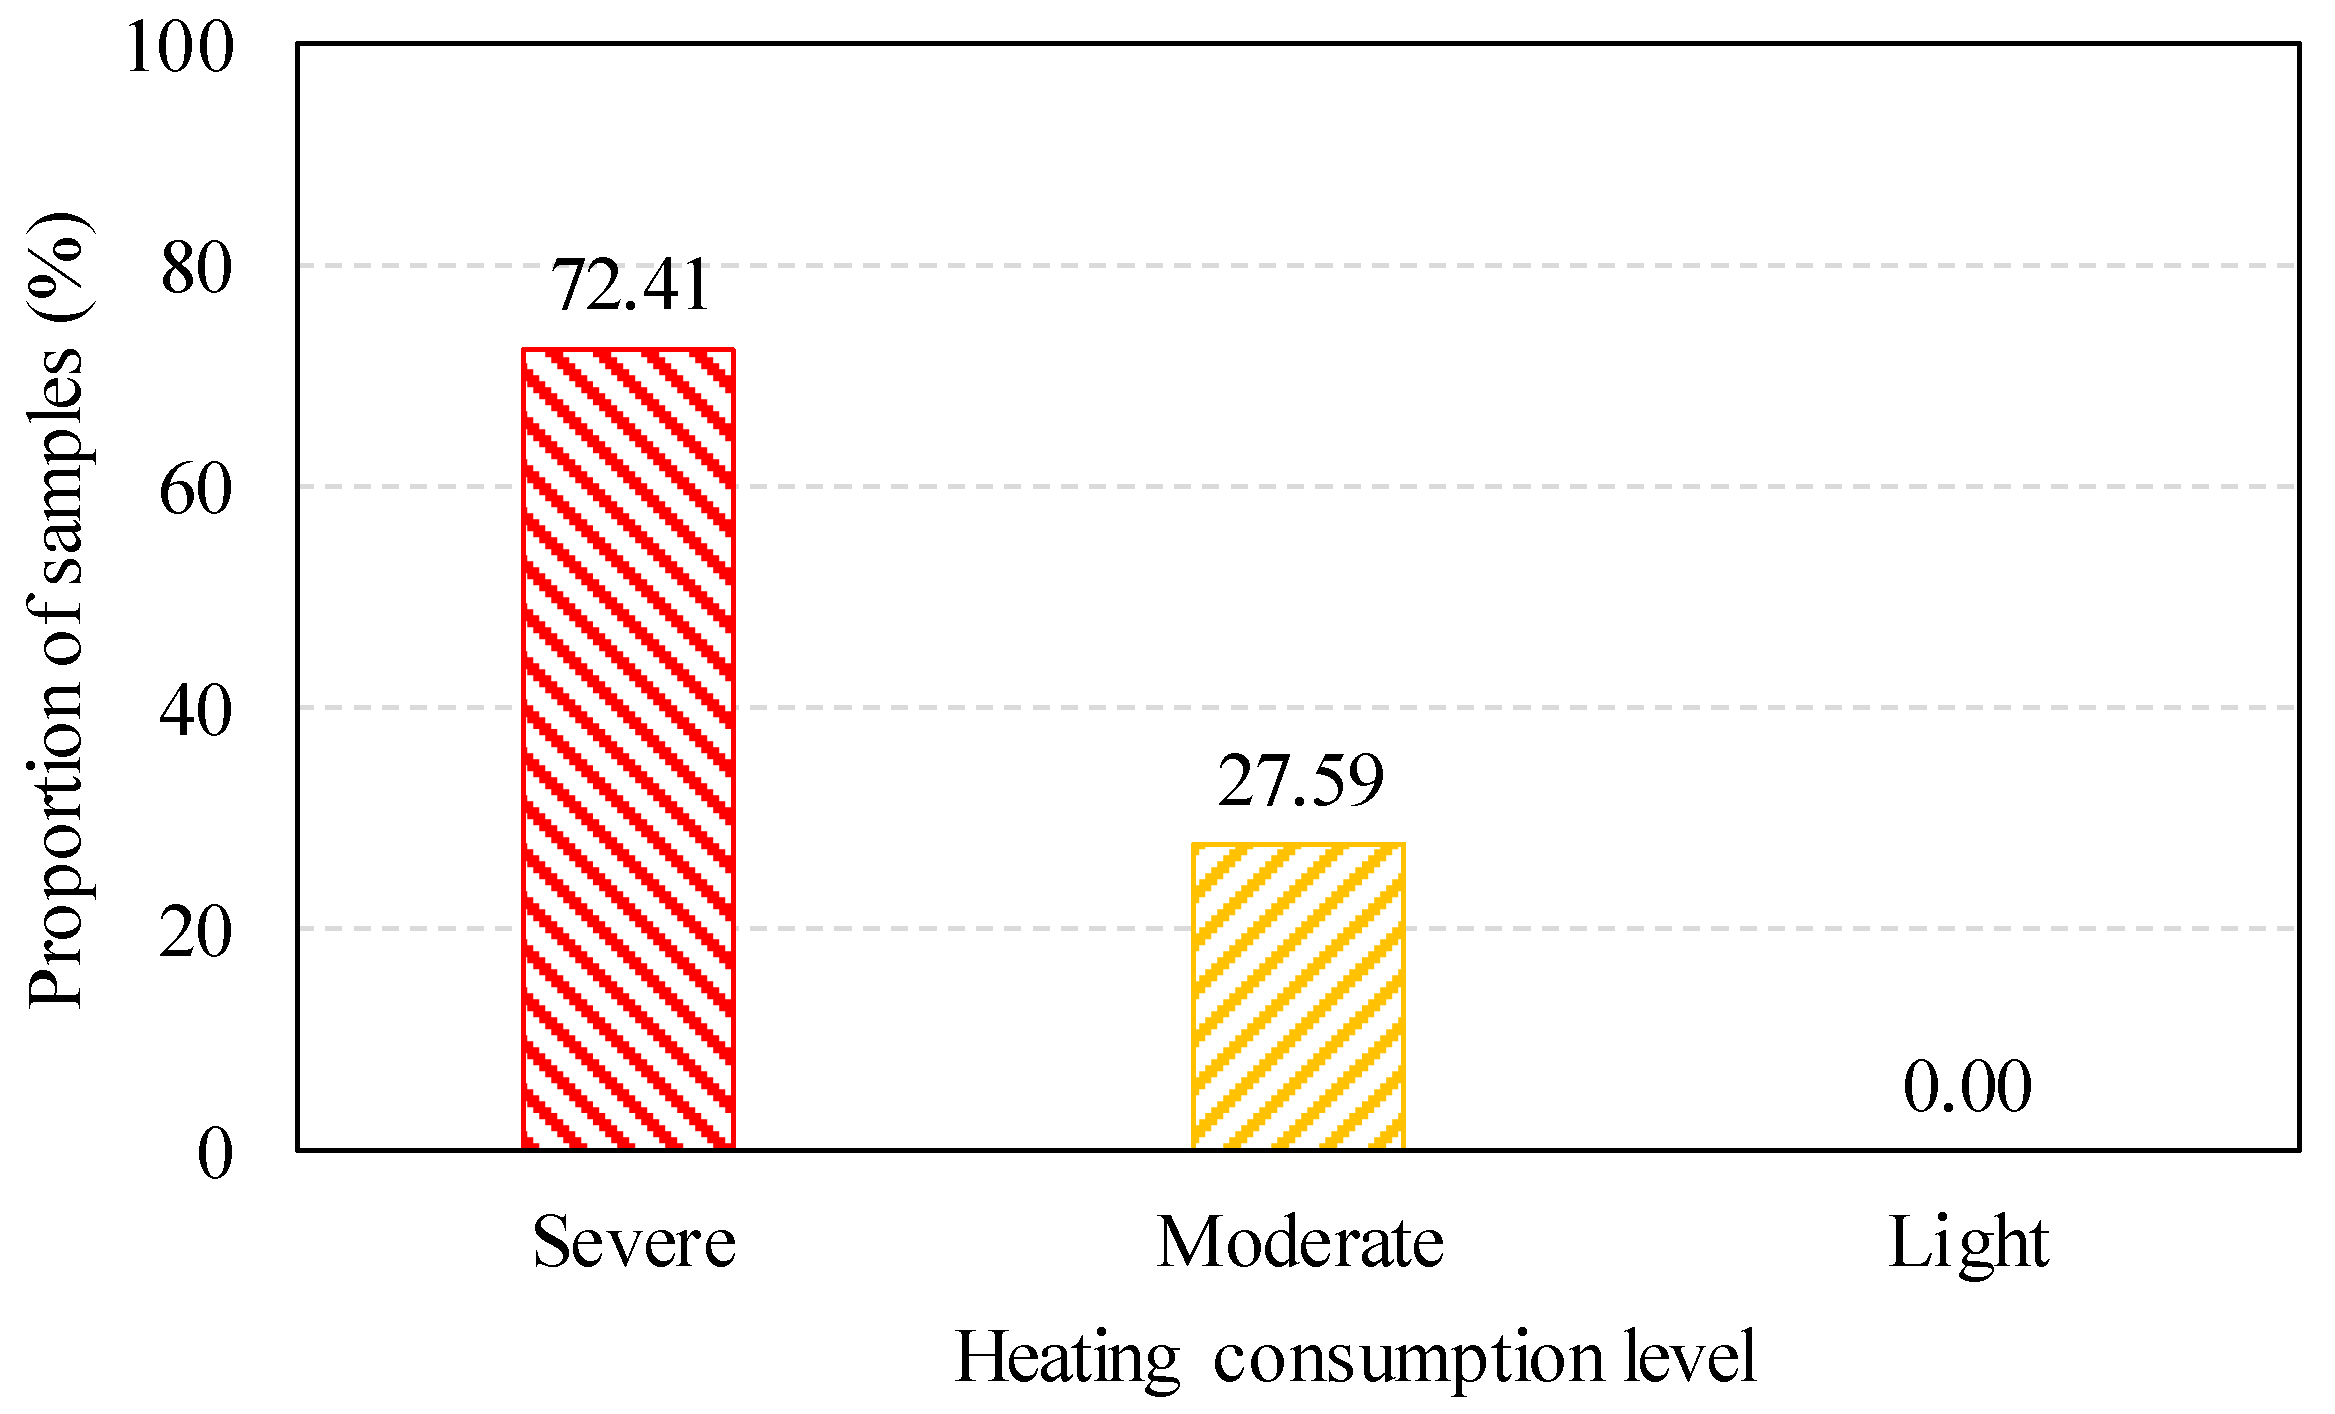
2.5. Determining Testing Conditions Using a Clustering Method

Clustering is the process of partitioning a dataset into subgroups based on similarity. The similarity between clusters is normally determined by distance. K-means is a centroid-based clustering algorithm that has been widely used in identifying system operation patterns in buildings [16,17]. In this study, k-means clustering was used to define the operation patterns of the DHS. The cost function is defined in Equation (8). The input variables of the k-means clustering included the hourly heating energy consumption over a day to identify the daily operation patterns. The clustering period was from December to March. The value of K, the number of clusters, was defined as K = 3 based on the elbow method [18], as shown in Figure 4. The k-means process was conducted using Python libraries.
C = i = 1 k x j S i | x j μ i | 2
where C is the cost function of clustering, k is the number of clusters, Si is ith cluster from dataset, xj is the jth data object in Si, and μ i is the centroid of cluster Si.

3. Results and Discussion

3.1. Clustering Results

Figure 5a shows the clustering results for the entire heating period (December to March). Three operation patterns were determined based on the daily heating energy consumption levels (severe, moderate, and light heating levels). According to the three clusters, to evaluate the virtual sensor performance, the three operation patterns were defined as follows: (1) Test condition 1: severe level, (2) Test condition 2: moderate level, and (3) Test condition 3: light level. For each testing condition, three different days were selected from the testing datasets. Figure 5b shows the average heating energy consumptions for the three days selected for each test condition.
Furthermore, the cluster composition was analyzed for the training dataset (corresponding to January), as shown in Figure 6. Severe clusters were the most prevalent (approximately 72%) in the training dataset. Moderate days were included, but no days corresponded to the light cluster. Thus, testing condition 3 (light cluster) was regarded as the difficult condition for the virtual sensor evaluation.

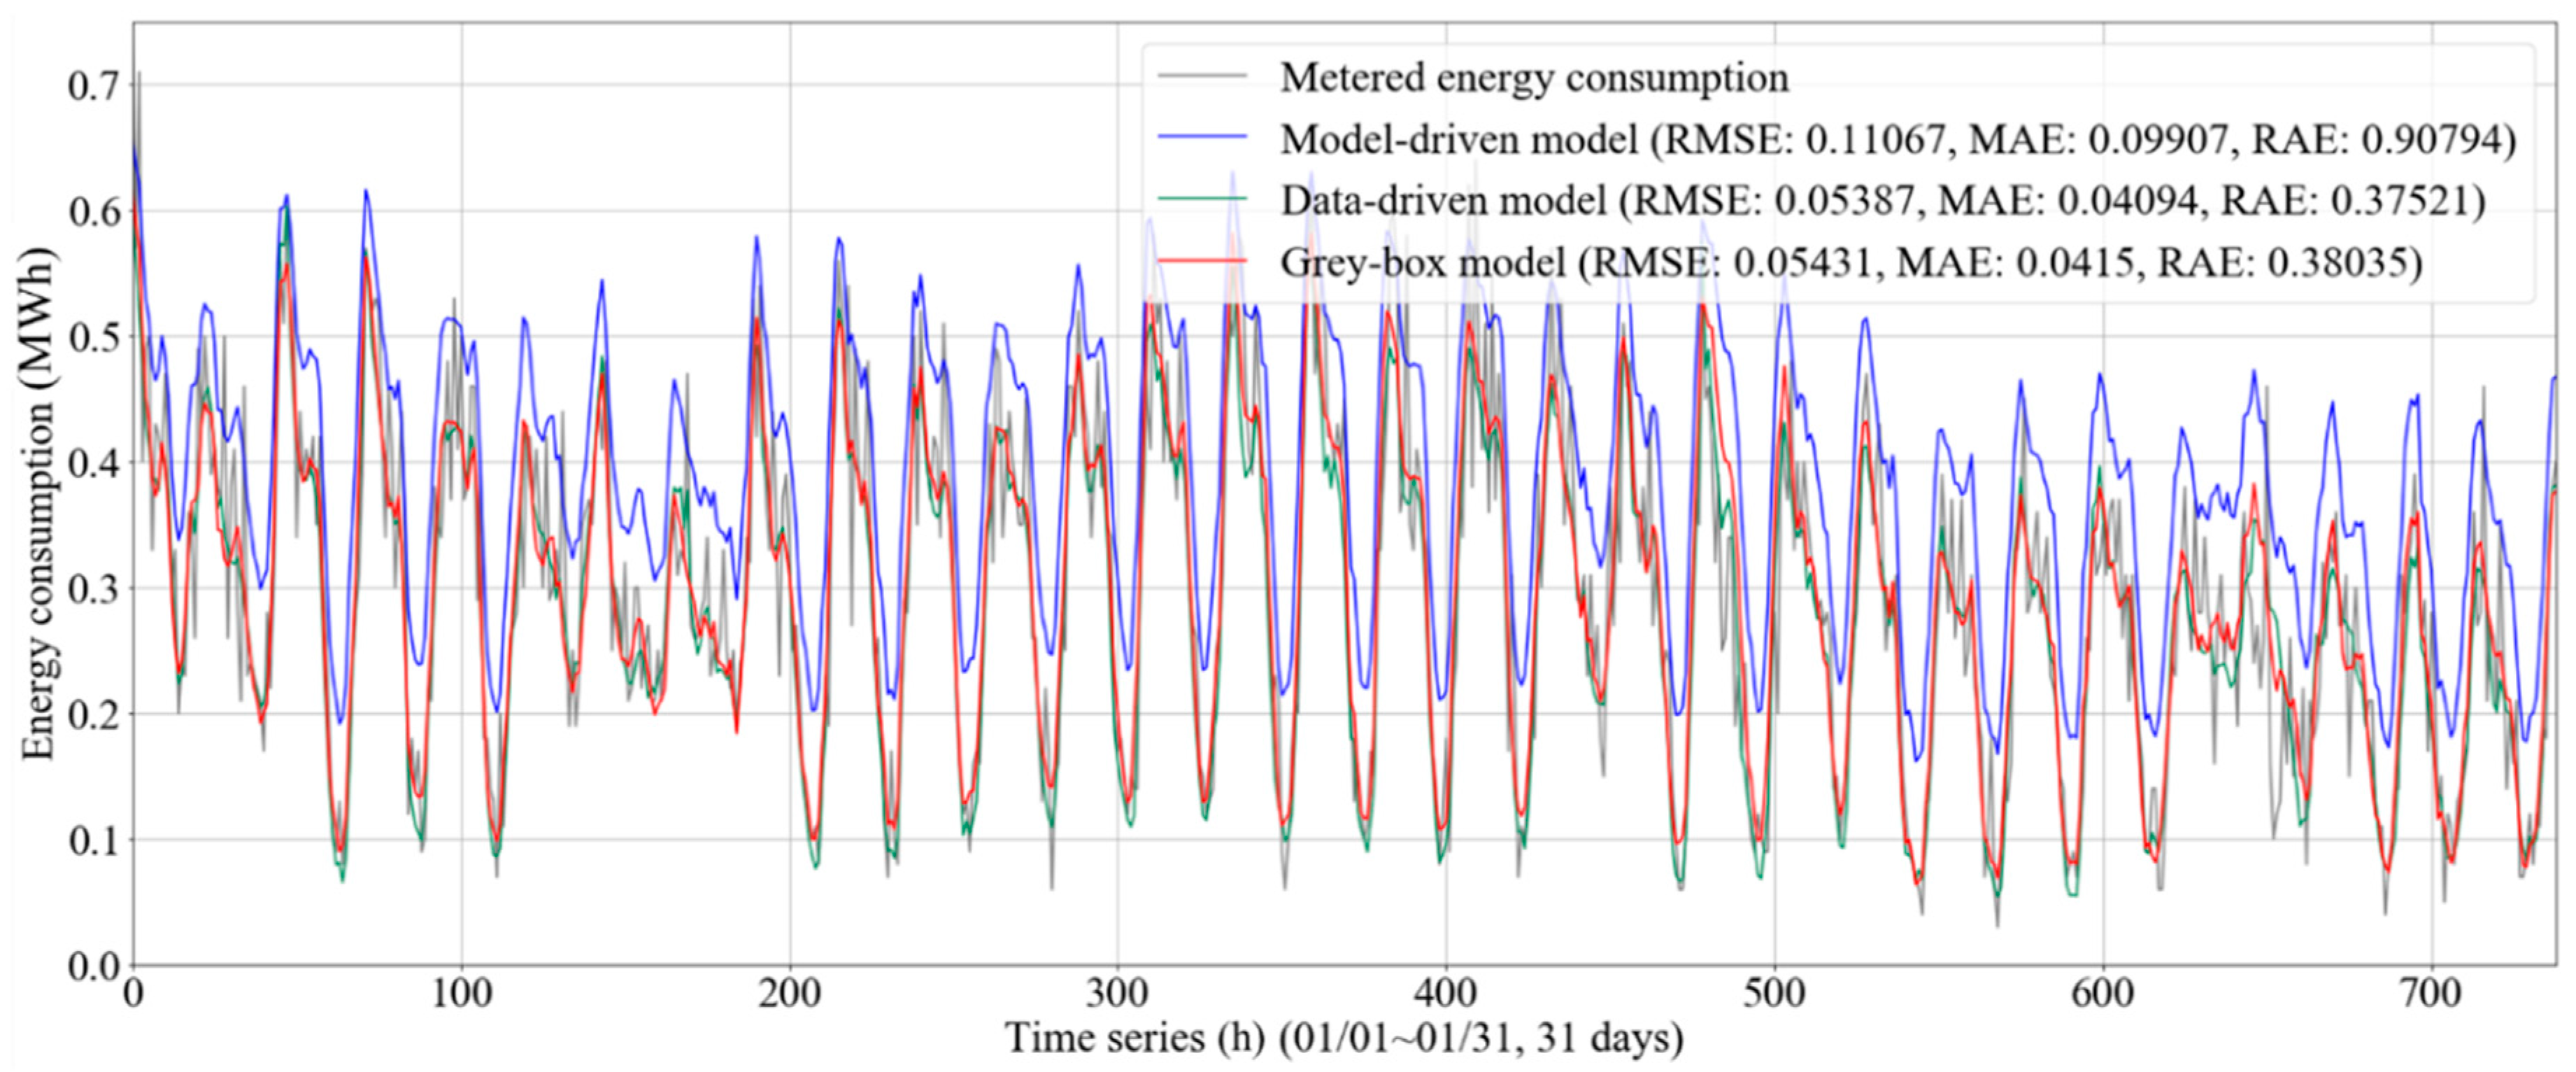
3.2. Results of Training for the Virtual Sensors

The training results for the three virtual sensors are shown in Figure 7. The root mean square errors (RMSEs) were 0.11, 0.05, and 0.054, respectively, for the model-driven virtual sensor, the data-driven virtual sensor, and the grey-box virtual sensor. The three coefficients ( α 1 , α 2 , and α 3 ) for the grey-box model as in Equation (4) were 0.5095, 0.7011, and −0.0628.
Figure 8 shows the DH energy consumption trends obtained by the three virtual sensors over the training period. All of the virtual sensors showed reasonable distributions, as compared to the metered heating energy consumptions. The data-driven and grey-box virtual sensors exhibited a higher accuracy. The two virtual sensors provided a more reliable trend, as compared to the model-driven sensor. Further, the model-driven virtual sensor exhibited significant errors, especially for periods corresponding to low heating. This indicated that the steady-state model formulated based on the design information under the sensor absences was unable to consider dynamic thermal behavior and various operational uncertainties in the system. The following sections highlight the detailed performance evaluation under multiple testing conditions.

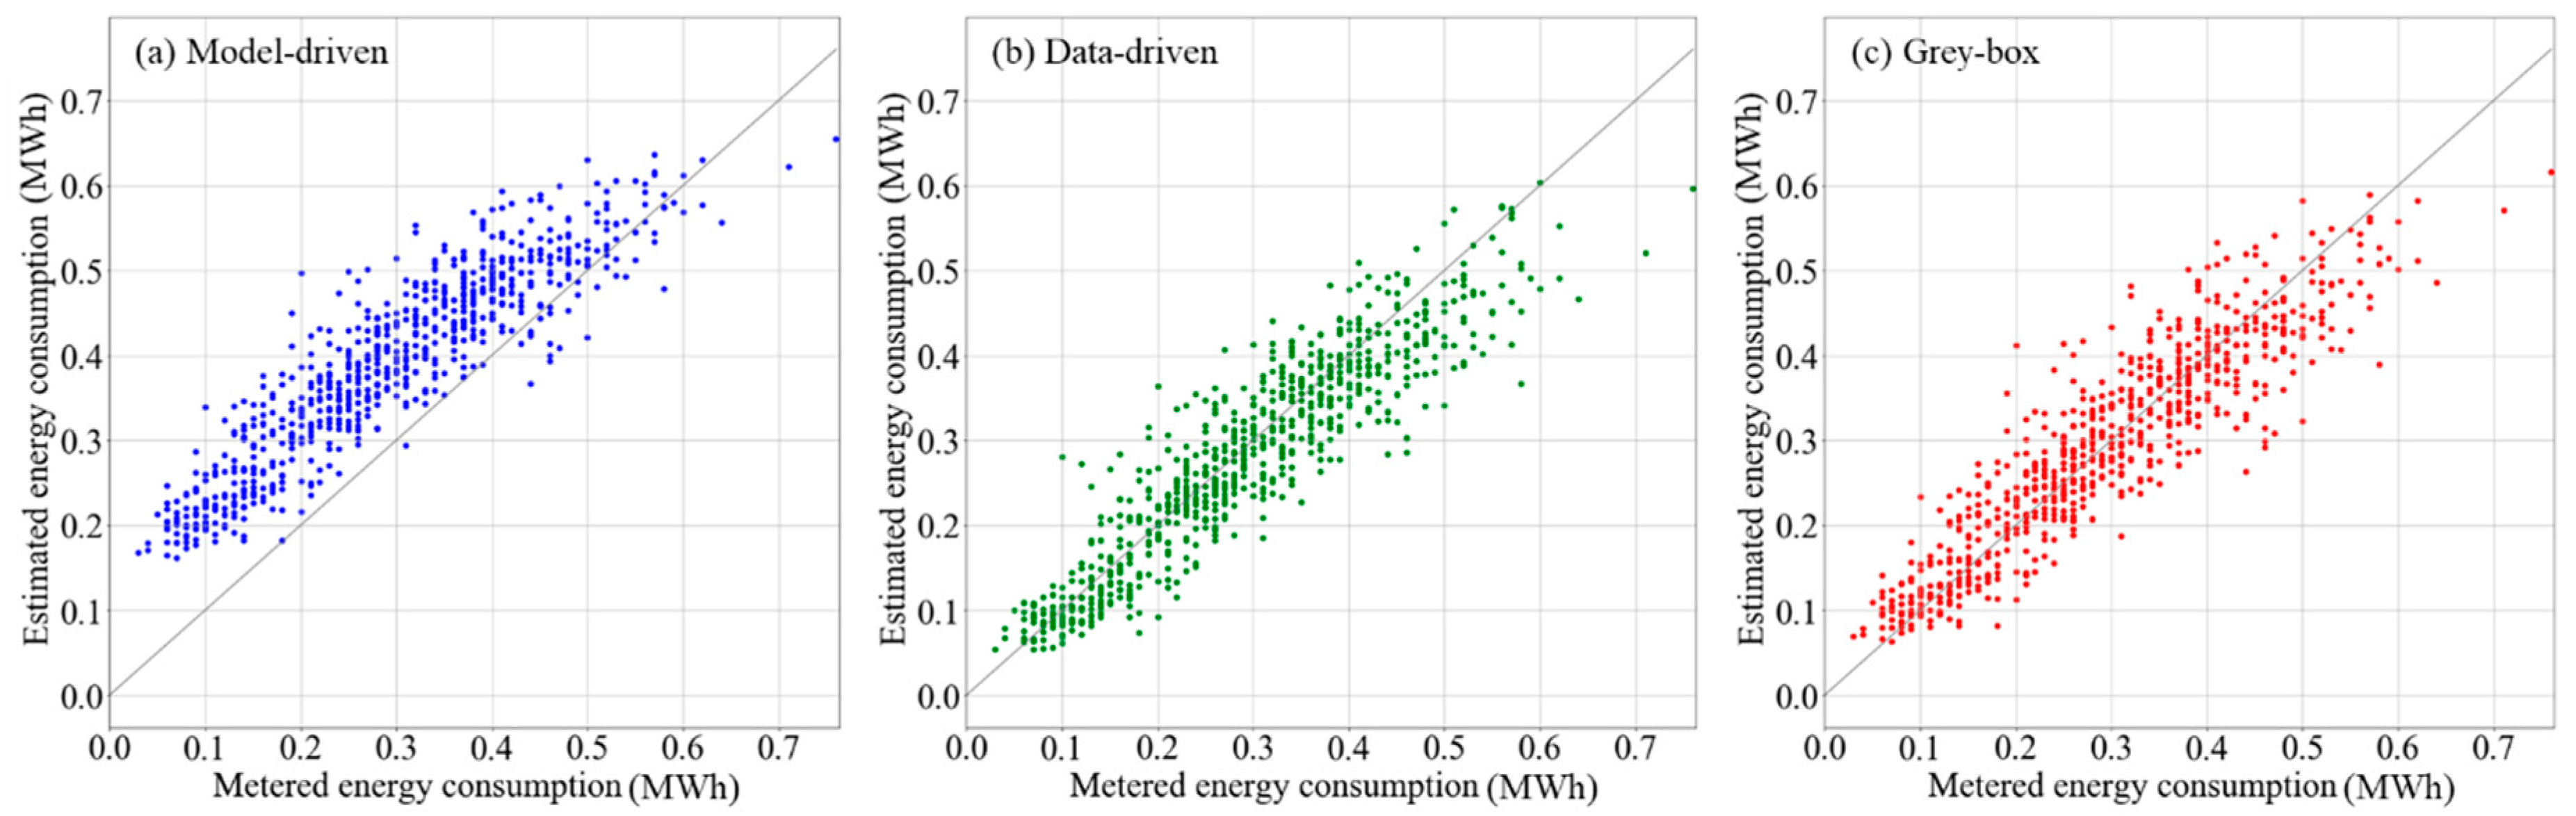
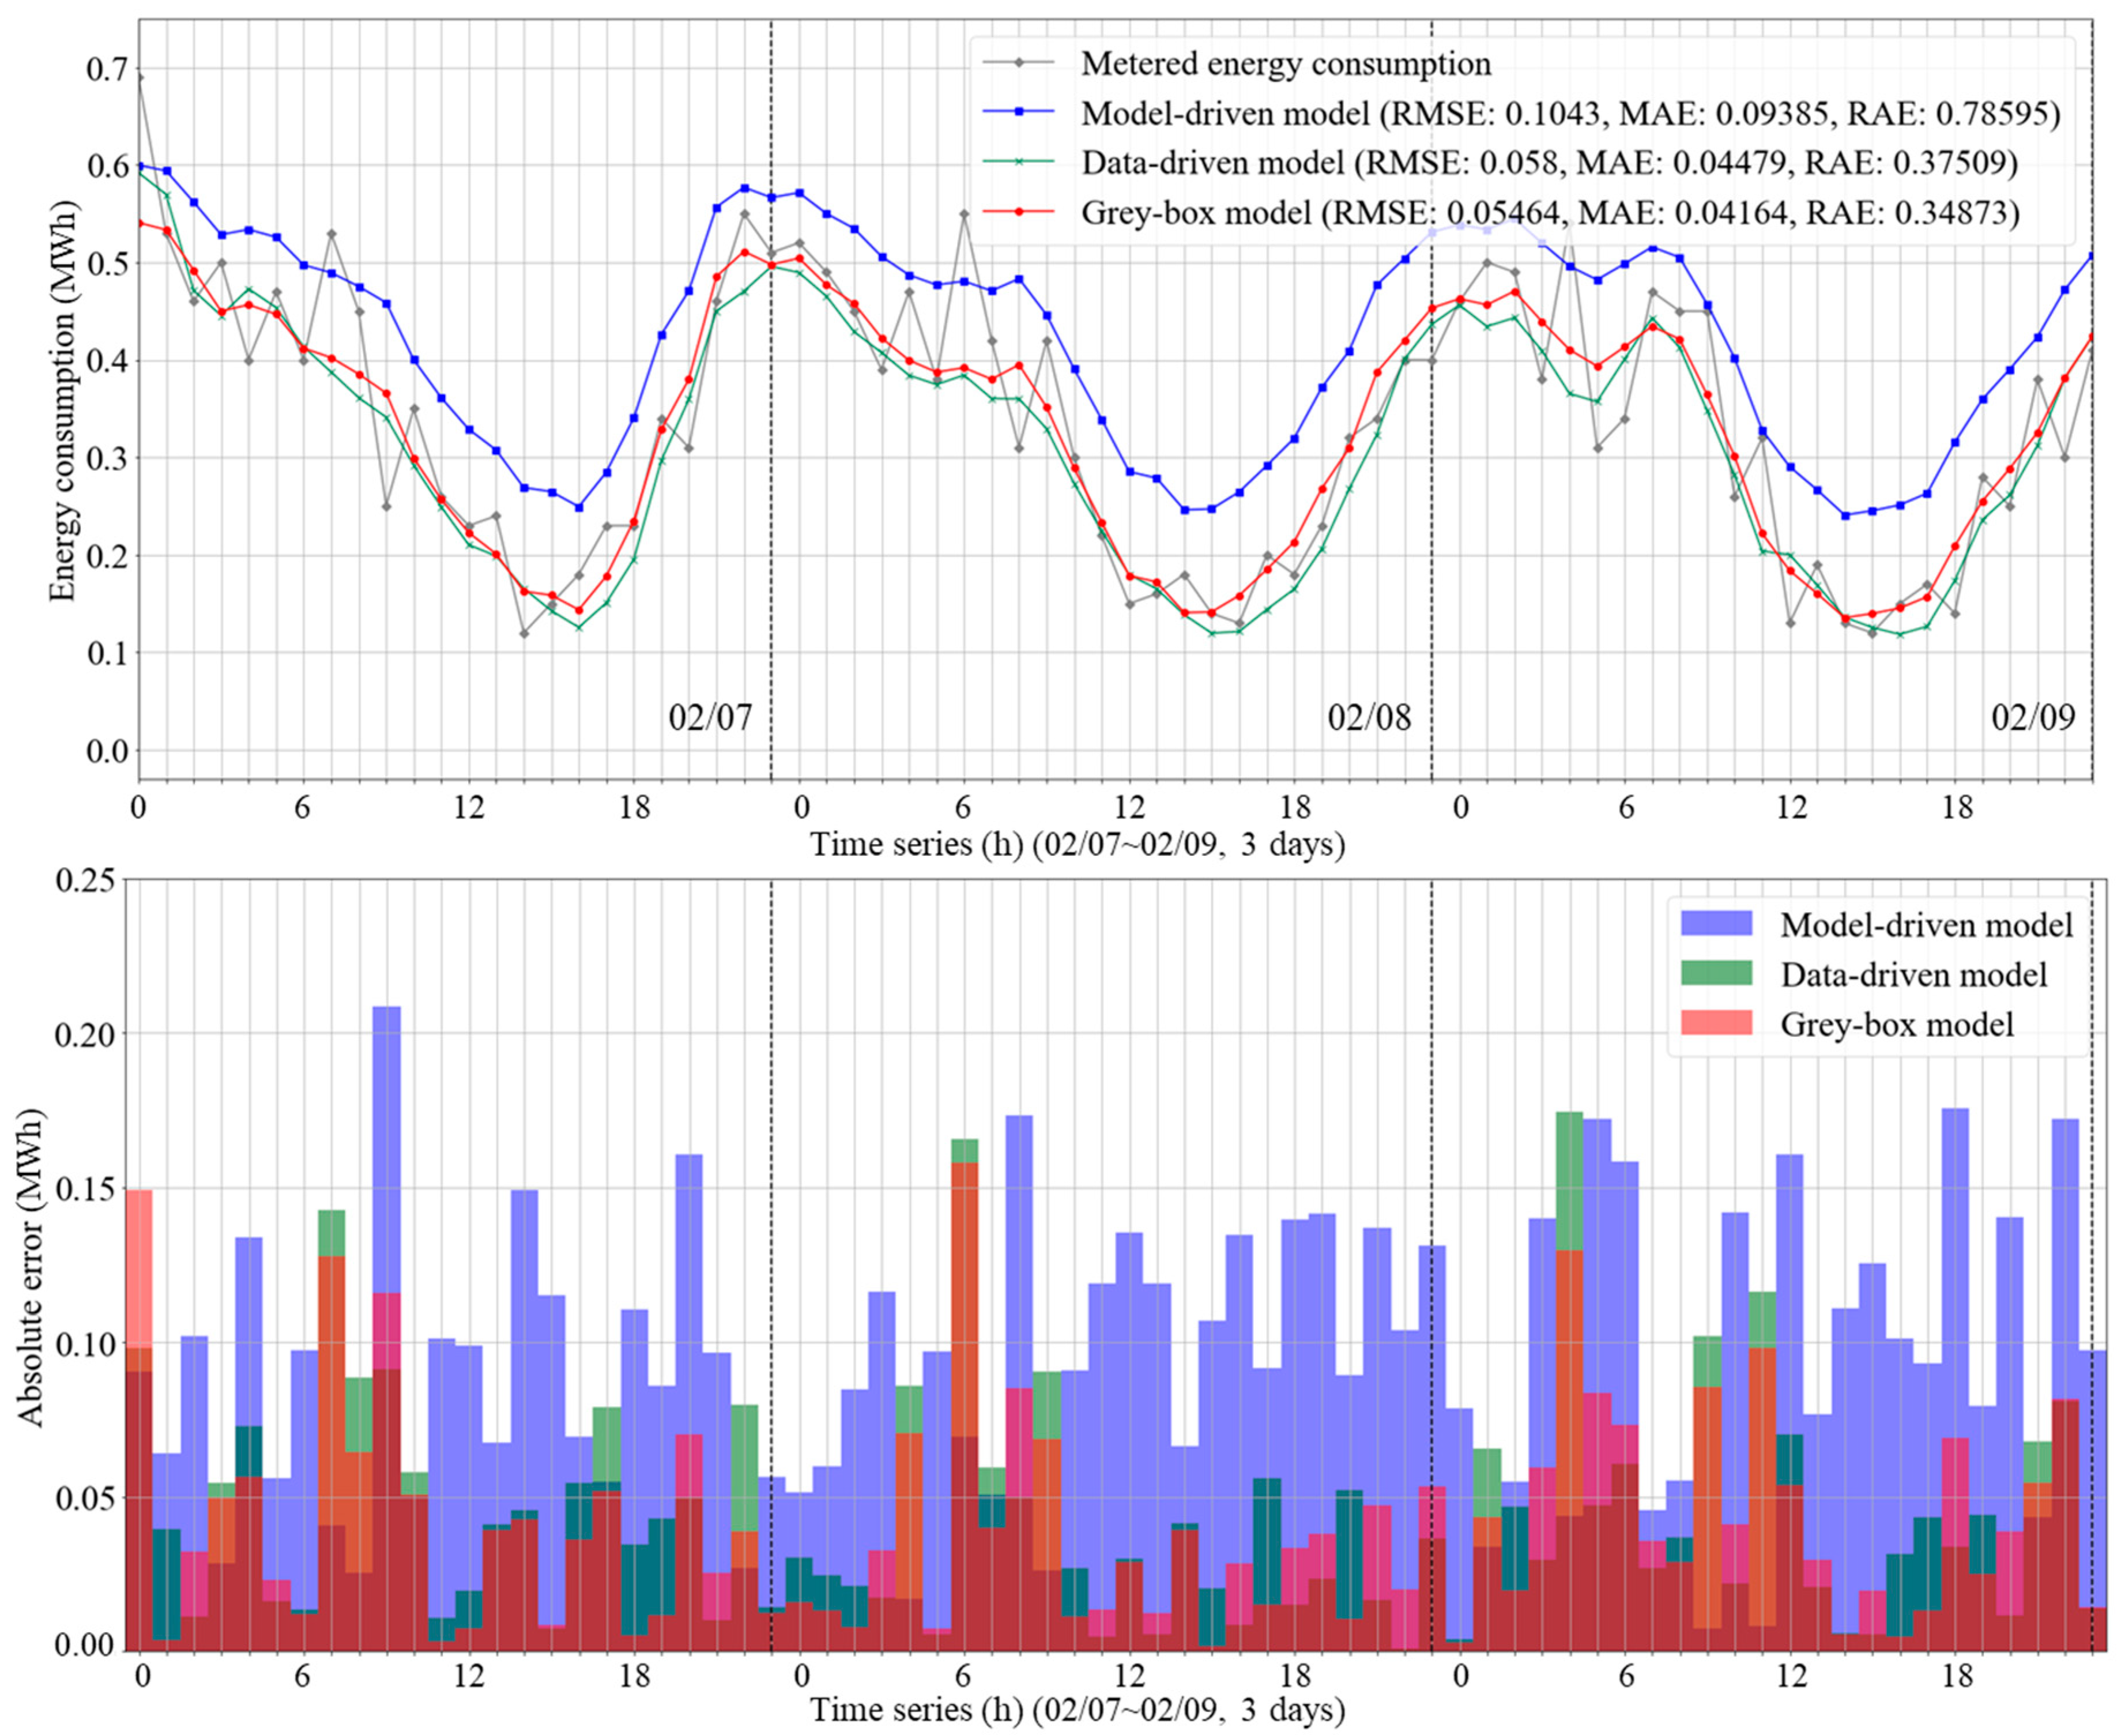
3.3. Comparison between Data-Driven and Grey-Box Virtual Sensors (Test Condition 1)

The virtual sensors were evaluated with regard to the first testing condition, according to which the days in the test set that correspond to the severe cluster are employed. This was regarded as a favorable testing condition because it is similar to the training conditions.
Figure 9 shows the time-series plots of the estimated heating energy consumption obtained by the virtual sensors. As mentioned for the training results, the model-driven virtual sensor showed a substantial difference between the estimated and metered trends (RMSE = 0.10). Comparing the data-driven and grey-box virtual sensors, the grey-box virtual sensor performed slightly better than the data-driven virtual sensor in terms of the three evaluation indices. This demonstrates that the data-driven and grey-box virtual sensors can considerably adapt to the operation patterns exhibited by the training datasets. Nevertheless, all virtual sensors did not capture the dramatic increase and decrease in heating energy consumption in the building. This was because of the data acquisition frequency difference between the system sensors and meters.

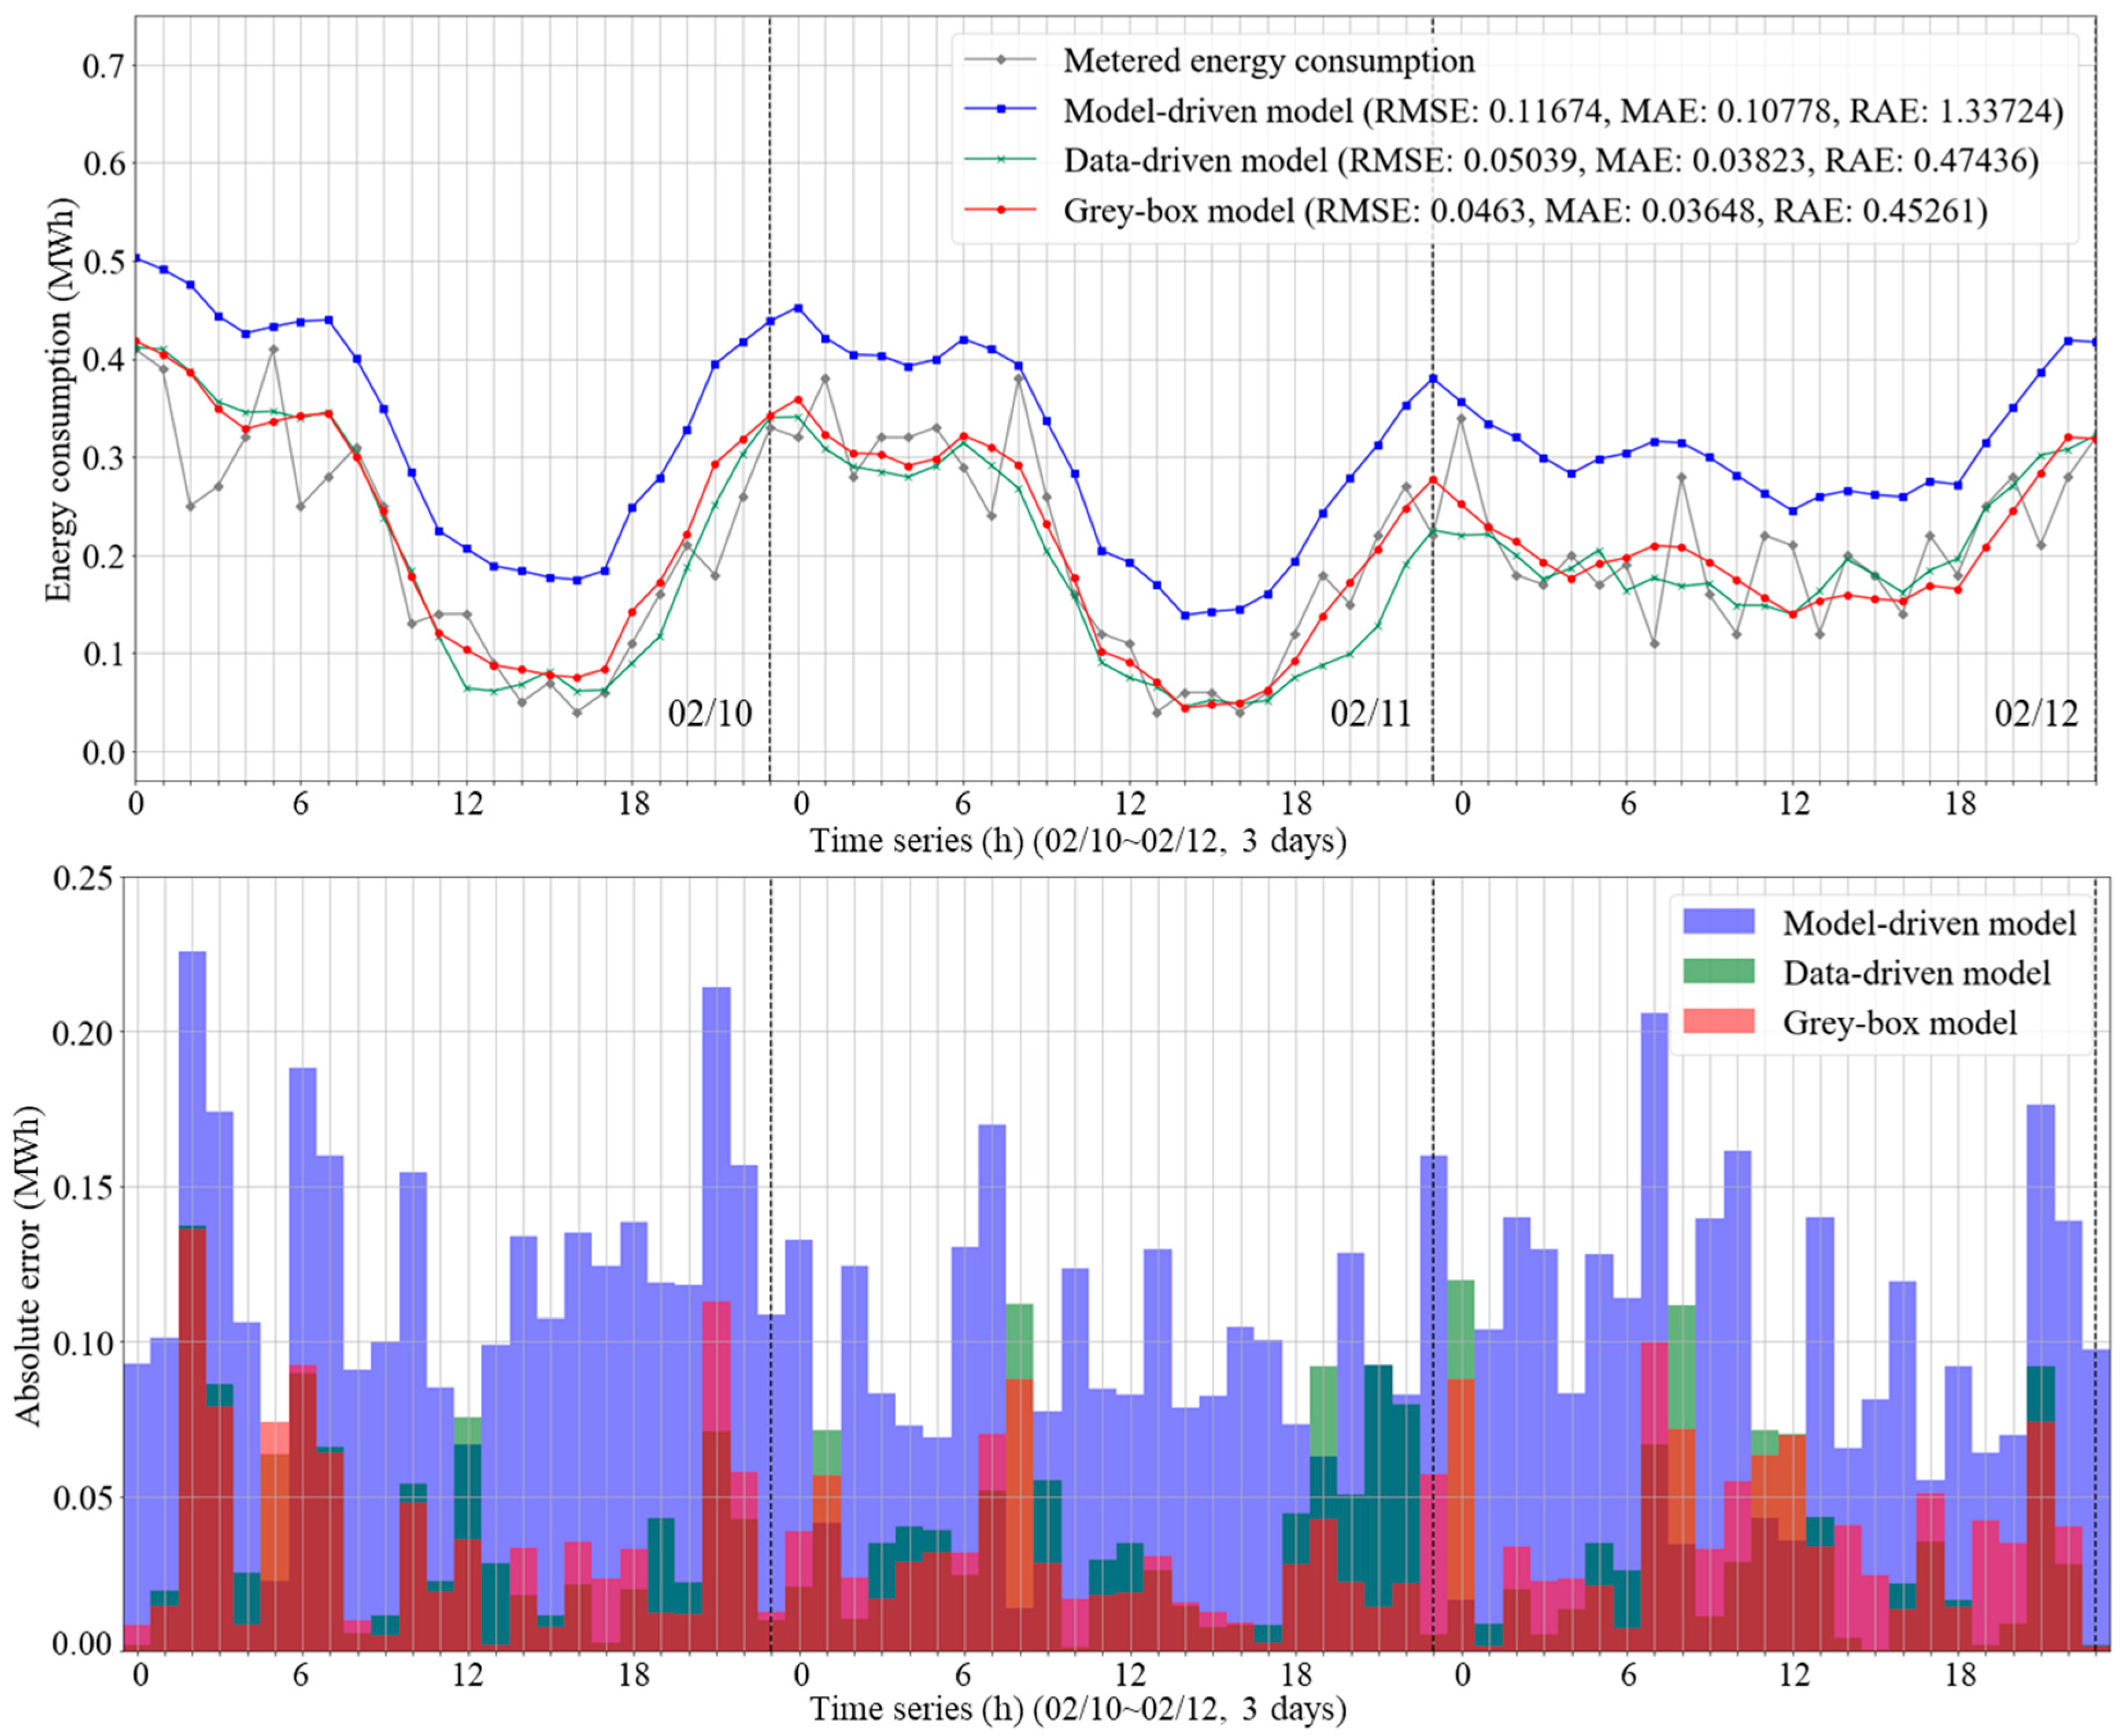
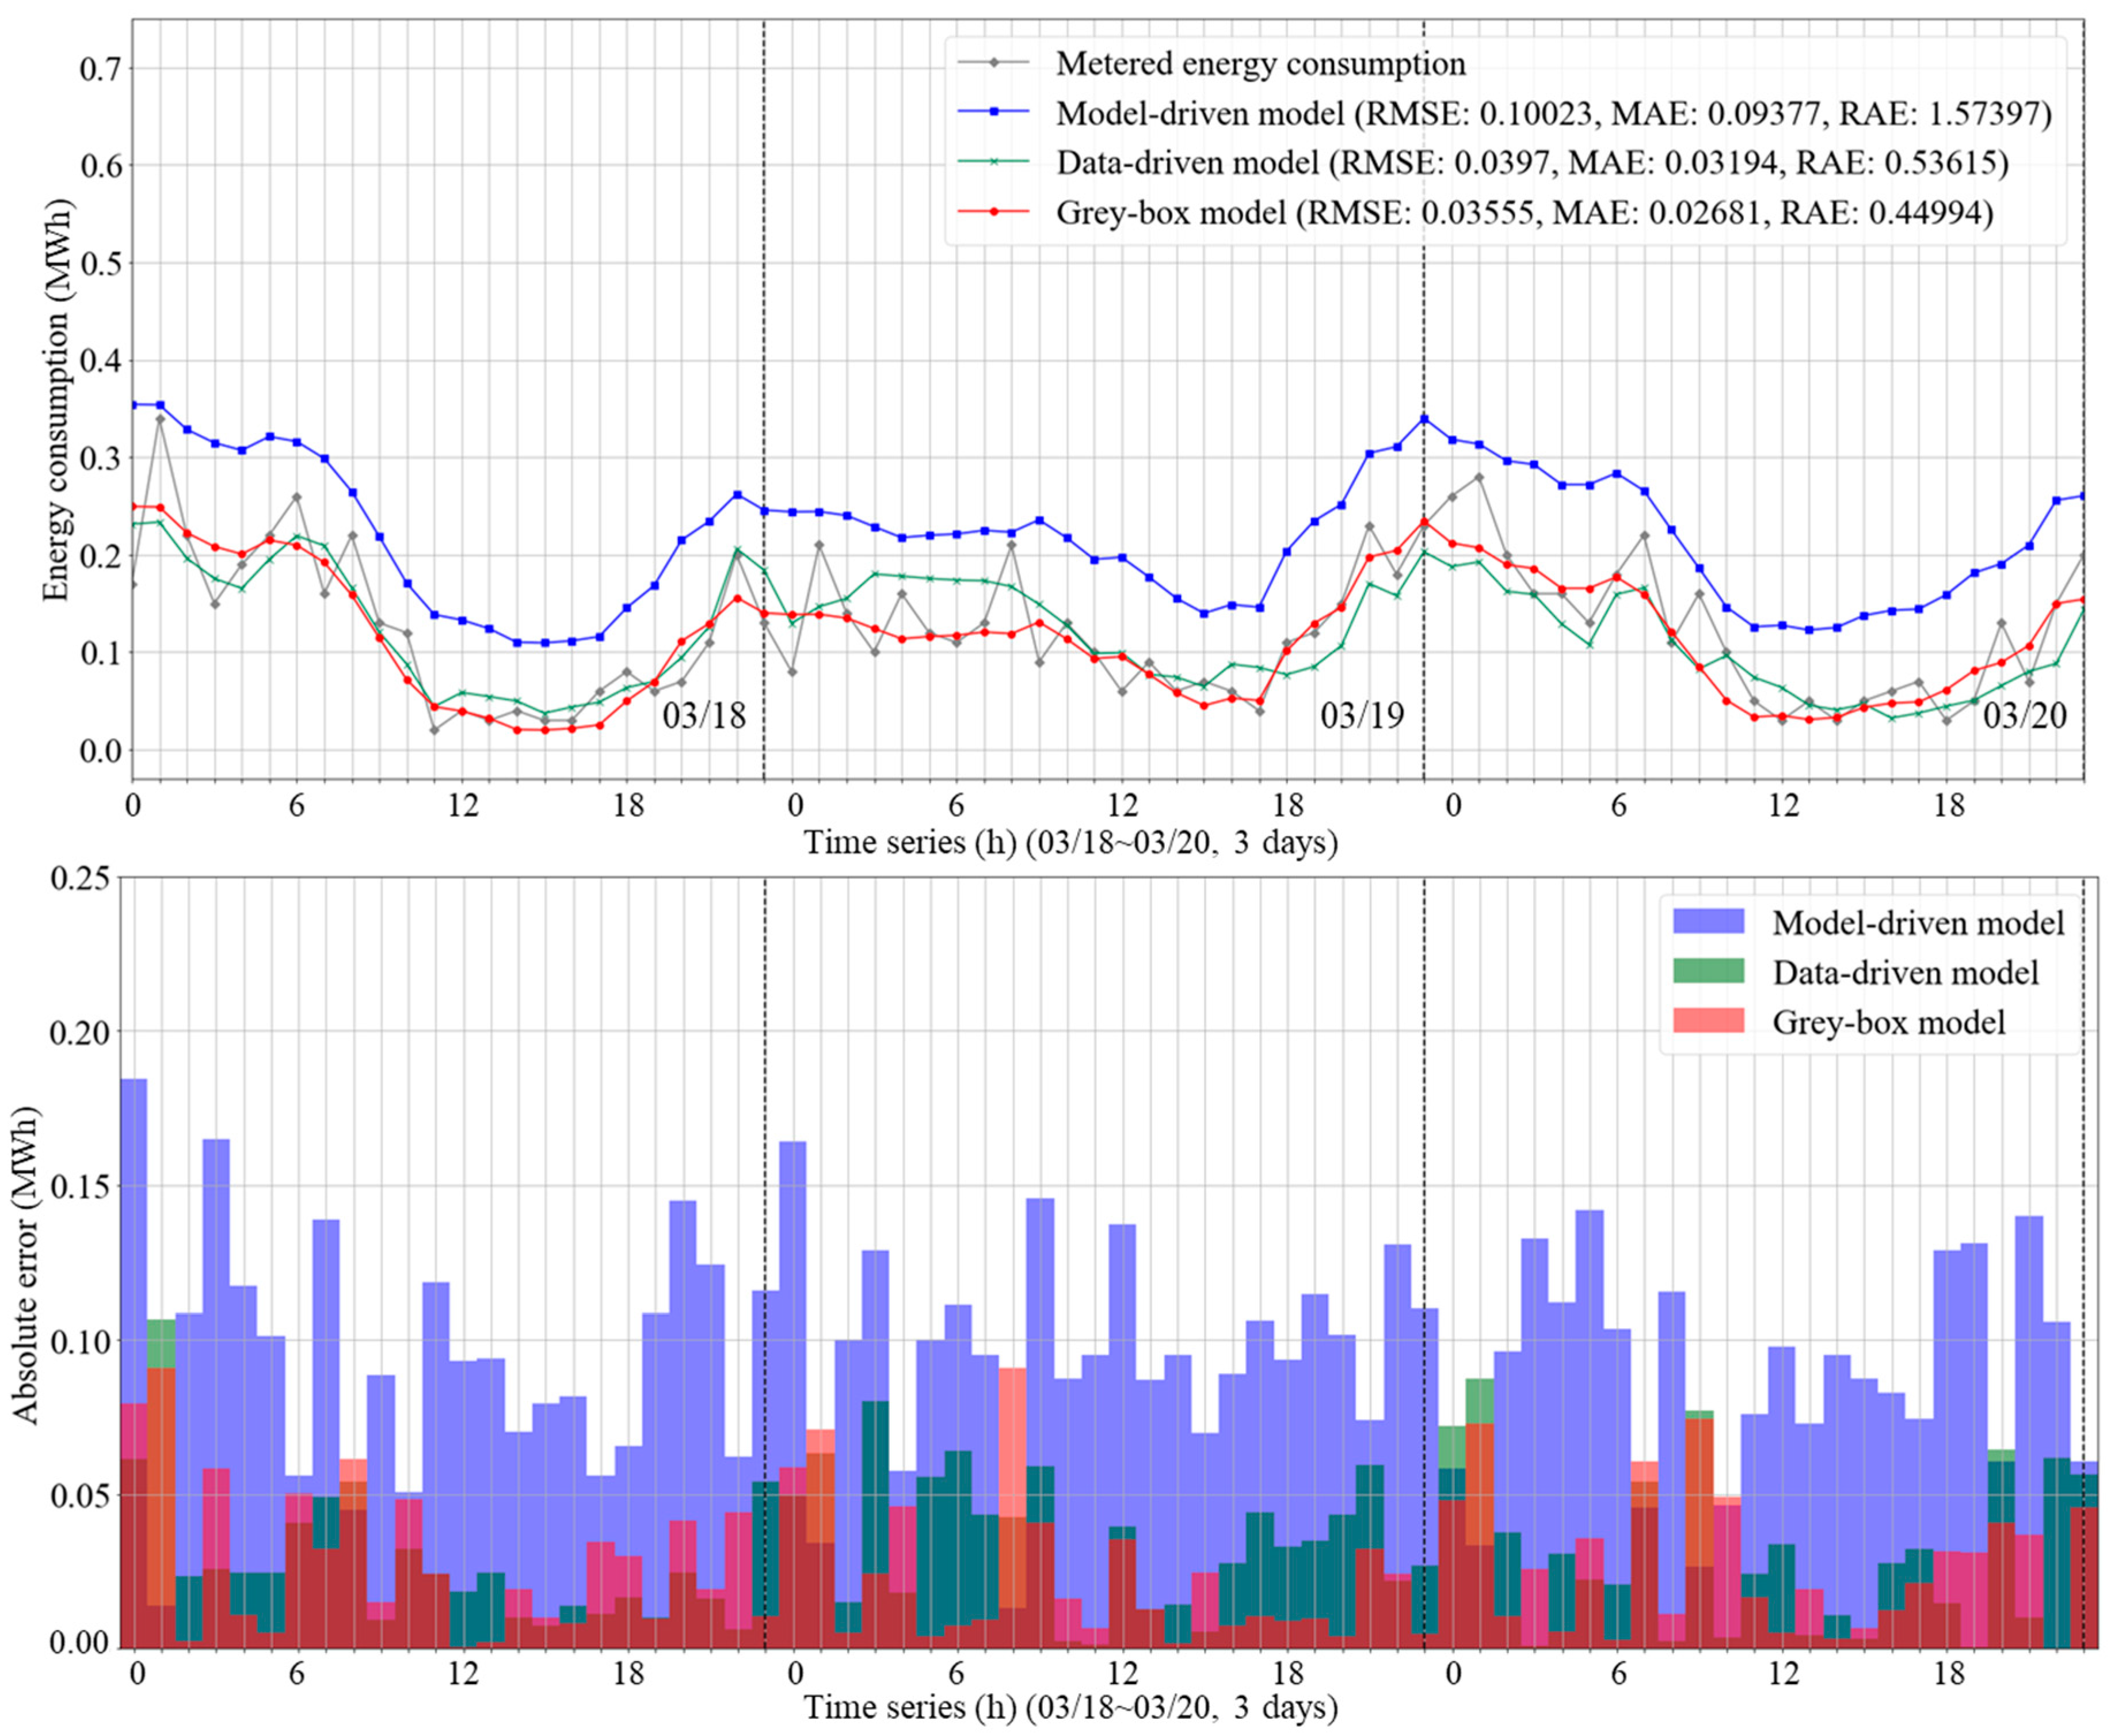
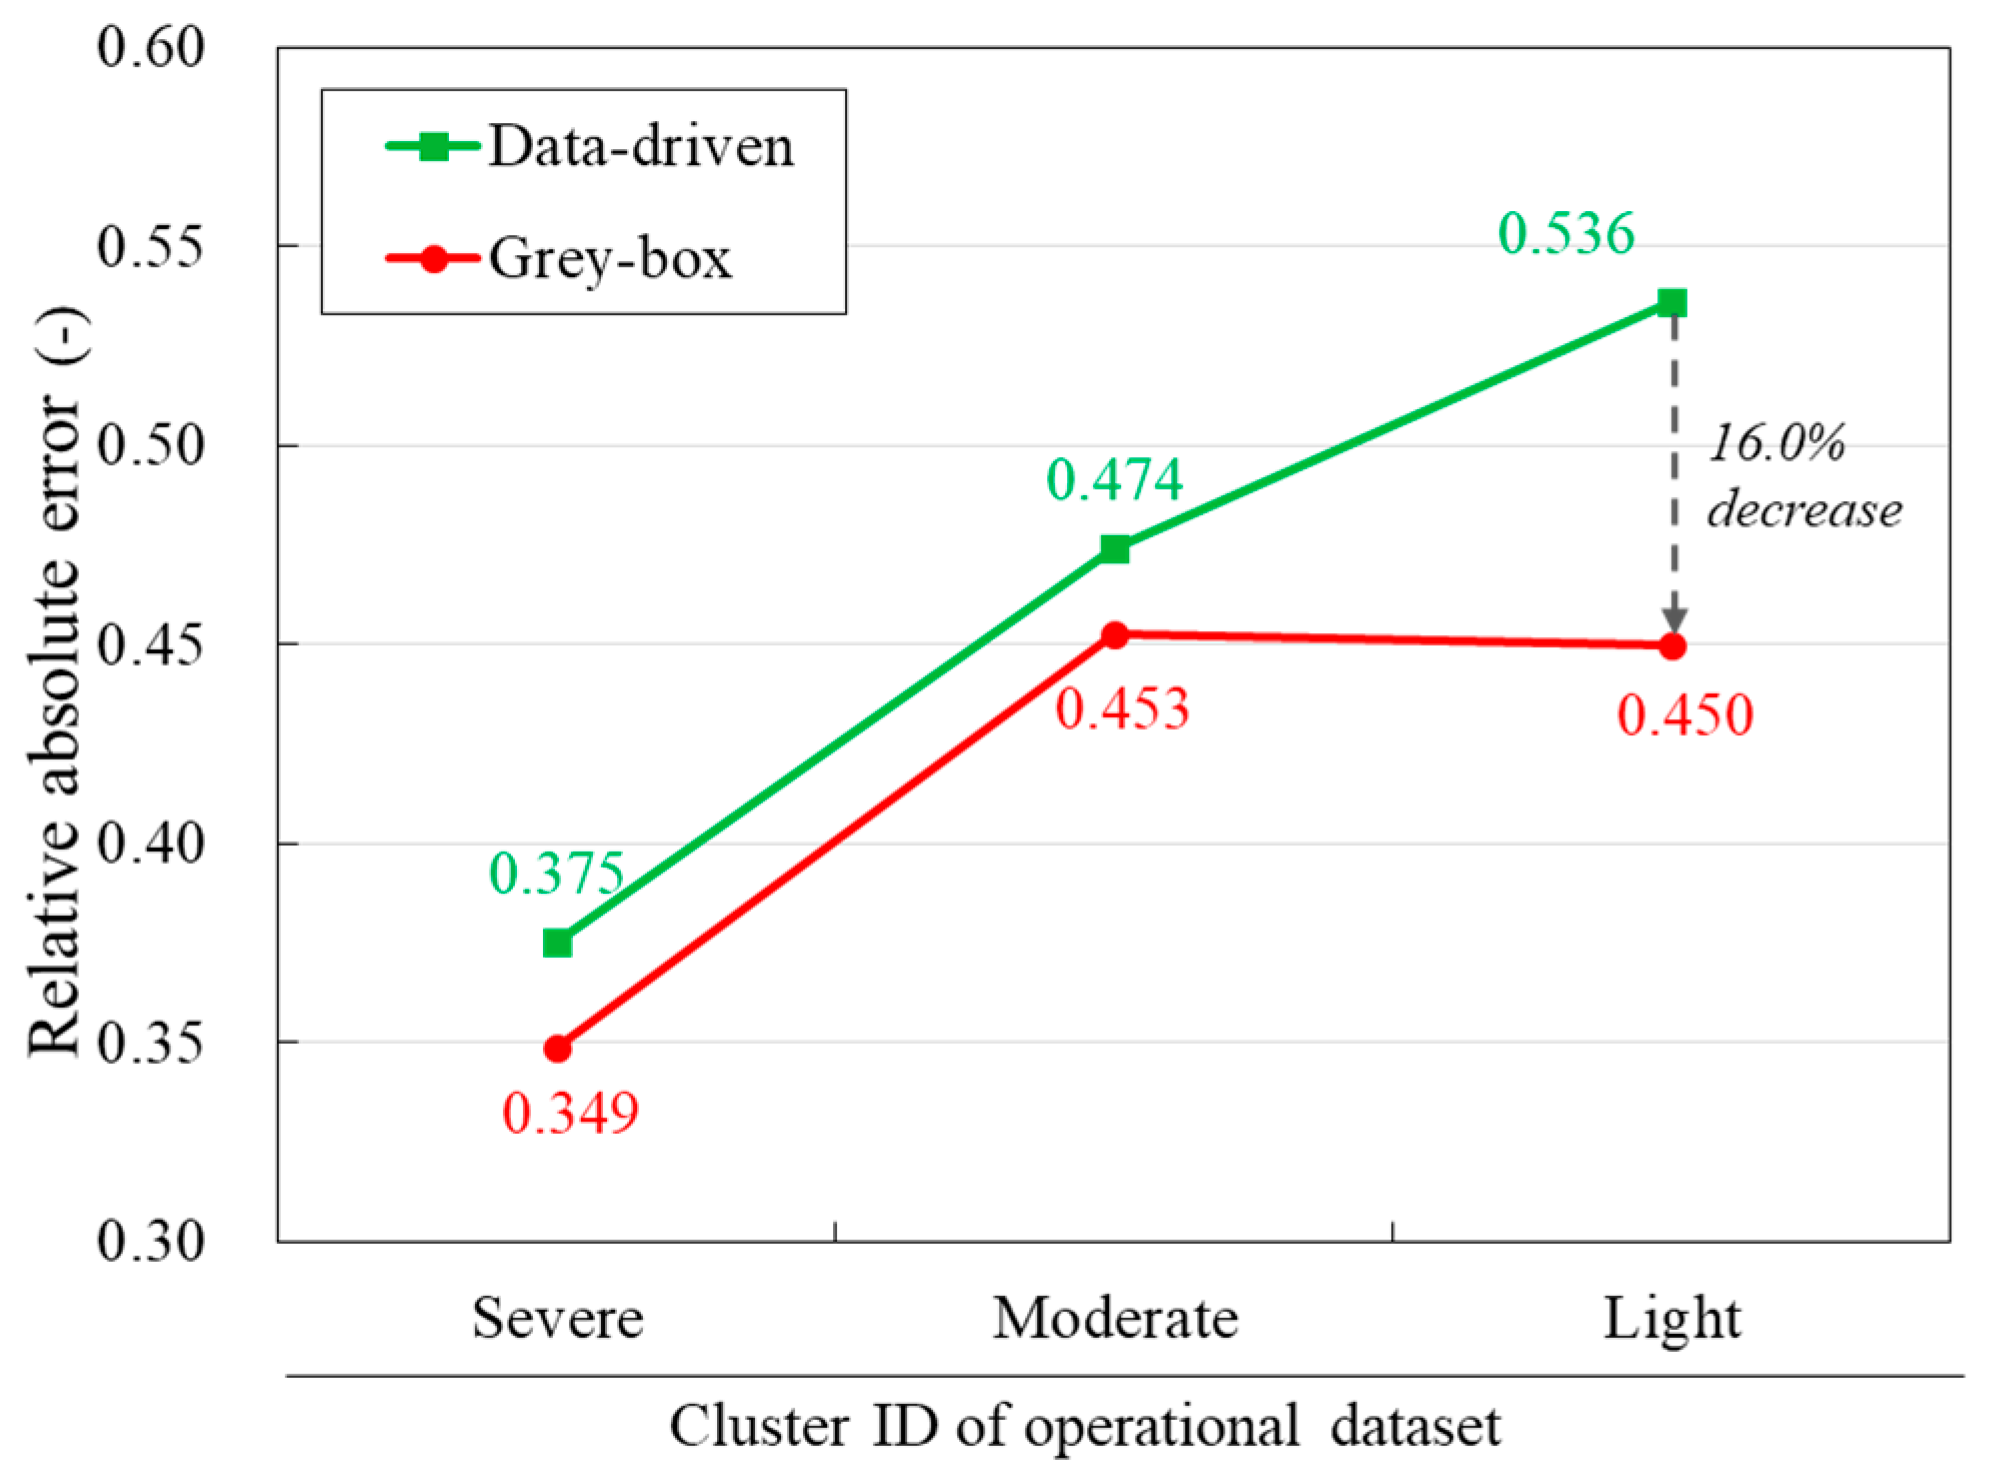
3.4. Data-Driven Virtual Sensor vs. Grey-Box Virtual Sensor under Different Testing Conditions (Test Conditions 2 and 3)

The data-driven and grey-box virtual sensors were compared with regard to the remaining test conditions; the comparison was based on the relative absolute error (RAE) index. The days corresponding to moderate and light clusters in the test dataset were included. Regarding the moderate cluster, as shown in Figure 10, the two virtual sensors exhibited slightly lower accuracies compared to those in the first test condition. This was because of the lower ratio of datapoints corresponding to the moderate cluster in the total training datasets.
For the light cluster testing condition, as shown in Figure 11, the RAE was considerably increased from 0.474 to 0.536 for the data-driven virtual sensor. This is because this testing condition was not included in the training dataset. This reveals that the issue of training data dependency exists with regard to developing virtual sensors for a building. Under these undesirable conditions, the grey-box virtual sensor surpassed the data-driven virtual sensor in terms of accuracy. The accuracy differences between the virtual sensors were the most significant when testing under low heating operation, which primarily corresponds to the light cluster, as shown in Figure 12. It showed a 16% improvement in the grey-box virtual sensor, compared to the data-driven virtual sensor. This means that the grey-box virtual sensor had a wider system operation coverage based on its combination of model-driven and data-driven features. Based on the results, in the case of a real building with limited datasets and physical sensors, the grey-box virtual sensor demonstrably overcame the training data dependency found for the data-driven virtual sensor. It was confirmed that the grey-box virtual sensor can be applied more effectively under varying system operation conditions and a building whose energy consumption is to be reduced by operators. The complete test results are summarized in Table 3.

4. Conclusions

Virtual sensor development and validation for determining DH energy consumption in a building was the focus of this study, and it considered the issue of sensor absence in real DH substations. Based on the suggested method, three virtual sensors were developed via the model-driven, data-driven, and grey-box approaches. Additionally, three test conditions were defined using the clustering method to account for daily heating energy patterns. According to the case study results, the data-driven and grey-box virtual sensors all showed reasonable estimation accuracies under the various operational uncertainties of the DHS. Specifically, the data-driven virtual sensor showed more accurate heating energy consumption predictions compared to those of the model-driven sensor. Unfortunately, the accuracy of the data-driven virtual sensor considerably decreased for operation patterns corresponding to low heating (Test Condition 3); this is because this condition was different from that found in the training datasets used. This indicated that a training data dependency issue is entailed in developing data-driven virtual sensors. The system operation patterns can change as a result of continuous monitoring and various energy conservation efforts; therefore, the virtual sensors are required to account for the entire operation range, including operating patterns different from those in the given training datasets. In such situations, based on the combined capabilities of model-driven and data-driven methods, the grey-box virtual sensor method could exhibit an enhanced estimation accuracy under various test conditions or a wider operation range. Thus, it can overcome the training data dependency issue observed for the data-driven virtual sensor.
As the suggested virtual sensors are developed based on the DH variables within the demand side of a building, they can be widely used as the replacement and backup purposes for continuous commissioning, monitoring, and fault detection in the terminal buildings.

Author Contributions

Conceptualization, J.K. (Joowook Kim); Data curation, Y.H.; Formal analysis, Y.C.; Investigation, J.K. (Jabeom Koo); Writing—original draft, S.Y.; Writing—review & editing, R.K. All authors have read and agreed to the published version of the manuscript.

Funding

This work was supported by Incheon National University (International Cooperative) Research Grant in 2018.

Acknowledgments

Authors thank ILPUM E&C Co., Ltd. for the technical support.

Conflicts of Interest

The authors declare no conflict of interest.

Nomenclature

Abbreviations
BASbuild automation system
DHSdistrict heating system
DPVdifferential pressure valve
FDDfault detection and diagnosis
LPMliter per minute
MAEmean absolute error
MLPmulti-layer perceptron
RAErelative absolute error
RMSEroot mean square error
RPMrevolutions per minute
TCVtemperature control valve
VRFvariable refrigerant flow
Greek Symbols
α regressed coefficient of polynomial
μ centroid of cluster
Symbols
aactual (true) value
a ¯ mean of actual value
Cpspecific heat
eestimated value
fpump control signal (frequency)
knumber of clusters
Mmass flow rate
ngeneral counter
Ppressure
QEnergy consumption
RHrelative humidity
Siith cluster
Ttemperature
ttime step
VTCV opening rate in the primary side
Subscripts
Datadata-driven
metermetered heating consumption from heat demand side
designdesign information
DHsecondary section
envenvironmental information
Greygrey-box
Hprimary section
Metermeter measurement
Modelmodel-driven
OAoutdoor air
retreturn side
supsupply side
syssystem information
VSvirtual sensor model

References

  1. Zhang, Q.; Tian, Z.; Ma, Z.; Li, G.; Lu, Y.; Niu, J. Development of the heating load prediction model for the residential building of district heating based on model calibration. Energy 2020, 205, 117949. [Google Scholar] [CrossRef]
  2. Gao, L.; Cui, X.; Ni, J.; Lei, W.; Huang, T.; Bai, C.; Yang, J. Technologies in smart district heating system. Energy Procedia 2017, 142, 1829–1834. [Google Scholar] [CrossRef]
  3. Li, H.; Yu, D.; Braun, J.E. A review of virtual sensing technology and application in building systems. HVAC R Res. 2011, 17, 619–645. [Google Scholar]
  4. Choi, Y.; Yoon, S. Virtual sensor-assisted in situ sensor calibration in operational HVAC systems. Build. Environ. 2020, 181, 107079. [Google Scholar] [CrossRef]
  5. Sun, J.; Dong, J.; Shen, B.; Li, W. Virtual pressure sensor for electronic expansion valve control in a vapor compression refrigeration system. Energies 2020, 13, 4917. [Google Scholar] [CrossRef]
  6. Qian, M.; Yan, D.; Liu, H.; Berardi, U.; Liu, Y. Power consumption and energy efficiency of VRF system based on large scale monitoring virtual sensors. Build. Simul. 2020, 13, 1145–1156. [Google Scholar] [CrossRef]
  7. Cheung, H.; Braun, J.E. Virtual power consumption and cooling capacity virtual sensors for rooftop units. In Proceedings of the International Refrigeration and Air Conditioning Conference, West Lafayette, IN, USA, 9–12 July 2014. [Google Scholar]
  8. Fang, T.; Lahdelma, R. State estimation of district heating network based on customer measurements. Appl. Therm. Eng. 2014, 73, 1211–1221. [Google Scholar] [CrossRef]
  9. Sajjadi, S.; Shamshirband, S.; Alizamir, M.; Yee, P.L.; Mansor, Z.; Manaf, A.A.; Altameem, T.A.; Mostafaeipour, A. Extreme learning machine for prediction of heat load in district heating systems. Energy Build. 2016, 122, 222–227. [Google Scholar] [CrossRef]
  10. Guo, Y.; Li, G.; Chen, H.; Hu, Y.; Shen, L.; Li, H.; Hu, M.; Li, J. Development of a virtual variable-speed compressor power sensor for variable refrigerant flow air conditioning system. Int. J. Refrig. 2017, 74, 73–85. [Google Scholar] [CrossRef]
  11. Ploennigs, J.; Ahmed, A.; Hensel, B.; Stack, P.; Menzel, K. Virtual sensors for estimation of energy consumption and thermal comfort in buildings with underfloor heating. Adv. Eng. Inform. 2011, 25, 688–698. [Google Scholar] [CrossRef]
  12. Zhang, Z.L. Temperature Control Strategies for Radiant Floor Heating Systems. Master’s Thesis, Concordia University, Montreal, QC, Canada, 2001. [Google Scholar]
  13. Almeida, L.B. Handbook of Neural Computation; Oxford University Press: Oxford, UK, 1997. [Google Scholar]
  14. He, K.; Zhang, X.; Ren, S.; Sun, J. Delving deep into rectifiers: Surpassing human-level performance on imagenet classification. In Proceedings of the International Conference on Computer Vision, ICCV, Santiago, Chile, 7–13 December 2015; pp. 1026–1034. [Google Scholar]
  15. Kingma, D.P.; Ba, J.L. Adam: A method for stochastic optimization. In Proceedings of the 3rd International Conference or Learning Representations, San Diego, CA, USA, 22 December 2015; pp. 1–15. [Google Scholar]
  16. Xue, P.; Zhou, Z.; Fang, X.; Chen, X.; Liu, L.; Liu, Y.; Liu, J. Fault detection and operation optimization in district heating substations based on data mining techniques. Appl. Energy 2017, 205, 926–940. [Google Scholar] [CrossRef]
  17. An, J.; Yan, D.; Hong, T. Clustering and statistical analyses of air-conditioning intensity and use patterns in residential buildings. Energy Build. 2018, 174, 214–227. [Google Scholar] [CrossRef]
  18. Bholowalia, P.; Kumar, A. EBK-Means: A clustering technique based on elbow method and k-means in WSN. Int. J. Comput. Appl. 2014, 105, 17–24. [Google Scholar]
Figure 1. Schematic diagram of the target district heating systems (DHS).
Energies 13 06013 g001
Figure 2. Flow chart for the proposed virtual sensor development.
Energies 13 06013 g002
Figure 3. Multi-layer perceptron structure of the designed virtual sensors.
Energies 13 06013 g003
Figure 4. Elbow method result for determining the number of clusters.
Energies 13 06013 g004
Figure 5. Clustering results for operation patterns.
Energies 13 06013 g005
Figure 6. Cluster composition in the MLP training dataset.
Energies 13 06013 g006
Figure 7. Three virtual sensor results for training datasets.
Energies 13 06013 g007
Figure 8. District heating (DH) energy consumption trends for the three virtual sensors for the training datasets.
Energies 13 06013 g008
Figure 9. District heating (DH) energy consumption trends for the three virtual sensors under Test Condition 1 (Severe Cluster).
Energies 13 06013 g009
Figure 10. District heating (DH) energy consumption trends for the three virtual sensors under Test Condition 2 (Moderate Cluster).
Energies 13 06013 g010
Figure 11. District heating (DH) energy consumption trends for the three virtual sensors under Test Condition 3 (Light Cluster).
Energies 13 06013 g011
Figure 12. Comparison between data-driven and grey-box virtual sensors.
Energies 13 06013 g012
Table 1. Settings for training the data-driven virtual sensor (Case 2) using multilayer perceptron.
Training ParametersSettings
Batch size/Epochs4/200
Training/validation ratio85%/15%
Early stoppingApplied with 10 epochs patience rule
Bias neuronsApplied at an input layer and all hidden layers
Bias/kernal initializationZero/Kaiming [14]
Number of neurons14 (input layer)-64-64-64-1 (output layer)
Loss functionMean squared error
OptimizerAdam [15]
Training period01/01–01/31 (Hourly time step)
Table 2. Settings for training the grey-box virtual sensor (Case 3) using regression.
Regression ParametersSettings
FunctionSecond-degree polynomial function
Number of coefficient3
Domain/RangeQmodel/Qmetered
Regression methodLeast squares
Training period01/01–01/31 (Hourly time step)
Table 3. Test results for the developed virtual sensors.
Virtual SensorRMSEMAERAE
Cluster IDCluster IDCluster ID
SevereModerateLightSevereModerateLightSevereModerateLight
Model-driven0.10430.116740.100230.093850.107780.93770.785951.337241.57397
Data-driven0.0580.050390.03970.044790.038230.031940.375090.474360.53615
Grey-box0.054640.04630.035550.041640.036480.026810.348730.452610.44994
Publisher’s Note: MDPI stays neutral with regard to jurisdictional claims in published maps and institutional affiliations.

