Article

Biomass Steam Gasification, High-Temperature Gas Cleaning, and SOFC Model: A Parametric Analysis

1
Department of Agricultural and Forestry Sciences (DAFNE), Tuscia University of Viterbo, Via San Camillo de Lellis, snc, 01100 Viterbo, Italy
2
Department of Industrial and Information Engineering and Economics, University of L’Aquila, Via San Giovanni Gronchi 18, 67100 L’Aquila, Italy
3
CREAT, Centro di Ricerca su Energia, Ambiente e Territorio, Università Telematica eCampus, 22060 Novedrate, Italy
4
Department of Nuclear, Subnuclear and Radiation Physics, Marconi University, 00193 Rome, Italy
*
Author to whom correspondence should be addressed.
Submission received: 5 October 2020 / Revised: 5 November 2020 / Accepted: 9 November 2020 / Published: 13 November 2020
(This article belongs to the Special Issue Hydrogen Production from Biomass)

Abstract

:
Gasification technology is actually one of the most effective ways to produce power and hydrogen from biomass. Solid oxide fuel cells (SOFCs) have proved to be an excellent energy conversion device. They can transform the chemical energy content in the syngas, produced by a gasifier, directly into electrical energy. A steady-state model of a biomass-SOFC was developed using process simulation software, ASPEN Plus (10, AspenTech, Bedford, MA, USA). The objective of this work was to implement a biomass-SOFC system capable of predicting performance under diverse operating conditions. The system is made of a gasification zone, gas cleaning steps, and SOFC. The SOFC modelling was done without external subroutines, unlike most models in the literature, using only the existing ASPEN Plus blocks, making the model simpler and more reliable. The analysis of the syngas composition out of each cleaning step is in accordance with literature data. Then, a sensitivity analysis was carried out on the main parameters. The results indicate that there must be a trade-off between voltage, electrical efficiency, and power with respect to current density and it is preferable to stay at a low steam-to-biomass ratio. The electrical efficiency achieved under the operating conditions is 57%, a high value, making these systems very attractive.

Graphical Abstract

1. Introduction

The extensive use of fossil fuels leads to negative environmental impacts due to greenhouse gas emissions and the air pollution problem. So, with the aim to satisfy the continual increase of energy demand, the replacement of the fossil fuels with a renewable and sustainable source is necessary to produce environmentally friendly energy. Nowadays, biomass represents an ideal energy source; in fact, it is widely available and has a very good relationship with the environment [1,2]. The global energy wood supply is estimated to be 0–23 Gm3/year (0–165 EJ/year). The woody biomass could satisfy 2–18% of the world’s primary energy consumption in 2050 [3]. If primary forests are excluded from the wood supply, then the potential decreases to 25%. Usually, the energy recovered from biomass through combustion is at low electrical efficiency, i.e., up to 20% [4]. In order to reach much higher efficiency, coupling systems of biomass gasification with advanced power generation have been developed: the gas turbine, internal combustion engine (ICE), and solid oxide fuel cell (SOFC) are the most common types of coupling [5,6,7,8,9]. These combined heat and power (CHP) units on a small scale, based on gasification, can use an ICE or micro and small gas turbine with electrical efficiencies up to 25% of the biomass lower heating value (LHV) [10]. Biomass gasification coupled with SOFC gives electrical efficiencies up to 60% [11]. The SOFC has become a very important energy technology, due to its clean, greener, and efficient operation [12,13]. Fuel cells allow conversion of the energy with high efficiency; in fact, they convert the chemical energy contained in a fuel gas directly to electrical energy by electrochemical reactions [14]. Because of this direct energy conversion, their efficiency is higher than conventional electricity generation technologies [15]. These cells, consisting of two electrodes separated by an ion-conducting electrolyte, operate at high temperatures between 600 and 1100 °C and, for this characteristic, they can utilize a wide spectrum of fuels [16]. The oxidation energy of gaseous fuels is used by the SOFC in the anode in the presence of an oxidant in the cathode, usually air, to produce electricity from hydrogen [17,18]. The most important advantages of the solid oxide fuel cells are: the ability to consume CO as a fuel, high energy conversion efficiency thanks to the high rate of reaction kinetics, ability to incorporate bottom cycles to generate additional power from the high-temperature exhaust stream, no need for noble metal, and the ability to reform hydrocarbons, which determinates fuel flexibility. The main disadvantage includes the thermal and mechanical stress of materials being affected by high temperatures [15]. In the last years, many works were carried out to study the optimal operating conditions, the overall system performance, and the limitations and the potentials of a variety of SOFC power plants integrated with biomass gasification systems. However, the current commercial process simulation software packages do not include built-in models for SOFC. In the literature, the most common SOFC system modelling approach is to integrate process simulators with a stack model in a programming language, such as Fortran, C++, and so on [18,19,20]. This way of working needs a subroutine, which has to include chemical/electrochemical reactions and heat and mass transfer, making this approach difficult to develop and use. The first one who proposed a method to avoid the creation of an external subroutine to call in the process simulators was Zhang et al. [21], who used existing ASPEN Plus unit operation blocks without linking with other software. The model proposed by Zhang was developed based on literature descriptions of a tubular internal reforming SOFC technology from Siemens-Westinghouse, and then was validated against experimental data. For the voltage calculations, Zhang used a semi-empirical correlation developed using a reference polarization curve. The sensitivity analysis that was carried out shows that the cell net electrical efficiency reaches a maximum value of 52% when the utilization factor Uf is 85% and any increase of Uf will increase the CO2 concentration at the anode outlet stream. Doherty et al. [22], based on the previous work of Zhang et al., simulated a 100 kWe biomass power plant based on Gibbs free energy minimization and developed an SOFC model using ASPEN Plus blocks. They performed heat and mass balances and considered ohmic, activation, and concentration losses for the voltage calculation, estimating a net electrical efficiency of around 33%. The model proposed by Doherty et al. is capable of predicting system performance under various operating conditions and using diverse fuels. Starting from a gas composition, Doherty et al. investigated the effects of varying the current density (jcell), the steam-to-carbon ratio, and the Uf on SOFC stack performance. The results indicate that there must be a compromise between voltage, efficiency, and power with respect to jcell and the stack should be operated at a low steam-to-carbon ratio and high Uf. In both Zhang et al. and Doherty et al., the simulation of the SOFC on ASPEN Plus, considering a natural gas and syngas input, respectively, was modelled by the presence of an ejector, a pre-reformer besides an anode, a cathode, a burner, and heaters. In the present paper, we developed the whole configuration plant of the CHP, considering a temperature approach gasification model, innovative gas cleaning steps, and the SOFC, based on a simplification of the model proposed by Zhang and Doherty. The gasifier considered is a fluidized bed, based on the UNIQUE concept [23,24] and simulated with the quasi-equilibrium approach [25,26,27,28,29,30], which allows a more accurate description of the syngas composition. This approach was introduced for the first time by Gumz [31], then Marcantonio et al. [32], and based on it, implemented and validated in a biomass-gasification system. the syngas obtained is composed of the standard CO, H2, CO2, CH4, and H2O components but also organic (tar) and inorganic contaminants (H2S and NH3) were taken into account. Before syngas can be used to generate heat and power in combined cycles, these contaminants must be partially or totally removed. Hot cleaning is recommended because it destroys tars and because high biomass to electricity efficiencies can be obtained [33]; the gas cleaning and conditioning used in this paper was implemented in Marcantonio et al. [34]. The cleaned syngas is fed to the SOFC. The aim of this study was to start from two previous papers: Marcantonio at al. [32], in which a simulation of biomass gasification by means of ASPEN Plus was simulated and developed, and Marcantonio et al. [34], in which innovative gas cleaning through catalytic methods was proposed and investigated. The clean syngas obtained was used in the present paper to evaluate the performance of an SOFC system using an ASPEN Plus simulation, without an external subroutine.
The biomass considered for this study was agricultural waste, in order to have zero costs for the feedstock and avoid fuel vs. food biomass competition.

2. Simulation Model

2.1. Assumptions

The following assumptions were considered in modelling the processes shown in Figure 1:
  • Process is steady state and isothermal [35];
  • Drying and pyrolysis take place instantaneously and volatile products mainly consist of H2, CO, CO2, CH4, and H2O [25,36];
  • Char is 100% carbon [37,38];
  • All gases behave ideally;
  • Catalyst is defined as conventional solid;
  • The tars considered are toluene and benzene;
  • The inorganic contaminants assumed are hydrogen sulphide and ammonia; and
  • Uniform SOFC operating temperature and pressure.

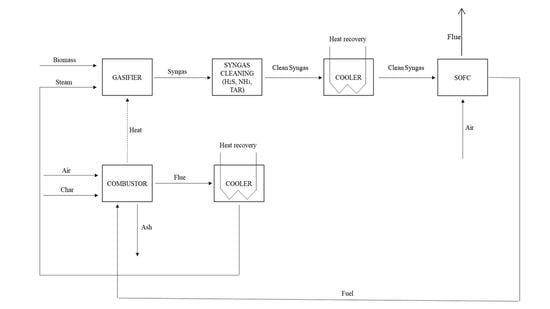
2.2. Process Scheme, Plant, and Model Description

The simplified process scheme under investigation is shown in Figure 1 as a block diagram. The flowsheet developed for the simulation on ASPEN Plus is shown in Figure 2 and all unit operations are described in Table 1.
The simulation under investigation focused on a gasifier producing hazelnut shell-gas that feeds an SOFC. The stream BIOMASS, represented in Figure 2, is made by hazelnut shells and the mass flow rate (mbio) is set to 180 kg/h (the plant input size is 1 MWth considering HHV). This stream feeds the DECOMP block, simulated by a RYield reactor, which simulates the decomposition of the unconventional feed into its conventional components (according to the biomass ultimate analysis in Table 2). The product from DECOMP is moved to the RSTOIC block, which simulates the formation of NH3 and H2S through the following reactions:
1 2 N 2 + 1.5   H 2 N H 3 ,
H2 + S → H2S,
where, fractional conversion for H2S is considered to be equal to 1 and for NH3 equal to 0.5 [37]. Stream S2 out of the RSTOIC block goes into a separator, called SEP, which separates the stream into three sub-streams: VOLATILE, CHAR, and H2SNH3, which are, respectively, the volatile part, the char part, and the stream made of ammonia and hydrogen sulphide. Then, the VOLATILE stream is divided into two sub-streams: VOL, which is mixed with the oxidizing fluid and sent to the gasifier GASIF; and H2, which is used to simulate tar production in the RStoic block called TARPROD. The CHAR stream is separated into two sub-streams: S4 to represent the char reacted in the gasifier and S3 to represent the unreacted char. The tar formation is assumed as toluene and benzene. The amount of production of tar is fixed at 7 g/Nm3 (Nm3 is considered at the standard temperature of 25 °C and standard pressure of 1 bar) of toluene and 8 g/Nm3 of benzene by a Design specs on the stream of H2 and S3 based on the literature [38]. The streams AIR, OXYG, and STEAM were integrated within the model for data fit reasons; in fact, the data fit, better explained in Section 2.3, is based on experimental data, which use steam and/or air and/or oxygen as an oxidizing agent, making the model feasible for a wide range of case studies with different combinations of gasification agent. Then, the stream S5 represents the gasification agent. In the present case study, only steam is fed. The stream S4 is split into two sub-streams that represent the amount of char that moves into the combustor COMBUST and into the gasifier GASIF. The stream S8 is the stream that represents the real output of the gasifier; in fact, it is made of the union of GASRAW, NH3H2S, and TAR streams. Before going to the SOFC, syngas S8 needs to be clean; for this reason, the following blocks were added: a RGibbs reactor DOLOMITH, which simulates dolomite reactions at high temperatures to lower tar; a RStoic reactor CANDLE, which represents the catalytic filter reaction; and a REquil reactor ZNOZNS, which simulates the reaction of ZnO with H2S. The syngas cleaned goes into the SOFC system, developed by the use of a REquil ANODE, which simulates the anode; a separator CATHODE, which simulates the cathode; a RStoic reactor AFTERBURN, which simulates the combustion of the fuel; and an exchanger EX05.

Auxiliary Description

The heat recovery is represented by the coolers used in the model simulation. The first recover is made by the exchanger EX01, which uses the heat of the flu from the combustor to heat up the air to the combustor. The exchanger EX06 follows the EX01 using the remaining heat of the flu to vaporize water and obtain steam to feed the gasifier. The exchanger EX02 heats up the syngas cleaned in the anode and cools the syngas out of the candle to the ZNOZNS cleaning block. Then, the exchanger EX03 cools again the syngas to the ZNOZNS block. The exchanger EX04 is part of the SOFC modelling and it heats up air to the cathode using in counter-current the stream out of the burner AFTERBUR. The following exchanger EX05 uses the residual heat contained in the stream out of the AFTERBUR to heat up the stream WAT.

2.3. Gasification Model

The reactions considered in the gasification process are reported in Table 3. Boudouard reaction is not considered in this simulation since it is slower compared to water–gas reaction and it does not achieve kinetic equilibrium, causing destabilization in reactor behavior [41].
Equations (4)–(7) of Table 3 are the chemical reactions considered in this work for the gasification process according to [32] and the gasification model was already validated in Marcantonio et al. [32]. The operating conditions of the gasification system are reported in Table 4.

2.4. In-Bed Gas Cleaning

All the in-bed gas cleaning and conditioning technology simulated was already shown in an author’s previous paper of Marcantonio et al. [34].

2.5. SOFC Model

The SOFC modelling on ASPEN Plus is based on a simplification of the models developed by Doherty et al. and Zhang et al. [21,22], as shown in Figure 2 and explained in Section 2.2. The equations involved in the modelling were developed by the authors, as described and previously validated [44].
The operative conditions of the plant are reported in Table 4.

3. Results and Discussion

The composition of the syngas out of the gasifier, the sorbent reactor, the candle filter, and the sulphur removal reactor is shown in Table 5. The validation of the gasification model was carried out in a previous authors’ work [43].
As shown in Table 5, the steps of the gas cleaning proposed in the simulation are valid and allow clean syngas under the contaminants’ limits for SOFC to be obtained.
The cold gas efficiency η CG of the system is evaluated as:
η CG = LHV syngas   ×   m syngas LHV biomass   ×   m biomass ,
and it is equal to 0.79.
The thermal energy balance reveals that the power heat needed by the combustor is 367 kW, so a Design Specs was built in order to split the stream S25 and provide the required power heat to the COMBUST by means of the stream S26.

3.1. Effect of Steam to Biomass (S/B) Ratio

Figure 3 represents the effect of the S/B ratio on the syngas composition (reported in the y-axis as wet mole fraction) out of the gasifier at a gasification temperature of 800 °C for the hazelnut shells. It can be noticed that the concentrations of H2 and CO2 rise to a peak with the increase of the S/B ratio while the concentrations of CO and CH4 drop with the S/B ratio. The increase of the steam enhances the reaction (4) and (7) of Table 3, which results in an increase of the H2 and CO2 concentrations to a peak followed by a decrease; however, the CO concentration lowers with an increasing S/B ratio by the reaction (6), which reduces the CO reacting with steam and increases the H2 and CO2 concentrations until a peak. Then, after an S/B ratio of 0.4 and 0.7, the CO2 and H2 concentrations decrease respectively. The literature shows similar trends [45,46].
Figure 4 shows the effect of the S/B ratio on the electrical efficiency of the SOFC and Figure 5 shows the effect of the S/B ratio on the current density (A/m2) Jcell. An increasing steam to biomass ratio increases the electrical efficiency until a peak, then it negatively affects the efficiency. Moreover, an increasing steam to biomass ratio increases the current density, thanks to the modification of the anode temperature and gaseous component partial pressure, which reduces the Nerst voltage and increases the voltage losses. For this reason, is preferable to operate at a low S/B ratio. The cell voltage is calculated using the Nerst equation. i cell is the Current (A), which is calcolated by i cell = 4 · F · n O 2 , required . j cell is the current density (A/m2) j cell = i cell A cell . Power density is given by the multiplication of V and j cell . The cell electrical efficiency is then calculated according to:
η e l = C u r r e n t   ( A ) · V   ( V ) n s y n g a s ( mol / s ) · L H V s y n g a s   ( J / mol ) .
where n s y n g a s ( mol s )   and L H V s y n g a s   ( J mol ) are the input flow rate and the LHV of the syngas feeding the SOFC.
At the S/B ratio used for the simulation (S/B = 0.5), the electrical efficiency achieved with the SOFC is 63%.

3.2. Effect of Current Density

Figure 6, Figure 7 and Figure 8 show the effects of varying the current density j cell on the system. Increasing j cell decreases the voltage and electrical efficiency but increases power until a peak, then power decreases. The descending trend of the cell voltage shown in Figure 6 is due to higher voltage losses (ohmic, activation, and concentration). The reduction of the electrical efficiency with the current density is shown in Figure 8. The trends obtained from the sensitivity analysis are in good agreement with literature ones [21,22].
A typical operating current density range is 1800–2000 A/m2 [47], corresponding to a cell voltage of 1.1 V a power of 850 W/m2 and an electrical efficiency of 57%.

3.3. Influence of CO Concentration and Air Flow Rate on SOFC Power Production

A sensitivity analysis on the SOFC power production, varying the inlet air and the mole fraction of CO inlet to the ANODE block, was carried out. As shown in Figure 9, increasing the concentration of CO allows an increase of the SOFC power (Q-net SOFC, in the y-axis) produced. In fact, more CO favors the water–gas shift reaction, which is an exothermic one. This means that the cell requires less heat duty and can give more.
In Figure 10, the trend of SOFC power production with respect to the mass flow of air to the cathode is reported. The increase in air mass flow corresponds to an increase in power production.
Considering the concentration of CO equals 20% and the flow rate of 90 kg/h for the air into the cathode, the SOFC power production is around 25 kW.

4. Conclusions

The present paper showed a whole plant composed by a gasification part, a gas cleaning unit, and SOFC system. This is one of the few works available in the literature that includes all the parts. This simulation was developed using ASPEN Plus. The system is capable of predicting performances under different operating conditions. The composition of the gas produced by the gasifier was evaluated by varying the S/B ratio and it was noticed that hydrogen increase with the increasing of S/B ratio. The catalytic filter allows greater production of hydrogen and carbon monoxide, thanks to high-temperature tar reforming.
The SOFC model was developed utilizing exiting ASPEN Plus functions and unit operation blocks without using external subroutines, and this allowed a reduction of the complexity and ensured short computational times. A sensitivity analysis was carried out in order to evaluate the influence of the current density and steam-to-biomass ratio on the system. The investigation revealed that it is preferable to work at a low S/B ratio in order to inhibit CO2 formation in the exhausted gas and to have higher electrical efficiency. Then, there must be a trade-off between voltage, power, and electrical efficiency with respect to the current density. Considering a value of jcell between 1800 and 2000 A/m2, the values obtained for voltage, power, and electrical efficiency are respectively 1.1 V, 850 W/m2, and 57%. Finally, we showed that increasing the concentration of CO and air inlet to the SOFC increases the SOFC power production.

Author Contributions

Data curation, V.M. and E.B.; Formal analysis, A.D.C.; Investigation, E.B.; Software, V.M.; Supervision, D.M., A.D.C. and E.B.; Validation, L.D.Z.; Visualization, M.V.; Writing—original draft, V.M.; Writing—review and editing, V.M., A.D.C. and E.B. All authors have read and agreed to the published version of the manuscript.

Funding

This research has received funding from the European Union’s Horizon 2020 research and innovation program under grant agreement No 815284.

Acknowledgments

This research has received funding from the European Union’s Horizon 2020 research and innovation program under grant agreement No 815284 BLAZE project.

Conflicts of Interest

The authors declare no conflict of interest.

References

  1. Mirmoshtaghi, G.; Skvaril, J.; Campana, P.E.; Li, H.; Thorin, E.; Dahlquist, E. The Influence of different parameters on biomass gasification in circulating fluidized bed gasifiers. Energy Convers. Manag. 2016, 126, 110–123. [Google Scholar] [CrossRef]
  2. Yang, K.; Zhu, N.; Ding, Y.; Chang, C.; Yuan, T. Thermoeconomic analysis of an integrated combined cooling heating and power system with biomass gasification. Energy Convers. Manag. 2018, 171, 671–682. [Google Scholar] [CrossRef]
  3. Lauri, P.; Havlík, P.; Kindermann, G.; Forsell, N.; Böttcher, H.; Obersteiner, M. Woody Biomass Energy Potential in 2050. Energy Policy 2014, 66, 19–31. [Google Scholar] [CrossRef]
  4. Boehman, A.L.; Le Corre, O. Combustion of syngas in internal combustion engines. Combust. Sci. Technol. 2008, 180, 1193–1206. [Google Scholar] [CrossRef]
  5. Gholamian, E.; Zare, V. A comparative thermodynamic investigation with environmental analysis of SOFC waste heat to power conversion employing Kalina and organic rankine cycles. Energy Convers. Manag. 2016, 117, 150–161. [Google Scholar] [CrossRef]
  6. Di Carlo, A.; Borello, D.; Bocci, E. Process simulation of a hybrid SOFC/mGT and enriched air/steam fluidized bed gasifier power plant. Int. J. Hydrogen Energy 2013, 38, 5857–5874. [Google Scholar] [CrossRef]
  7. De Lorenzo, G.; Fragiacomo, P. Energy analysis of an SOFC system fed by syngas. Energy Convers. Manag. 2015, 93, 175–186. [Google Scholar] [CrossRef]
  8. Lan, W.; Chen, G.; Zhu, X.; Wang, X.; Liu, C.; Xu, B. Biomass gasification-gas turbine combustion for power generation system model based on ASPEN PLUS. Sci. Total. Environ. 2018, 628–629, 1278–1286. [Google Scholar] [CrossRef]
  9. Villarini, M.; Marcantonio, V.; Colantoni, A.; Bocci, E. Sensitivity analysis of different parameters on the performance of a CHP internal combustion engine system fed by a biomass waste gasifier. Energies 2019, 12, 688. [Google Scholar] [CrossRef] [Green Version]
  10. Barelli, L.; Bidini, G.; Cinti, G.; Ottaviano, A. SOFC regulation at constant temperature: Experimental test and data regression study. Energy Convers. Manag. 2016, 117, 289–296. [Google Scholar] [CrossRef]
  11. Kakaç, S.; Pramuanjaroenkij, A.; Yang, X. A review of numerical modeling of solid oxide fuel. Cells 2007, 32, 761–786. [Google Scholar]
  12. Chiodo, V.; Galvagno, A.; Lanzini, A.; Papurello, D.; Urbani, F.; Santarelli, M.; Freni, S. Biogas reforming process investigation for SOFC application. Energy Convers. Manag. 2015, 98, 252–258. [Google Scholar] [CrossRef]
  13. Eisavi, B.; Chitsaz, A.; Hosseinpour, J.; Ranjbar, F. Thermo-environmental and economic comparison of three different arrangements of solid oxide fuel cell-gas turbine (SOFC-GT) hybrid systems. Energy Convers. Manag. 2018, 168, 343–356. [Google Scholar] [CrossRef]
  14. Kuchonthara, P.; Bhattacharya, S.; Tsutsumi, A. Combination of thermochemical recuperative coal gasification cycle and fuel cell for power generation. Fuel 2005, 84, 1019–1021. [Google Scholar] [CrossRef]
  15. Fung, A.S. Performance of biogas fueled hybrid solid oxide fuel cell (SOFC) and gas turbine cycle. ASME 2018, 2, 1–11. [Google Scholar]
  16. Hauck, M.; Herrmann, S.; Spliethoff, H. science direct simulation of a reversible SOFC with Aspen Plus. Int. J. Hydrogen Energy 2017, 42, 10329–10340. [Google Scholar] [CrossRef]
  17. Sadhukhan, J.; Zhao, Y.; Leach, M.; Brandon, N.P.; Shah, N. energy integration and analysis of solid oxide fuel cell based microcombined heat and power systems and other renewable systems using biomass waste derived syngas. Ind. Eng. Chem. Res. 2010, 49, 11506–11516. [Google Scholar] [CrossRef] [Green Version]
  18. Riensche, E.; Achenbach, E.; Froning, D.; Haines, M.; Heidug, W.; Lokurlu, A.; von Andrian, S. Clean combined-cycle SOFC power plant—Cell modelling and process analysis. J. Power Sources 2000, 86, 404–410. [Google Scholar] [CrossRef]
  19. Palsson, J.; Selimovic, A.; Sjunnesson, L. Combined solid oxide fuel cell and gas turbine systems for efficient power and heat generation. J. Power Sources 2000, 86, 442–448. [Google Scholar] [CrossRef]
  20. Fuller, T.A.; Chaney, L.J.; Wolf, T.L.; Kesseli, J.; Nash, J.; Hatvigsen, J. A novel cell/microturbine combined-cycle system. J. Power Sources 2000, 86, 404–410. [Google Scholar]
  21. Zhang, W.; Croiset, E.; Douglas, P.; Fowler, M.; Entchev, E. Simulation of a tubular solid oxide fuel cell stack using AspenPlusTM unit operation models. Energy Convers. Manag. 2005, 46, 181–196. [Google Scholar] [CrossRef]
  22. Doherty, W.; Reynolds, A.; Kennedy, D. Computer simulation of a biomass gasi fi cation-solid oxide fuel cell power system using Aspen Plus. Energy 2010, 35, 4545–4555. [Google Scholar] [CrossRef] [Green Version]
  23. Barisano, D.; Canneto, G.; Rep, M. Deliverable 5.2: UNIfHY 1000 Long Term Tests and Further Hardware Modifications; University of Leeds: Woodhouse, UK, 2018. [Google Scholar]
  24. Moneti, M.; Di Carlo, A.; Bocci, E.; Foscolo, P.; Villarini, M.; Carlini, M. Influence of the main gasifier parameters on a real system for hydrogen production from biomass. Int. J. Hydrogen Energy 2016, 41, 11965–11973. [Google Scholar] [CrossRef]
  25. Li, X.; Grace, J.; Watkinson, A.; Lim, C.; Ergüdenler, A. Equilibrium modeling of gasification: A free energy minimization approach and its application to a circulating fluidized bed coal gasifier. Fuel 2001, 80, 195–207. [Google Scholar] [CrossRef]
  26. Baruah, D.; Baruah, D.C. Modeling of biomass gasification: A review. Renew. Sustain. Energy Rev. 2014, 39, 806–815. [Google Scholar] [CrossRef]
  27. Loha, C.; Chatterjee, P.K.; Chattopadhyay, H. Performance of fluidized bed steam gasification of biomass–Modeling and experiment. Energy Convers. Manag. 2011, 52, 1583–1588. [Google Scholar] [CrossRef]
  28. Xie, J.; Zhong, W.; Jin, B.; Shao, Y.; Liu, H. Simulation on gasification of forestry residues in fluidized beds by Eulerian–Lagrangian approach. Biores. Technol. 2012, 121, 36–46. [Google Scholar] [CrossRef] [Green Version]
  29. Nguyen, T.D.; Seo, M.W.; Lim, Y.-I.; Song, B.; Kim, S.-D. CFD simulation with experiments in a dual circulating fluidized bed gasifier. Comput. Chem. Eng. 2012, 36, 48–56. [Google Scholar] [CrossRef]
  30. Gungor, A. Modeling the effects of the operational parameters on H2 composition in a biomass fluidized bed gasifier. Int. J. Hydrogen Energy 2011, 36, 6592–6600. [Google Scholar] [CrossRef]
  31. Gumz, W. Gas Producers and Blast Furnaces; University of Michigan: Ann Arbor, MI, USA, 1950. [Google Scholar]
  32. Marcantonio, V.; Bocci, E.; Monarca, D. Development of a chemical quasi-equilibrium model of biomass waste gasification in a fluidized-bed reactor by using Aspen Plus. Energies 2019, 13, 53. [Google Scholar] [CrossRef] [Green Version]
  33. Olivares, A.; Aznar, M.P.; Caballero, M.A.; Gil, J.; Frances, A.E.; Corella, J. Biomass gasification: Produced gas upgrading by in-bed use of dolomite. Ind. Eng. Chem. Res. 1997, 36, 5220–5226. [Google Scholar] [CrossRef]
  34. Marcantonio, V.; Bocci, E.; Ouweltjes, J.P.; Del Zotto, L.; Monarca, D. Evaluation of sorbents for high temperature removal of tars, hydrogen sulphide, hydrogen chloride and ammonia from biomass-derived syngas by using Aspen Plus. Int. J. Hydrogen Energy 2020, 45, 6651–6662. [Google Scholar] [CrossRef]
  35. Ye, G.; Xie, N.; Qiao, W.; Grace, J.R.; Lim, C.J. Modeling of fluidized bed membrane reactors for hydrogen production from steam methane reforming with Aspen Plus. Int. J. Hydrogen Energy 2009, 34, 4755–4762. [Google Scholar] [CrossRef]
  36. Demirbaş, A. Carbonization ranking of selected biomass for charcoal, liquid and gaseous products. Energy Convers. Manag. 2001, 42, 1229–1238. [Google Scholar] [CrossRef]
  37. Torres, W.; Pansare, S.S.; Goodwin, J.G. Hot gas removal of tars, ammonia, and hydrogen sulfide from biomass gasification gas. Catal. Rev. 2007, 49, 407–456. [Google Scholar] [CrossRef]
  38. Rapagnà, S.; Orazio, A.D.; Gallucci, K.; Ugo, P. Hydrogen rich gas from catalytic steam gasification of biomass in a fluidized bed containing catalytic filters. Chem. Eng. Trans. 2004, 37, 157–162. [Google Scholar]
  39. Di Carlo, A.; Borello, D.; Sisinni, M.; Savuto, E.; Venturini, P.; Bocci, E.; Kuramoto, K. Reforming of tar contained in a raw fuel gas from biomass gasification using nickel-mayenite catalyst. Int. J. Hydrogen Energy 2015, 40, 9088–9095. [Google Scholar] [CrossRef]
  40. Jang, D.H.; Kim, H.T.; Lee, C.; Kim, S.H.; Doherty, W.; Reynolds, A.; Kennedy, D.; Kong, X.; Zhong, W.; Du, W.; et al. Gasification of hazelnut shells in a downdraft gasifier. Energy 2002, 27, 415–427. [Google Scholar]
  41. Franco, C.; Pinto, F.; Gulyurtlu, I.; Cabrita, I. The study of reactions influencing the biomass steam gasification process. Fuel 2003, 82, 835–842. [Google Scholar] [CrossRef]
  42. Doherty, W.; Reynolds, A.; Kennedy, D. The effect of air preheating in a biomass CFB gasifier using ASPEN Plus simulation. Biomass Bioenergy 2009, 33, 1158–1167. [Google Scholar] [CrossRef] [Green Version]
  43. Marcantonio, V.; De Falco, M.; Capocelli, M.; Bocci, E.; Colantoni, A.; Villarini, M. Process analysis of hydrogen production from biomass gasification in fluidized bed reactor with different separation systems. Int. J. Hydrogen Energy 2019, 44, 10350–10360. [Google Scholar]
  44. Di Carlo, A.; Bocci, E.; Naso, V. Process simulation of a SOFC and double bubbling fluidized bed gasifier power plant. Int. J. Hydrogen Energy 2013, 38, 532–542. [Google Scholar]
  45. Florin, N.H.; Harris, A.T. Hydrogen production from biomass coupled with carbon dioxide capture: The implications of thermodynamic equilibrium. Int. J. Hydrogen Energy 2007, 32, 4119–4134. [Google Scholar] [CrossRef]
  46. Inayat, A.; Ahmad, M.M.; Yusup, S.; Mutalib, M.I.A.; Inayat, A.; Ahmad, M.M.; Yusup, S.; Mutalib, M.I.A. Biomass steam gasification with in-situ CO2 capture for enriched hydrogen gas production: A reaction kinetics modelling approach. Energies 2010, 3, 1472–1484. [Google Scholar] [CrossRef] [Green Version]
  47. Doherty, W.; Reynolds, A.; Kennedy, D. Simulation of a tubular solid oxide fuel cell stack operating on biomass syngas using Aspen Plus. J. Electrochem. Soc. 2010, 157, 5–11. [Google Scholar] [CrossRef] [Green Version]
Figure 1. Simplified block diagram of biomass gasification, syngas cleaning, and the SOFC system.
Energies 13 05936 g001
Figure 2. Flowsheet of the simulation under investigation (the hatched streams are heat streams, representing thermal recovery; the continuous streams are material streams).
Energies 13 05936 g002
Figure 3. Effect of the S/B ratio on syngas composition.
Energies 13 05936 g003
Figure 4. Effect of the S/B ratio on electrical efficiency.
Energies 13 05936 g004
Figure 5. Effect of the S/B ratio on current density.
Energies 13 05936 g005
Figure 6. Effect of current density on cell voltage.
Energies 13 05936 g006
Figure 7. Effect of current density on power density.
Energies 13 05936 g007
Figure 8. Effect of current density on electrical efficiency.
Energies 13 05936 g008
Figure 9. Influence of CO concentration on SOFC power production.
Energies 13 05936 g009
Figure 10. Influence of the air flow rate to the cathode on SOFC power production.
Energies 13 05936 g010
Table 1. Description of ASPEN Plus flowsheet unit operation presented in Figure 1.
ASPEN Plus NameBlock IDDescription
RYIELDDECOMPRYield reactor—converts the non-conventional stream “BIOMASS” into its conventional components
RSTOICRSTOICRStoic reactor—replicates ammonia and hydrogen sulphide
CANDLERStoic reactor—represents the catalyst filter reaction
AFTERBURRStoic reactor—replicates the 100% combustion of hydrogen and carbon monoxide
TARPRODRStoic reactor—represents the production of C7H8 and C6H6
COMBUSTRStoic reactor—replicates the combustion of char
SEPSEPSeparator—divides the biomass in three streams: volatile, char and a stream of NH3 and H2S
SEPH2Separator—divides a certain part of hydrogen used to produce tar
CATHODESeparator—replicates the cathode of the SOFC
SEPZNSSeparator—separates the ZNS solid fraction
MIXERMIX1Mixer—mixes oxidising fluid with combustible fluid
MIX2Mixer—unify the product from gasifier with ammonia and hydrogen sulphide
MIX3Mixer—unify the stream S3 and H2
MIX 4Mixer—unify the product from GASIF with tar
FSPLITSPLITSplitter—divides char unreacted (S3) from char to burn (S4)
SPLIT 2Splitter—divides char to gasifier and to combustor
SPLIT 3Splitter—splits fuel to afterburner and to combustor
RGIBBSGASIFGibbs free energy reactor—represents the gasification zone
DOLOMITHGibbs free energy reactor—simulates the high temperature reaction od dolomite with NH3, H2S and tar
REQUILZNOZNSREquil reactor—simulates the reaction of ZnO with H2S
ANODEREquil reactor—simulates the anode of the SOFC
HeatXEX01Heatx—heats up the air to combustor
EX02Heatx—cools the stream out of candle and heats the one out of ZNOZNS
EX04Heatx—preheats the incoming air to cathode and cools the stream from afterburner
EX05Heatx—preheats the water with residual heat of afterburner
EX06Heatx—heats the water coming out of the EX05 to steam
HeaterEX03Heater—cools the stream in input to ZNOZNS
Table 2. Physical and chemical properties of hazelnut shells [39,40].
Bulk density (kg/m3)319.14
Moisture content (wt%)7.90
Proximate analysis (%wt, dry basis)Ash = 0.77; Volatile Matter = 62.70; Fixed Carbon = 24.04
Ultimate analysis (%wt, dry basis)C = 49.00; H = 6.03; N = 0.22; O = 42.06; Cl = 0.76; S = 0.67
Heating values (MJ/kgdry)HHV = 20.20; LHV = 18.85
Table 3. Gasification reactions [42,43].
ReactionReaction NameReaction Number
Heterogeneous reaction
C + 1 2   O 2   CO Char partial combustion(3)
C +   H 2 O   CO +   H 2 Water-gas(4)
Homogeneous reactions
  H 2 + 1 2   O 2     H 2 O H 2 partial combustion(5)
CO +   H 2 O   CO 2 +   H 2 CO shift(6)
  CH 4 +   H 2 O     CO + 3 H 2 Steam-methane reforming(7)
Table 4. The operating conditions of the system.
Thermal Power Input of the Gasifier (mbio·HHVbio) 1 MWth
Temperatures Ambient (biomass, combustion air and water for steam production)20 °C
Gasifier/gasification zone—product gas 800 °C
Gasifier—steam in 400 °C
Gasifier/combustion zone—exhaust gas800 °C
Gasifier/combustion zone—combustion air in 400 °C
Sorbent reactor for sulphur removal 400 °C
SOFC anode910 °C
Afterburner/combustion zone - exhaust gas910 °C
S/B ratio 0.5
System operating pressure 1 bar
Table 5. Composition of the syngas.
Component Out of the Gasifier (Stream S8)Out of the Sorbent Reactor DOLOMITH (Stream S10)Out of the Candle Filter CANLDE (Stream S12)Out of the Sulphur Removal ZNOZNS
H2 (%wet mole fraction)32.132.341.841.8
CO (%wet mole fraction)14.814.918.318.3
CO2 (%wet mole fraction)13.813.912.712.7
H2O (%wet mole fraction)29.530.022.322.3
CH4 (%wet mole fraction)4.24.30.40.4
NH3 (ppm)1719.086.478.975.0
H2S (ppm)2287.0345.0315.00.8
C7H8 (g/Nm3)13.12.60.020.02
C6H6 (g/Nm3)12.05.30.030.03
Publisher’s Note: MDPI stays neutral with regard to jurisdictional claims in published maps and institutional affiliations.

