Impact of Wall Constructions on Energy Performance of Switchable Insulation Systems


1
Department of Electromechanical, Systems & Metal Engineering, Ghent University, 9052 Ghent, Belgium
2
Civil, Environmental, and Architectural Engineering Department, University of Colorado Boulder, Boulder, CO 80309, USA
*
Author to whom correspondence should be addressed.
Energies 2020, 13(22), 6068; https://0-doi-org.brum.beds.ac.uk/10.3390/en13226068
Submission received: 26 October 2020
/
Revised: 13 November 2020
/
Accepted: 17 November 2020
/
Published: 19 November 2020
(This article belongs to the Special Issue Innovative Energy Efficiency Technologies for High Performance Buildings)
Abstract
:This paper evaluates the potential energy savings when switchable insulation systems (SIS) are applied to walls of residential buildings located in Belgium and other locations in Europe. The study considers two low-energy prototypical dwellings (an apartment and a detached house) that are representative of post-2010 constructions and renovations in Belgium. Using an 3R2C-based analysis tool, the performance of both dwellings is evaluated with static and dynamic wall insulation systems. First, the switchable insulating system is described along with its associated simple 2-step rule-based control strategy. Then the modeling strategy and simulation analysis tools are presented. In Belgium, it was found that SIS-integrated walls allow energy savings up to 3.7% for space heating and up to 98% for cooling. Moreover, it was found that to further reduce the energy consumption of SIS-integrated buildings in various European climates, thermal mass placement needs to be considered. By optimizing the placement and the parameters of the various wall layers, it is possible to increase the space heating savings by up to a factor of 4 and those of cooling by up to a factor of 2.5.
1. Introduction
In Belgium, the residential sector’s contribution to total energy use is estimated to be of 20.1% during 2017 [1]. In comparison, the industrial sector used 26.0% and the tertiary sector is responsible for 13.4% of the total energy consumption. Heating energy represented on average 73.5% of the total residential energy use [1]. This high value is due to the relatively cold climate of Belgium combined with the fact that a vast majority of the housing stock is made of single-family units instead of apartments [2].
Energy efficiency policies in Belgium regarding buildings are set by the regional governments (as opposed to the federal government), there are therefore three different implementations of such policies [3]. These are all based on the European directive 2010/31/UE and further updated periodically [4]. All residential buildings must be audited when they are sold or rented, new constructions must also obtain an Energy Performance of Buildings (EPB) certificate. A proportion of 29% of buildings in the Flemish region were built after 1981, for the Walloon region this housing segment is 19.1% and for the Brussels region it is 6%, making the existing Belgian housing stock relatively old [5]. Low energy residential buildings, as defined by the TABULA study, are a set of typical traits of recent well-insulated houses. These traits include minimum U-values for the building envelope components, and air infiltration rates [3]. The retrofit potential of the Belgian housing stock is therefore significant; the savings in primary energy use can reach 38% of the initial consumption for a low energy retrofit according to the IEE-TABULA study (Intelligent Energy Europe Program, Typology Approach for Building Stock Energy Assesment) [3]. Since the retrofitting of older residential buildings has been studied in the IEE-TABULA study, the scope of this study will therefore be limited to the benefits of using dynamic insulation materials (DIM)/switchable insulation systems (SIS) envelope components on the newest Low Energy residential specification.
The optimization of building envelope components has been extensively studied in Europe and other parts of the world. The placement of the insulation layer in a multilayer wall has been investigated by Kossecka et al. [6]. The insulation thickness of a multilayer wall was optimized for various climates in France by Aïssani [7] and Sambou [8]. Moreover, thermal inertia for a typical Belgian residential dwelling was studied by Nicolas et al. [9]. Other studies focused on integrating phase change materials (PCMs) in building envelopes and using double skin facades (DSFs). In particular, Baudoin et al. studied the effect of multiple building parameters for the Belgian climate including the integration of PCMs in walls for a prototypical office. De Gracia et al. [10] showed experimentally that a wall integrated with PCMs yielded up to 29% in heating energy use during winter conditions of a Mediterranean climate. The same authors studied, both experimentally and through simulations, the effect of PCMs on cooling energy needs of buildings in various climates [11]. They reported that the potential for cooling energy reduction through PCM-integrated walls occurs principally in climates with mild summers. Soares et al. conducted a review of the existing studies on PCM latent energy storage in buildings [12] then optimized the PCM-drywall properties of a lightweight steel-framed residential building in various European climates [13]. Diaconu et al. studied experimentally a double-layered PCM wall structure and showed potential for reduced heating loads in a continental temperate climate [14]. Kuznik et al. analyzed the thermal comfort of two office buildings in real world conditions to assess the effect of PCMs [15]. Mandilaras et al. performed a monitoring analysis of a Greek house fitted with PCM wall layers for half a year [16]. Castel et al. studied the energy efficiency benefits of using PCM as a layer of a brick wall in Mediterranean climates [17]. Jin et al. performed a parametric analysis on PCM wall layer attributes, including their placement inside a wall [18]. Osterman et al. showed that PCM can be used differently as a wall layer to free cool and free heat an office [19]. Moreover, Gratia et al. showed that when combined with natural ventilation strategies, DSF had the potential to reduce cooling and heating energy consumptions of commercial buildings [20]. Andjelković et al. derived the mathematical thermal model for the double skin façade for a prototypical office and arrived at findings similar to those of the previously cited study [21]. Fallahi et al. showed that judicious thermal mass placement in a double skin façade allowed for significant energy consumption reduction both for heating and cooling [22].
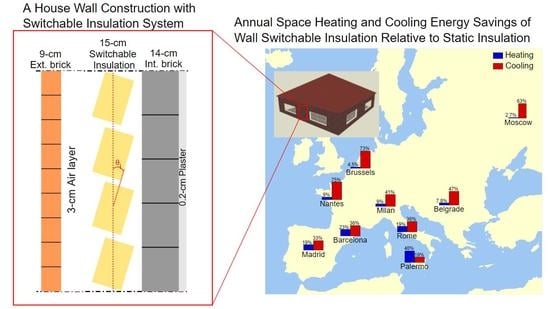
While static building envelope components have been investigated for the Belgian residential building stock, to the best of the authors’ knowledge, no study has ever been conducted to quantify the energy savings achievable by the use of switchable insulation systems in Belgium. Several DIM/SIS technologies suitable for integration with building envelope have been reported in the literature. For instance, one DIM technology applied to walls and roofs consists of an insulation layer that allows different types of inert gases to circulate; the different gas types have different thermal conductivities allowing the DIM element (walls) to effectively change its thermal resistance (R-value) [23,24]. A prototypical SIS system (Figure 1) was developed by Dabbagh and Krarti [25] and evaluated in laboratory conditions. The system replaces the static insulation in a wall by rotating insulating panels, the system’s R-value is controlled by adjusting the angle of rotation , and the air cavity is assumed to be closed.
Dynamic insulation materials (DIM) and switchable insulation systems (SIS) in a building’s envelope aim at reducing the energy used for space heating and cooling by allowing the building to regulate its insulation levels based on indoor and outdoor conditions. The benefits of using DIM and SIS applied to the building envelope of commercial [23] and residential [26] buildings have been studied for various climates in the US as well as for residential buildings in Spain [27].
This study aims at studying the effect of such materials and systems implemented in the walls of two typical Belgian dwellings. The potential energy savings obtained from this technology will reduce the utility costs as well as greenhouse gas emissions of buildings. In particular, Belgium shares the European Union’s target to reduce greenhouse gas emissions by 40% by 2030 and 80% by 2050 compared to the 1990 levels [28].
2. Modeling Approach
2.1. Thermal Model
The residential building model used in this study is the 3R2C (3 resistors-2 capacitors) model implemented in the Matlab environment, developed for DIM walls, and validated using a state-of-the-art building energy modeling tool, Energy Plus, by Park et al. [23]. This model was further refined and used in studies performed by Menyhart et al. [26] and Martínez et al. [27]. This model is a single zone-model that accounts for the details of building constructions including the thickness, thermal conductivity, density, and heat capacity of each layer of walls, roofs, and floors. In this study, the DIM walls’ effect will be analyzed in the Belgian climates. Figure 2 presents a schematic representation of an external wall model, where each layer of the wall includes two nodes, i.e., two capacitances and three resistances (one for conduction inside the material and the two others for heat transfer to the adjacent materials). The model accounts for short wave radiation at the exterior surface of the wall as well as convection and long-wave radiation at both the exterior and interior surfaces of the wall. Using this weather data input, the material properties and the previous time step’s model state, the thermal energy stored in each layer of the building envelope and in the ambient air is updated at each time step. Moreover, the dynamic model accounts for the impacts of interior gains, ventilation, and infiltration on thermal heating and cooling loads of the building.
2.2. Control Strategy
To evaluate the potential benefits of dynamic insulated walls using switchable insulation systems (SISs) in Belgium, a 2-step rule-based control was employed as shown in Figure 3. The rules determine, for each time step (i.e., 15 min for this study), whether the high or low R-value should be used. In Belgium, it is customary due to the cold climate to use a seasonal HVAC control, meaning a year is split into a heating season and a cooling season. This means that during the heating period, no cooling energy may be used; the HVAC system can either heat the building or be inactive (dead-band mode). Depending on the time of the year (heating or cooling season) and the temperatures of the different nodes of the wall, the thermal resistance level is selected [23,26,27]. During the heating season, the default R-value is high; when the outside surface of the wall (Tso) is warmer than the inside surface (Tsi) and the inside temperature of the wall (Tm) and the outside surface temperature is greater than the set point temperature (Tset), the R-value goes to its low value. This favors heat transfer into the dwelling, allowing free heating. During the cooling season, the opposite is true; when possible the heat transfer through the walls is outwards (i.e., free cooling). When the HVAC system is in a dead-band mode, the same rule set is applied based on the season; this effectively lowers the HVAC load of future timesteps. The rule-based controls can be applied independently to each surface of the building envelope integrated with SIS; in this study they were applied only to the exterior walls. Since Belgium is a relatively cold climate, most of the potential energy savings are specific to the heating energy end-use, this is especially true since most Belgian residential buildings are not equipped with air conditioning systems. However, potential savings for cooling energy end-use will also be evaluated as an indicator of the level of comfort of the dwelling occupants during warmer periods. Indeed, any potential cooling energy savings equate to a lower mean ambient temperature if no cooling system is present, which improves the occupant’s comfort.
2.3. Building Models
Two typical Belgian dwellings are considered for this study. According to a survey conducted in 2011 [2], single-family dwellings represented 85.7% of all Belgian households. Therefore, a prototypical single-family house is selected as the first dwelling type for this study. In the same survey, apartments represented 15.4% of the Belgian housing stock. Thus, the second dwelling used for this study is a prototypical apartment. The prototypical house is chosen as detached (i.e., no adiabatic surfaces) and the prototypical apartment as an enclosed type from four sides (i.e., only two non-adiabatic walls) to study the impact of static and dynamic insulation systems applied to building envelope elements for two dwelling types. In this study, the windows are considered unobstructed at all times. The specific features for the prototypical dwellings are extracted from the IEE-TABULA study [3] using the most recent construction types (low-energy standard) to compare the performance of dynamic insulation systems relative to the thicker static insulation levels found in low energy buildings. The main characteristics of the prototypical residential buildings are summarized in Table 1, Table 2 and Table 3.
The typical dwellings’ energy use presented in the IEE-TABULA study [3] are obtained using the Flemish EPB (energy performance of buildings) calculation method, which is found to overestimate, on average, the space heating and DHW (domestic hot water) energy use of buildings [29]. To align the prototypical buildings’ energy use with that of their respective reference consumptions, the models have been calibrated by adjusting the internal load schedules and power densities as listed in Table 2 for the two prototypical dwellings.
2.4. General Analysis Approach
The objective of this study is to evaluate the potential annual energy savings obtained when applying SIS technology to the walls of residential buildings in Belgium and ultimately other European climates. This analysis is carried out using the calibrated models of the selected prototypical low energy detached house and enclosed apartment and using three locations representative of the climates in Belgium; Oostende, Brussels, and St Hubert (from mildest to harshest). The high R-value setting for the SIS is set as the R-value defined from the calibrated model; this means an R-value of 3.9 (K.m2/W). The low R-value corresponds to the R-value of the wall without any insulation as shown in experimental testing of the SIS technology [17]. The energy performance of the two prototypical dwellings equipped with the dynamic insulation is then compared to that of the corresponding baseline case with static insulation (i.e., with high R-value). Moreover, a sensitivity analysis is conducted to assess the impact of the exterior wall construction on the SIS energy performance. Finally, the modified wall construction is tested in other European climates.
3. Results and Analysis
3.1. Annual Energy Savings in Belgium
Table 4 presents the annual energy savings obtained when SIS walls are applied to both the prototypical detached house and apartment for the three climates representatives for Belgium. The heating energy savings are largest in the milder climates (Brussels and Oostende) for the prototypical detached house. However, for the prototypical apartment, the heating energy savings increase when the climate is colder. The inversed trend is probably due to the lower thermal inertia of the apartment, which allows for faster heat transfer response due to any indoor-outdoor temperature variations, thus shorter periods are available for SIS to take advantage of free heating. The higher thermal mass of the prototypical house does not allow for outer surface and internal wall temperatures to reach high enough levels to permit significant free heating. The potential for cooling energy savings is greatest in St Hubert for both dwellings due to the lower maximal day temperatures compared to Brussels, but also lower nighttime temperatures, which increase the free cooling potential. Brussels has the lowest relative cooling energy savings due to its high daytime temperatures and higher (than St Hubert) nighttime temperatures.
3.2. Sensitivity Analysis on Thermal Mass
In this section, the impacts of thermal mass and the insulation placement on the performance of SIS for the two prototypical dwellings in Brussels are further investigated. It has been reported that when placed on the outside, static insulation can reduce both heating and cooling energy end-uses [30]. In this analysis, thermal mass level and insulation layer placement is investigated for both statically and dynamically insulated exterior walls. To vary the thermal mass of the walls, the thicknesses or the density levels (i.e., use different materials) of the internal and external brick layers are modified as discussed in the following sections.
3.2.1. Impact of Internal Brick Layer Properties
Table 5 shows the differences in annual heating energy consumption for three different inner layer brick thicknesses including 14 cm (baseline), 7 cm, and 25 cm. In both static and dynamic wall cases, reducing the brick thickness increases the annual heating energy consumption, while increasing it reduces this consumption. Compared to the baseline dwelling with 14 cm brick wall and static insulation, the thicker brick allows for 1.73% heating energy savings for the static case and 4.76% for the dynamic case. When compared with the static insulation case of each brick thickness, SIS-integrated walls save 3.30% for the thinner layer and only 3.08% for the thicker layer. Thus, the benefit of the dynamic insulation is slightly reduced as the internal brick layer becomes thicker.
As indicated in Table 5, the cooling energy savings due to dynamic wall insulation follow the opposite pattern than the heating energy savings since a thicker inner brick layer reduces the cooling energy savings from 61.83% (baseline case with 14 cm thickness) to 54.15% (for a 25 cm thick brick layer). Indeed, the thicker layer increases the R-values of the wall, especially at the low R-value setting, resulting in less heat transfer between outdoors and indoors and thus reducing the potential for nighttime free cooling during the summer. In Brussels, the thicker brick layer decreases the total annual energy use, as the heating energy savings are more than twice the cooling energy savings. Since when adjusting the brick layer thickness, not only the thermal mass is changed but also the R-value of the wall is affected, it is useful to evaluate the case when only the density of the brick layer is varied, possibly through the use of different brick material.
The results of a similar analysis are summarized in Table 6 for various densities of the interior brick layer of the wall. The baseline brick density is 1200 kg/m3. As part of the parametric analysis, the brick density is increased to 1500 kg/m3 and decreased to 900 kg/m3; these values are representative of the different types of bricks used in Belgium and in the surrounding regions [31]. As noted, based on the previous analysis, reducing the thermal mass of the brick layer is detrimental to the space heating energy consumption. For the static insulation case, minimal variation in heating energy use is obtained when the density is changed (less than 0.1%). Similarly, for the case of the dynamic walls, when increasing the density from 1200 kg/m3 to 1500 kg/m3, heating energy savings increased only slightly from 3.30% to 3.32% compared to the baseline static wall for the apartment model. The effect of the dynamic wall is better evaluated when comparing each case with its statically equivalent insulated wall as presented in Table 6. For the baseline case of 1200 kg/m3 density, the dynamic walls lower the space heating energy needs by 3.30% while the reduction is 3.28% for the denser exterior layer of the wall and is 3.01% for the less dense interior wall layer. In all three cases, the dynamic walls are beneficial compared to static walls, with heating energy savings remaining in the same order of magnitude.
While not significant compared to heating energy use, SIS-integrated walls lower cooling energy use, independently of the brick density. The cooling energy savings associated with dynamic walls increase with the brick density, the opposite of the trend found with the increase in brick layer thickness. Indeed, a denser brick wall can store more free cooling energy available during the nighttime and thus reduce the need for any air conditioning use during the daytime during the summer. In this case, the increased wall R-value associated with the increased thickness does not impede the heat transfer.
3.2.2. Impact of External Brick Layer Properties
Increasing the thermal mass of the innermost layer of the wall was found to save slightly more space heating energy for both static and dynamic insulation walls. In this section, the impact of external brick layer on the performance of dynamic walls is considered by adjusting its thickness as summarized in Table 7. As shown by the results, the thicker outer brick layer (i.e., 18 cm) allowed the static insulation to reduce the space heating needs of the prototypical apartment by 0.93% compared to the baseline thickness case (i.e., 9 cm).
For the dynamically insulated wall, lowering the walls’ outer layer thickness to 5 cm provided heating energy savings of 8.05% compared to the static wall with the baseline brick layer thickness of 9 cm: significantly higher than for the cases of 9 cm and 18 cm thick brick layer. These savings associated with the dynamic walls and thinner outer brick layer remain high at 8.60% when compared to the static walls with the same thickness (i.e., 5 cm). The increase in savings is due to the lower R-value level that can be achieved for the low setting of the dynamic wall when the outer brick layer is thin. Moreover, the reduced thermal mass obtained by the thinner outer brick layer allows for the outer wall layer’s temperature to rise quicker and therefore activate the wall’s low R-value setting quicker, permitting a longer period of free heating. These results suggest that the exterior brick layer with its inherent mass and R-value only acts as a barrier for the dynamic insulation to channel free heat to the indoors. Indeed, when the dynamic wall is active to be at its low R-value, the exterior brick layer needs to be as thin as possible to have low heat capacitance and thermal resistance in order to allow the inner brick layer to store and deliver any collected free heating from the outdoors to the indoors.
In addition, the results listed in Table 7 indicate that a thin exterior brick layer also enhances the cooling energy savings of the dynamic walls. Specifically, the thinner outer brick layer (i.e., 5 cm thick) allows a decrease in the cooling energy use by 82.81% compared to the static insulation with 9 cm thick external brick layer. These savings are higher than those achieved by the dynamic wall with 9 cm thick external brick layer, estimated to be 61.83%. For the static insulation cases, the decreased external brick layer thickness also decreases, albeit slightly, the cooling energy use for the apartment due to lower overall R-value of the walls, which is beneficial during the summer season. In particular, a 5 cm outer brick layer reduces the cooling energy use by 1.26% compared to the baseline case of 9 cm brick layer.
Table 8 shows the annual heating and cooling energy consumptions of the prototypical apartment for various outer brick layer densities including the baseline brick density of 1800 kg/m3, less dense brick of 1500 kg/m3 and dense brick of 2100 kg/m3 [31]. As indicated in Table 8, space heating energy savings of 4.04% can be obtained by the dynamic wall using the less dense brick compared to static insulation regardless of the brick density. Similarly, the less dense brick allows the dynamic insulation to save about 66.16% of the cooling energy use compared to the static insulation coupled with any brick density. These results are consistent with the benefits found for thin external brick layer and support the fact that dynamic insulation performs better for wall with external layers that have low heat capacitance and small thermal resistance.
3.2.3. Improved Wall Construction
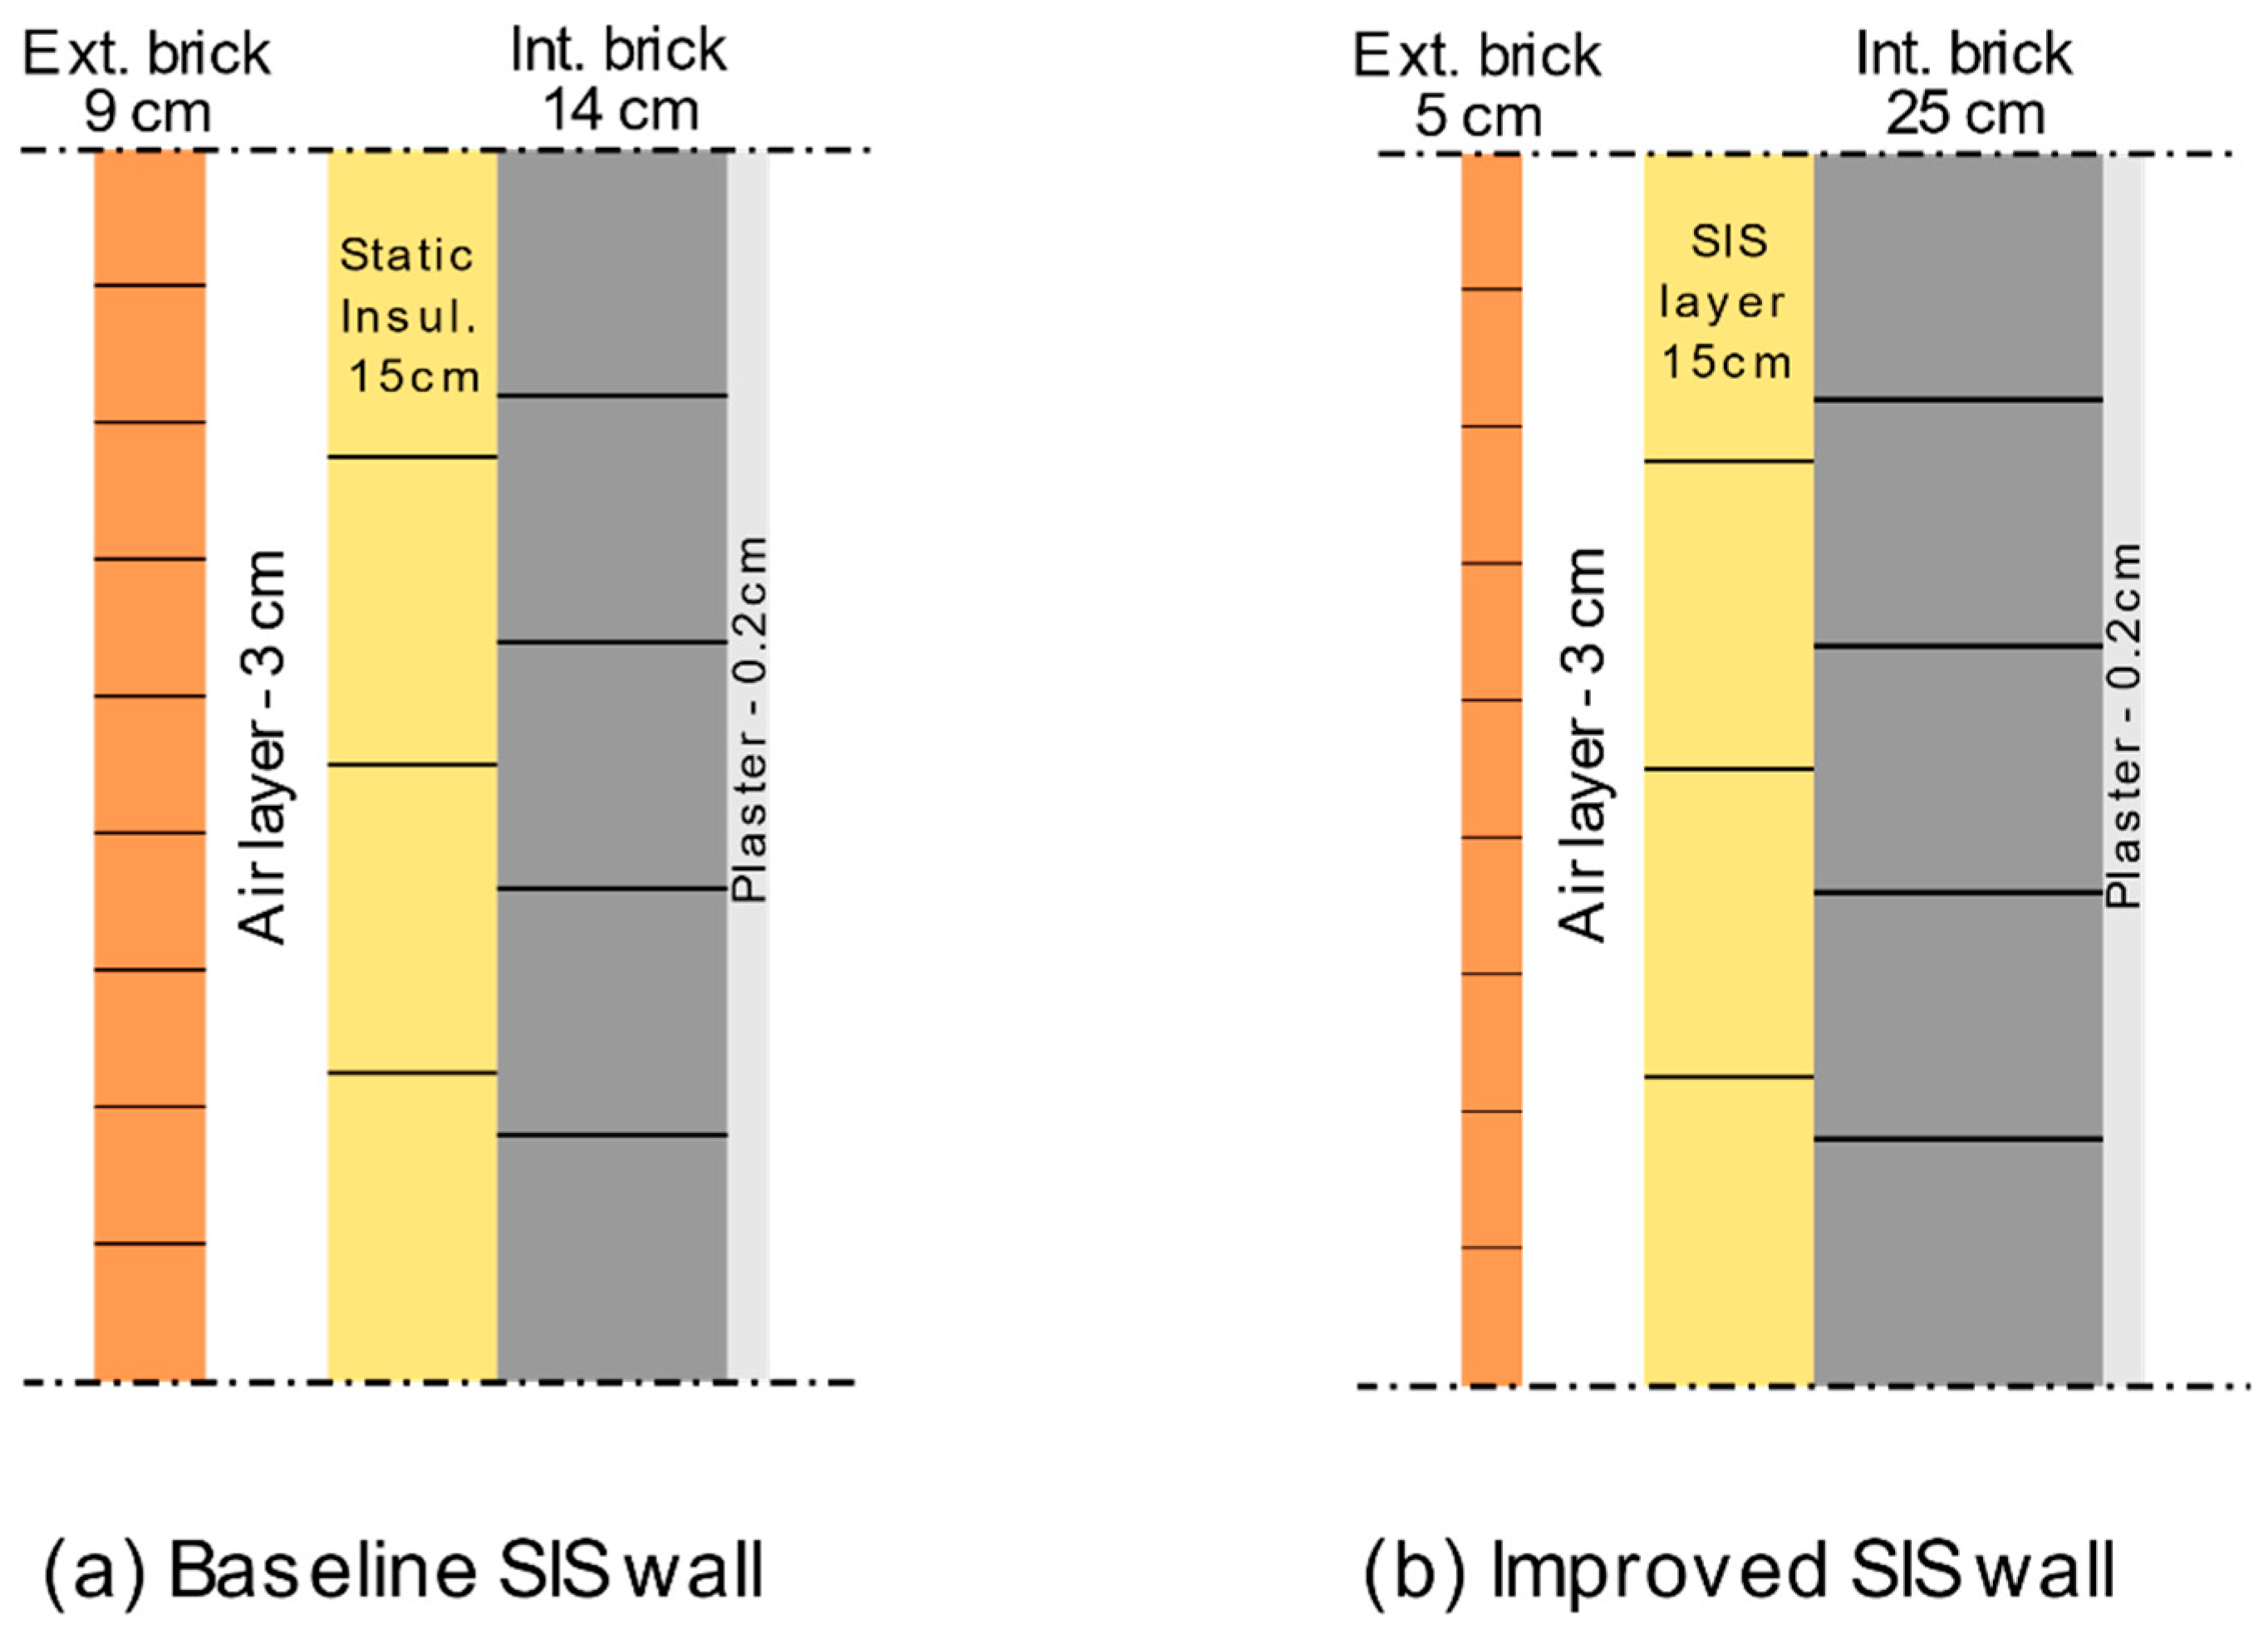
In this section, the best brick layers properties explored previously were combined to provide an improved wall construction to enhance the thermal performance of dynamic insulations. The selection of the best properties is based solely on reducing the annual heating energy consumption specific to the apartment, since Brussels has limited cooling needs and most dwellings are not equipped with air conditioning systems. While a comprehensive optimization analysis can be carried out to select the various specifications for wall construction to maximize annual heating and cooling energy savings, the optimized wall properties in this section are based on well-defined parametric analysis results summarized in the previous sections. Specifically, the optimized wall construction considered in this analysis consists of a 5 cm thick brick external layer and 25 cm thick internal layer with a brick density of 1500 kg/m3 in both layers. The results specific to the dynamic wall performance using optimized wall construction are compared to two baseline cases for static insulation as indicated in Table 9. The baseline cases include the original wall construction (i.e., 9 cm thick external brick layer with a density of 1800 kg/m3 and 14 cm thick internal brick layer with a density 1200 kg/m3) and the optimized wall construction. Cross sections of the baseline and the proposed improved wall constructions are displayed in Figure 4. As shown in Table 9, the static insulation benefits from the modified wall construction, with a reduction in heating energy use of 1.19% and cooling energy use of 3.46% compared to the original wall construction. For the dynamic wall, the modified wall construction achieved a substantial improvement with the heating energy savings increased from 3.30% for the original construction to 9.98%. Similar improvements are obtained for cooling energy use savings with an increase from 61.83% (original construction) to 79.71%.
Figure 5 illustrates the monthly variations of the heating energy use for the prototypical apartment with three wall construction and insulation configurations: (i) baseline construction with static insulation, (ii) baseline construction with dynamic insulation, and (iii) modified construction with dynamic insulation. With the baseline wall construction, the dynamic insulation offers limited heating energy use reduction, especially during the coldest winter months. However, with the modified wall construction, the dynamic insulation achieves some additional savings, including during the months of January, February, and December, with 1% to 3% extra savings. Higher savings are obtained by the dynamic insulation coupled with modified wall construction during the other months, especially in April, when heating energy use is 220% less than that obtained when the dynamic insulation is applied to the baseline wall construction. The analysis results clearly indicate that the performance of the dynamic insulation depends significantly on the wall construction specifications. The optimized wall specifications may depend on various factors including the climate and the building type.
Optimizing the wall brick layer properties for the detached house gives similar performance results for the dynamic insulation as those obtained for the apartment, as summarized in Table 10. When compared to the static insulation applied to the baseline wall construction, the dynamic insulation achieves annual heating energy savings of 1.17% when applied to the baseline wall construction and 4.61% when applied to the modified wall construction. Similarly, the cooling savings due to the application of dynamic insulation increase from 53.08% for baseline wall construction to 73.63% for the modified wall construction.
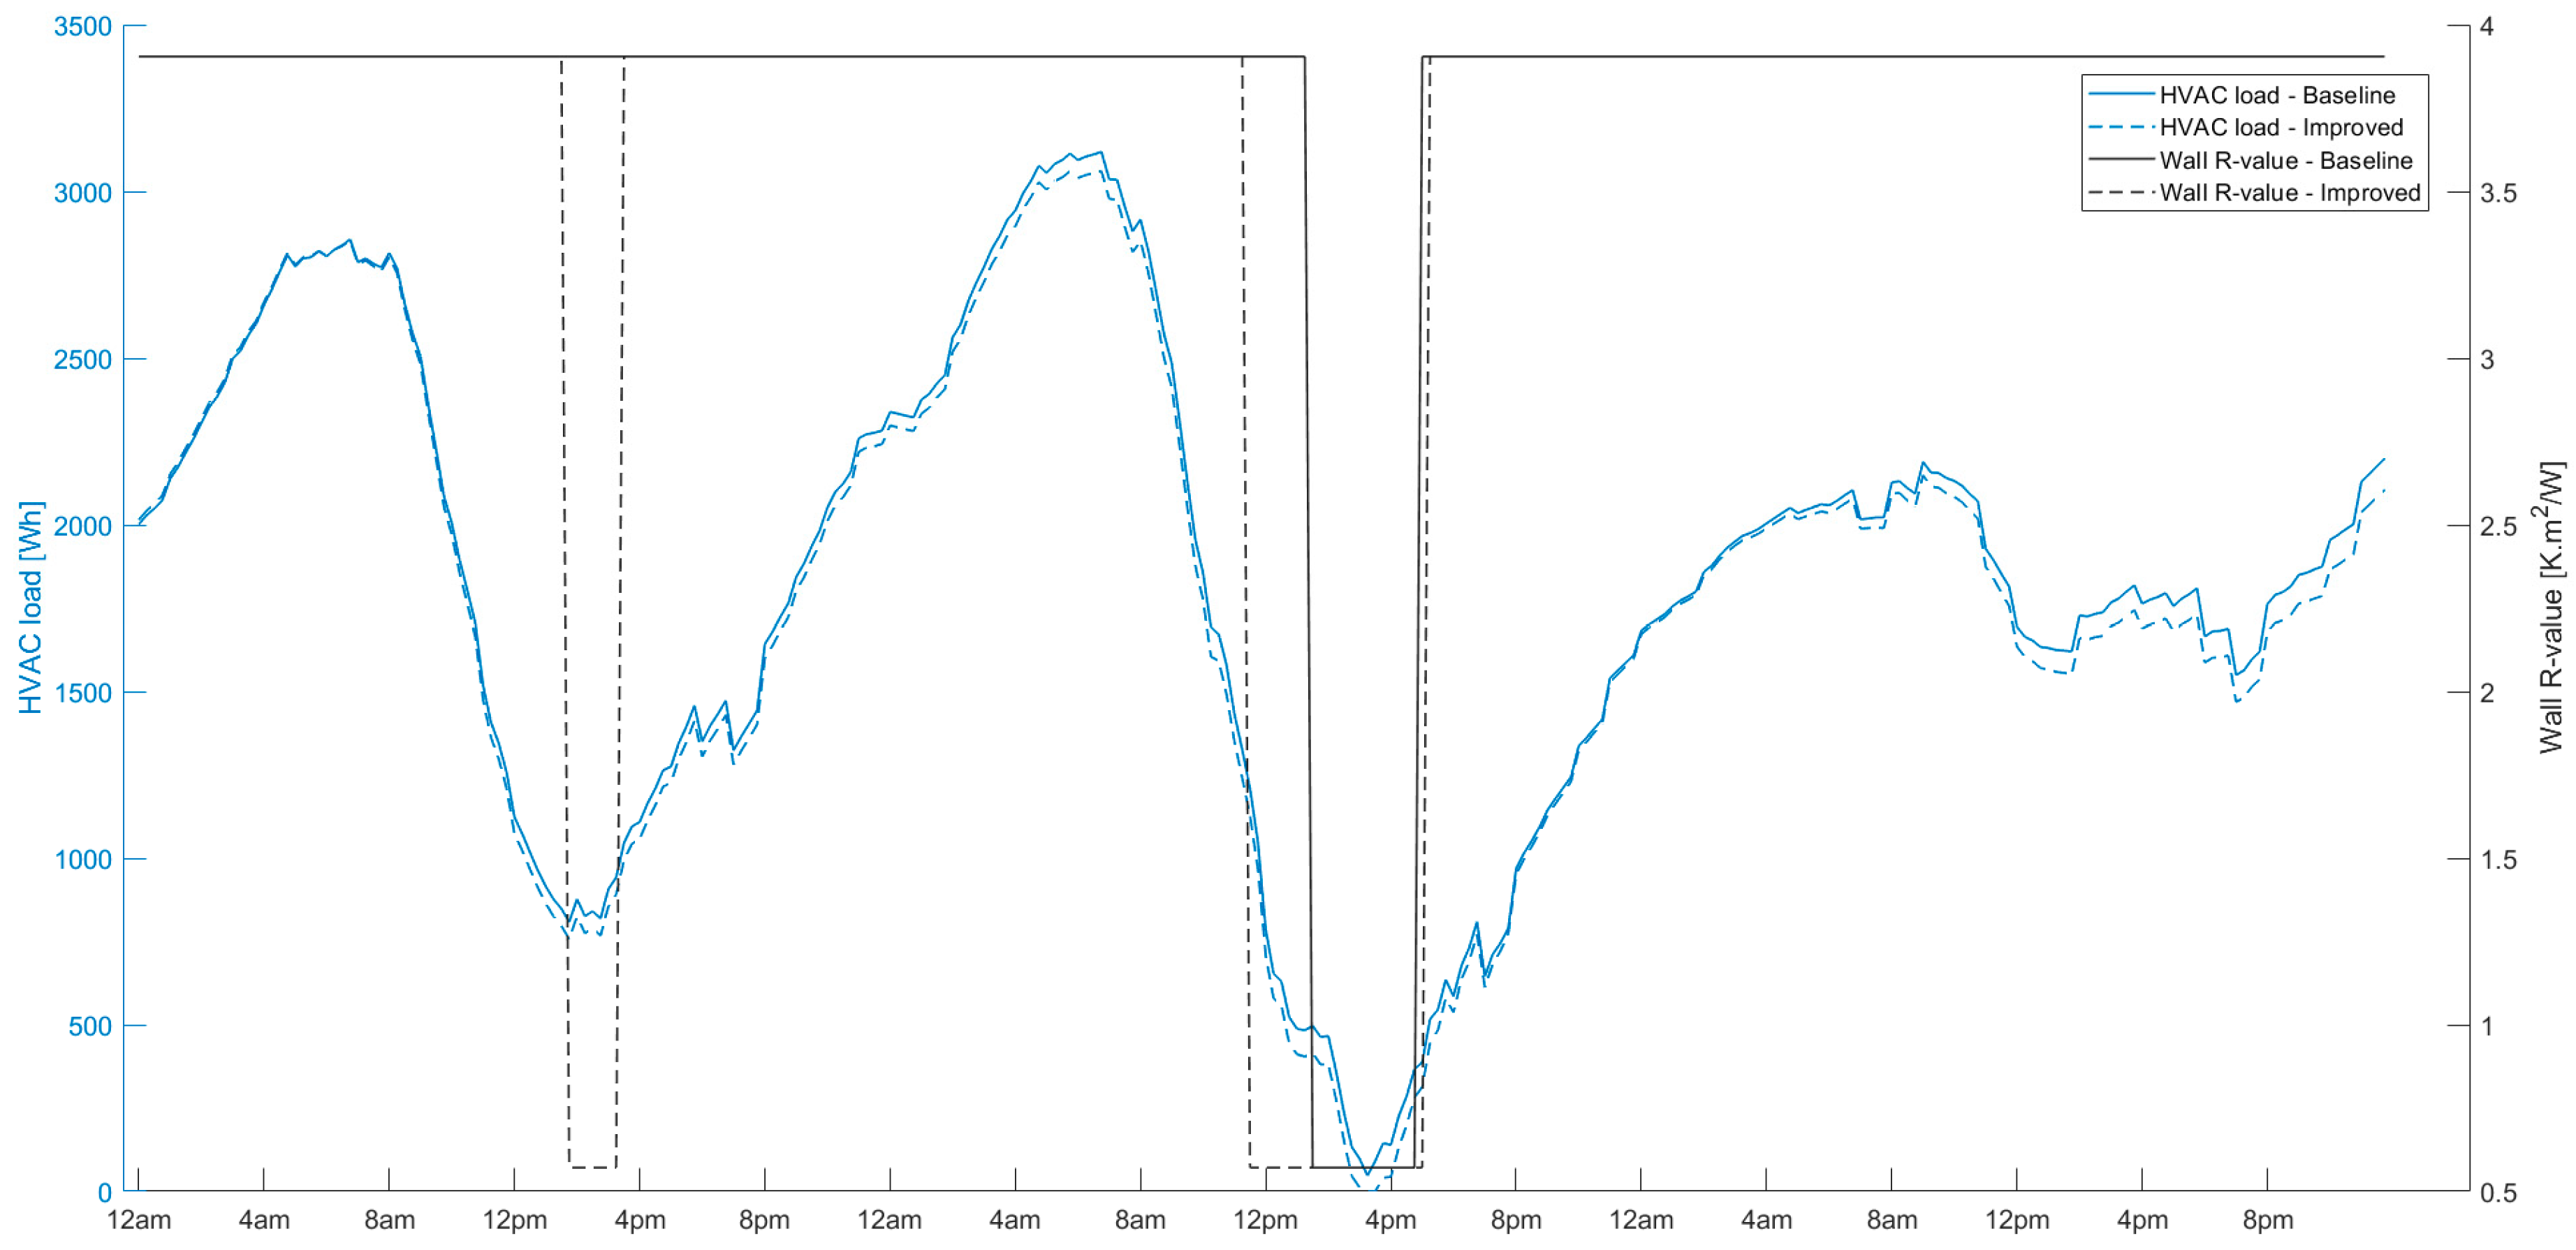
Figure 6 compares hourly heating energy use and the SIS wall actions between the baseline wall composition and the improved wall for the prototypical detached house during a 3-day period in March. Due to the reduced inertia of the exterior wall layer, the lower R-value is selected for longer periods, thus allowing more “free” heat into the dwelling. The effect of the improved SIS wall construction lasts during most of the last day, as displayed at the right of the graph (between 4am and 12 pm of the third day). Indeed, more energy is stored in the inner wall layer of the improved wall during the “open” period because of the increased thermal mass.
In summary, the dynamic insulation should be placed as close as possible to the exterior layer of the wall in order to maximize its thermal performance. Specifically, the dynamic insulation should have thermally easy access to the outdoors to better take advantage of any available free heating and cooling energy and ultimately transfer it to the indoors. Moreover, walls with dynamic insulation can benefit from inner layers with high mass (but low R-value) to enhance their thermal storage capacity for free heating and cooling energy.
Table 11 presents a simple cost benefit analysis to estimate the required incremental break-even costs of SIS technology relative to the static insulation cost when deployed to exterior walls of residential buildings in Belgium. The energy costs for residential buildings in Belgium are 0.066 €/kWh for natural gas and 0.212 €/kWh for electricity [32]. The lifetime of residential buildings is set to 40 years and the average discount rate is assumed to 5% [33]. As noted in Table 11, the incremental break-even costs relative to the static insulation range from 5.3 €/m2 for detached homes to 7.0 €/m2 for apartment buildings. Considering that the cost of a static insulation layer of the same thickness is 10 €/m2 [34], the break-even costs for the SIS technology to be cost-effective relative to the static insulation are 15.3 €/m2 for homes and 17.0 €/m2 for apartment buildings. These break-even costs will be higher if the lifetime of buildings is longer and/or the discount rate is lower. As highlighted in a study of SIS-integrated walls for the city of Barcelona, retrofitting older buildings with SIS is more cost-effective than for modern energy-efficient buildings [27].
3.2.4. Impact of Climate
In the previous sections, it is shown that SIS-integrated walls have the potential to save up to 3.3% on the baseline dwelling’s annual heating energy consumption for modern Belgian constructions, and up to 10% when wall layers are optimized for SIS integration; cooling energy needs are likewise reduced. Furthermore, it is shown that even the slight differences in climate within Belgium can have an effect on the potential savings of SIS-integrated walls. In this section, the objective is twofold; first, to show that the optimized wall construction improves on the baseline’s wall construction by reducing the space heating and cooling energy consumption of the prototypical house in various European climates, and second, to give an overview of the potential for SIS walls in various European locations. Several cities are selected to cover various European climates as listed in Table 12.
The energy performance of the prototypical Belgian house used in this study is assessed in various locations. It must be noted that this house features high insulation and construction materials not common in some of these other locations. The results of the impact of climates on the energy performance of SIS-integrated walls are summarized in Table 13.
From Table 13, it can be observed that the greatest potential savings occur in milder climates; consistent with the results obtained by Menyhart et al. for US climates [26]. More specifically, the cities of Madrid, Barcelona, and Rome feature both high potential space heating and cooling energy savings associated with the use of SIS-integrated walls (with baseline wall construction). Locations with colder winters such as Moscow, Brussels, Milan, Belgrade, and Nantes feature lower relative heating energy savings. Conversely, lower relative savings are achieved in cities with hotter summers (Madrid, and in particular, Palermo).
Finally, Table 13 shows that the optimized wall construction reduces both pace heating and cooling energy end-uses for all considered locations. As explained for the relatively low-potential city of Brussels, the optimized wall allows more frequent activation of the SIS layer and thus more opportunities to free-cool and free-heat the dwelling. In particular, space-heating energy savings are more than doubled for all studied locations when comparing the savings obtained with the optimized wall construction with those of the baseline SIS wall case. The standout performers for SIS-integrated walls are the cities of Moscow (4.1 times the baseline SIS case savings), Brussels (3.8 times), Belgrade, Milan, and Nantes (3.1 times). Cities with the warmest summers benefit the most from the optimized wall construction as the energy savings in Palermo are multiplied by 2.5, by 2 in Madrid, and by about 1.7 in Barcelona, Milan, and Rome.
4. Summary and Conclusions
The study outlined in this paper evaluated the benefits of using SIS-integrated walls for two prototypical low-energy dwellings in Belgium. The potential energy savings obtained are estimated to range between 1.1% to 3.7% of the annual space heating energy use and between 53.1% and 98.7% of the annual cooling energy use depending on the location and the type of dwelling. When considering the whole building energy requirements, these savings are relatively low, due to the cold Belgian climates, and because the chosen prototypical low-energy dwellings already feature high R-value static insulation. To further refine the performance of SIS-integrated buildings, a parametric study on the placement of wall thermal mass was conducted in both Belgium and other European locations. The results of this analysis show that when applying an SIS layer to a wall, the placement of the thermal mass and the thickness of the wall layers can significantly affect the energy performance of SIS. Indeed, heating energy savings were more than doubled for all studied locations and increased up to a factor of four for cold cities. Moreover, cooling energy savings increased by at least 35% and up to 250% in hotter cities. The SIS layer, when placed close to the exterior, allows taking advantage of more free-cooling and free-heating opportunities, due to the smaller time delay for heat conduction. A layer of bricks or concrete with high thermal mass should be placed inside the SIS layer, as it allows a greater thermal storage capacity for the free-heating and free-cooling obtained through SIS walls. Instead of a parametric analysis, these results could be refined for a few locations by conducting an optimization on the wall properties for certain building types and certain locations. In particular, the use of phase change materials (PCMs) has the potential to enhance the energy performance of switchable insulation systems. Furthermore, the two prototypical buildings used in this study are representative of the building practices in Belgium; additional studies could be conducted to account for the differences in building construction throughout Europe. While the solar radiation and outside temperature variations are accounted for in the model, humidity and wind-driven rain effects are not considered. Further analyses could be carried out to assess the impacts of these weather elements on the performance assessment of SIS technology, especially for coastal locations. As a possible improvement of this technology, the air cavity in which the SIS layer is installed could have airflow, be it natural or forced, to enhance the heat transfer and thus the energy savings. The coupling between airflow and SIS will be analyzed in a future study.
Author Contributions
Conceptualization, M.K.; data curation, R.C.; investigation, R.C.; resources, M.D.; software, M.D.; supervision, M.K.; validation, R.C.; writing—original draft, R.C.; writing—review and editing, M.K. All authors have read and agreed to the published version of the manuscript.
Funding
This research received no external funding.
Conflicts of Interest
The authors declare no conflict of interest.
Nomenclature
| ACH | Air changes per hour (%) |
| CDD | Cooling degree days with 18 °C base temperature (°C-day/year) |
| COP | Coefficient of performance of the air conditioning system |
| DHW | Domestic hot water |
| DIM | Dynamic insulation material |
| EPB | Energy performance of buildings |
| HDD | Heating degree days with 18 °C base temperature (°C-day/year) |
| HVAC | Heating ventilation and air conditioning |
| HVAC load | Heat transferred to or from the HVAC system (kWh) |
| PUR | Polyurethane rigid foam |
| R-value | Thermal resistance (m2.K/W) |
| RC | Resistor-Capacitor |
| SHGC | Solar heat gain coefficient |
| SIS | Switchable insulation system |
| TABULA | Typology approach for building stock energy assessment |
| U-value | Thermal transmittance (W/m2.K) |
References
- Economie. Energy Key Data 2016—Belgium. 2019, Volume 5, p. 3. Available online: https://economie.fgov.be/fr/publications/energy-key-data-mars-2019 (accessed on 31 March 2020).
- Lodewijckx, E.; Deboosere, P. Ménages et Familles: Evolutions Rapides et Grande Stabilité à la Fois. 2011. Available online: https://ggps.be/doc/GGP_Belgium_Paper_Series_6-FR.pdf (accessed on 31 March 2020).
- Cyx, W.; R, N.; Verbeke, S. IEE TABULA—Typology Approach for Building Stock Energy Assessment; Institut Wohnen und Umwelt GmbH: Darmstadt, Germany, 2011. [Google Scholar]
- Performance énergétique des bâtiments (PEN 2017)—Energie Plus Le Site. Available online: https://energieplus-lesite.be/reglementations/le-batiment3/performance-energetique-des-batiments-pen-2017/ (accessed on 31 March 2020).
- Ruellan, G. La Rénovation du Bâti Résidentiel en Belgique. 2016. Available online: https://orbi.uliege.be/bitstream/2268/202946/1/Rapport%201%20%20Revue%20de%20litt%C3%A9rature.pdf (accessed on 2 April 2020).
- Kossecka, E.; Kosny, J. Influence of insulation configuration on heating and cooling loads in a continuously used building. Energy Build. 2002, 34, 321–331. [Google Scholar] [CrossRef]
- Aissani, A. Optimisation Fiabiliste des Performances Énergétiques des Batiment. Ph.D. Thesis, Blaise Pascal-Clermont University, Clermont-Ferrand, France, 14 March 2016. Available online: https://tel.archives-ouvertes.fr/tel-01344610/document. (accessed on 2 April 2020).
- Sambou, V. Transferts thermiques instationnaires: Vers une optimisation de parois de bâtiments. Ph.D. Thesis, Paul Sabatier University, Toulouse, France, 2008. Available online: http://thesesups.ups-tlse.fr/252/1/Sambou_Vincent.pdf (accessed on 2 April 2020).
- Nicolas, J.; Andre, P.; Rivez, J.; Debbaut, V. L’inertie dans la maison individuelle: Un gain de consommation énergétique? Simulation et étude de cas. Rev. Générale Therm. 1991, 30, 240–249. [Google Scholar]
- De Gracia, A.; Navarro, L.; Castell, A.; Ruiz-Pardo, Á.; Alvárez, S.; Cabeza, L.F. Experimental study of a ventilated facade with PCM during winter period. Energy Build. 2013, 58, 324–332. [Google Scholar] [CrossRef]
- De Gracia, A.; Navarro, L.; Castell, A.; Cabeza, L.F. Energy performance of a ventilated double skin facade with PCM under different climates. Energy Build. 2015, 91, 37–42. [Google Scholar] [CrossRef] [Green Version]
- Soares, N.; Costa, J.J.; Gaspar, A.R.; Santos, P. Review of passive PCM latent heat thermal energy storage systems towards buildings’ energy efficiency. Energy Build. 2013, 59, 82–103. [Google Scholar] [CrossRef]
- Soares, N.; Gaspar, A.R.; Santos, P.; Costa, J.J. Multi-dimensional optimization of the incorporation of PCM-drywalls in lightweight steel-framed residential buildings in different climates. Energy Build. 2014, 70, 411–421. [Google Scholar] [CrossRef]
- Diaconu, B.M.; Cruceru, M. Novel concept of composite phase change material wall system for year-round thermal energy savings. Energy Build. 2010, 42, 1759–1772. [Google Scholar] [CrossRef]
- Kuznik, J.V.F.; Johannes, K. In-situ study of thermal comfort enhancement in a renovated building equipped with phase change material wallboard. Renew. Energy 2011, 36, 1458–1462. [Google Scholar] [CrossRef] [Green Version]
- Mandilaras, I.; Stamatiadou, M.; Katsourinis, D.; Zannis, G.; Founti, M. Experimental thermal characterization of a Mediterranean residential building with PCM gypsum board walls. Build. Environ. 2013, 61, 93–103. [Google Scholar] [CrossRef]
- Castell, A.; Martorell, I.; Medrano, M.; Pérez, G.; Cabeza, L.F. Experimental study of using PCM in brick constructive solutions for passive cooling. Energy Build. 2010, 42, 534–540. [Google Scholar] [CrossRef]
- Jin, X.; Medina, M.A.; Zhang, X. Numerical analysis for the optimal location of a thin PCM layer in frame walls. Appl. Therm. Eng. 2016, 103, 1057–1063. [Google Scholar] [CrossRef] [Green Version]
- Osterman, E.; Butala, V.; Stritih, U. PCM thermal storage system for ‘free’ heating and cooling of buildings. Energy Build. 2015, 106, 125–133. [Google Scholar] [CrossRef]
- Gratia, E.; de Herde, A. Are energy consumptions decreased with the addition of a double-skin? Energy Build. 2007, 39, 605–619. [Google Scholar] [CrossRef]
- Andjelković, A.S.; Cvjetković, T.B.; Djaković, D.D.; Stojanović, I.H. Development of simple calculation model for energy performance of double skin façades. Therm. Sci. 2012, 16, 251–267. [Google Scholar] [CrossRef]
- Fallahi, A.; Haghighat, F.; Elsadi, H. Energy performance assessment of double-skin façade with thermal mass. Energy Build. 2010, 42, 1499–1509. [Google Scholar] [CrossRef]
- Park, B.; Srubar, W.V.; Krarti, M. Energy performance analysis of variable thermal resistance envelopes in residential buildings. Energy Build. 2015, 103, 317–325. [Google Scholar] [CrossRef]
- Dehwah, A.H.A.; Krarti, M. Impact of switchable roof insulation on energy performance of US residential buildings. Build. Environ. 2020, 177, 106882. [Google Scholar] [CrossRef]
- Dabbagh, M.; Krarti, M. Evaluation of the performance for a dynamic insulation system suitable for switchable building envelope. Energy Build. 2020, 222, 110025. [Google Scholar] [CrossRef]
- Menyhart, K.; Krarti, M. Potential energy savings from deployment of Dynamic Insulation Materials for US residential buildings. Build. Environ. 2017, 114, 203–218. [Google Scholar] [CrossRef]
- Garriga, S.M.; Dabbagh, M.; Krarti, M. Evaluation of Dynamic Insulation Systems for Residential Buildings in Barcelona, Spain. ASME J. Eng. Sustain. Build. Cities 2020, 1, 011002. [Google Scholar] [CrossRef]
- Eurostat. Greenhouse Gas Emission Statistics—Statistics Explained. 2020. Available online: https://ec.europa.eu/eurostat/statistics-explained/pdfscache/1180.pdf (accessed on 11 November 2020).
- Delghust, M.; Roelens, W.; Tanghe, T.; de Weerdt, Y.; Janssens, A. Regulatory energy calculations versus real energy use in high-performance houses. Build. Res. Inf. 2015, 43, 675–690. [Google Scholar] [CrossRef]
- Al-Sanea, S.A.; Zedan, M.F.; Al-Hussain, S.N. Effect of thermal mass on performance of insulated building walls and the concept of energy savings potential. Appl. Energy 2012, 89, 430–442. [Google Scholar] [CrossRef]
- Conductivité Thermique des Matériaux (λ)—Energie Plus Le Site. Available online: https://energieplus-lesite.be/donnees/enveloppe44/enveloppe2/conductivite-thermique-des-materiaux/ (accessed on 8 March 2020).
- Prix de l’énergie—Energie Plus Le Site. Available online: https://energieplus-lesite.be/donnees/couts2/prix-de-l-energie/#Les_prix_moyens_pour_le_secteur_residentiel (accessed on 11 November 2020).
- Nemry, F.; Uihlein, A.; Makishi, C.C.; Wetzel, C.; Braune, A.; Wittstock, B.; Hasan, I.; Kreißig, J.; Gallon, N.; Niemeier, S.; et al. Options to reduce the environmental impacts of residential buildings in the European Union-Potential and costs. Energy Build. 2010, 42, 976–984. [Google Scholar] [CrossRef]
- Types d’isolants: Généralités—Energie Plus Le Site. Available online: https://energieplus-lesite.be/techniques/enveloppe7/composants-de-l-enveloppe/isolants-et-pare-vapeur/types-d-isolants-generalites/ (accessed on 11 November 2020).
Figure 1.
Mechanical switchable insulation system (SIS) prototype.

Figure 2.
3R2C network to model the heat transfer through an exterior wall.

Figure 3.
Simple rule set used in this study for SIS-equipped walls.

Figure 4.
Cross sections of (a) Baseline SIS wall composition and (b) Improved SIS wall composition.
Figure 4.
Cross sections of (a) Baseline SIS wall composition and (b) Improved SIS wall composition.

Figure 5.
Monthly comparison of annual heating consumption energy for improved thicknesses and densities of the interior and exterior brick layer for the walls of the prototypical Belgian apartment.
Figure 5.
Monthly comparison of annual heating consumption energy for improved thicknesses and densities of the interior and exterior brick layer for the walls of the prototypical Belgian apartment.

Figure 6.
Comparison of wall action for a 3 day period between 4 March and 6 March, showcasing the difference in HVAC energy consumption and SIS wall actions between the baseline wall construction and the improved wall.
Figure 6.
Comparison of wall action for a 3 day period between 4 March and 6 March, showcasing the difference in HVAC energy consumption and SIS wall actions between the baseline wall construction and the improved wall.


Table 1.
Characteristics of the modeled apartment and detached house.
| Apartment | Detached House | |
|---|---|---|
| Floor surface Area (m2) | 100 | 247 |
| Wall height (m) | 3 | 3 |
| Window to wall ratio (m) | 21% | 31% |
| Windows | Double glazed U-factor: 1.6 W/m2.K SHGC: 0.4 | |
| Heating operation | September–May Seasonal efficiency: 0.85 Setpoint: 20 °C | October–May Seasonal efficiency: 0.85 Setpoint: 20 °C |
| Cooling operation | June–August COP: 3.5 Setpoint: 26 °C | June–September COP: 3.5 Setpoint: 26 °C |
| Adiabatic surfaces | East and West walls, floor and roof | None |
Table 2.
Internal loads of the prototypical buildings.
| Apartment | Detached House | |
|---|---|---|
| Ventilation rate (m3/h) (ACH) | 0.26 (44%) | 0.15 (100%) |
| Infiltration rate (m3/h.m2) at 50Pa | 6 | 6 |
| People density (m2/ppl) | 43.5 | 117.2 |
| Lighting density (W/m2) | 2.86 | 2.86 |
| Equipment density (W/m2) | 6.92 | 4.7 |
| Cooking range (W) | 4000 | 5000 |
| DHW range (W) | 500 | 625 |
Table 3.
Construction details for the building envelope elements of the prototypical detached house model.
Table 3.
Construction details for the building envelope elements of the prototypical detached house model.
| Material | Thickness (mm) | Conductivity (W/m.K) | Density (kg/m3) | Specific Heat (J/kg.K) |
|---|---|---|---|---|
| Roof | ||||
| Pantile | 10 | 0.71 | 1800 | 1000 |
| Fiber-cement panel | 3 | 0.25 | 1200 | 1470 |
| Mineral wool insulation | 300 | 0.045 | 175 | 1030 |
| Membrane | 5 | 0.23 | 1100 | 1000 |
| Air layer | 20 | 0.316 | 1.204 | 1006 |
| Plaster | 10 | 0.52 | 1300 | 1000 |
| Exterior walls | ||||
| Brick | 90 | 0.71 | 1800 | 1000 |
| Air layer | 30 | |||
| Mineral wool insulation | 150 | 0.045 | 175 | 1030 |
| Sand-lime brick | 140 | 0.45 | 1200 | 1000 |
| Plaster | 20 | 0.52 | 1300 | 1000 |
| Floor | ||||
| Lightweight concrete | 100 | 0.55 | 1200 | 1000 |
| Reinforced concrete | 200 | 1.7 | 2400 | 1000 |
| PUR insulation | 100 | 0.035 | 30 | 1400 |
| Screed | 50 | 0.55 | 1200 | 1000 |
| Ceramic tile | 15 | 0.81 | 2000 | 1000 |
| Dynamic Insulation Material | ||||
| High R-value | 150 | 0.045 | 43 | 1210 |
| Low R-value | 150 | 10 | 43 | 1210 |
Table 4.
Comparison of annual heating and cooling energy consumption for static and dynamic insulated walls applied to the prototypical dwellings for three climates in Belgium.
Table 4.
Comparison of annual heating and cooling energy consumption for static and dynamic insulated walls applied to the prototypical dwellings for three climates in Belgium.
| Brussels | Oostende | St Hubert | |||||
|---|---|---|---|---|---|---|---|
| Dwelling | Indicator | Baseline | Dynamic | Baseline | Dynamic | Baseline | Dynamic |
| Detached house | Annual heating energy consumption and savings relative to baseline (kWh|%) | 11,674 | 11,538 (1.2%) | 10,309 | 10,185 (1.2%) | 14,015 | 13,858 (1.1%) |
| Annual cooling energy consumption and savings relative to baseline (kWh|%) | 90.3 | 42.4 (53.1%) | 31.6 | 3.4 (89.2%) | 13.2 | 1.2 (91.2%) | |
| Apartment | Annual heating energy consumption and savings relative to baseline (kWh|%) | 1985.4 | 1919.9 (3.3%) | 1689.2 | 1655.2 (2.0%) | 2564.7 | 2470.6 (3.7%) |
| Annual cooling energy consumption and savings relative to baseline (kWh|%) | 47.6 | 18.2 (61.8%) | 34.8 | 3.9 (88.9%) | 15.3 | 0.2 (98.7%) | |
Table 5.
Comparison of annual space heating and cooling energy consumption for various thicknesses of the interior brick layer for static and dynamic insulated walls of the prototypical Belgian apartment model.
Table 5.
Comparison of annual space heating and cooling energy consumption for various thicknesses of the interior brick layer for static and dynamic insulated walls of the prototypical Belgian apartment model.
| Baseline 14 (cm) | Thicker 25 (cm) | Thinner 7 (cm) | |||||
|---|---|---|---|---|---|---|---|
| Mode | Indicator | Static | Dynamic | Static | Dynamic | Static | Dynamic |
| Heating | Annual consumption and saving compared to the static baseline (kWh|%) | 1985.4 (0.0%) | 1919.9 (3.30%) | 1951.0 (1.73%) | 1890.9 (4.76%) | 2011.2 (−1.30%) | 1944.7 (2.05%) |
| Reduction compared to the static case of the same brick layer thickness (kWh|%) | 0.0 (0.0%) | 65.6 (3.30%) | 0.0 (0.0%) | 60.1 (3.08%) | 0.0 (0.0%) | 66.5 (3.31%) | |
| Cooling | Annual consumption and saving compared to the static baseline (kWh|%) | 47.6 (0.0%) | 18.2 (61.83%) | 47.3 (0.81%) | 21.8 (54.15%) | 48.3 (−1.43%) | 18.2 (61.77%) |
| Reduction compared to the static case of the same brick layer thickness (kWh|%) | 0.0 (0.0%) | 29.5 (61.83%) | 0.0 (0.0%) | 25.4 (53.77%) | 0.0 (0.0%) | 30.1 (62.32%) | |
Table 6.
Comparison of annual heating and cooling energy consumption for various densities of the interior brick layer of the walls of the typical Belgian apartment.
Table 6.
Comparison of annual heating and cooling energy consumption for various densities of the interior brick layer of the walls of the typical Belgian apartment.
| Baseline1200 (kg/m3) | Denser 1500 (kg/m3) | Less dense900 (kg/m3) | |||||
|---|---|---|---|---|---|---|---|
| Mode | Indicator | Static | Dynamic | Static | Dynamic | Static | Dynamic |
| Heating | Annual consumption and saving compared to the static baseline (kWh|%) | 1985.4 (0.0%) | 1919.9 (3.30%) | 1984.4 (0.05%) | 1919.4 (3.32%) | 1986.7 (−0.07%) | 1926.9 (2.95%) |
| Reduction compared to the static case of the same brick density (kWh|%) | 0.0 (0.0%) | 65.6 (3.30%) | 0.0 (0.0%) | 65.0 (3.28%) | 0.0 (0.0%) | 59.8 (3.01%) | |
| Cooling | Annual consumption and saving compared to the static baseline (kWh|%) | 47.6 (0.0%) | 18.2 (61.83%) | 47.2 (0.90%) | 17.7 (62.83%) | 48.1 (−0.95%) | 19.3 (59.51%) |
| Reduction compared to the static case of the same brick density (kWh|%) | 0.0 (0.0%) | 29.5 (61.83%) | 0.0 (0.0%) | 29.5 (62.50%) | 0.0 (0.0%) | 28.8 (59.89%) | |
Table 7.
Comparison of annual heating and cooling energy consumption for various thicknesses of the exterior brick layer for the walls of the prototypical Belgian apartment.
Table 7.
Comparison of annual heating and cooling energy consumption for various thicknesses of the exterior brick layer for the walls of the prototypical Belgian apartment.
| Baseline 9 (cm) | Thicker 18 (cm) | Thinner 5 (cm) | |||||
|---|---|---|---|---|---|---|---|
| Mode | Indicator | Static | Dynamic | Static | Dynamic | Static | Dynamic |
| Heating | Annual consumption and saving compared to the static baseline (kWh|%) | 1985.4 (0.0%) | 1919.9 (3.30%) | 1967.0 (0.93%) | 1964.4 (1.06%) | 1997.6 (−0.61%) | 1825.5 (8.05%) |
| Reduction compared to the static case of the same brick layer thickness (kWh|%) | 0.0 (0.0%) | 65.6 (3.30%) | 0.0 (0.0%) | 2.6 (0.13%) | 0.0 (0.0%) | 172.1 (8.62%) | |
| Cooling | Annual consumption and difference compared to the static baseline (kWh|%) | 47.6 (0.0%) | 18.2 (61.83%) | 47.8 (−0.34%) | 30.7 (35.63%) | 47.1 (1.26%) | 8.2 (82.81%) |
| Reduction compared to the static case of the same brick layer thickness (kWh|%) | 0.0 (0.0%) | 29.5 (61.83%) | 0.0 (0.0%) | 17.1 (35.85%) | 0.0 (0.0%) | 38.9 (82.60%) | |
Table 8.
Comparison of annual heating and cooling energy consumption for various densities of the exterior brick layer of the walls of the typical Belgian apartment.
Table 8.
Comparison of annual heating and cooling energy consumption for various densities of the exterior brick layer of the walls of the typical Belgian apartment.
| Baseline1800 (kg/m3) | Denser2100 (kg/m3) | Less Dense1500 (kg/m3) | |||||
|---|---|---|---|---|---|---|---|
| Mode | Indicator | Static | Dynamic | Static | Dynamic | Static | Dynamic |
| Heating | Annual consumption and saving compared to the static baseline (kWh|%) | 1985.4 (0.0%) | 1919.9 (3.30%) | 1984.8 (0.03%) | 1937.3 (2.42%) | 1986.4 (−0.05%) | 1905.2 (4.04%) |
| Reduction compared to the static case of the same brick density (kWh|%) | 0.0 (0.0%) | 65.6 (3.30%) | 0.0 (0.0%) | 47.4 (2.39%) | 0.0 (0.0%) | 81.2 (4.09%) | |
| Cooling | Annual consumption and saving compared to the static baseline (kWh|%) | 47.6 (0.0%) | 18.2 (61.83%) | 47.7 (−0.21%) | 20.1 (57.86%) | 47.5 (0.30%) | 16.1 (66.16%) |
| Reduction compared to the static case of the same brick density (kWh|%) | 0.0 (0.0%) | 29.5 (61.83%) | 0.0 (0.0%) | 27.7 (57.94%) | 0.0 (0.0%) | 31.4 (66.06%) | |
Table 9.
Comparison of annual heating and cooling energy consumption for improved thicknesses and densities of the interior and exterior brick layers for the walls of the prototypical Belgian apartment.
Table 9.
Comparison of annual heating and cooling energy consumption for improved thicknesses and densities of the interior and exterior brick layers for the walls of the prototypical Belgian apartment.
| Baseline | Modified Wall Construction | ||||
|---|---|---|---|---|---|
| Mode | Indicator | Static | Dynamic | Static | Dynamic |
| Heating | Annual consumption and saving compared to the static baseline (kWh|%) | 1985.4 (0.0%) | 1919.9 (3.30%) | 1961.9 (1.19%) | 1787.3 (9.98%) |
| Reduction compared to the static case of the same wall construction (kWh|%) | 0.0 (0.0%) | 65.6 (3.30%) | 0.0 (0.0%) | 174.6 (8.90%) | |
| Cooling | Annual consumption and saving compared to the static baseline (kWh|%) | 47.6 (0.0%) | 18.2 (61.83%) | 46.05 (3.46%) | 9.7 (79.71%) |
| Reduction compared to the static case of the same wall construction (kWh|%) | 0.0 (0.0%) | 29.5 (61.83%) | 0.0 (0.0%) | 36.4 (79.01%) | |
Table 10.
Comparison of annual heating and cooling energy consumption for improved thicknesses and densities of the interior and exterior brick layers for the walls of the prototypical Belgian detached house.
Table 10.
Comparison of annual heating and cooling energy consumption for improved thicknesses and densities of the interior and exterior brick layers for the walls of the prototypical Belgian detached house.
| Baseline | Modified Wall Construction | ||||
|---|---|---|---|---|---|
| Mode | Indicator | Static | Dynamic | Static | Dynamic |
| Heating | Annual consumption and saving compared to the static baseline (kWh|%) | 11,674.1 (0.0%) | 11,537.7 (1.17%) | 11,564.0 (0.94%) | 11,136.5 (4.61%) |
| Reduction compared to the static case of the same wall construction (kWh|%) | 0.0 (0.0%) | 136.4 (1.17%) | 0.0 (0.0%) | 427.5 (3.70%) | |
| Cooling | Annual consumption and saving compared to the static baseline (kWh|%) | 90.3 (0.0%) | 42.4 (53.08%) | 81.6 (10.69%) | 23.8 (73.63%) |
| Reduction compared to the static case of the same wall construction (kWh|%) | 0.0 (0.0%) | 47.9 (53.08%) | 0.0 (0.0%) | 57.8 (70.81%) | |
Table 11.
Cost analysis for the two dwellings when configured with the improved walls.
| Dwelling | Cost savings (€/year) | Wall Area (m2) | Incremental Breakeven Cost (€/m2) |
|---|---|---|---|
| House | 49.6 | 159.7 | 5.3 |
| Apartment | 21.1 | 52.0 | 7.0 |
Table 12.
Selected European locations, with their respective degree-day data and maximum, minimum and yearly average temperatures.
Table 12.
Selected European locations, with their respective degree-day data and maximum, minimum and yearly average temperatures.
| Location | HDD (18 °C) (°C-days/year) | CDD (18 °C) (°C-days/year) | Average Temperature (°C) | Maximum Temperature (°C) | Minimum Temperature (°C) |
|---|---|---|---|---|---|
| Brussels | 2979 | 163 | 10.3 | 34.9 | −9.1 |
| Barcelona | 1463 | 632 | 15.7 | 30.6 | −1.0 |
| Madrid | 2096 | 759 | 14.3 | 40.4 | −4.6 |
| Belgrade | 2901 | 528 | 11.5 | 34.0 | −19.0 |
| Moscow | 4718 | 163 | 5.5 | 30.6 | −25.2 |
| Milan | 2751 | 492 | 11.8 | 32.6 | −11.0 |
| Rome | 1505 | 710 | 15.8 | 31.8 | −4.0 |
| Palermo | 744 | 1042 | 18.8 | 34.0 | 4.8 |
| Nantes | 2354 | 251 | 12.2 | 32.0 | −5.3 |
Table 13.
Annual heating and cooling energy consumption of the prototypical detached house in European climates with static insulation and the savings obtained when applying SIS to the baseline and optimized wall constructions.
Table 13.
Annual heating and cooling energy consumption of the prototypical detached house in European climates with static insulation and the savings obtained when applying SIS to the baseline and optimized wall constructions.
| Source Energy Consumption for Static Wall Insulation (kWh/yr) | Energy Savings Compared to the Respective Static Case (%) | SIS modified walls energy savings compared to Static Baseline (%) | ||||
|---|---|---|---|---|---|---|
| Mode | Location | Static Wall Baseline | Modified Wall Construction | SIS Baseline Wall | SIS Modified Walls | |
| Heating | Brussels | 11,674 | 11,564 | 1.2 | 3.7 | 4.6 |
| Barcelona | 3145 | 3122 | 10.0 | 22.5 | 23.0 | |
| Madrid | 4803 | 4747 | 8.0 | 18.2 | 19.2 | |
| Belgrade | 10,111 | 9964 | 2.5 | 6.4 | 7.8 | |
| Moscow | 19,394 | 19,261 | 0.6 | 2.0 | 2.7 | |
| Milan | 9575 | 9497 | 2.9 | 8.3 | 9.0 | |
| Rome | 3515 | 3471 | 7.5 | 18.4 | 19.4 | |
| Palermo | 899 | 859 | 16.3 | 37.1 | 39.8 | |
| Nantes | 7412 | 7317 | 2.9 | 7.9 | 9.1 | |
| Cooling | Brussels | 90 | 82 | 53.1 | 70.8 | 73.6 |
| Barcelona | 465 | 457 | 20.8 | 34.9 | 35.9 | |
| Madrid | 636 | 625 | 16.7 | 31.8 | 33.0 | |
| Belgrade | 390 | 380 | 28.0 | 46.1 | 47.4 | |
| Moscow | 159 | 149 | 45.9 | 60.2 | 62.9 | |
| Milan | 435 | 428 | 23.3 | 39.9 | 40.9 | |
| Rome | 504 | 496 | 20.4 | 35.0 | 36.1 | |
| Palermo | 741 | 734 | 7.7 | 18.2 | 18.9 | |
| Nantes | 168 | 158 | 55.9 | 74.0 | 75.6 | |
Publisher’s Note: MDPI stays neutral with regard to jurisdictional claims in published maps and institutional affiliations. |
© 2020 by the authors. Licensee MDPI, Basel, Switzerland. This article is an open access article distributed under the terms and conditions of the Creative Commons Attribution (CC BY) license (http://creativecommons.org/licenses/by/4.0/).
Share and Cite
MDPI and ACS Style
Carlier, R.; Dabbagh, M.; Krarti, M. Impact of Wall Constructions on Energy Performance of Switchable Insulation Systems. Energies 2020, 13, 6068. https://0-doi-org.brum.beds.ac.uk/10.3390/en13226068
AMA Style
Carlier R, Dabbagh M, Krarti M. Impact of Wall Constructions on Energy Performance of Switchable Insulation Systems. Energies. 2020; 13(22):6068. https://0-doi-org.brum.beds.ac.uk/10.3390/en13226068
Chicago/Turabian StyleCarlier, Remy, Mohammad Dabbagh, and Moncef Krarti. 2020. "Impact of Wall Constructions on Energy Performance of Switchable Insulation Systems" Energies 13, no. 22: 6068. https://0-doi-org.brum.beds.ac.uk/10.3390/en13226068
Note that from the first issue of 2016, this journal uses article numbers instead of page numbers. See further details here.