Thermodynamic Analysis of the Dryout Limit of Oscillating Heat Pipes
by
Florian Schwarz
1,2,*, 
Vladimir Danov
2,
Alexander Lodermeyer
1,
Alexander Hensler
2 and
Stefan Becker
1 1
Institute of Process Machinery and Systems Engineering, Friedrich-Alexander-Universität Erlangen-Nürnberg, 91058 Erlangen, Germany
2
Siemens AG, 91056 Erlangen, Germany
*
Author to whom correspondence should be addressed.
Energies 2020, 13(23), 6346; https://0-doi-org.brum.beds.ac.uk/10.3390/en13236346
Submission received: 23 October 2020
/
Revised: 16 November 2020
/
Accepted: 26 November 2020
/
Published: 1 December 2020
(This article belongs to the Special Issue Thermal Management of Power Electronic Devices, Circuits, and Systems: Innovative Solutions for the WBG Era)
Abstract
:The operating limits of oscillating heat pipes (OHP) are crucial for the optimal design of cooling systems. In particular, the dryout limit is a key factor in optimizing the functionality of an OHP. As shown in previous studies, experimental approaches to determine the dryout limit lead to contradictory results. This work proposes a compact theory to predict a dryout threshold that unifies the experimental and analytical data. The theory is based on the influence of vapor quality on the flow pattern. When the vapor quality exceeds a certain limit (x = 0.006), the flow pattern changes from slug flow to annular flow and the heat transfer decreases abruptly. The results indicate a uniform threshold value, which has been validated experimentally and by the literature. With that approach, it becomes possible to design an OHP with an optimized filling ratio and, hence, substantially improve its cooling abilities.
1. Introduction
The trend to miniaturize electronic components leads to an increased power density and thus to new requirements of thermal management. Especially in the field of power electronics, cooling plays a key role. Currently, the power density dissipation of semiconductors is about 100 W/cm. Modern wide bandgap semiconductors such as SiC or GaN will raise the heat flux density above 1000 W/cm [1,2]. These large heat fluxes are exceptionally well handled by two-phase cooling systems.
An established two-phase cooling system is the conventional heat pipe. They are considered to be state of the art in electronic devices and are available in different designs and shapes [3]. However, the cooling potential of a conventional heat pipe is limited by the mass flow of the wick. To handle higher heat fluxes, Akachi [4] developed and patented the first oscillating heat pipe in 1990. An oscillating heat pipe (OHP), also called pulsating heat pipe (PHP), is a passive two-phase system for heat spreading. Besides the tubular OHP shape from Ackachi, there are also flat plate OHPs [5]. Currently, various OHP shapes are available. Czajkowski et al. [6] presented a flower shape oscillating heat pipe for rotating systems. Also multi-layers three-dimensional OHPs have been experimentally investigated by Qu et al. [7]. Regardless of the shape, all OHPs have the same working principle. The first step to put an OHP into operation is to evacuate the channels. The OHP is then partially filled with a working liquid so that a vapor and a liquid phase is formed. After the filling process, both phases are in a thermodynamic equilibrium. A temperature difference between the evaporator and condenser leads to a thermodynamic disequilibrium. Due to the phase change and the pressure difference, the fluid starts to oscillate [8]. The OHP operates reliably as long as there is a continuous oscillating plug flow.
To describe the proper function of an OHP, Drolen and Smoot [9] developed a model that is based on the following parameters as operating limits:
- Channel size
- Vapor inertia limit
- Heat flux limit
- Sonic limit
- Viscous limit
The OHP can only operate when the vapor bubbles in the micro channel are separated by the liquid plugs. The fluid inside the channel has to consist of altering liquid and vapor parts. This formation depends on the surface tension. The smaller the diameter, the more dominates the surface tension, and the gravitational force can be neglected. Depending on the thermophysical properties of the fluid, there is a different threshold value for a micro channel diameter [10,11,12]. Regarding the maximum channel size, there is a vast body of work in the literature. In the area of PHPs, there are various threshold values which have been established experimentally. The threshold can be described by different numbers. The number [13] is a dimensionless number to define the micro channel threshold and is given by Equation (1).
Here, d is the diameter of the channel, g is the gravitational force, represents the surface tension, is the liquid density and the vapor density. The dimensionless number describes the ratio of hydrostatic and capillary pressure. The number [2,14] is defined by a unit of length and describes the threshold value above which the surface tension dominates. If the diameter is below the number, the gravitational force can be neglected [15]. The number is given by Equation (2).
The dimensionless Eötvös number is very similar to the number. Depending on the researcher, there are different definitions of the Eötvös number [2,14,16,17]. Khandekar and Groll [11] define the the number by Equation (3).
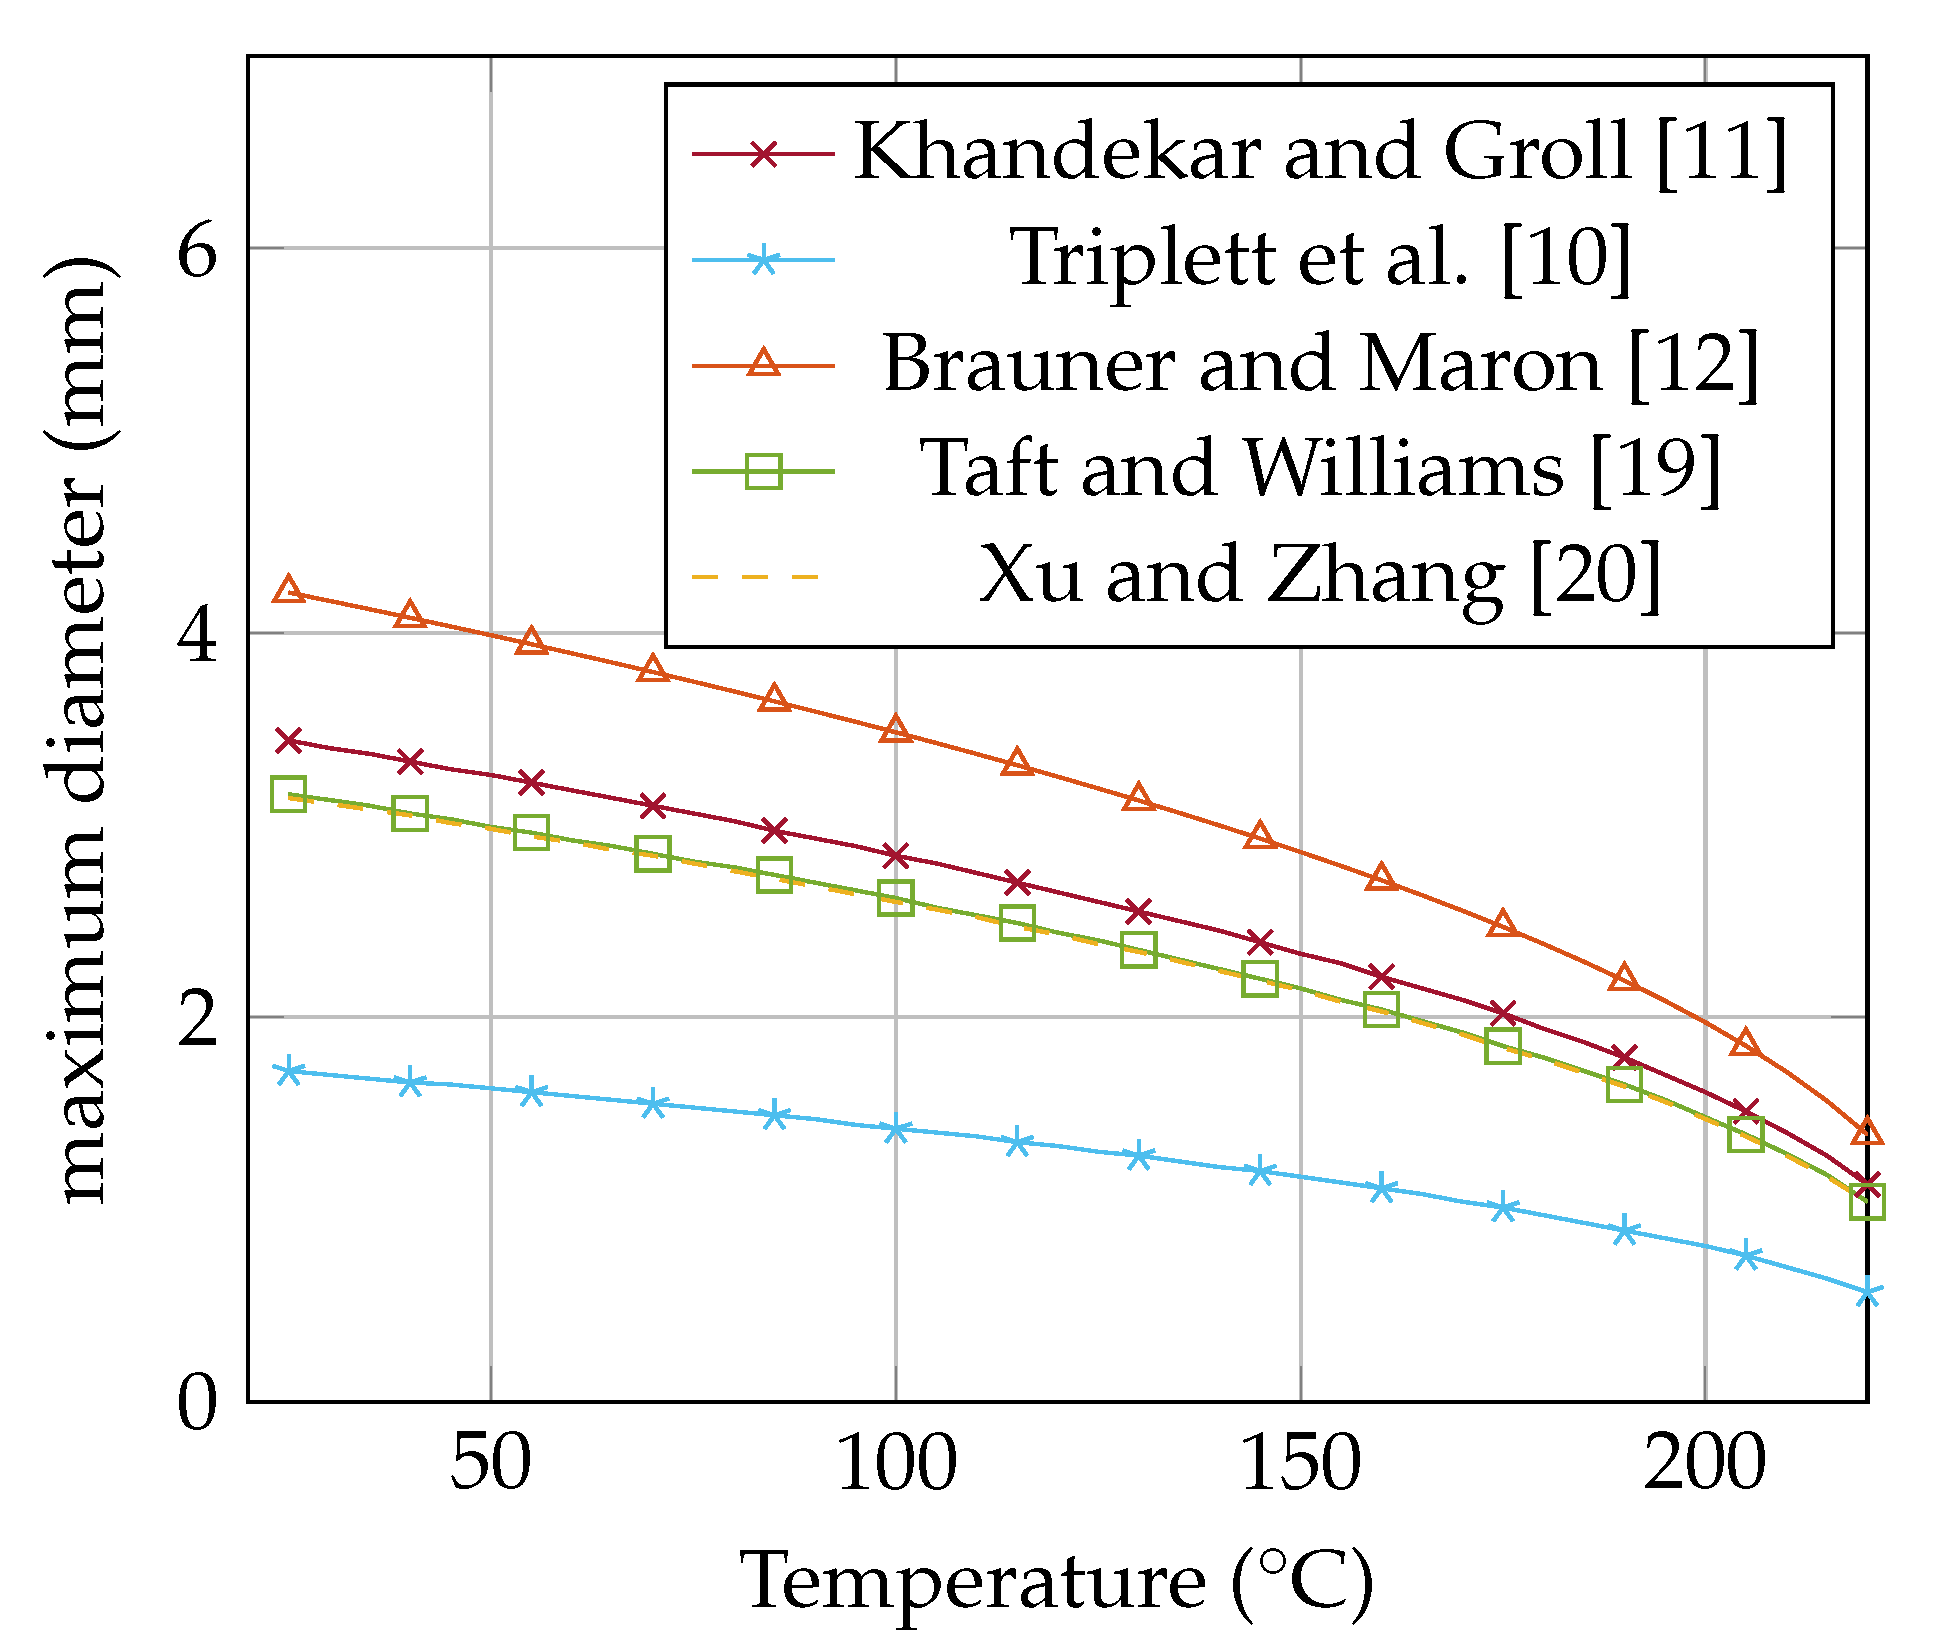
Table 1 shows different thresholds which are standardized by the number [2]. All definitions have in common that they include the density and the surface tension . Given that both parameters are dependent on the temperature, the diameter is also a function of temperature . For higher temperatures, the maximum diameter for micro channel flow becomes smaller, since the surface tension decreases at higher temperatures. Figure 1 shows the maximum diameter in dependence on the temperature of acetone. The values are calculated with the equations of Table 1 and the thermodynamic fluid properties from REFPROP [18]. The calculated diameter is the maximum permissible diameter for a plug flow.
All threshold values tend towards zero, since the surface tension at the critical point becomes zero, which becomes apparent when the two-phases disappear. Taft and Williams [19] set the Bo number of 0.85 for the maximum radius. That leads to a normalized definition of . Also, Ma [5] is using this definition to predict the maximum radius.

Table 1.
Comparison of the threshold diameter for water at 25 .
| Name | Equation | Normalized | d (mm) |
|---|---|---|---|
| Khandekar and Groll [11] | 3.44 | ||
| Triplett et al. [10] | 1.72 | ||
| Brauner and Maron [12] | 4.21 | ||
| Xu and Zhang [20] | 3.14 | ||
| Taft and Williams [19] | 3.16 |
The other limits, namely vapor inertia limit, heat flux limit and viscous limit have in common that the evaporation fraction plays a major role and dominates the limits. Drolen and Smoot [9] derive equations for these specific limits. All these limits lead to a dryout of the OHP. In case of dryout, the two-phase flow changes from slug to churn flow, thus the heat transfer deteriorates rapidly. Bastakoti et al. [21] states in a literature review that the dryout occurs especially when there is a low filling ratio and a high heat input. The filling ratio (FR) plays a key role for OHPs. It is not only decisive for reliable operation of OHPs, but also for the start up and the dryout limit. Zhang and Faghri [8] showed that an OHP operates reliably with a filling ratio of 20% to 80%. Also Yin et al. [22] derived a formulation for the theoretical maximum filling ratio of 80%. Liu et al. [6] showed that each fluid has an individual optimal filling ratio for the start up process.
Shi and Pan [23] investigated the influence of the filling ratio during the start up process. Therefore, they had an experimental setup for a flat plate OHP with 40 channels. The 1 × 1 channels were charged with acetone. They measured the thermal resistance for various filling ratios and increased the heat input from 23 W to 210 W. With a filling ratio of 50%, the dryout limit was at 80 W heat input. While a filling ratio of 70% leads to a dryout at about 110 W. The thermal performance improves with increased heat input until the OHP dries out and the heat transport abruptly subsides.
Winkler et al. [24] tested a 20 channel OHP made of copper with a 1.5 × 1.5 cross section filled with acetone. They measured a constant filling ratio of 50% and increased the heat input from 0 W to 180 W and investigated the influence of the condenser sizes. The experiment with a 1.5 × 1.5 OHP reaches the dryout limit above 125 W heat input.
As shown above, the optimal OHP design strongly depends on the filling ratio [5,8,22]. On the one hand, the filling ratio has an impact to the start up behavior, on the other hand it influences the thermal resistance [23]. The operating limits are dominated by the dryout limit, which is also a function of the filling ratio [9]. Therefore, the filling ratio plays a key role in the optimization of the OHP design. At the optimal operation point, there is a maximum heat transfer and a minimal thermal resistance. Due to different heat inputs, geometries and working fluids in previous studies [8,23,24] it is not possible to predict the dryout limit and to find an optimal filling ratio. When a dryout takes place, the flow pattern changes to annular flow and the heat transfer deteriorates rapidly. There are different approaches to explain the dryout phenomena itself [5,25,26]. However there is no empirical value that indicates the dryout limit of OHPs. With the present study, we aim to predict the dryout limit in dependence of the filling ratio. Our theoretical approach is based on the change of the filling ratio as a function of the operating temperature. This effect has already been published in [5,9], but it is assumed in all studies that this effect is negligible. Firstly, we derive an equation to calculate the vapor quality x for OHPs as a function of the operation temperature. Therefore, it is possible to calculate the change of the filling ratio. The vapor quality x is used to describe the dryout threshold of OHPs. Secondly, the dryout threshold of x = 0.006 is measured experimentally. As soon as it exceeds this threshold value, the OHP dries out. Finally, this approach also validates the previous studies in the literature with their different boundary conditions and merges the findings into one unified theory.
2. Experimental Setup
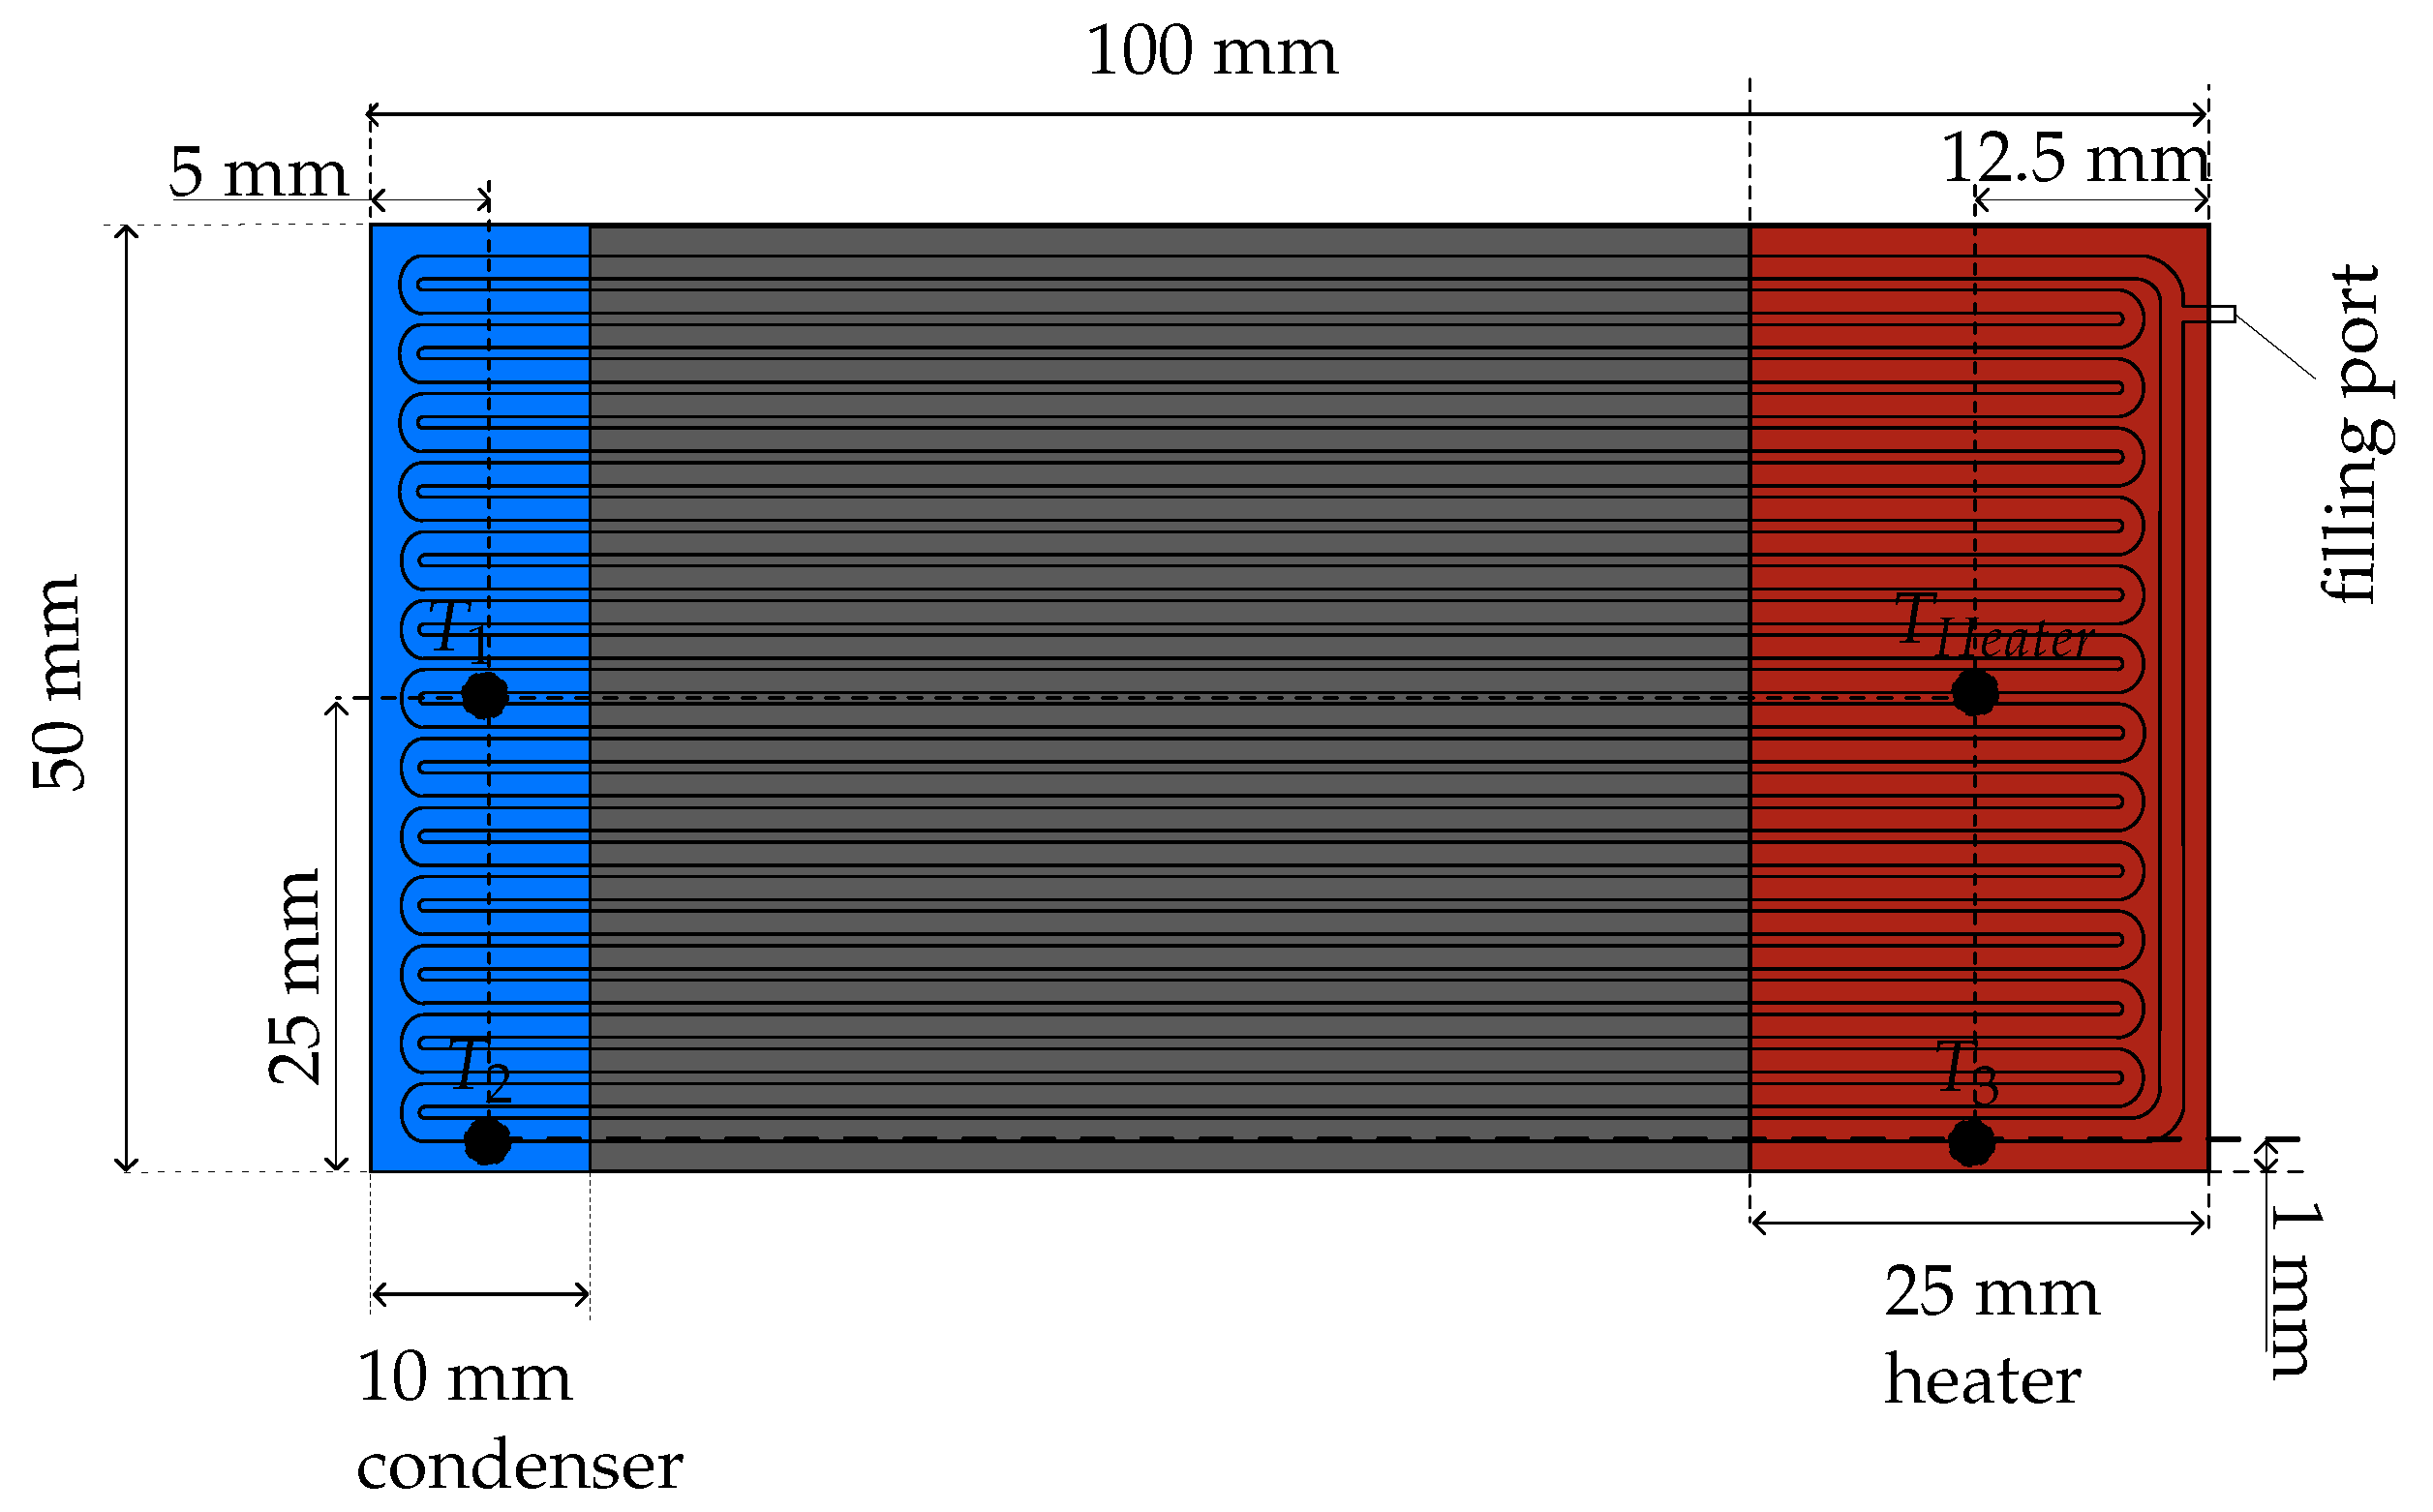
The OHP has an overall volume of 150 × 50 × 2 . It is made of copper and has 26 channels with a cross section of 1 × 1 . The distance between the channels is set to 0.5 . To manufacture the OHP, the channels are first milled into the lower half of the copper plate, then it is brazed to a copper cover. The OHP was manufactured by the Fraunhofer IPM.
Figure 2 shows a schematic representation of the OHP with the meandering channel design. The heater (on the right side in Figure 2) has the dimensions of 50 × 25 × 2.5 , which results in a heater area of 50 × 25 . The condenser (on the left side in Figure 2) is realized by a water heat sink made of aluminum and has the dimensions of 50 × 10 × 10 . The contact area between condenser and OHP is 50 × 10 .
The temperature of the heater is measured by the integrated thermocouple of the heater Ultramic600. Two thermocouples type K (from TC Ltd., London, UK) are used to measure the temperature of the condenser. is located in the center between the OHP and the heat sink. is placed on the side of the OHP. Experimental studies have shown that OHPs work reliably with a filling ratio between 50% and 60% [21,27]. Therefore, a filling ratio of 53 % was chosen for our experiment. Acetone was used as a working fluid. The fluid was thoroughly degassed prior to filling. The experiment was investigated in horizontal orientation.
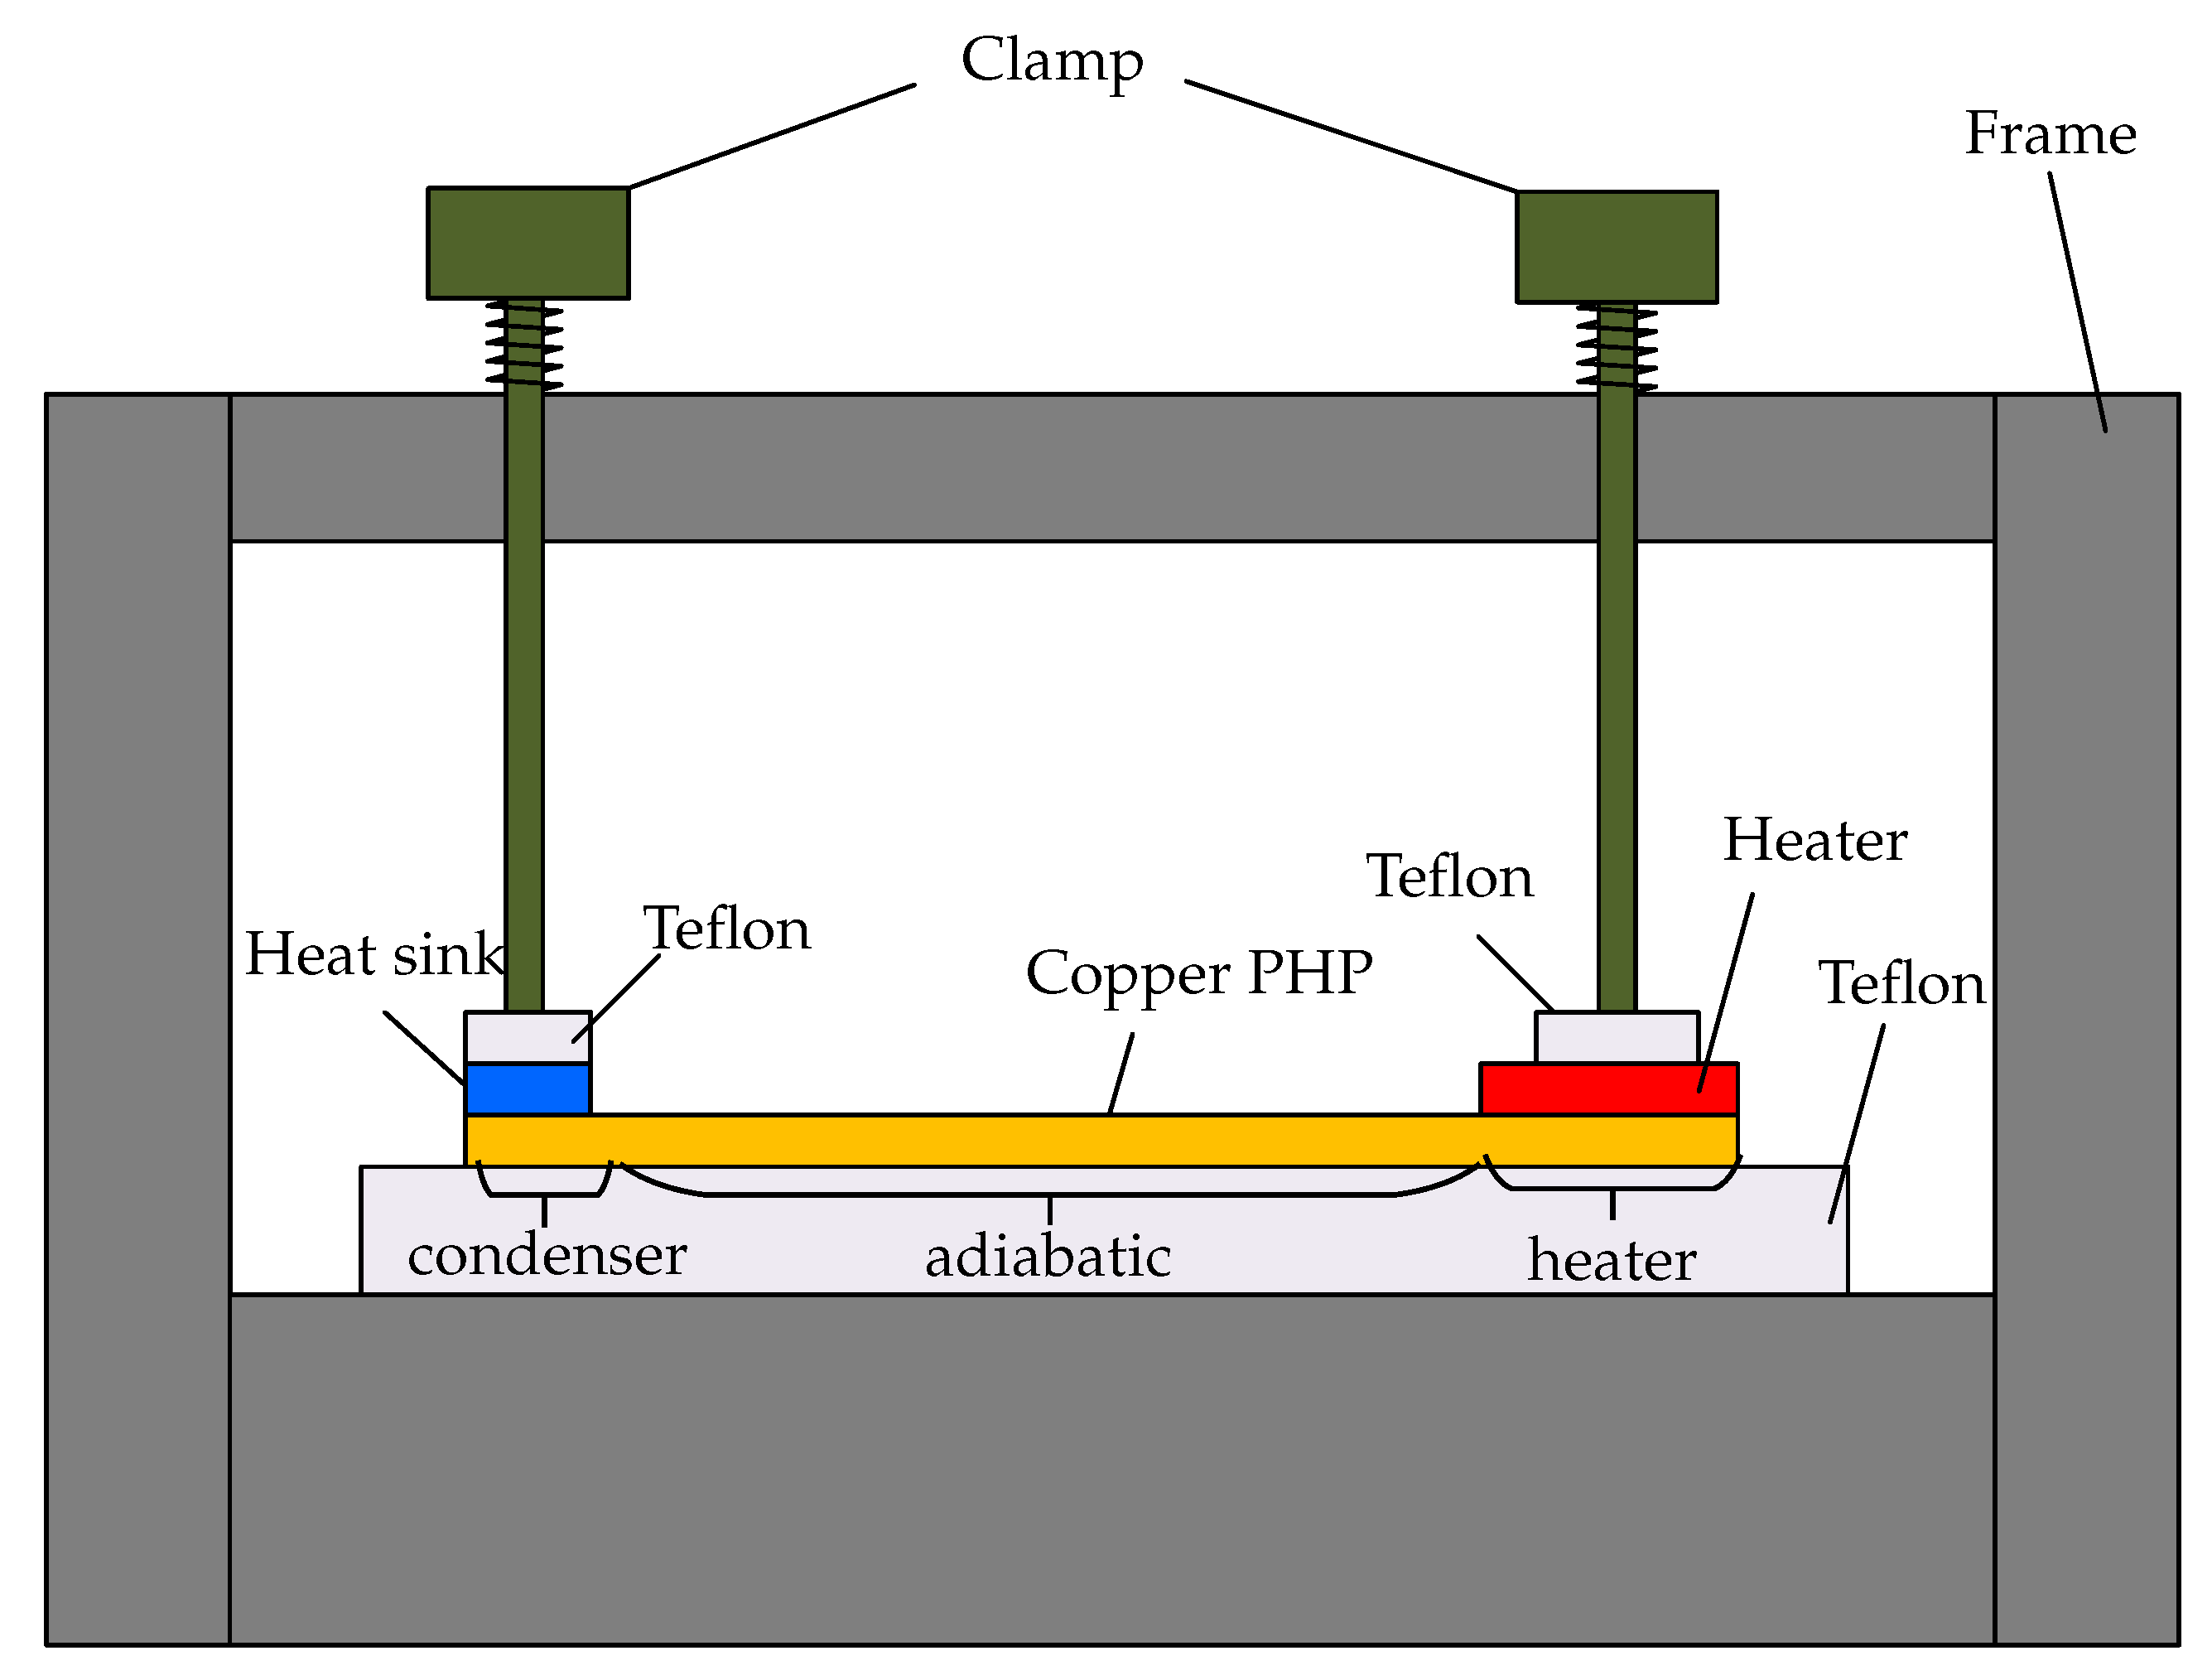
The experimental setup is shown in Figure 3. It consists of an OHP module with an evaporator, an adiabatic and a condenser section. For the experiment, Watlow ceramic heater Ultramic600 has been used as a heat source, which was supplied with a DC current power supply unit (Xantrex XKW 150-7). The cooling water is provided by a circulating chiller (Lauda Alpha A6). The section between evaporator and condenser is insulated by a Teflon plate from below and by wool from above. Both heater and heat sink are fixed by clamps. Due to the isolation, it is assumed that the heat flux through the OHP is equal to the electrical power (). The temperature of the condenser is the average of and . The thermal resistance is calculated by Equation (4):
The accuracy in the measurement is for the temperature, ±0.1 V for the voltage and ±0.01 A for the current of the power source. At 15 W, there is a temperature difference of 14.2 K (±3 K) between the heater and the condenser. This leads to a measurement accuracy of 21% for the temperature at 15 W. The temperature difference at 90 W is 39.4 K (±3 K), that results in an accuracy of 8%. The measurement accuracy for the power source is 45 V (±0.1 V) 0.34 A (±0.01 A) = 15.3 W (±3.16%) for the lowest power input. At the highest power level there is an accuracy of 119 V (±0.1 V) 0.76 A (±0.01 A) = 90.44 W (±1.40%). Calculating the thermal resistant R with Equation (4) results in an accuracy range from 24.3% at 15 W to 9.0% at 90 W.
Results of the Measurement
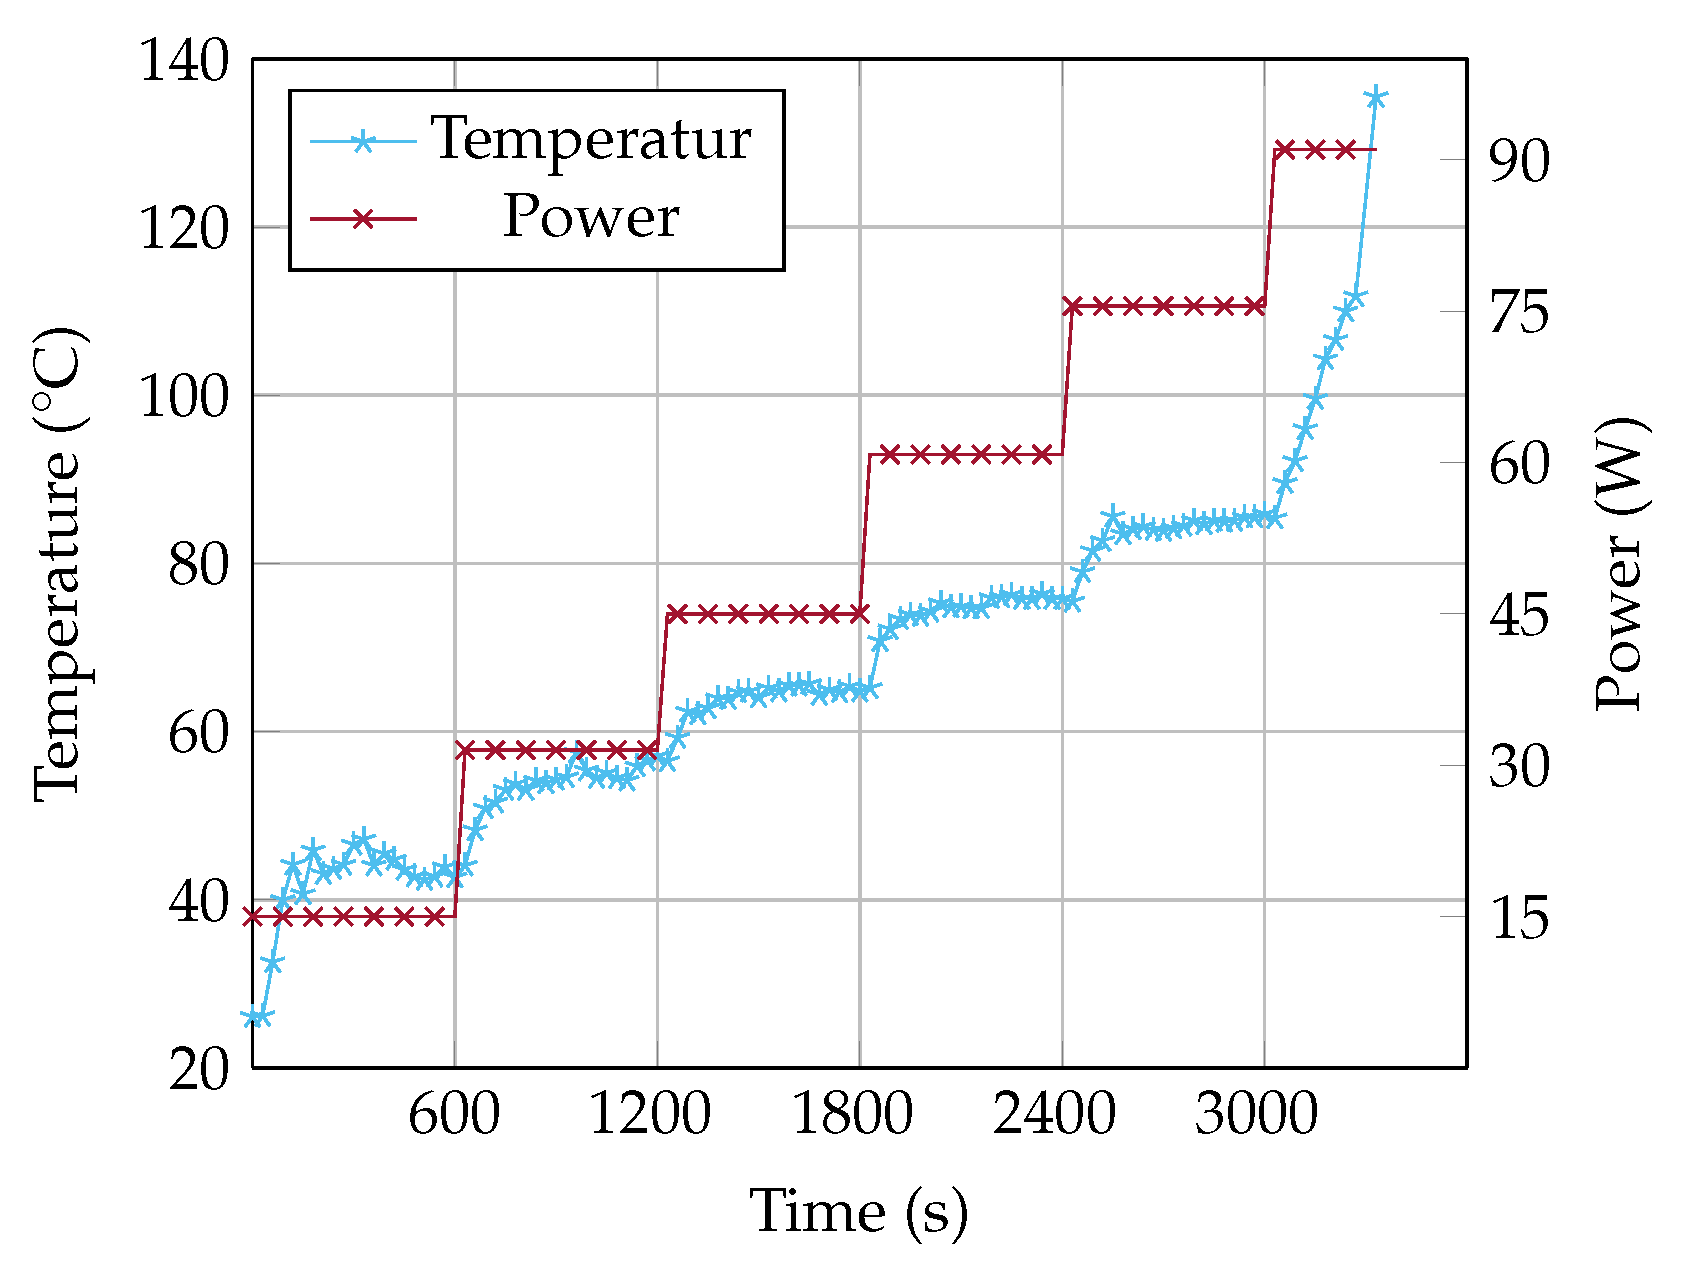
Figure 4 shows the temperature of the heater as a function of increasing heat input. The temperature fluctuation at a heat input of 15 W results from the start up operation condition of the OHP. During the start up, there is no continuous flow, the temperature and thereby also the pressure is increasing until the fluid starts to oscillate. As soon as the fluid oscillates, the temperature and the pressure at the heater decreases and the fluid stops to oscillate. The heat input is not high enough for a continuous oscillation. Above a heat input of 30 W, the fluid oscillates continuously and the OHP operates reliably. Up to 75 W, the temperature rises continuously with each power level. At a heat input of 90 W, the temperature rises from 85 to 140 . This rapid rise in temperature is due to the dryout. As soon as heat can no longer be transferred, the temperature rises rapidly. For safety regulations, the experiment is limited to a maximum temperature of 140 .
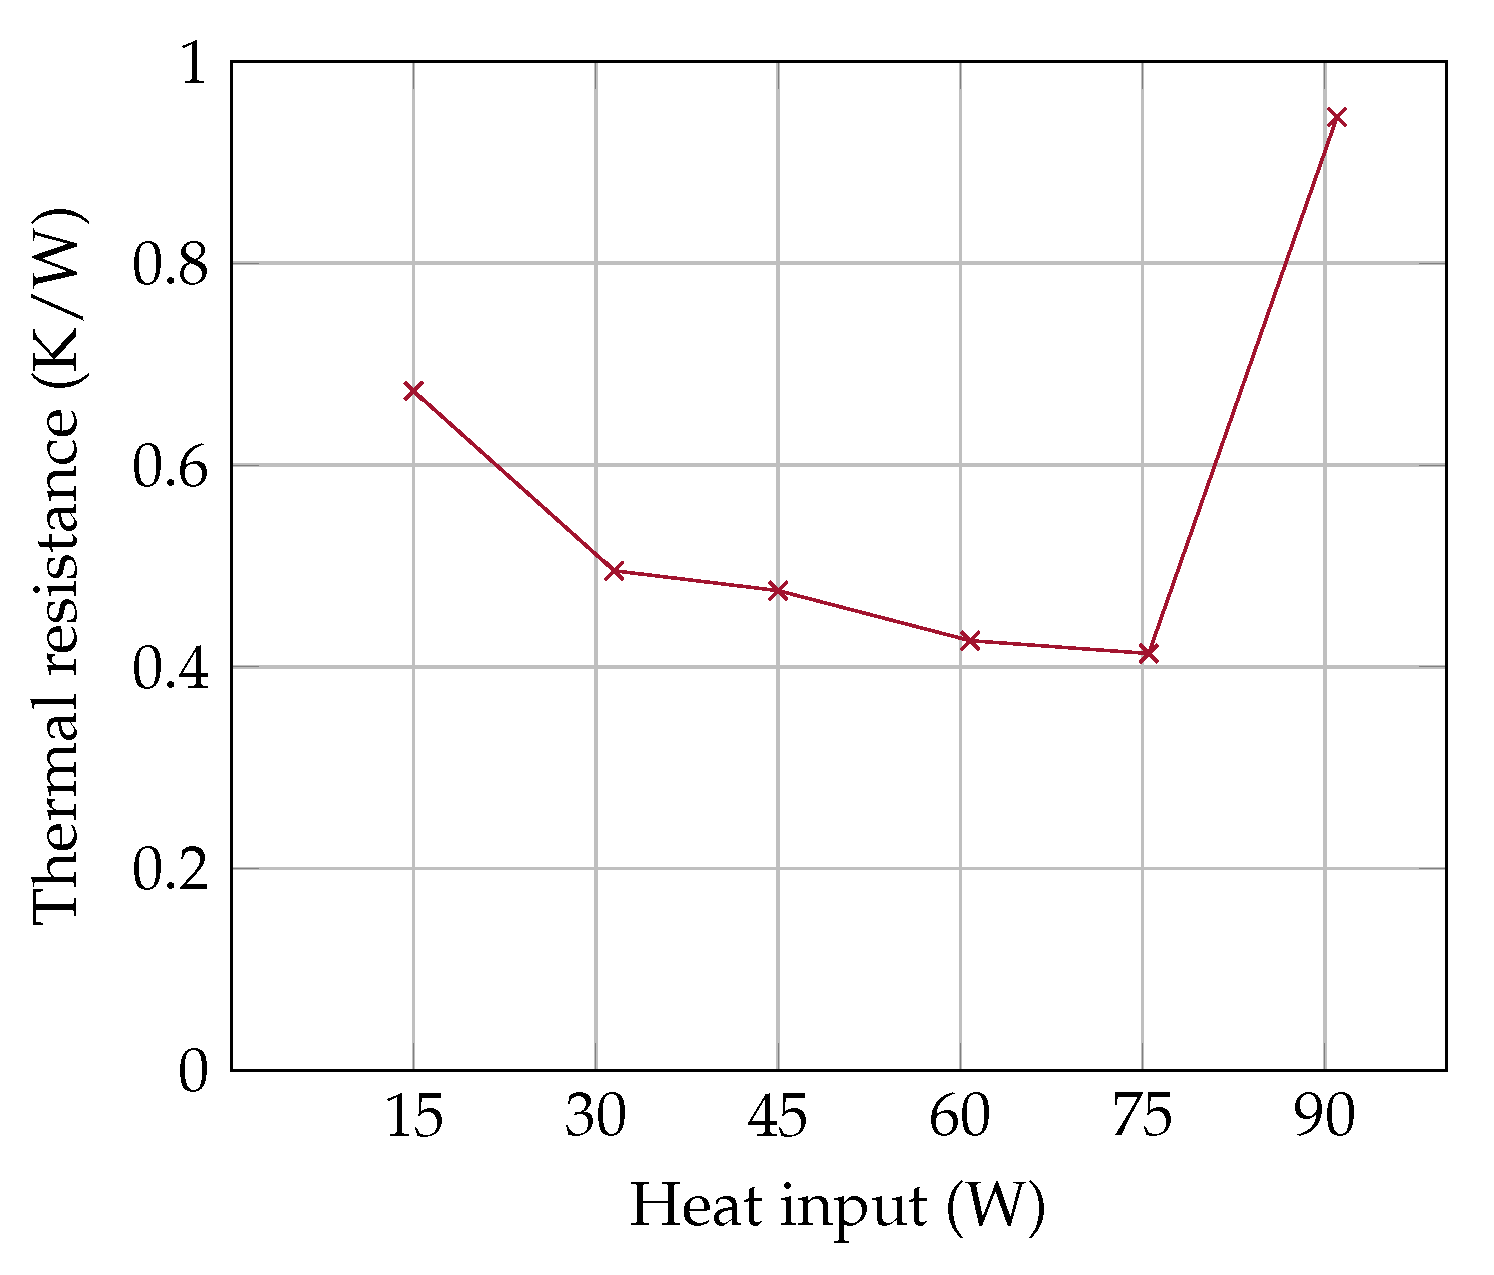
The thermal resistance of the OHP is shown in Figure 5. At 15 W, there is no continuous fluid flow, which results in a high thermal resistance of 0.7 (K/W). Between 30 W and 75 W the OHP works reliably and the improves continuously up to 0.41 (K/W) with increasing heat input. Above 75 W, the OHP dries out and the thermal resistance deteriorates rapidly above 0.9 (K/W).
3. Thermodynamic Considerations on the Working Principle of OHPs
To predict the dryout limit, an equation for the vapor quality is derived in Section 4. For this derivation, we assume that the filling ratio is a function of the temperature. When an OHP gets filled with acetone at 25 temperature with a filling rate of 35% and operates at a temperature of 175 , the filling ratio changes to 43%. In the following, the relation between the filling ratio and the vapor quality is illustrated in a PT- and PV-diagram.
There are various ways to define the filling ratio of a two-phase system. In the field of OHPs, the filling ratio is typically defined as the ratio of liquid volume to the total volume. The liquid volume is a function of the temperature. Therefore, Equation (5) refers to the filling ratio at the filling temperature ().
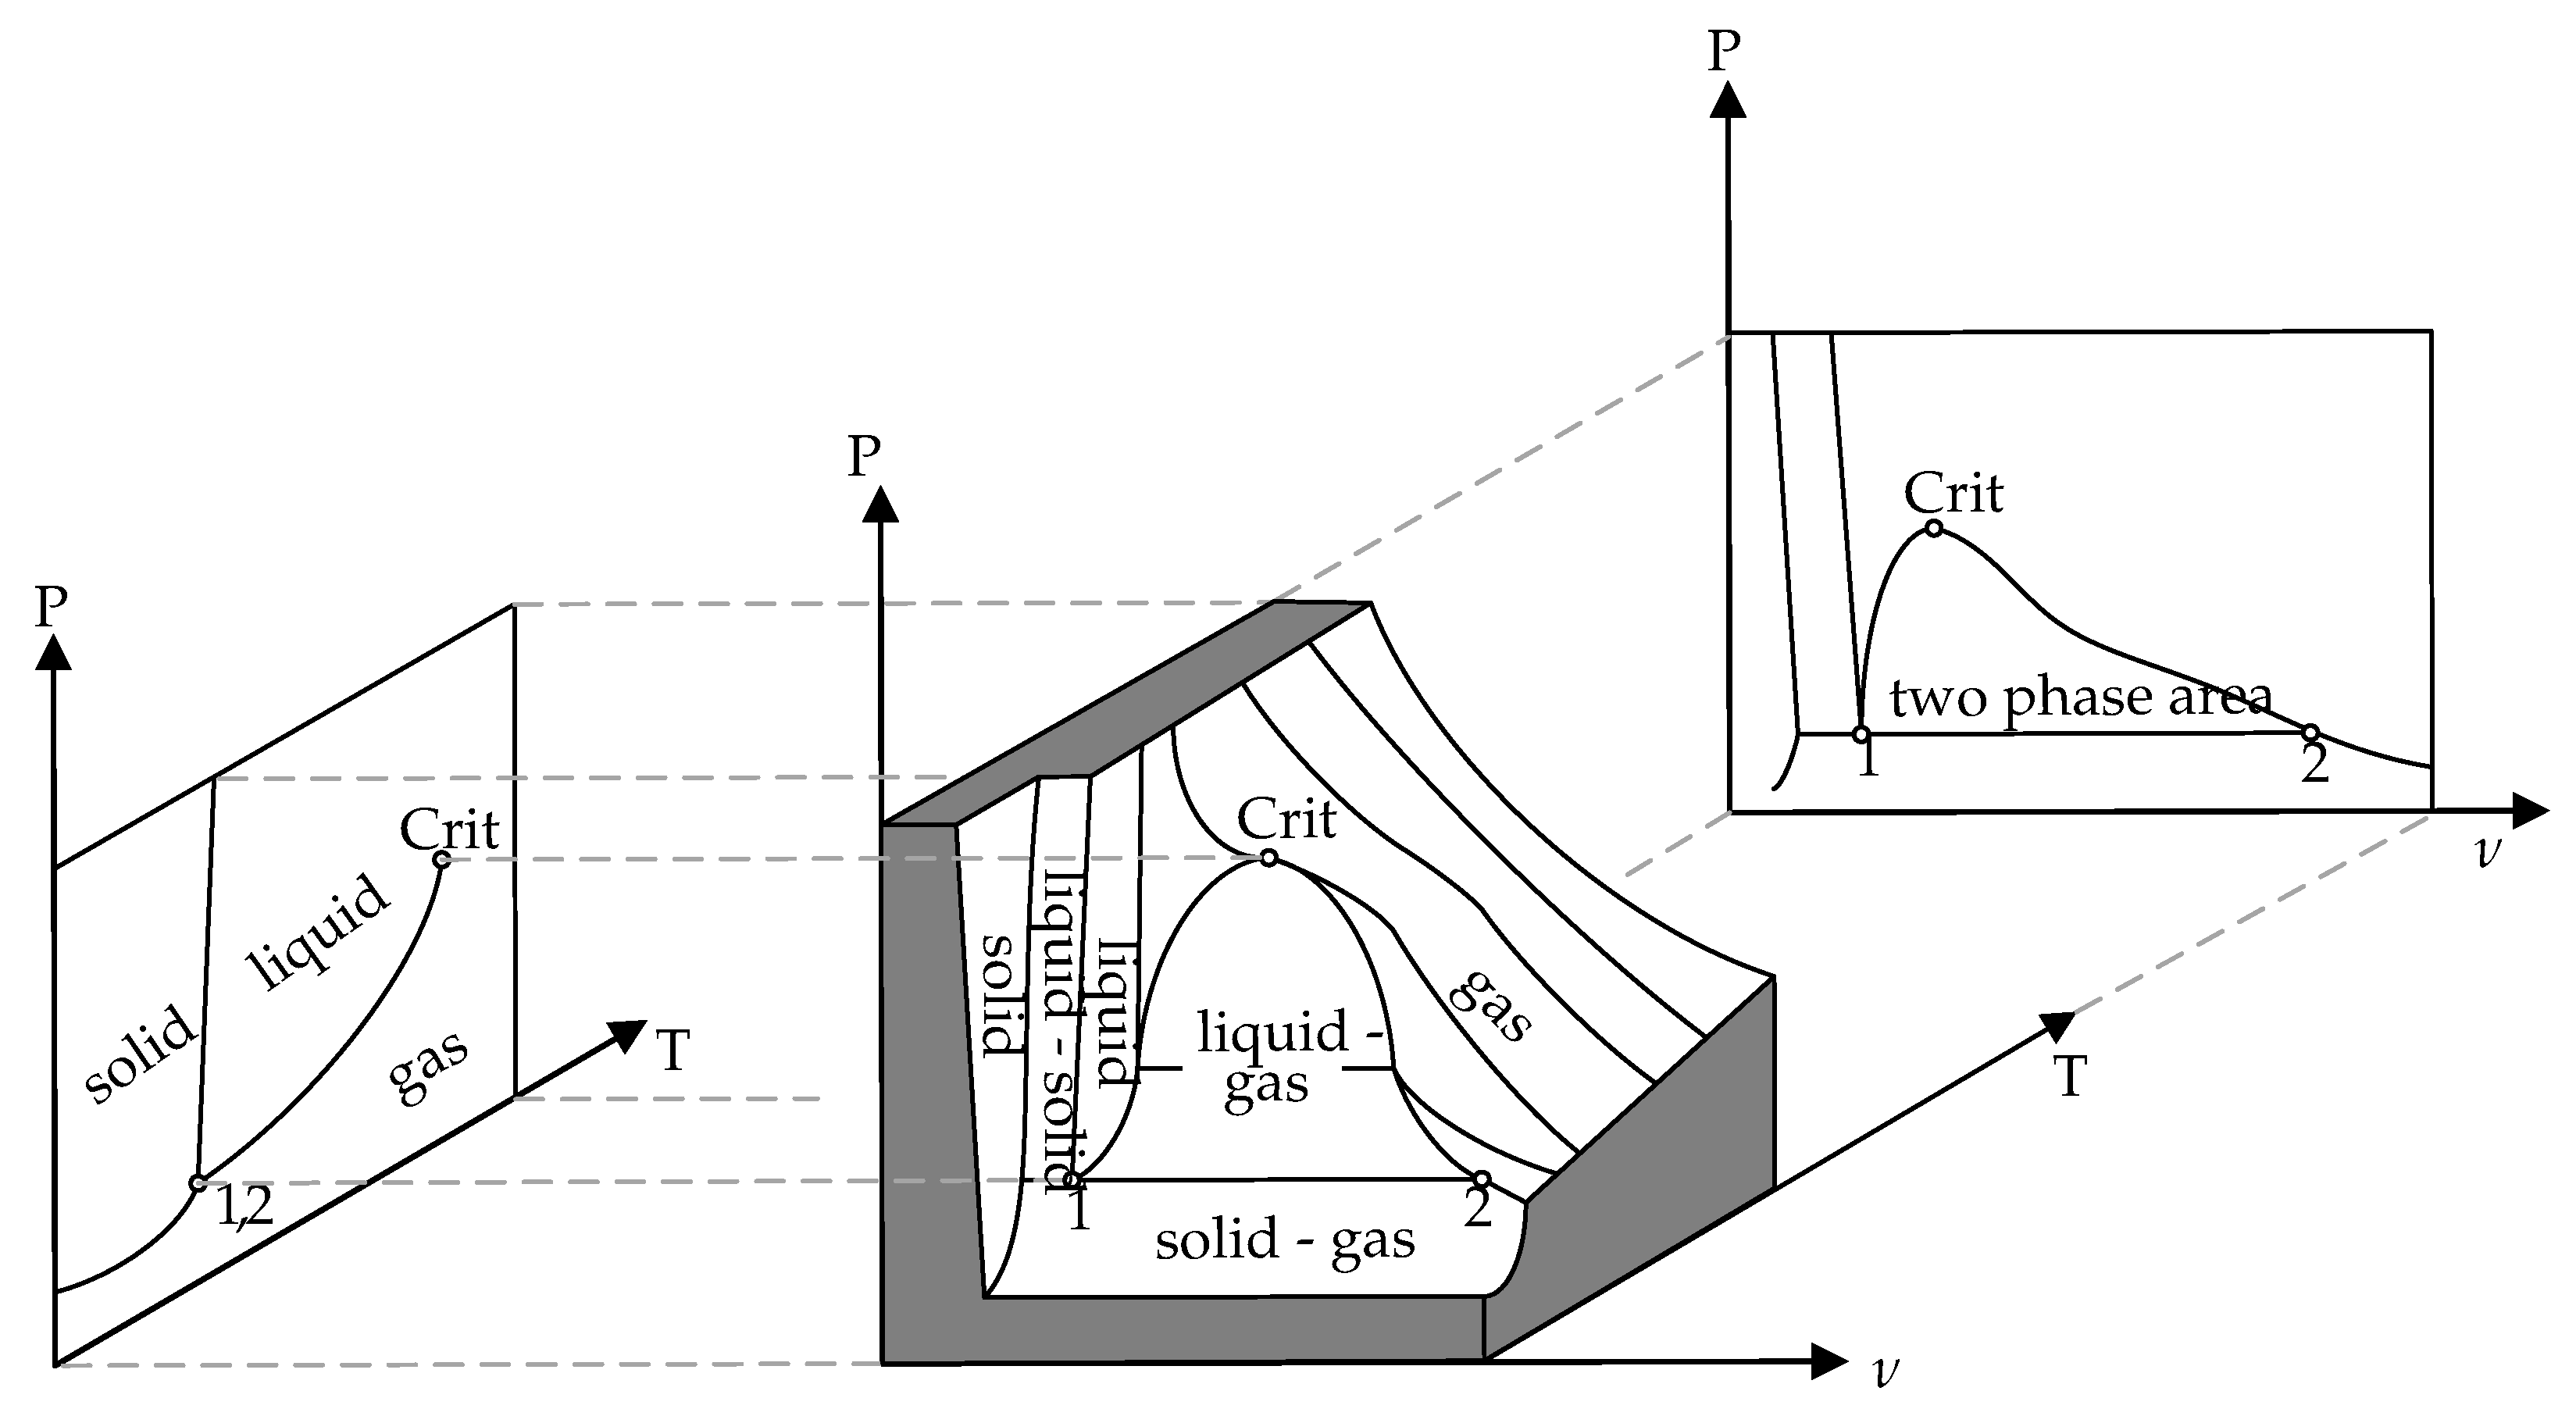
Both phases are in a thermodynamic equilibrium, so the pressure is only a function of the temperature. Every point is on the vapor pressure curve and can be calculated with the relation of Clausius-Clapeyron [28]. On the left side of Figure 6, there is a PT-diagram with a vapor pressure curve for a pure fluid. A vapor-liquid system which is in a thermodynamic equilibrium can be located at any point on the vapor pressure curve between the triple point and the critical point. However, the PT-diagram contains no information about the change of the filling ratio, which occurs when the temperature rises. The PV-diagram, on the right side in Figure 6, has a two-phase area where the vapor quality x is given. All the information about the change of state is illustrated in the PVT-diagram. The PV- and PT-diagrams are only different planes in the PVT-diagram. For the design of an OHP, it is important to know how the ratio of vapor to liquid is changing during the operation.
Since the OHP has a closed volume, an isochoric state of change can be assumed for the entire system. The specific volume of the OHP is given by Equation (6).
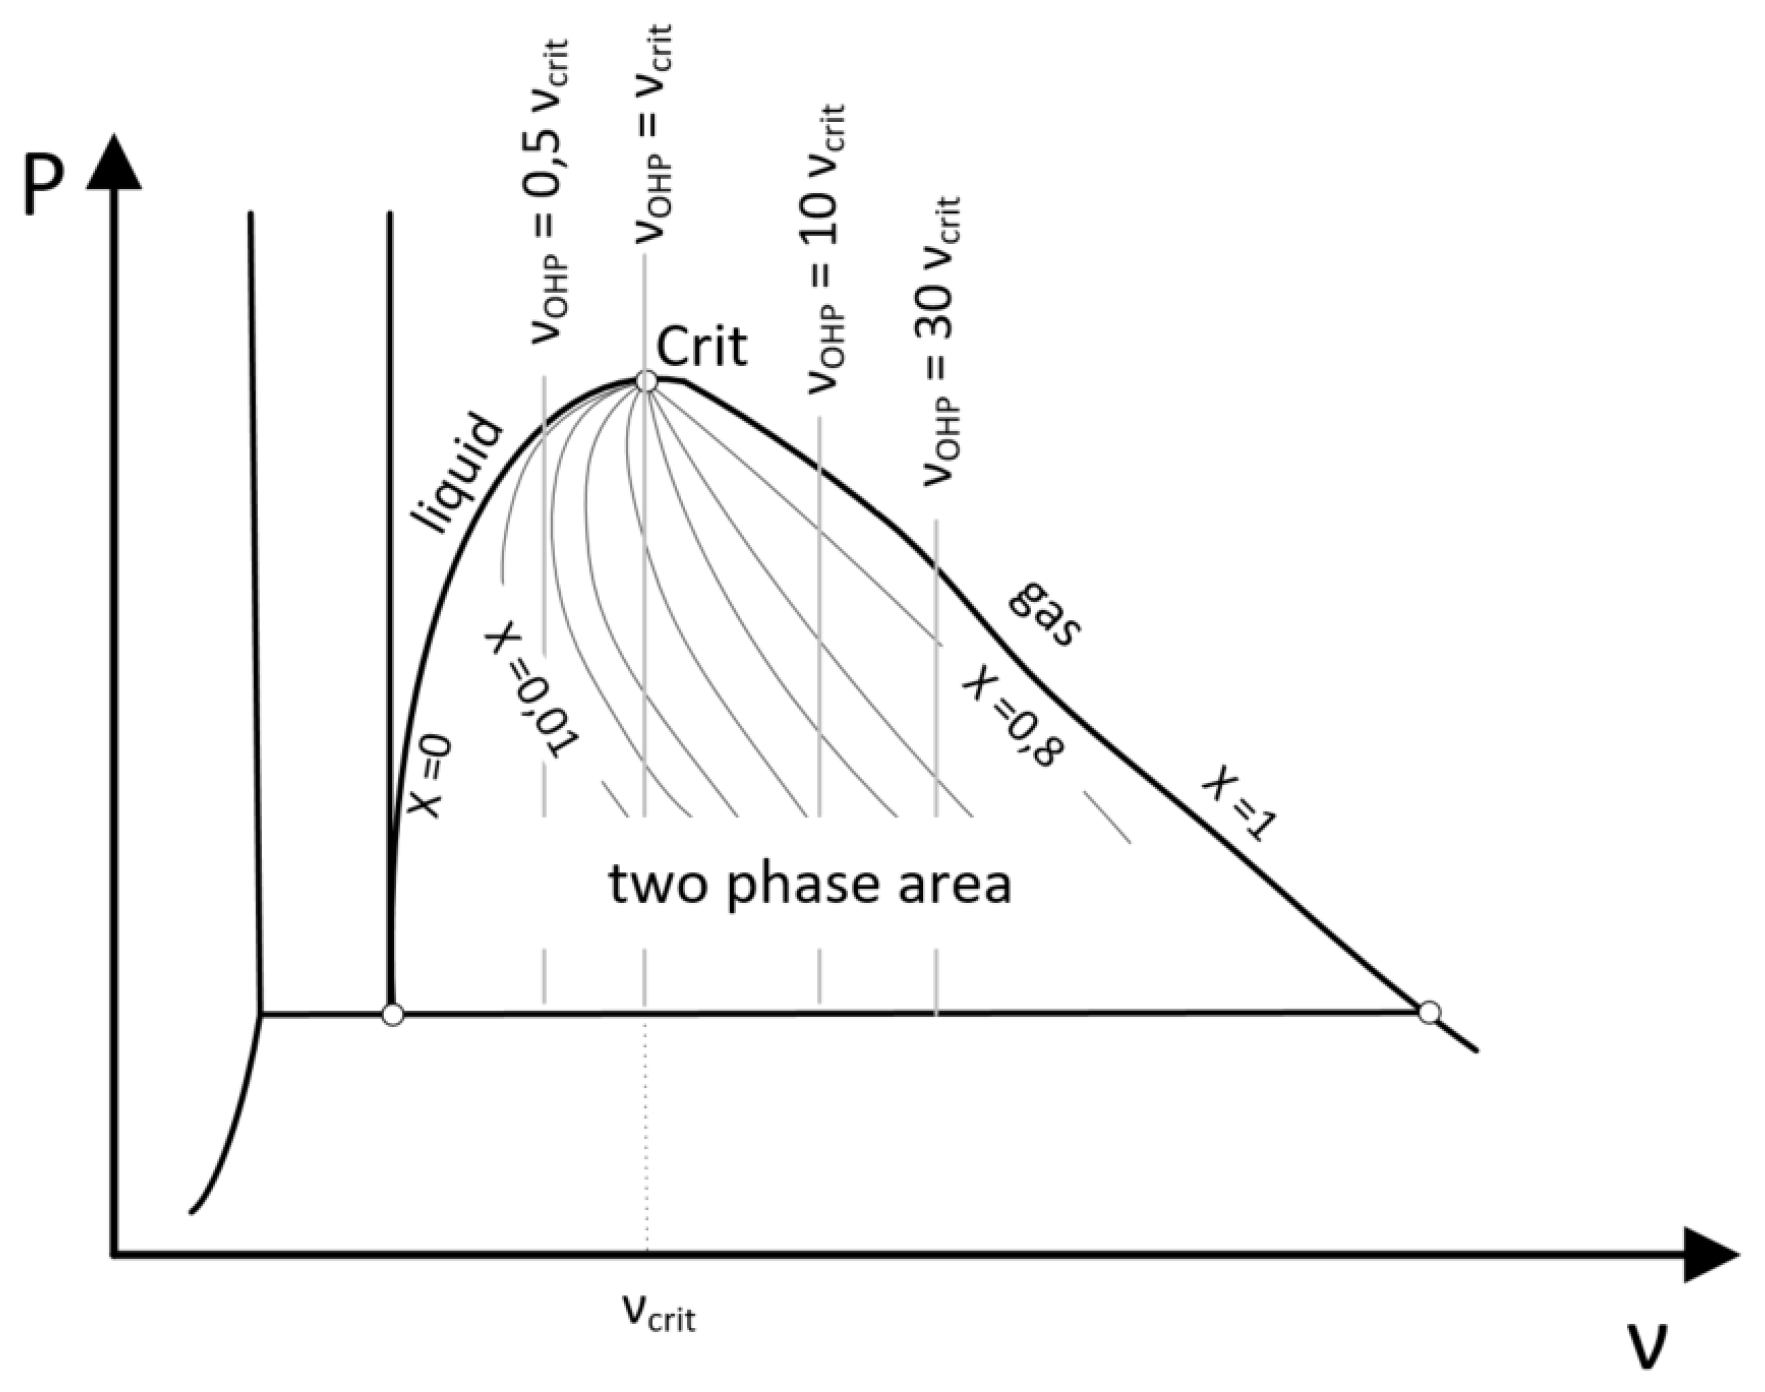
Figure 7 illustrates some isochoric states of change in a PV-diagram. The isochoric curve can be described as a ratio of the specific volume of the system to the critical volume of the fluid. In general, the isochoric curves in Figure 7 can be classified into three categories:
- : the entire fluid can become liquid
- : there are always two-phases, because the isochoric is equal to the vapor pressure curve
- : the entire fluid can become gaseous
In Section 4, an analytical model is presented to determine the dryout threshold. The approach is based on the influence of vapor quality on the flow pattern. If the vapor quality exceeds a certain limit, the flow pattern changes from slug flow to annular flow and the OHP dries out. This effect can be illustrated by calculating the vapor quality along the specific isochoric curve.
4. Model to Determine the Dryout Threshold
By applying Equation (7), it is possible to calculate the thermodynamic state of the vapor quality x as a function of the temperature (T).
The vapor quality x is the ratio of the vapor mass at saturated temperature to the total mass of the fluid. The total mass is the sum of the vapor and the liquid mass . Equation (8) shows another way to calculate the vapor quality in dependence of the specific volume of the OHP , the specific liquid volume and the specific vapor volume of the working fluid.
Here is the saturated specific volume of the liquid and of the vapor phase. The specific volume of the OHP is the ratio of the total OHP volume and the fluid mass , which is expressed by Equation (9). It shows that the specific volume of the OHP is independent of the temperature and remains constant after filling the filling process.
When the total mass of the fluid is known, the vapor quality x can be calculated by Equation (8). In many studies, only the filling ratio of the OHP is given. Therefore, the filling ratio must be converted into the specific volume of the OHP . This is possible by the following steps which lead to Equation (15) in dependence of the filling temperature (FT). Rearranging Equation (7) shows a relation between the liquid mass and the vapor quality x which is represented by Equation (10).
The liquid volume is also given by Equation (12).
Combining Equations (5), (12) and (11) lead to Equation (13). The filling ratio is a function of the specific volume and the vapor quality x.
Substituting Equation (8) in (13) leads to Equation (14), the filling ratio is solely a function of the specific volume. Since the specific volume at filling temperature is calculated, the temperature (T) in Equation (8) is set to the filling temperature ().
To calculate the vapor quality in dependence of the specific volume and the filling ratio, it is necessary to consider the reference temperature of Equations (8) and (13). The effect on an increasing and decreasing vapor quality is only traceable along the isochoric curve. Hence, the specific volume in Equation (15) is constant and refers to the filling temperature (). However, the values in Equation (8) refer to the operation temperature (T). Considering the reference temperatures and combining (8) and (15) leads to Equation (16).
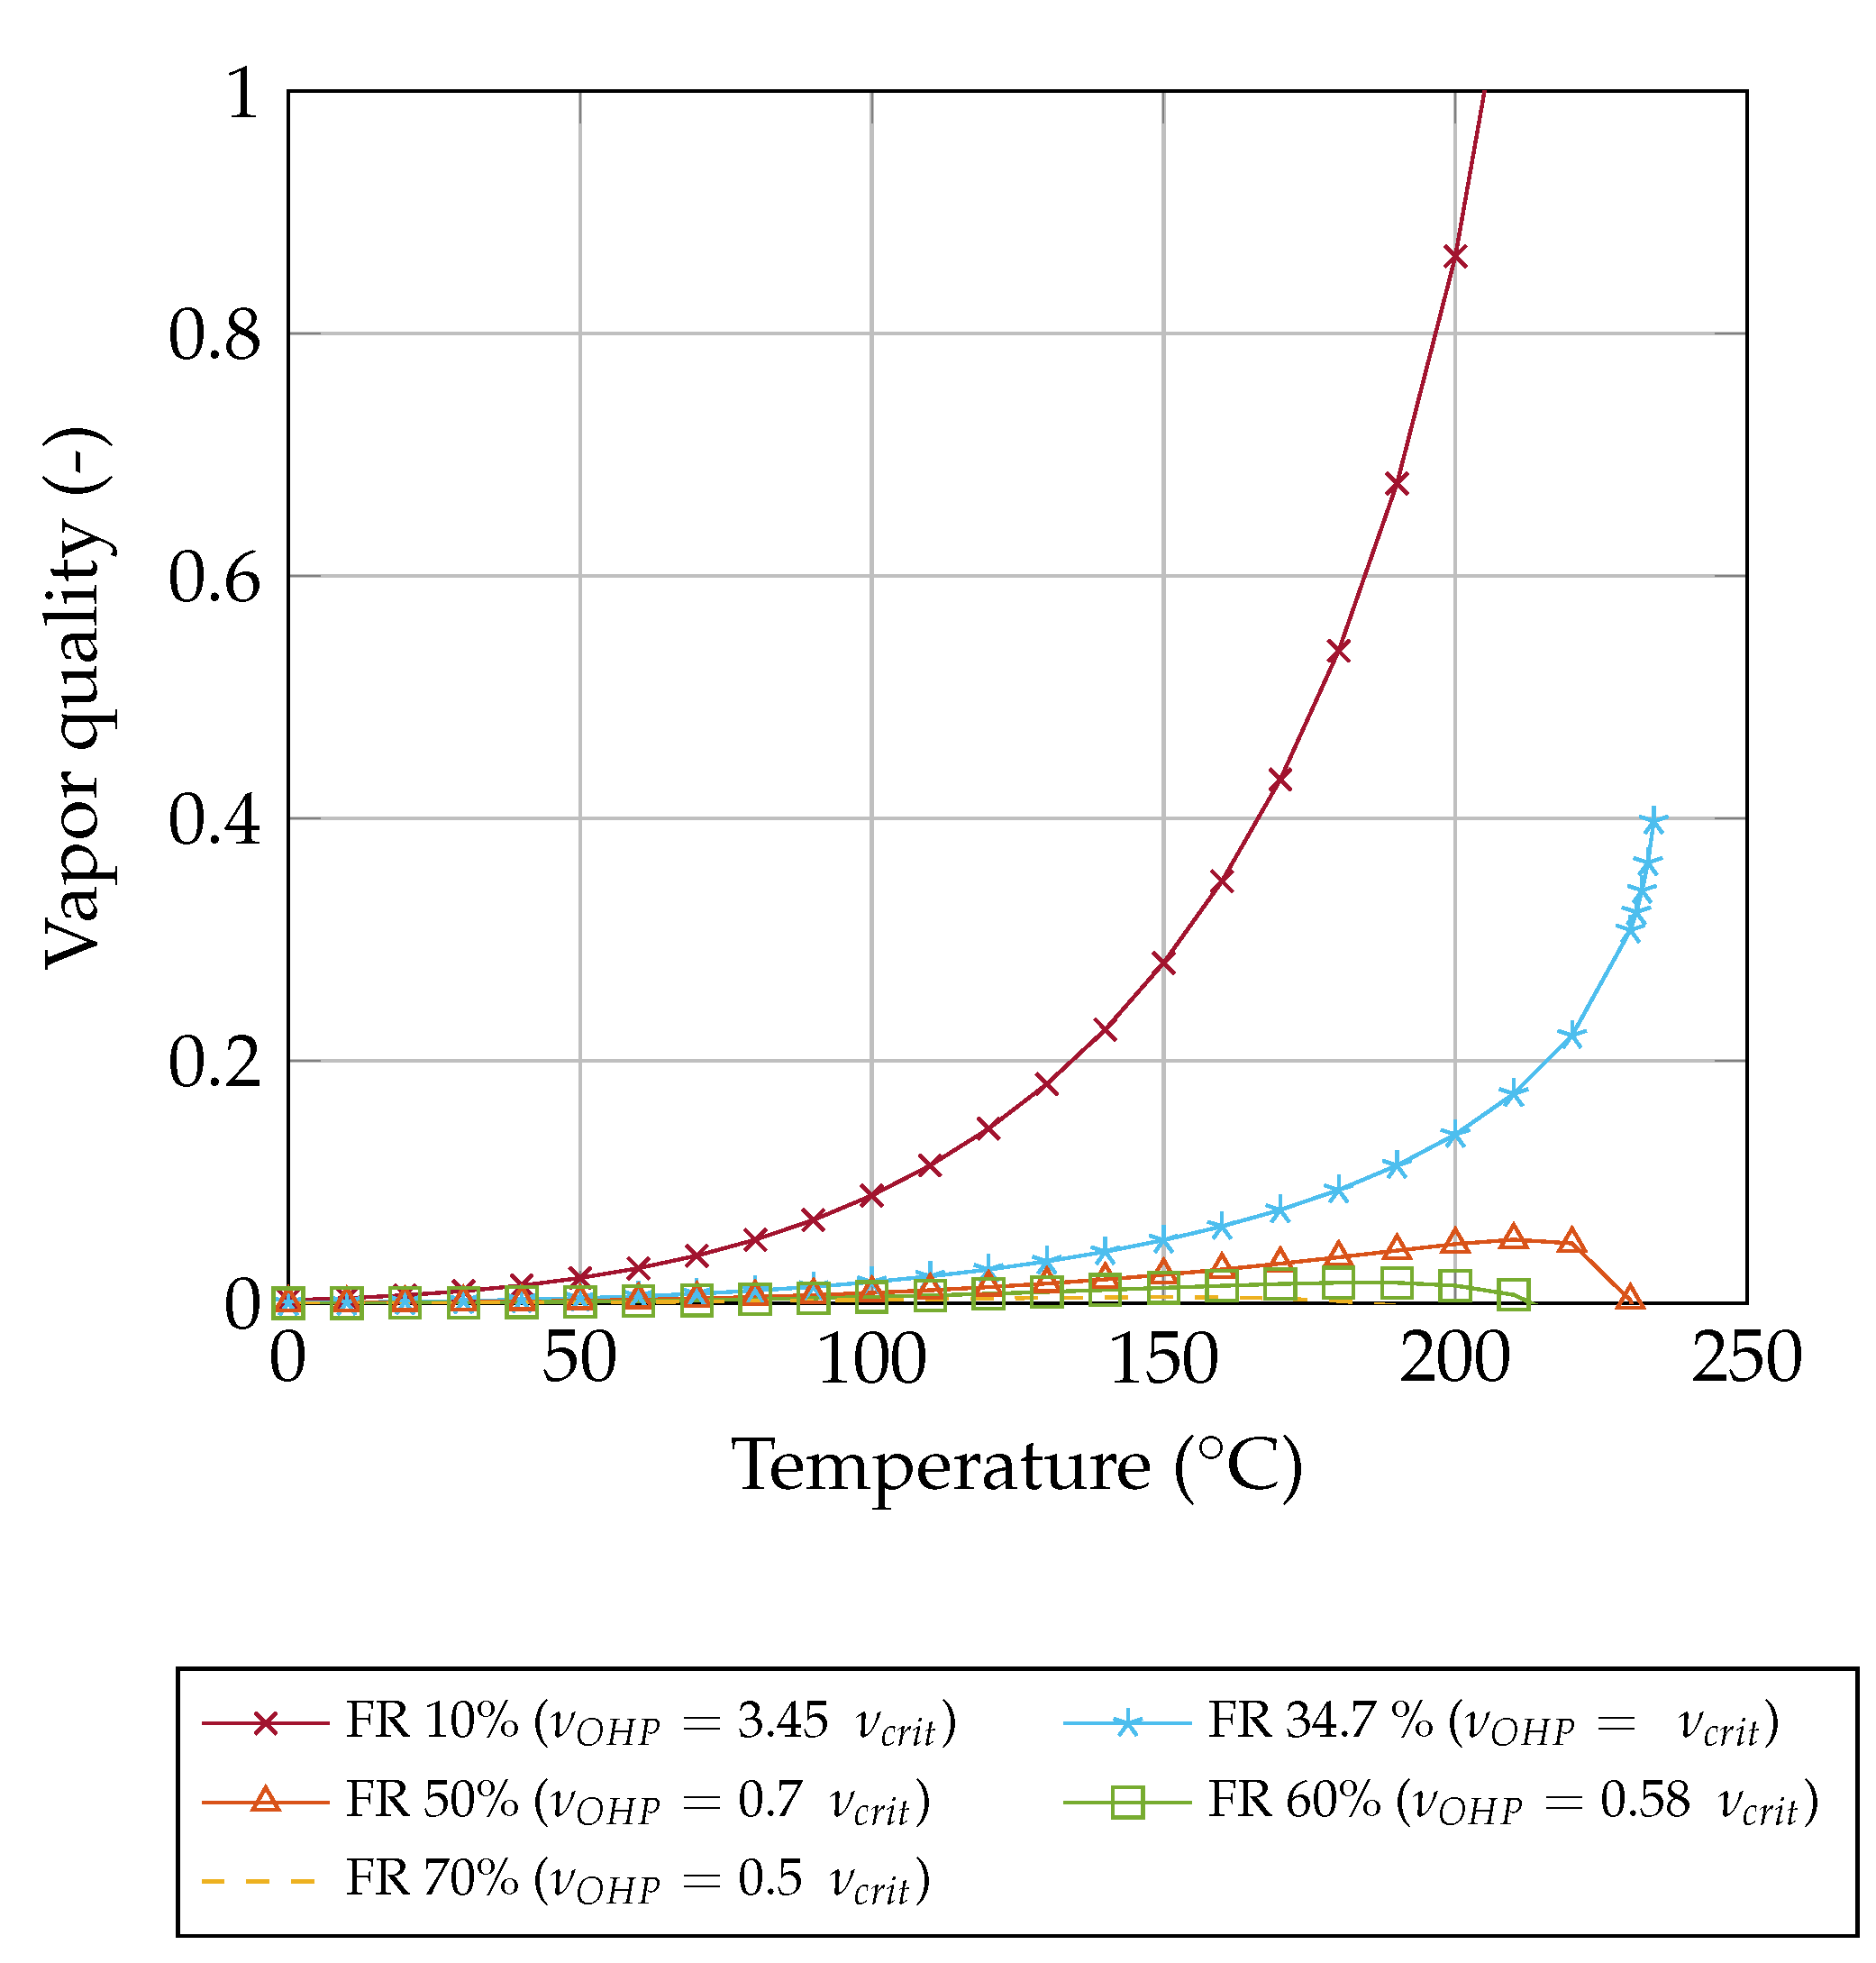
Figure 8 illustrates the vapor quality (Equation (16)) of acetone for different filling ratios in general. For , the entire OHP becomes gaseous at 210 . For , the vapor quality is increasing and end at the critical point. For the vapor quality first increases and then decreases as the temperature rises.
Determination of the Dryout Threshold
Our experimental data shows a dryout at a temperature of 89.6 with a filling ratio of 53%. Using Equation (16) leads to a vapor quality of x = 0.006. Above this threshold, the flow changes from slug flow to annular flow and the heat transfer decreases abruptly (dryout). According to the literature, this limit is generally valid for OHPs filled with acetone. Regardless of the filling ratio, the dryout takes place at a vapor quality threshold of x = 0.006.
In the field of convective flow boiling in micro channels, the flow pattern is a function of the vapor quality x [16,29]. There are flow pattern maps which illustrate the relationship between the vapor quality and the flow pattern [14,30]. Depending on the vapor quality x, the flow changes from slug flow to annular flow. These flow pattern maps have not been used in OHP research so far for two main reasons. Firstly, the vapor quality x is in the region of interest in the range from x = 0.1 to 1 for convective flow boiling. Secondly, it has been assumed that the ratio of vapor to liquid remains almost constant and can therefore be neglected in the field of OHPs [9]. However, our results show that the vapor quality also has an influence on the flow pattern for .
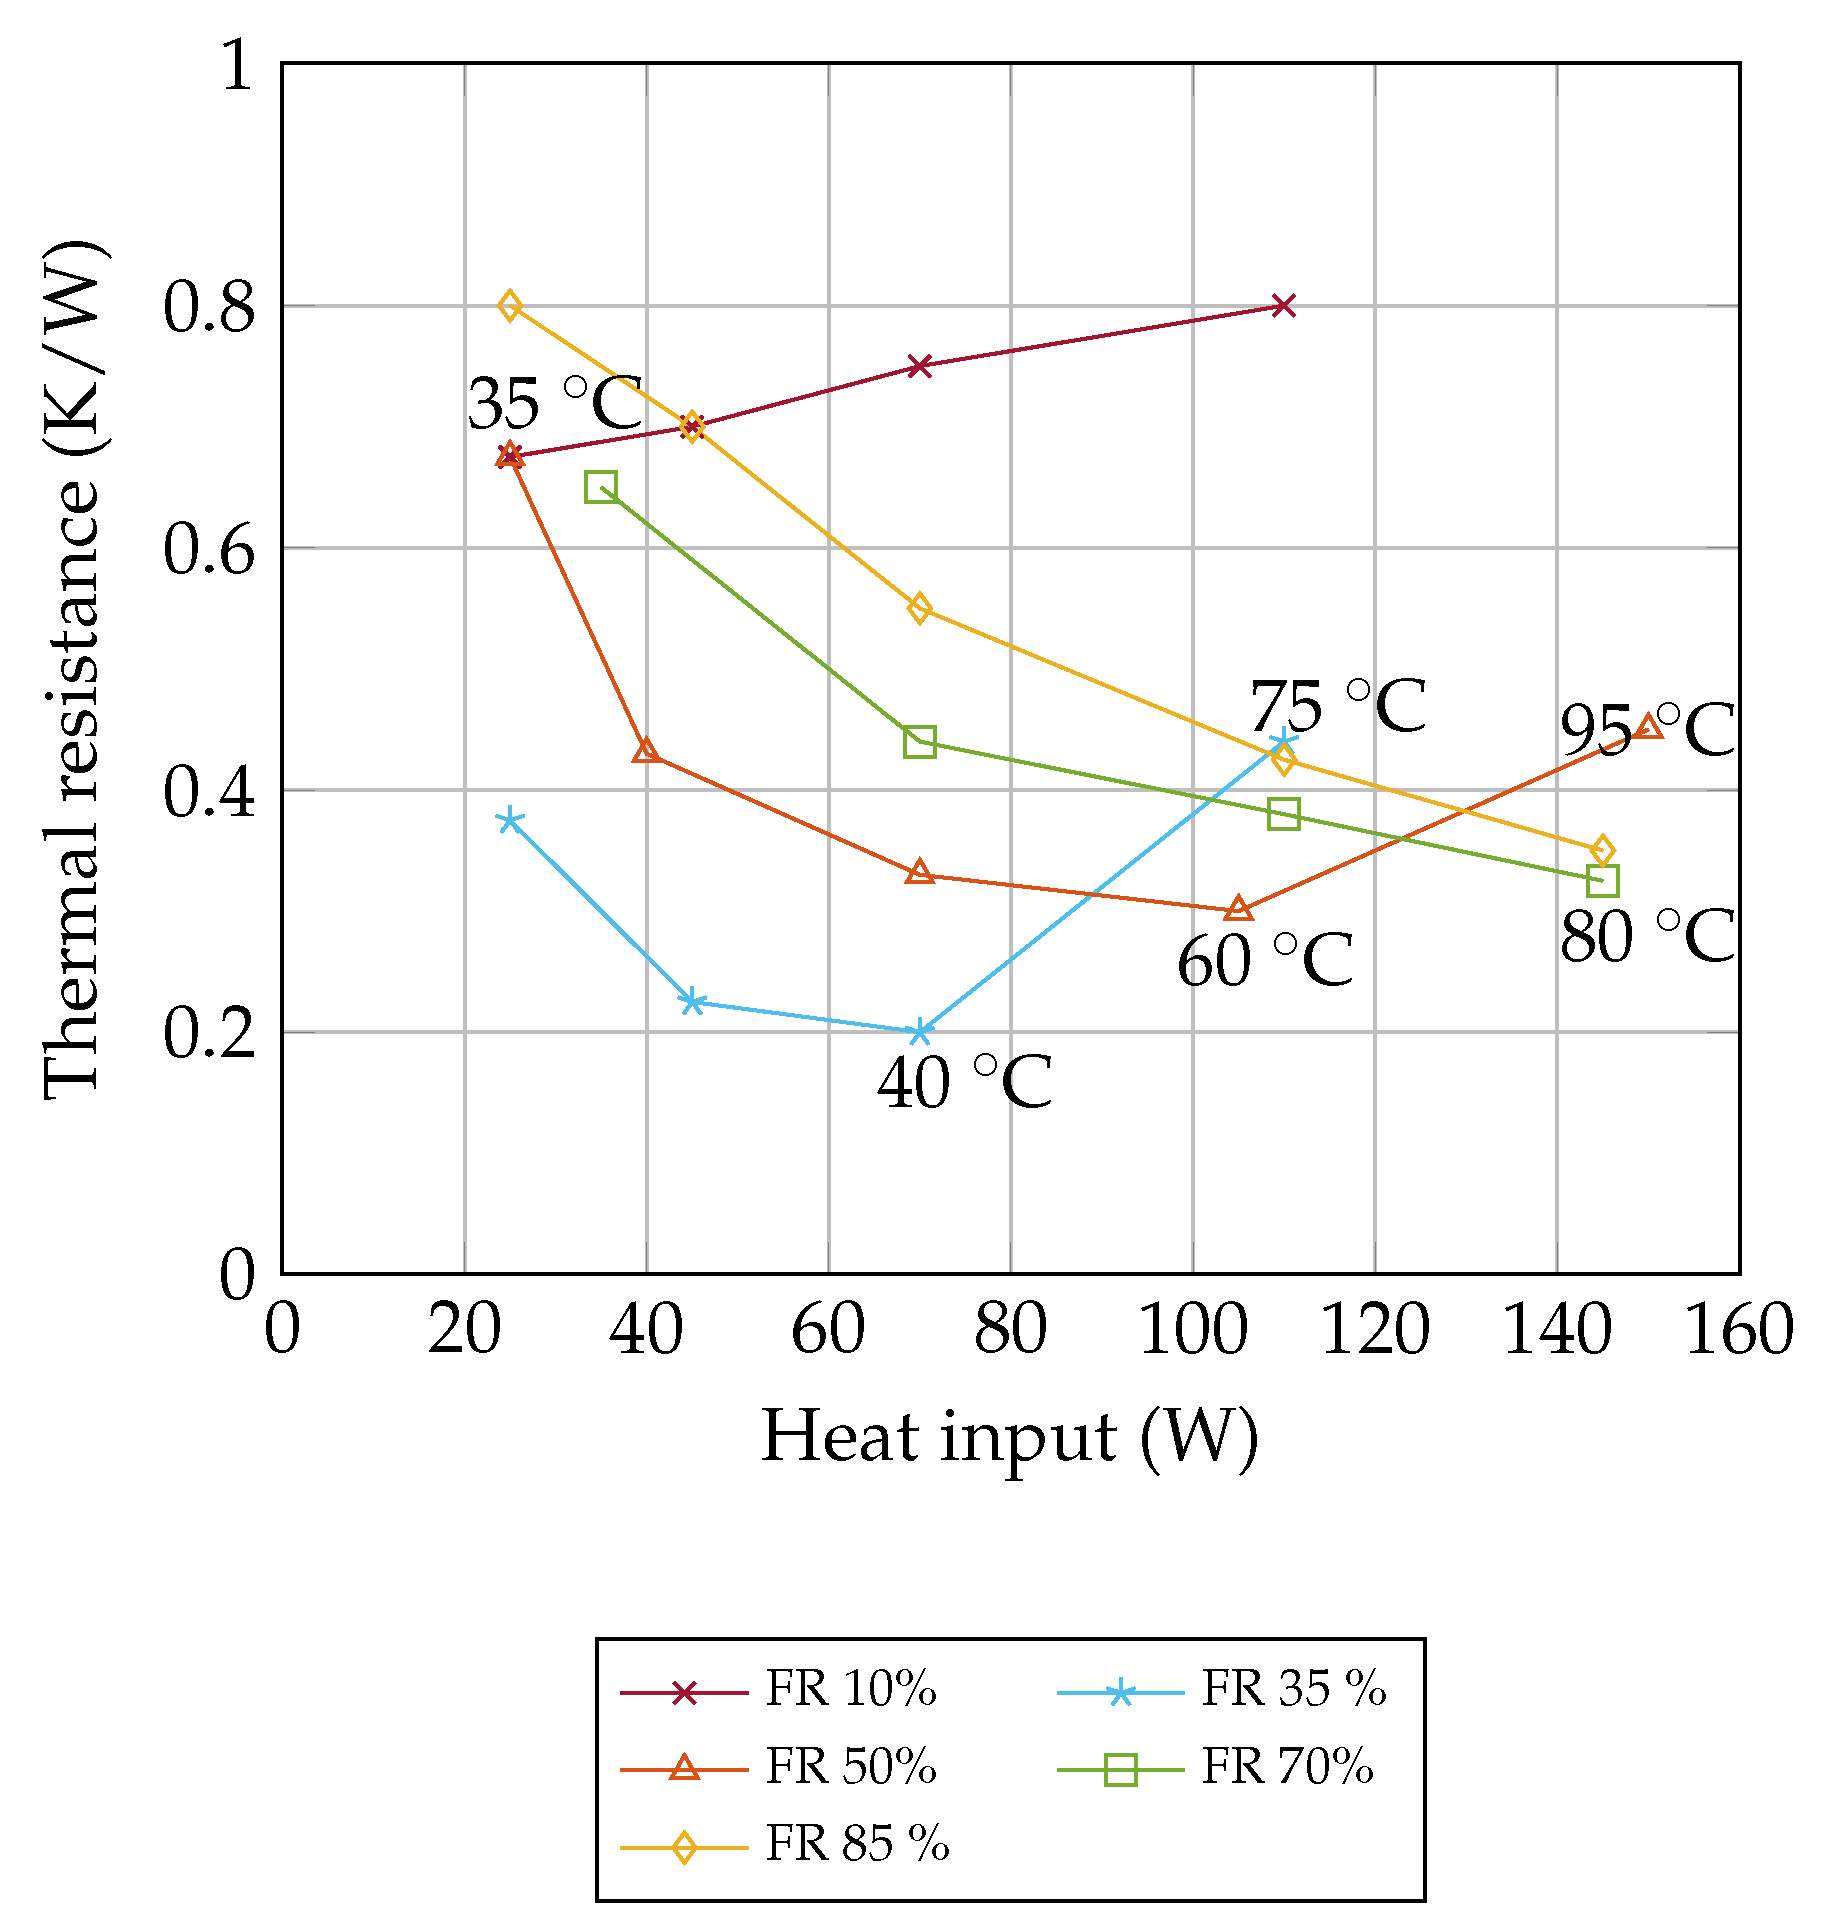
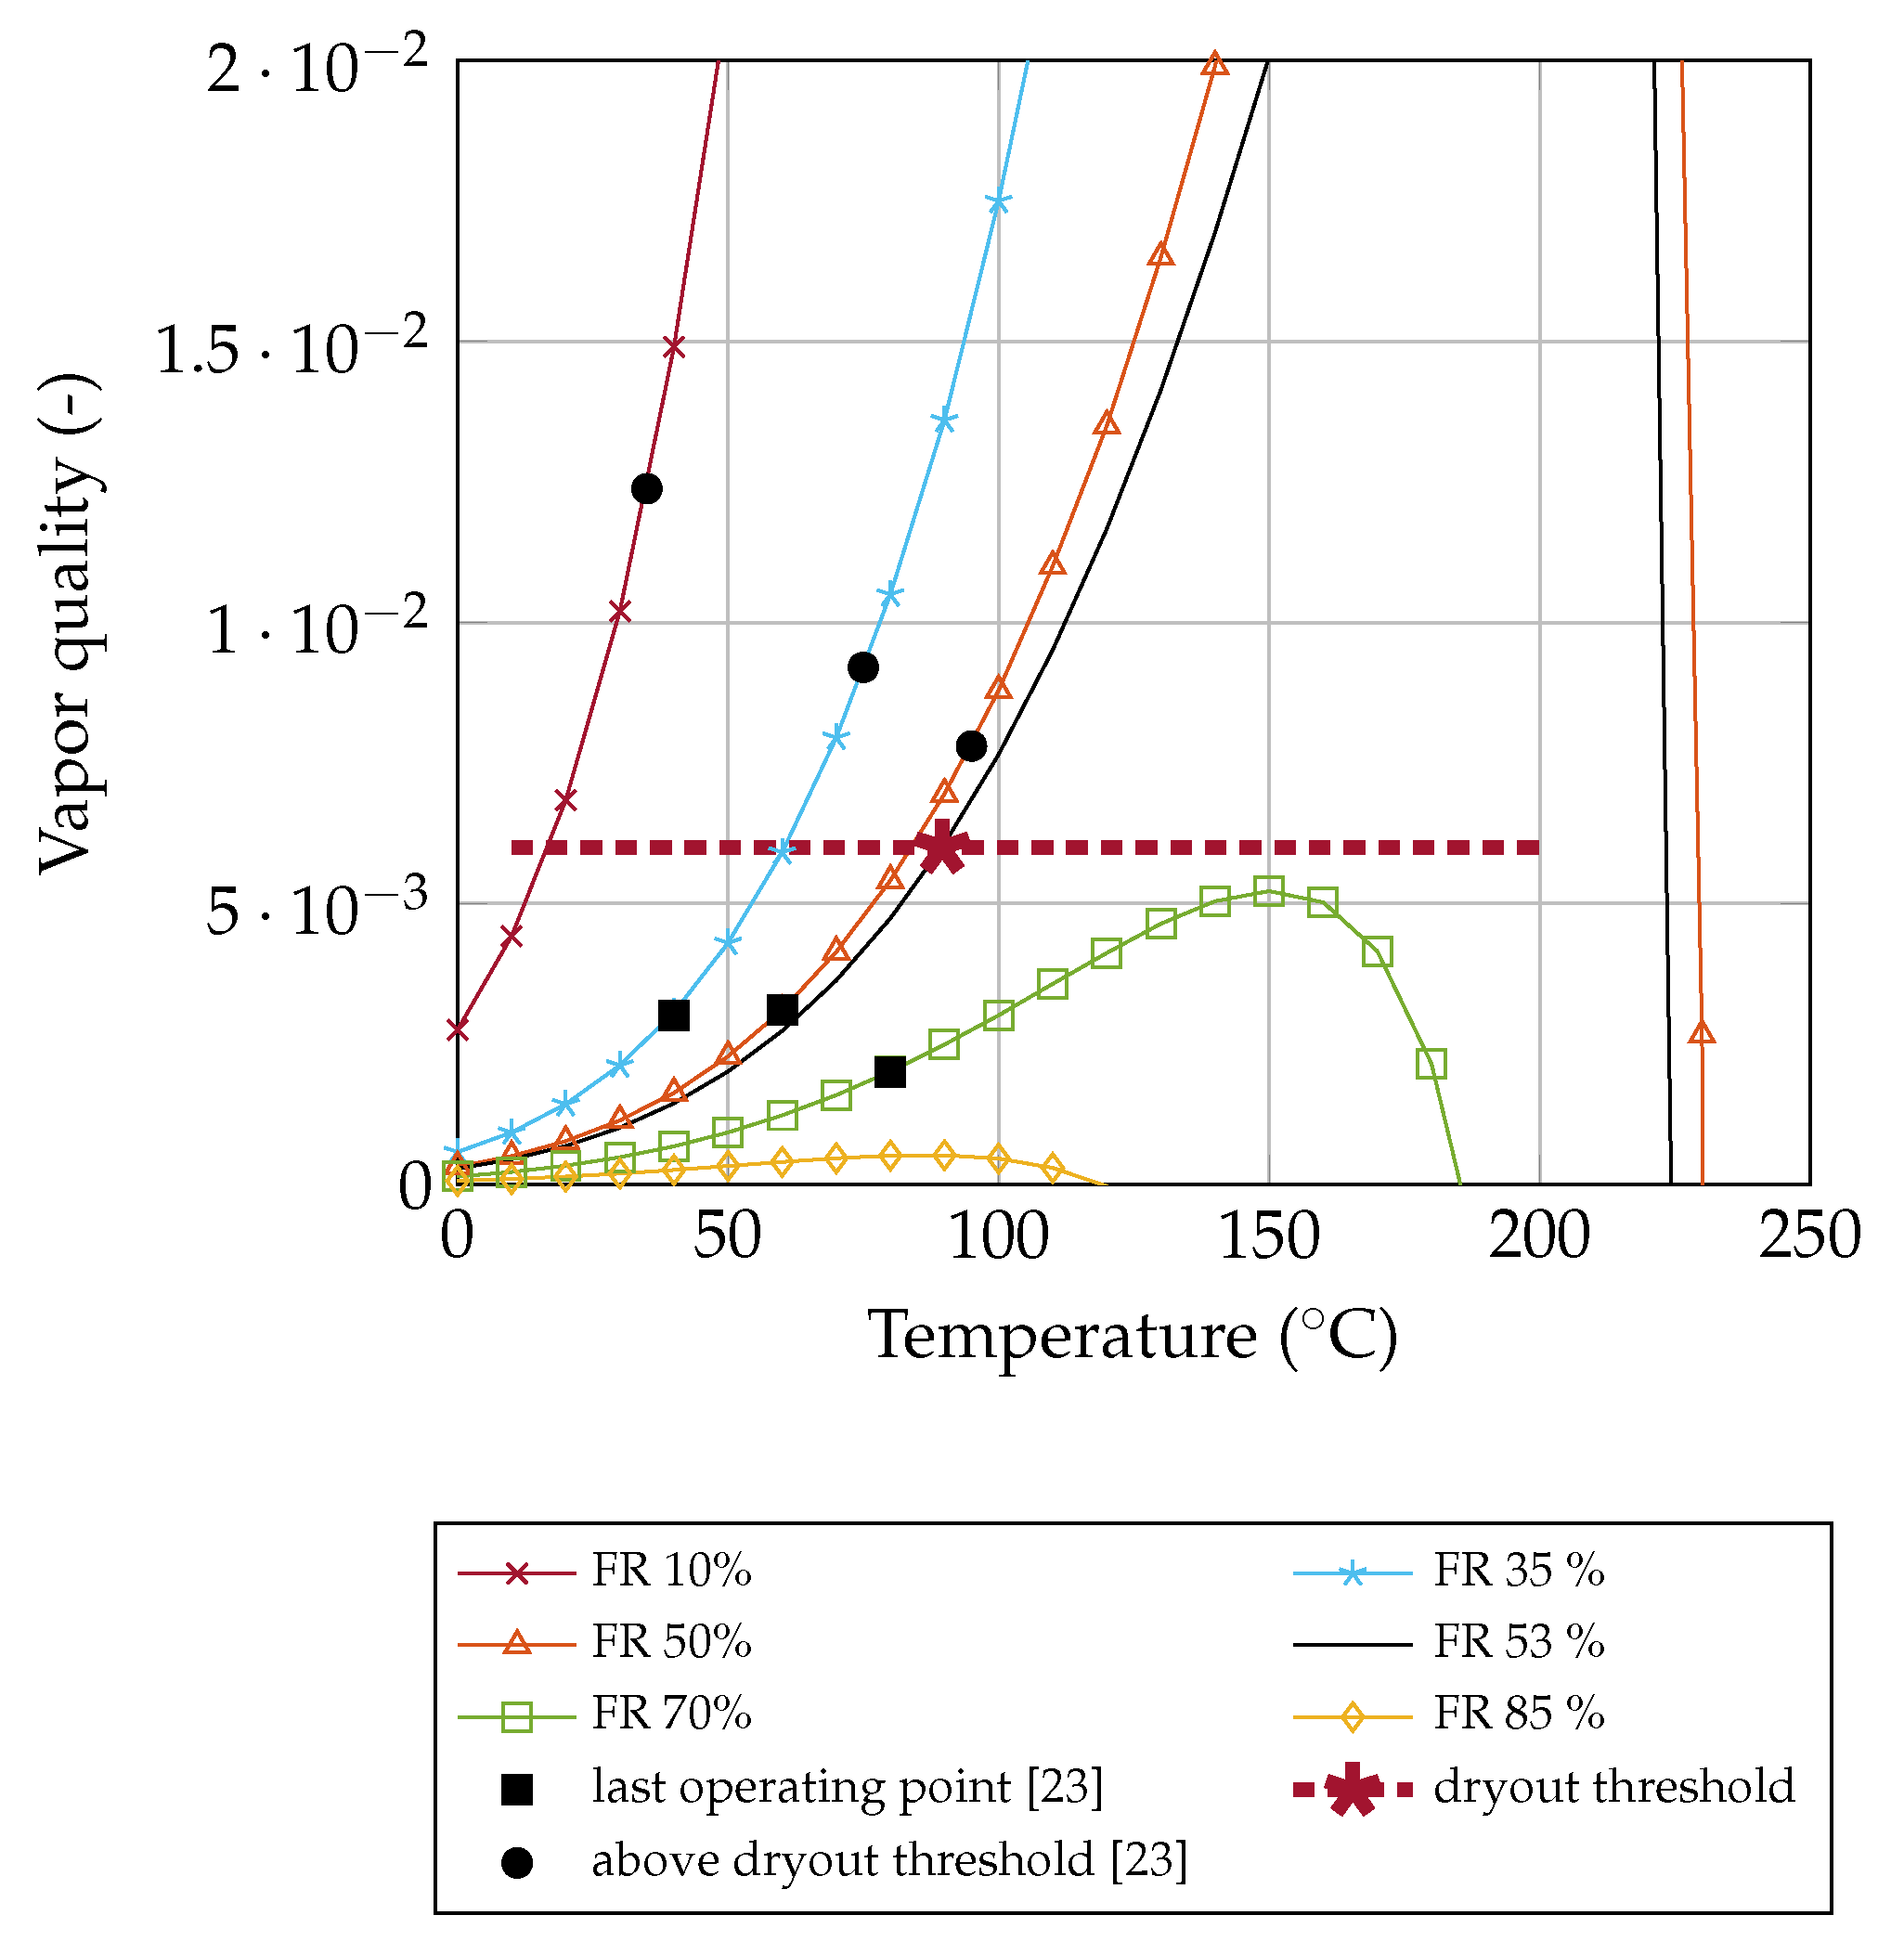
Shi and Pan [23] investigated the start up process of OHPs. Therefore, they had an experimental setup for a flat plate OHP with 40 channels. The 1 × 1 channels were charged with acetone. They measured the thermal resistance for various filling ratios and increased the heat input from 23 W to 210 W. Figure 9 shows the experimental data from Shi and Pan [23]. By applying Equation (16), the vapor quality x is calculated for the experimental data. The filling ratio of 35 % has a comparatively low thermal resistance of 0.2 K/W at a heat input of 70 W. Between 70 W and 110 W, the thermal resistance increases rapidly from 0.2 K/W to 0.42 K/W and the temperature rises from 40 to 75 . For these temperatures and a filling ratio of 35%, the vapor quality x is calculated and drawn in Figure 10. According to the same principle, the vapor quality for the filling ratio 50% at 60 and 95 as well as the filling ratio of 70% at 80 is shown in Figure 10. For all filling ratios, the performance decreases rapidly at the same vapor quality threshold x = 0.006. The filling ratio of 10% is too low for the OHP, the thermal resistance above 0.7 K/W and the vapor quality x is 0.0123 at 35 . The high vapor quality indicates that there is an annular flow and the OHP is not operating reliably.
In the following, the results of our compact analytical model are additionally validated with the data from Winkler et al. [24]. They tested an OHP made of copper with a 1.5 × 1.5 cross section. The OHP has 20 channels and is charged with 50% acetone. They increased the heat input stepwise from 0 W to 180 W and measured the temperature of the heater. The OHP dries out at a heat input of approximately 125 W and a temperature of 93 . When calculating the vapor quality according to our method for their measured data, the dryout takes place at a value of x = 0.006. This is the same value as found for the study by Shi and Pan [23] (see above) and in our measurement.
Our approach is valid for a heater that has a contact patch across the entire width of the channels. If the heater is smaller, the dryout is limited locally [21]. In this case, there would be no immediate failure of the electronic devices. The dryout limit also depends on the orientation position. Our experiments were conducted horizontally since the dryout takes places at a lower heat input compared to a vertical orientation [24]. For applied power electronics, it is important to consider the worst-case orientation to avoid a burnout of the electronics components.
5. Optimal Filling Ratio
Since the dryout threshold is known, it is possible to determine the optimal, individual filling ratio for acetone. For this purpose, the filling mass needs to be determined at the dryout. Equation (17) is derived from Equations (9) and (8).
This way, it is possible to find the optimal filling mass, where is the total volume of the OHP. The variables and represent the specific volume of the working fluid. Equation (8) can be rearranged to Equation (18).
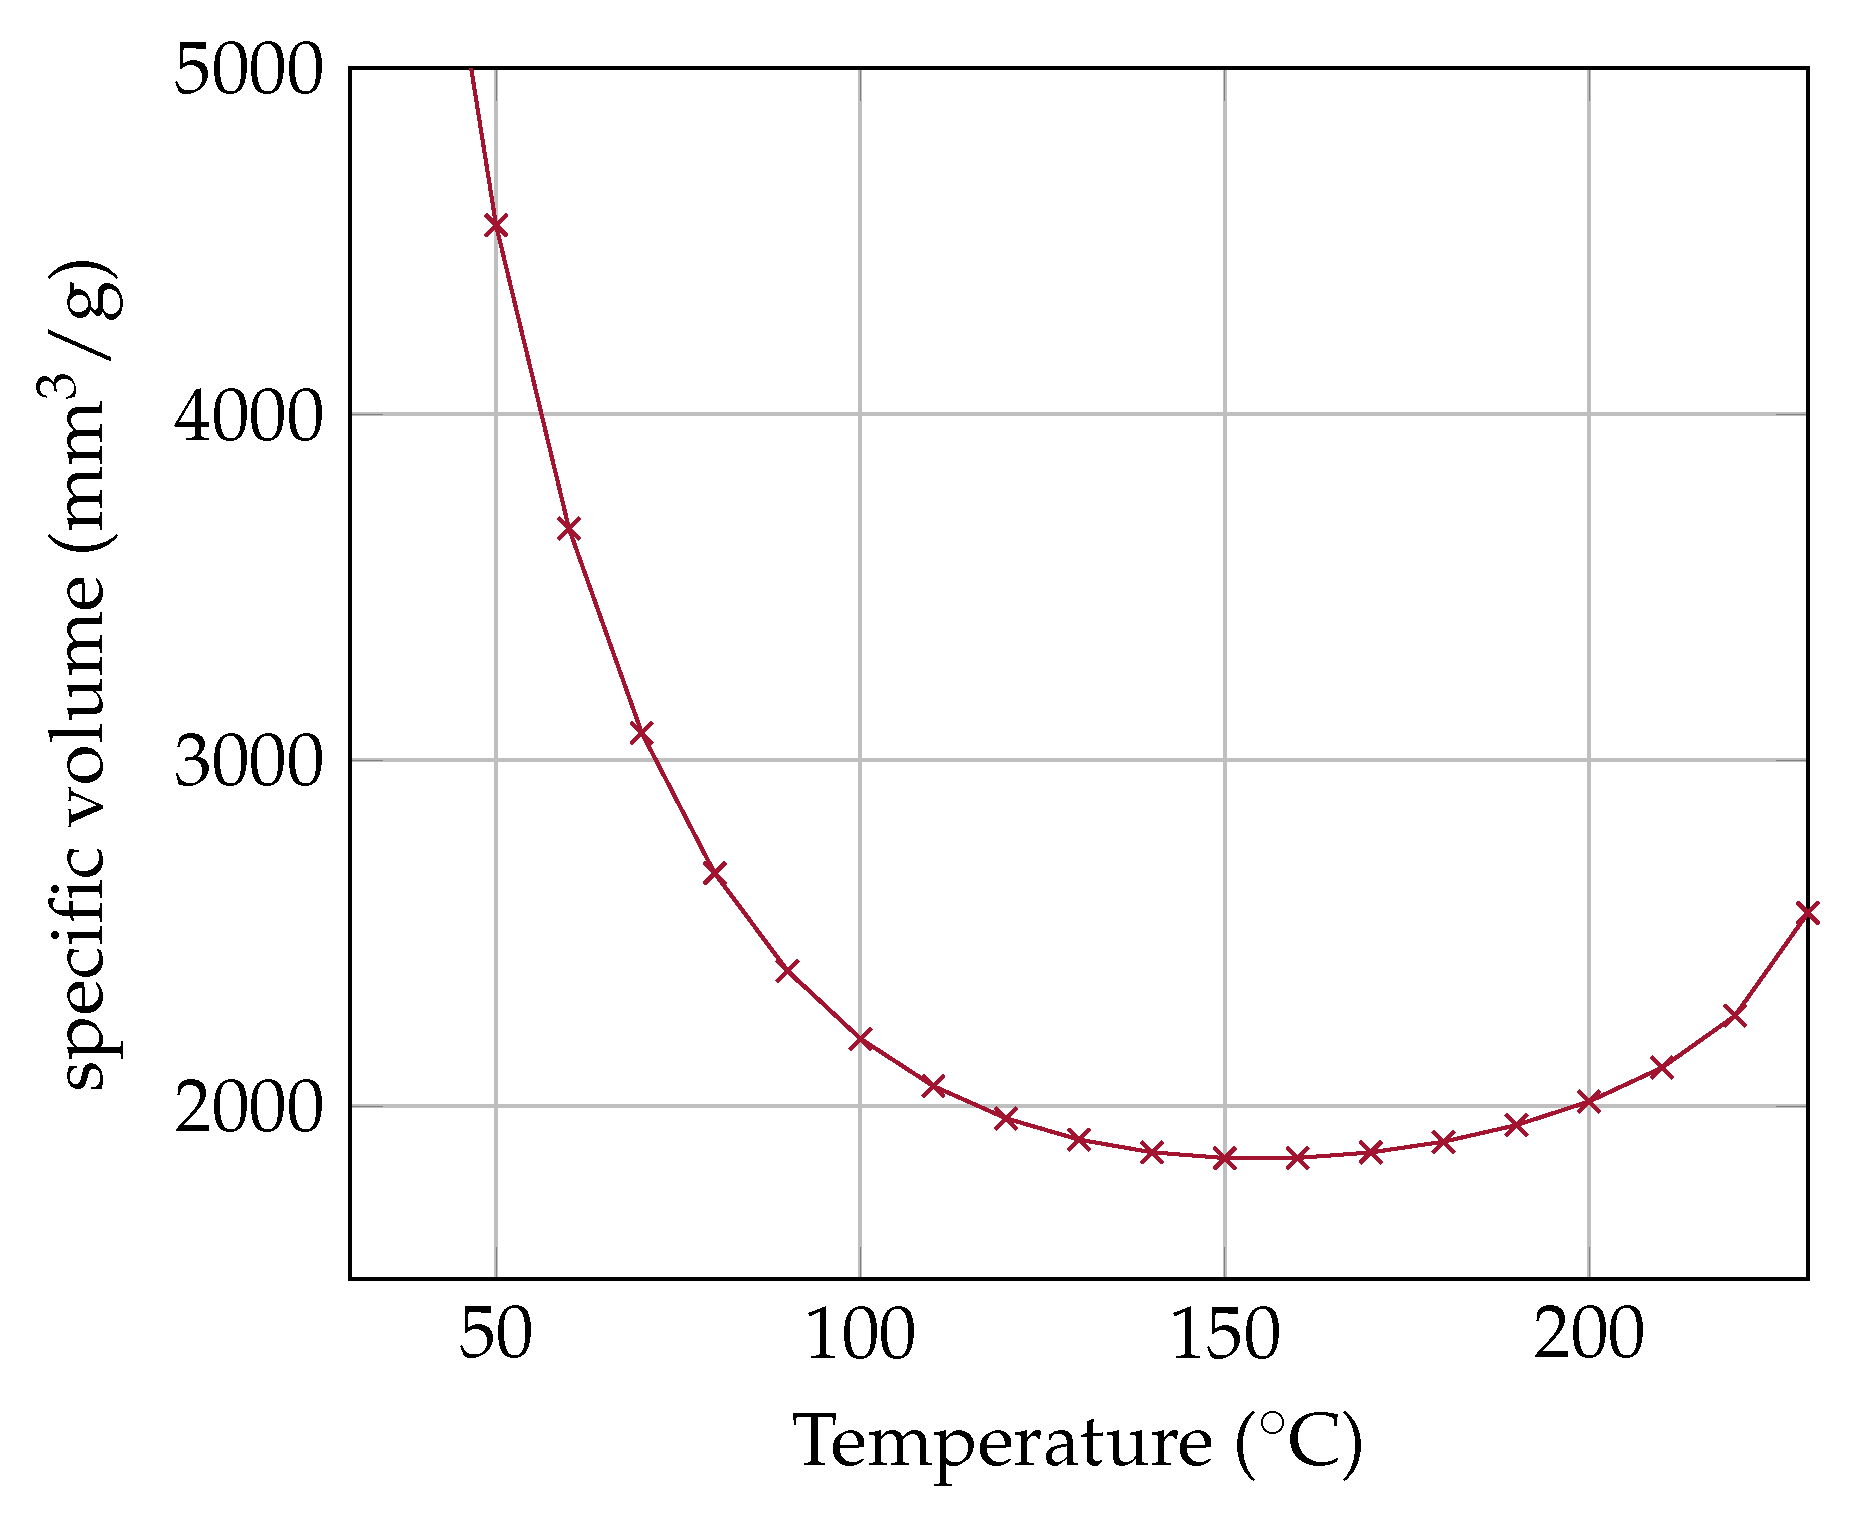
Taking our measurement and the literature data, the vapor quality threshold is set to x = 0.006. By that, the optimal filling ratio is calculated as shown in Figure 11. Due to the expected maximum temperature, it is possible to read out the optimal specific volume and thus also the optimal filling mass. Figure 11 shows the dryout temperature for each filling ratio. As long as the operation temperature is below this dryout temperature, the OHP works reliably and is close to its optimal filling ratio.
6. Conclusions and Outlook
A theory to determine the dryout threshold for OHPs was derived through a thermodynamic consideration. The vapor quality x strongly influences the flow pattern. When the vapor quality x overruns the limit of x = 0.006, the plug flow merges into an annular flow and the OHP dries out. The filling ratio at charging temperature is different from the filling ratio at operating temperature. This gap between these filling ratios can be calculated by the vapor quality x. First, it is necessary to calculate the specific volume of the OHP at filling temperature. The vapor quality x is calculated along these specific isochoric curves . This leads to Equation (16). Due to our experimental results, we set the vapor quality threshold for acetone to x = 0.006. Therefore, it is possible to determine the dryout limit for each filling ratio and to find the optimal filling ratio for each operating point. The results show that there is a uniform threshold value, which has additionally been validated by data from the literature. With that approach, it is possible to design an OHP with an optimized filling ratio and, hence, optimize its cooling abilities.
Given the fact that the filling ratio is a crucial parameter in optimizing the OHP design, the compact theory presented in this paper will contribute to a better understanding of OHPs and its design limits.
In a next step, our theory enables determining the threshold values for other fluids. We hypothesize that there is a different threshold value for each fluid. Furthermore, the vapor quality also describes the start up process. The gradient of the vapor quality curve is responsible for the start up. For higher gradients the OHP starts to operate more rapidly. Thus, the theory will be applicable both for an optimal filling ratio and for evaluating the start up process.
Author Contributions
Conceptualization, F.S., A.L. and V.D.; methodology, F.S., A.L. and S.B.; formal analysis, F.S. and A.H. ; investigation, F.S.; resources, F.S.; writing–original draft preparation, F.S.; writing–review and editing, F.S, V.D., A.L., A.H. and S.B.; visualization, F.S.; supervision, S.B.; project administration, F.S.; funding acquisition, F.S. All authors have read and agreed to the published version of the manuscript.
Funding
This research was funded by Bavarian Ministry of Economic Affairs, Regional Development and Energy and the Siemens AG.
Acknowledgments
The authors express their sincere gratitude to the Bavarian Ministry of Economic Affairs, Regional Development and Energy for partially funding this work.
Conflicts of Interest
The authors declare no conflict of interest.
Abbreviations
The following abbreviations are used in this manuscript:
| PHP | pulsating heat pipe |
| OHP | oscillating heat pipe |
| GaN | gallium nitride |
| SiC | silicon carbide |
| FR | filling ratio |
References
- Calame, J.; Myers, R.; Binari, S.; Wood, F.; Garven, M. Experimental investigation of microchannel coolers for the high heat flux thermal management of GaN-on-SiC semiconductor devices. Int. J. Heat Mass Transf. 2007, 50, 4767–4779. [Google Scholar] [CrossRef]
- Karayiannis, T.; Mahmoud, M. Flow boiling in microchannels: Fundamentals and applications. Appl. Therm. Eng. 2017, 115, 1372–1397. [Google Scholar] [CrossRef]
- Zohuri, B. Heat Pipe Design and Technology; Springer International Publishing: Berlin/Heidelberg, Germany, 2016. [Google Scholar]
- Akachi, H. Structure of a Heat Pipe. U.S. Patent 4921041, 1 May 1990. [Google Scholar]
- Ma, H. Oscillating Heat Pipes, aufl. ed.; Springer: Berlin/Heidelberg, Germany, 2015. [Google Scholar]
- Liu, X.; Chen, Y.; Shi, M. Dynamic performance analysis on start-up of closed-loop pulsating heat pipes (CLPHPs). Int. J. Therm. Sci. 2013, 65, 224–233. [Google Scholar] [CrossRef]
- Qu, W.; Ma, H. Theoretical analysis of startup of a pulsating heat pipe. Int. J. Heat Mass Transf. 2007, 50, 2309–2316. [Google Scholar] [CrossRef]
- Zhang, Y.; Faghri, A. Advances and Unsolved Issues in Pulsating Heat Pipes. Heat Transf. Eng. 2008, 29, 20–44. [Google Scholar] [CrossRef] [Green Version]
- Drolen, B.; Smoot, C. Performance Limits of Oscillating Heat Pipes: Theory and Validation. J. Thermophys. Heat Transf. 2017, 31, 1–17. [Google Scholar] [CrossRef]
- Triplett, K.; Ghiaasiaan, S.; Abdel-Khalik, S.; Sadowski, D. Gas-liquid two-phase flow in microchannels Part I: Two-phase flow patterns. Int. J. Multiph. Flow 1999, 25, 377–394. [Google Scholar] [CrossRef]
- Khandekar, S.; Groll, M. On the definition of pulsating heat pipes: An overview. In Proceedings of the 5th Minsk International Conference (Heat Pipes, and Refrigerators), Minsk, Belarus, 8–11 September 2003; pp. 116–128. [Google Scholar]
- Brauner, N.; Maron, D.M. Identification of the range of `small diameters’ conduits, regarding two-phase flow pattern transitions. Int. Commun. Heat Mass Transf. 1992, 19, 29–39. [Google Scholar] [CrossRef]
- Tibiriçá, C.B.; Ribatski, G. Flow Boiling Phenomenological Differences Between Micro- and Macroscale Channels. Heat Transf. Eng. 2015, 36, 937–942. [Google Scholar] [CrossRef]
- Ong, C.; Thome, J. Macro-to-microchannel transition in two-phase flow: Part 1 Two-phase flow patterns and film thickness measurements. Exp. Therm. Fluid Sci. 2011, 35, 37–47. [Google Scholar] [CrossRef]
- Durst, F. Fluid Mechanics–An Introduction to the Theory of Fluid Flows; Springer Science & Business Media: Berlin/Heidelberg, Germany, 2008; ISBN 978-3-540-71343-2. [Google Scholar]
- Sardeshpande, M.; Ranade, V. Two-phase flow boiling in small channels: A brief review. Sadhana 2013, 38. [Google Scholar] [CrossRef]
- Georgescu, S.; Achard, J. Comments on Eötvös Number versus Bond Number. 2004. Available online: https://www.researchgate.net/publication/240310477_Comments_on_Eotvos_Number_versus_Bond_Number (accessed on 25 April 2004).
- Lemmon, E.; Bell, I.H.; Huber, M.L.; McLinden, M.O. NIST Standard Reference Database 23: Reference Fluid Thermodynamic and Transport Properties-REFPROP; Version 10.0; National Institute of Standards and Technology: Gaithersburg, MD, USA, 2018. [Google Scholar] [CrossRef]
- Taft, B.; Williams, A. Review of Pulsating Heat Pipe Working Fluid Selection. J. Thermophys. Heat Transf. 2012, 26, 651–656. [Google Scholar] [CrossRef]
- Xu, J.L.; Zhang, X.M. Start-up and steady thermal oscillation of a pulsating heat pipe. Heat Mass Transf. 2005, 41, 685–694. [Google Scholar] [CrossRef]
- Bastakoti, D.; Zhang, H.; Li, D.; Cai, W.; Li, F. An overview on the developing trend of pulsating heat pipe and its performance. Appl. Therm. Eng. 2018, 141, 305–332. [Google Scholar] [CrossRef]
- Yin, D.; Rajab, H.; Ma, H. Theoretical analysis of maximum filling ratio in an oscillating heat pipe. Int. J. Heat Mass Transf. 2014, 74, 353–357. [Google Scholar] [CrossRef]
- Shi, W.; Pan, L. Influence of filling ratio and working fluid thermal properties on starting up and heat transferring performance of closed loop plate oscillating heat pipe with parallel channels. J. Therm. Sci. 2017, 26, 73–81. [Google Scholar] [CrossRef] [Green Version]
- Winkler, M.; Rapp, D.; Mahlke, A.; Zunftmeister, F.; Vergez, M.; Wischerhoff, E.; Clade, J.; Bartholomé, K.; Schäfer-Welsen, O. Small-Sized Pulsating Heat Pipes/Oscillating Heat Pipes with Low Thermal Resistance and High Heat Transport Capability. Energies 2020, 13, 1736. [Google Scholar] [CrossRef] [Green Version]
- Senjaya, R.; Inoue, T. Oscillating heat pipe simulation considering dryout phenomena. Heat Mass Transf. 2014, 50, 1429–1441. [Google Scholar] [CrossRef]
- Cai, S.Q. Acoustic Radiation, Cavitation Collapses, and Dryout in a Capillary Oscillating Heat Pipe. J. Heat Transf. 2020, 142. [Google Scholar] [CrossRef]
- Yang, H.; Khandekar, S.; Groll, M. Performance characteristics of pulsating heat pipes as integral thermal spreaders. Int. J. Therm. Sci. 2009, 48, 815–824. [Google Scholar] [CrossRef]
- Leipertz, A. Technische Thermodynamik; ESYTEC: Putzbrunn, Germany, 2011. [Google Scholar]
- Mahmoud, M.; Karayiannis, T. Flow pattern transition models and correlations for flow boiling in mini tubes. Exp. Therm. Fluid Sci. 2016, 70, 270–282. [Google Scholar] [CrossRef] [Green Version]
- Revellin, R. Experimental Two-Phase Fluid Flow in Microchannels. Ph.D. Thesis, École Polytechnique Fédérale de Lausanne, Lausanne, Switzerland, 2005. [Google Scholar] [CrossRef]
Figure 1.
The change of the threshold value (maximum diameter) as a function of temperature for acetone. The OHP can only operate if the fluid inside the channel consist of altering liquid and vapor parts. Therefore the diameter must be smaller than the threshold value.
Figure 1.
The change of the threshold value (maximum diameter) as a function of temperature for acetone. The OHP can only operate if the fluid inside the channel consist of altering liquid and vapor parts. Therefore the diameter must be smaller than the threshold value.

Figure 2.
Representation of the OHP with 26 meandering channels. The thermocouples for the temperature measurement are placed in the middle of the condenser and the heater. On the right side is the heater (red) with an area of 50 × 25 . The condenser (blue) is on the left side and has an area of 50 × 10 .

Figure 3.
Experimental setup to determine the dryout limit, consisting of an OHP module with evaporator, adiabatic and condenser section. The heat input is increased stepwise from 15 W to 90 W to observe the dryout threshold.
Figure 3.
Experimental setup to determine the dryout limit, consisting of an OHP module with evaporator, adiabatic and condenser section. The heat input is increased stepwise from 15 W to 90 W to observe the dryout threshold.

Figure 4.
Results for OHP filled with 53% acetone. Temperature of the heater vs. increasing heat input from 15 W to 90 W. The OHP dries out at 90 W and 89.6 .
Figure 4.
Results for OHP filled with 53% acetone. Temperature of the heater vs. increasing heat input from 15 W to 90 W. The OHP dries out at 90 W and 89.6 .

Figure 5.
Thermal resistance of the OHP vs. heating input from 15 W to 90 W, filled with 53% acetone. At the dryout limit the thermal resistance is rising from 0.41 (K/W) at 75 W to 0.9 (K/W) at 90 W.
Figure 5.
Thermal resistance of the OHP vs. heating input from 15 W to 90 W, filled with 53% acetone. At the dryout limit the thermal resistance is rising from 0.41 (K/W) at 75 W to 0.9 (K/W) at 90 W.

Figure 6.
Characteristic PVT-Diagram of a pure fluid modified from [28].
Figure 6.
Characteristic PVT-Diagram of a pure fluid modified from [28].

Figure 7.
Schematic isochoric change of state in a PV-diagram.

Figure 8.
Vapor quality vs. temperature for different filling ratios for acetone; For a Filling Ratio (FR) of 10% the whole fluid becomes vapor (x = 1) at 203 . FR 34.7% ends in the critical point and for a FR of 50% the whole fluid becomes liquid (x = 0) at 230 .
Figure 8.
Vapor quality vs. temperature for different filling ratios for acetone; For a Filling Ratio (FR) of 10% the whole fluid becomes vapor (x = 1) at 203 . FR 34.7% ends in the critical point and for a FR of 50% the whole fluid becomes liquid (x = 0) at 230 .

Figure 9.
Measurement from Shi and Pan [23]: Thermal resistance vs. heating input charged with acetone. For the FR of 35%, the OHP dries out between 40 and 75 . When the OHP is charged with 50%, the OHP dries out between 60 and 95 . For FR 70% and FR 85%, the dryout limit is not reached.
Figure 9.
Measurement from Shi and Pan [23]: Thermal resistance vs. heating input charged with acetone. For the FR of 35%, the OHP dries out between 40 and 75 . When the OHP is charged with 50%, the OHP dries out between 60 and 95 . For FR 70% and FR 85%, the dryout limit is not reached.

Figure 10.
Calculated (see Equation (16)) vapor quality threshold for different filling ratios for acetone. Our OHP measurement with a FR of 53% results in a dryout at x = 0.006, also the data from Shi and Pan [23] confirm the dryout threshold.

Figure 11.
Specific volume vs. dryout temperature for acetone as given by our proposed compact theory. Due to the expected temperature of the heater, the minimum filling mass of the OHP is given to avoid a dryout.
Figure 11.
Specific volume vs. dryout temperature for acetone as given by our proposed compact theory. Due to the expected temperature of the heater, the minimum filling mass of the OHP is given to avoid a dryout.

Publisher’s Note: MDPI stays neutral with regard to jurisdictional claims in published maps and institutional affiliations. |
© 2020 by the authors. Licensee MDPI, Basel, Switzerland. This article is an open access article distributed under the terms and conditions of the Creative Commons Attribution (CC BY) license (http://creativecommons.org/licenses/by/4.0/).
Share and Cite
MDPI and ACS Style
Schwarz, F.; Danov, V.; Lodermeyer, A.; Hensler, A.; Becker, S. Thermodynamic Analysis of the Dryout Limit of Oscillating Heat Pipes. Energies 2020, 13, 6346. https://0-doi-org.brum.beds.ac.uk/10.3390/en13236346
AMA Style
Schwarz F, Danov V, Lodermeyer A, Hensler A, Becker S. Thermodynamic Analysis of the Dryout Limit of Oscillating Heat Pipes. Energies. 2020; 13(23):6346. https://0-doi-org.brum.beds.ac.uk/10.3390/en13236346
Chicago/Turabian StyleSchwarz, Florian, Vladimir Danov, Alexander Lodermeyer, Alexander Hensler, and Stefan Becker. 2020. "Thermodynamic Analysis of the Dryout Limit of Oscillating Heat Pipes" Energies 13, no. 23: 6346. https://0-doi-org.brum.beds.ac.uk/10.3390/en13236346
Note that from the first issue of 2016, this journal uses article numbers instead of page numbers. See further details here.