Triclosan Removal in Microbial Fuel Cell: The Contribution of Adsorption and Bioelectricity Generation


1
State Key Laboratory of Organic Geochemistry, Guangzhou Institute of Geochemistry, Chinese Academy of Sciences, Guangzhou 510640, China
2
College of Earth and Planetary Sciences, University of Chinese Academy of Sciences, Beijing 10069, China
3
Guangdong Key Laboratory of Environmental Protection and Resources Utilization, Guangzhou 510650, China
4
School of Environmental Science and Engineering, Institute of Environmental Health and Pollution Control, Guangdong University of Technology, Guangzhou 510006, China
5
Carlsberg Research Laboratory, Bjerregaardsvej 5, 2500 Valby, Denmark
6
DTU Environment, Department of Environmental Engineering, Technical University of Denmark, 2800 Kgs. Lyngby, Denmark
*
Authors to whom correspondence should be addressed.
Energies 2020, 13(3), 761; https://0-doi-org.brum.beds.ac.uk/10.3390/en13030761
Submission received: 15 November 2019
/
Revised: 28 January 2020
/
Accepted: 5 February 2020
/
Published: 9 February 2020
(This article belongs to the Special Issue BioEnergy and BioChemicals Production from Biomass and Residual Resources II: Focus on Unconventional Feedstocks)
Abstract
:The occurrence of Triclosan (TCS) in natural aquatic systems has been drawing increasing attention due to its endocrine-disruption effects as well as for the development of antibiotic resistances. Wastewater discharge is the main source of water contamination by TCS. In this study, the removal of TCS in microbial fuel cells (MFCs) was carefully investigated. A 94% removal of TCS was observed with 60 mV electricity generation as well as a slight drop in pH. In addition, we found that adsorption also contributed to the removal of TCS in aqueous solution and 21.73% and 19.92% of the total mass was adsorbed to the inner wall of the reactor and to the electrode, respectively. The results revealed that the attenuation of TCS depends on both biodegradation and physical adsorption in the anode chamber. Thus, the outcomes of our study provide a better understanding of the TCS removal mechanism in MFCs.
1. Introduction
Triclosan [5-chloro-2-(2,4-dichlorophenoxy) phenol, TCS] is a common antibacterial agent used in various personal care products. Due to their high assumption volume, TCS ubiquitously occurs as a water pollutant in domestic wastewaters as well as natural aquatic environments [1]. The occurrences of TCS in the environment have raised great concern due to its endocrine disrupting effects [2,3]. Moreover, numerous studies also revealed that dioxin-like compounds were formed during aquatic photodegradation of TCS [4,5,6,7]. Thus, an efficient water treatment technique for removal of TCS in aqueous phases is of primary importance to control and reduce environmental release of TCS via wastewater discharges.
Microbial fuel cells (MFCs), a novel (bio)electrochemical technique, combine biologically catalysed reactions with electrochemical processes, and are able to transform the energy stored in the chemical bonds of organic matter into electricity [8,9]. Specifically, the substrate is oxidized in the anode chamber under anaerobic conditions, releasing electrons, protons and CO2. Electrons are transferred via the external circuit to the cathode [10]. This mechanism is beneficial for the degradation of complex organic pollutants. It has been reported that pharmaceutics, including antibiotics, can be degraded in MFCs [11]. Therefore, TCS can be used as the substrate (electron donor) of microbial fuel cells. MFC systems contain both oxidation and reduction reactions in one system [12]. In addition to their function as renewable energy sources, MFCs have been increasingly applied to remove organic pollutants in wastewater due to their cost effective feature as well as high efficiency in the degradation of organic contaminants [13]. MFCs have been successfully applied for the environmental remediation of a wide spectrum of organic pollutants, including chlorinated solvents [14], BTEX compounds [15,16], phenol [10,17] and pharmaceuticals [18,19,20,21]. In most of the previous experimental studies, the reduction in target pollutants from an aqueous solution was often associated only with (bio)electrochemical degradation. However, organic compounds, in particular the ones with higher sorption, might also adsorb onto materials in the anode such as electrodes and the inner wall of reactors, escaping from aqueous phases. In MFC systems, adsorption and bioelectrical degradation might both contribute to the removal of TCS in water. However, the individual contributions of adsorption and biodegradation still remain unclear and require further characterization in order to understand attenuation of TCS in MFC.
The main goal of this study is to assess the removal efficiency of TCS using an MFC technique. TCS was introduced as a feeding substrate in the anode chamber of an MFC system. The specific tasks are to (1) evaluate TCS attenuation as well as power generation in MFC; (2) to characterize TCS adsorption onto different compartments of the anode chamber; (3) and to investigate the influence of pH on the adsorption behaviors of TCS. The outcomes of this study will provide a mechanistic understanding of TCS attenuation processes in MFC systems.
2. Materials and Methods
2.1. Chemicals and Reagents
TCS (99% purity) was purchased from Yuan Ye (Shanghai, China) and used for the preparation of a 10 g/L TCS stock solution in methanol. Chromatographic Methanol (HPLC grade) was purchased from Merck (Darmstadt, Germany) and Ethylacetate was obtained from Macklin (Shanghai, China). All other chemicals used for the synthetic medium and buffer solution were purchased from Macklin (Shanghai, China).
2.2. MFC Configuration and Operation
A two-chambered MFC was made of polycarbonate materials, consisting of an anode chamber and a cathode chamber. There was a cation exchange membrane (Zhejiang Lv He Group Co., Ltd., Hangzhou, China) between the two chambers. A graphite fiber brush (Mill-Rose with a diameter of 5.9 cm and a length of 6.9 cm; the geometric surface area of anode was 36 cm2) was used as the anode and graphite plate was used as the cathode. Prior to use, they were soaked in 30 mol/L sulfuric acid at 80 °C for a period of 2 h to remove organic matter on the surface and then were soaked in 30% hydrogen peroxide for 2 h to wipe out impurities. Titanium wires (Gui Tai Titanium Group Co., Ltd., Shenzhen, China) were used to connect the circuit with an external resistance of 1000 ohms. A total of 50 mmol/L K3 [Fe(CN)6] was used as the electron acceptor in the cathode chamber. The output voltages of the reactors were recorded with a digital multimeter (Keithley Co., Beaverton, OR, USA). The anode chamber of the MFCs was inoculated with 20 mL of activated sludge collected from Lijiao municipal sewage treatment plant (Guangzhou, China). It is fed with artificial wastewater (1 g/L sodium acetate, 20 mM phosphate buffered solution (pH 7.0), 1.7 mM potassium chloride, 5.8 mM ammonium chloride, 2 mL vitamin solution and 2 mL mineral solution) [22]. All the MFCs were operated in a temperature-controlled lab at 26 °C and sheltered from light. Two identical reactors were operated in batch mode, and both the anolyte and catholyte were changed regularly (when the voltage was below 100 mV). About one month later (after the reactors were started up), TCS was added to replace acetate in the anode chamber at each experimental cycle. Another MFC with abiotic anode was set as an abiotic control to characterize the roles of physical sorption. The operation of the abiotic control reactor was the same as the working MFCs, but the abiotic control electrode was pre-treated at 450 °C in a muffle furnace for 30 min before the experiments for the control of microbes.
2.3. Attenuation Tests: Feeding and Sampling Procedures
TCS removal experiments were conducted under inoculated and uninoculated conditions using the same methodology. After a reproducible performance of the MFCs was achieved, similar voltage profiles were observed over at least three cycles. A feed solution containing TCS was added into the medium used in the first batch cycle, and aqueous samples (3 mL) were taken at the beginning of the cycle, and then were collected every six hours for concentration analysis. This procedure was repeated for the remaining four cycles of the attenuation test. As for the abiotic experiment, we set different experimental parameter (pH = 7 and 8, with anode and without anode) in abiotic reactors, which were sterilized before adding artificial wastewater. A desorption test was conducted in the MFC under inoculated and uninoculated conditions using the same methodology. The water samples were extracted with ethyl acetate (liquid/liquid extraction). The supernatant was dried under a gentle nitrogen stream and dissolved in 1 mL isooctane. Before the chemical analysis, 2.5 μL of the 200 mg/L internal standard solution containing hexamethylbenzene was added to each sample.
2.4. Analytical Methods
The concentration of TCS was determined using gas chromatography coupled with mass spectrometry (GC-MS) (GCMS-QP2010, SHIMAZU, Kyoto, Japan). The chromatography separation used a DB-5MS GC column (30 m × 250 μm, 0.25 μm film thickness, Agilent, Santa Clara, CA, USA). Voltages across the resistance were measured using a digital multimeter and data were automatically recorded by a data acquisition system (Keithley 2700, Tektronix Technology Co., Ltd., Beaverton, OR, USA). The current was calculated according to Ohm’s law (I = V/R). The current density was obtained by dividing the current by the total surface area of the anode [23,24]. Polarization and power density curves were obtained by varying the resistance in a range from 10 to 10,000 Ω by using the data acquisition system. The pH of the samples was determined using the FE28-standard pH meter (Mettler Toledo, Zurich, Switzerland).
3. Results and Discussion
3.1. The Removal of TCS in Aqueous Phase
Figure 1 shows the aqueous concentration profile of TCS in the MFC reactor. A significant reduction in TCS in the aqueous phase was observed, where most TCS (94%) was removed within 48 h. The results also indicate possible TCS degradation in the MFC environment. In this experiment TCS was introduced when the constructed system reached a stable condition after inoculating for approximately 24 d, which was indicated by a similar level of current generation observed under each batch cycle (see Figure 2A the region with NaAc feeding).
The output current density of the MFC correlated with the metabolism activity of microbes in the system (Figure 2A). After sludge was inoculated into anode chambers, the current density first reached 160 mA/m2 within 7 days, further increasing to 170 mA/m2, and the signals dropped and recovered in the several following cycles (every cycle is about 100 h). The steady current density output reflects that the MFC was successfully initiated. However, right after adding 1 mg/L TCS to replace sodium acetate, the highest output current density of the MFC first went up to 160 mA/m2. This might be partly due to the consumption of the remaining NaAc in the system. In the following five cycles, the output current density dropped significantly, which could be due to limited substrate availability at low TCS concentrations.
The electrochemical activity of the MFC was calculated by a polarization curve and a power density curve (see Figure 2B), which was obtained in the steady state when feeding with TCS. Figure 2B showed the maximal power densities of 120 mW/m2 at a current density of 260 mA/m2. The open circuit voltage (OCV) was 0.35V (when the current density was 0). The voltage showed a decreasing trend with the increase in current density. These results revealed that the MFC was in an active state.
3.2. Adsorption of TCS in MFC
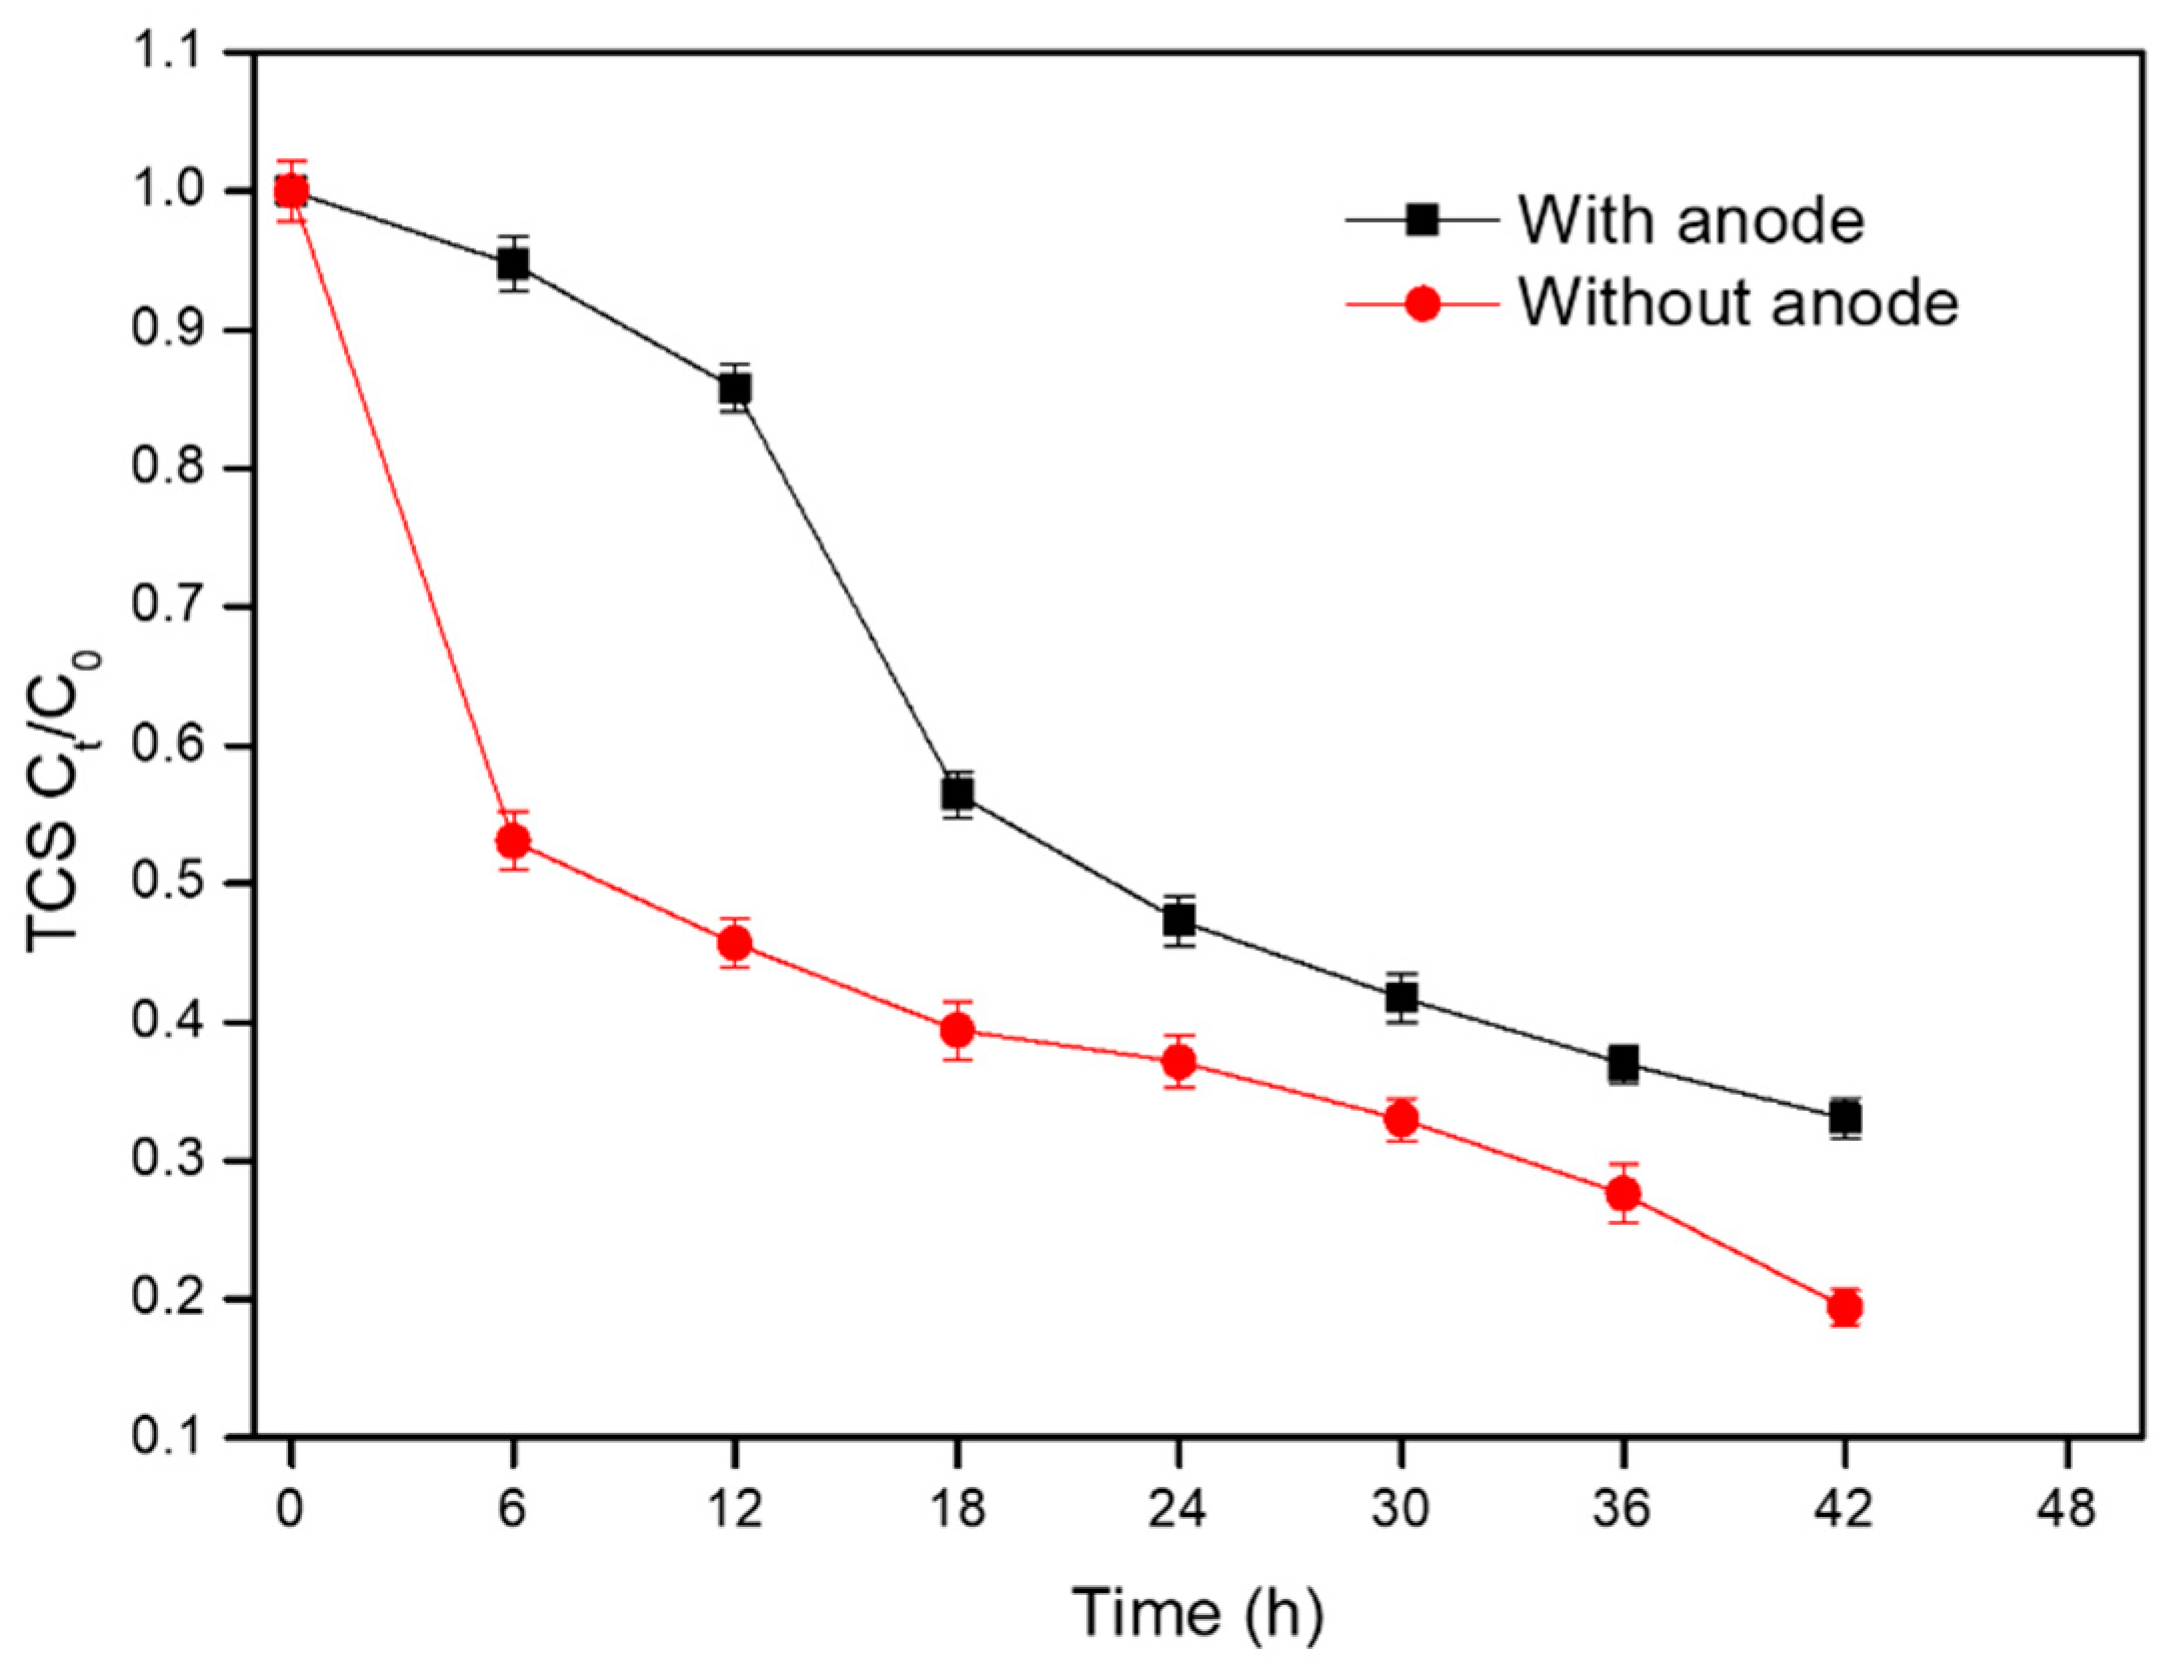
According to the results above, TCS was efficiently removed in the MFC system. However, both adsorption and electrochemical degradation may contribute to the reduction in TCS in the aqueous phase. Specifically, adsorption of TCS might occur on the inner wall, on the biofilm and on the anode electrode materials. In order to further characterize the removal of TCS by adsorption in the anode chamber, abiotic control experiments were conducted by introducing TCS into the sterilized MFC systems. Figure 3 demonstrated that the TCS aqueous concentration under both conditions decreased gradually with time. Moreover, TCS in the aqueous solution reduced faster with the presence of an anode, indicating that a substantial amount of TCS was adsorbed to the reactor as well as the anode. Moreover, the graphite fiber brush anodes with a high surface area could function as a sorbent [25]. The surface of the graphite fiber brush was porous, which could significantly enhance adsorption capacity.
3.3. Influence of pH on TCS Adsorption
The adsorption of TCS in the MFC was further studied at a higher pH. The obtained TCS concentration in Figure 4 demonstrates that TCS adsorption occur at both pH levels. Ionic TCS is more abundant at pH 8 compared to those at pH 7. However, a similar TCS removal efficiency of 80% was obtained after 42 h for both scenarios. This might indicate that pH did not influence the adsorption behavior of TCS in the MFC. Therefore, adsorption of TCS in the anode chamber is not selective between neutral and ionic TCS molecules.
In order to quantify the distribution of TCS in different compartments of the MFC, a desorption test was conducted in the MFC with an abiotic anode. Specifically, at the end of one cycle, the abiotic anode electrode was taken out and soaked in ethyl acetate for the extraction of TCS. Table 1 presents the mass fraction of TCS in different components of the anode chamber. The results indicate that the inner wall of the reactor and the anode electrode absorbed approximately 21.73% and 19.92% of TCS, respectively. An incomplete mass balance was obtained with a mass loss of about 30%. This might result from sample pretreatment (recovery: 85%–97%) as well as the analytical uncertainties (relative standard deviation: 5%–15%) of the samples.
3.4. Adsorption of TCS during Electricity Generation in MFC
Figure 5 shows a decreasing aqueous concentration of TCS during electricity generation at pH 8. About 70% of TCS was removed within 48 h, simultaneously leading to electricity production, as shown in Figure 6. At the end of the reaction, the carbon brush was taken out and immersed in the ethyl acetate solvent for desorption. The same desorption treatment was done for the anode chamber to extract TCS attached to the inner wall. The mass of TCS in the different compartments is determined and summarized in Table 2. About 79% of initial TCS was removed from the aqueous solution, which is much higher than the one (i.e., 27%) obtained for the abiotic system. This difference was about 52%, and it might indicate the contribution of biodegradation for TCS removal during the electricity production. The detailed metabolic pathway of TCS in the anode should be explored in future studies.
Concerning electricity generation using TCS as the only fuel, the maximum output voltage was in the range of 70 C80 mV (19.4~26.7 mA/m2) for 40 h, with an initial TCS concentration of 10 mg/L and an external resistance of 1000 Ω. The obtained maximum voltage was substantially lower than when using NaAc as feeding substrate (see Figure 2A). This might be due to the limited availability of the substrate at such a low TCS concentration. It should be noted that the data shown in Figure 6 were obtained several batch runs after (approx. 400 h) the batches shown in Figure 2A. Thus, it proves that the bacteria in the anode can still remove TCS and produce electricity after several batches. A long tailing was observed in the voltage profile in Figure 6, indicating a slow digestion of TCS as well as a low electricity output. Moreover, a slight decrease in pH (see Figure 7) was observed during TCS oxidation in the anode chamber due to the metabolic activities of microbial communities. The metabolic activity and the concentration limits of triclosan causing cytotoxic should be further explored in future works [26].
4. Conclusions
In this study, TCS was successfully removed as the fuel in the MFC. The results showed that the TCS was almost completely removed in the MFC reactor after 48 h. Moreover, it was found that both physical adsorption and biodegradation were involved in the removal of TCS. The results further indicated that adsorption of TCS occurred on the inner wall of the reactor as well as on the anode electrode with corresponding contributions of 21.73% and 19.92%, respectively. In addition to the TCS adsorption, electrochemical biodegradation also efficiently removed TCS in the aqueous solution, which was accompanied by electricity production at 70 C80 mV. Therefore, MFC is an efficient approach for TCS removal by integrating microbial activities and electrochemical transformation. However, physical processes, such as adsorption, are also of primary importance for TCS removal, and therefore also requires careful characterizations. In order to accurately evaluate the bioelectrical remediation efficiencies of MFC techniques for different organic pollutants, particularly for compounds with relatively higher absorbability, the contribution of both biotransformation and adsorption have to be assessed.
Author Contributions
Conceptualization, Y.Z. and B.J.; methodology, S.Z.; software, S.Z. and W.X.; validation, Y.Z.; formal analysis, W.X.; investigation, W.X.; data curation, W.X.; writing—original draft preparation, W.X.; writing—review and editing, B.J. and Y.S.; visualization, Y.S.; supervision, Y.Z. and B.J. All authors have read and agreed to the published version of the manuscript.
Funding
This research was funded by Guangdong Foundation for Program of Science and by Technology Research (grant number 2017B030314057) and Natural Science Foundation of Guangdong Province (grant number 2019A1515011035). Y.Z. acknowledges the open fund for international collaborations from SKLOG GIG-CAS (grant number SKLOG-201930).
Conflicts of Interest
The authors declare no conflict of interest.
References
- Schweizer, H.P. Triclosan: A widely used biocide and its link to antibiotics. FEMS Microbiol. Lett. 2001, 202, 1–7. [Google Scholar] [CrossRef] [PubMed]
- Gee, R.H.; Charles, A.; Taylor, N.; Darbre, P.D. Oestrogenic and androgenic activity of triclosan in breast cancer cells. J. Appl. Toxicol. 2008, 28, 78–91. [Google Scholar] [CrossRef] [PubMed]
- Yueh, M.F.; Tukey, R.H. Triclosan: A Widespread Environmental Toxicant with Many Biological Effects. Annu. Rev. Pharmacol. Toxicol. 2016, 56, 251. [Google Scholar] [CrossRef] [PubMed] [Green Version]
- Ding, J.; Su, M.; Wu, C.; Lin, K. Transformation of triclosan to 2,8-dichlorodibenzo-p-dioxin by iron and manganese oxides under near dry conditions. Chemosphere 2015, 133, 41–46. [Google Scholar] [CrossRef]
- Latch, D.E.; Packer, J.L.; Arnold, W.A.; Mcneill, K. Photochemical conversion of triclosan to 2,8-dichlorodibenzo- p -dioxin in aqueous solution. J. Photochem. Photobiol. A Chem. 2003, 158, 63–66. [Google Scholar] [CrossRef]
- Niu, J.; Dai, Y.; Yin, L.; Shang, J.; Crittenden, J.C. Photocatalytic reduction of triclosan on Au-Cu2O nanowire arrays as plasmonic photocatalysts under visible light irradiation. Phys. Chem. Chem. Phys. 2015, 17, 17421–17428. [Google Scholar] [CrossRef]
- Wu, J.-L.; Ji, F.; Zhang, H.; Hu, C.; Wong, M.H.; Hu, D.; Cai, Z. Formation of dioxins from triclosan with active chlorine: A potential risk assessment. J. Hazard. Mater. 2019, 367, 128–136. [Google Scholar] [CrossRef]
- Rabaey, K.; Lissens, G.; Siciliano, S.D.; Verstraete, W. A microbial fuel cell capable of converting glucose to electricity at high rate and efficiency. Biotechnol. Lett. 2003, 25, 1531–1535. [Google Scholar] [CrossRef]
- Hubenova, Y.; Georgiev, D.; Mitov, M. Stable current outputs and phytate degradation by yeast-based biofuel cell. Yeast 2014, 31, 343–348. [Google Scholar] [CrossRef]
- Luo, H.; Liu, G.; Zhang, R.; Song, J. Phenol degradation in microbial fuel cells. Chem. Eng. J. 2009, 147, 259–264. [Google Scholar] [CrossRef]
- Pant, D.; Van Bogaert, G.; Diels, L.; Vanbroekhoven, K. A review of the substrates used in microbial fuel cells (MFCs) for sustainable energy production. Bioresour. Technol. 2010, 101, 1533–1543. [Google Scholar] [CrossRef] [PubMed]
- Logan, B.E.; Regan, J.M. Microbial Fuel Cells—Challenges and Applications. Environ. Sci. Technol. 2006, 40, 5172–5180. [Google Scholar] [CrossRef] [PubMed] [Green Version]
- Zhang, Q.; Hu, J.; Lee, D.J. Microbial fuel cells as pollutant treatment units: Research updates. Bioresour. Technol. 2016, 217, 121–128. [Google Scholar] [CrossRef] [PubMed]
- Huang, L.; Gan, L.; Zhao, Q.; Logan, B.E.; Lu, H.; Chen, G. Degradation of pentachlorophenol with the presence of fermentable and non-fermentable co-substrates in a microbial fuel cell. Bioresour. Technol. 2011, 102, 8762–8768. [Google Scholar] [CrossRef] [PubMed]
- Morris, J.M.; Jin, S. Feasibility of using microbial fuel cell technology for bioremediation of hydrocarbons in groundwater. J. Environ. Sci. Health A Toxic Hazard. Subst Environ. Eng. 2008, 43, 18–23. [Google Scholar] [CrossRef]
- Wei, M.; Rakoczy, J.; Vogt, C.; Harnisch, F.; Schumann, R.; Richnow, H.H. Enhancement and monitoring of pollutant removal in a constructed wetland by microbial electrochemical technology. Bioresour. Technol. 2015, 196, 490–496. [Google Scholar] [CrossRef] [PubMed]
- Li-Hui, Y.; Ting-Ting, Z.; Wei-Wei, C.; Rizwan, H.M.; Hong-Cheng, W.; Hao-Yi, C.; Ai-Jie, W. Micro-oxygen bioanode: An efficient strategy for enhancement of phenol degradation and current generation in mix-cultured MFCs. Bioresour. Technol. 2018, 268, 176–182. [Google Scholar]
- Hong, S.; Wei, G.; Menglin, L.; Jianhui, S. Performance of microbial fuel cells on removal of metronidazole. Water Sci. Technol. A J. Int. Assoc. Water Pollut. Res. 2013, 68, 2599. [Google Scholar]
- Wang, L.; Liu, Y.; Ma, J.; Zhao, F. Rapid degradation of sulphamethoxazole and the further transformation of 3-amino-5-methylisoxazole in a microbial fuel cell. Water Res. 2016, 88, 322–328. [Google Scholar] [CrossRef] [PubMed]
- Wang, L.; Liu, Y.; Wang, C.; Zhao, X.; Mahadeva, G.D.; Wu, Y.; Ma, J.; Zhao, F. Anoxic biodegradation of triclosan and the removal of its antimicrobial effect in microbial fuel cells. J. Hazard. Mater. 2018, 344, 669–678. [Google Scholar] [CrossRef]
- Yan, W.; Guo, Y.; Xiao, Y.; Wang, S.; Ding, R.; Jiang, J.; Gang, H.; Wang, H.; Yang, J.; Zhao, F. The changes of bacterial communities and antibiotic resistance genes in microbial fuel cells during long-term oxytetracycline processing. Water Res. 2018, 142, 105–114. [Google Scholar] [CrossRef] [PubMed]
- Lovley, D.R.; Phillips, E.J. Novel mode of microbial energy metabolism: Organic carbon oxidation coupled to dissimilatory reduction of iron or manganese. Appl. Environ. Microbiol. 1988, 54, 1472–1480. [Google Scholar] [CrossRef] [PubMed] [Green Version]
- Babanova, S.; Hubenova, Y.; Mitov, M.; Mandjukov, P. Uncertainties of Yeast-Based Biofuel Cell Operational Characteristics. Fuel Cells 2011, 11, 824–837. [Google Scholar] [CrossRef]
- Mario, M.; Bardarov, I.; Mandjukov, P.; Hubenova, Y. Chemometrical assessment of the electrical parameters obtained by long-term operating freshwater sediment microbial fuel cells. Bioelectrochemistry 2015, 106, 105–114. [Google Scholar]
- Zhou, M.; Chi, M.; Luo, J.; He, H.; Tao, J. An overview of electrode materials in microbial fuel cells. J. Power Sources 2011, 196, 4427–4435. [Google Scholar] [CrossRef]
- Hubenova, Y.; Mitov, M. Mitochondrial origin of extracelullar transferred electrons in yeast-based biofuel cells. Bioelectrochemistry 2014, 106, 232–239. [Google Scholar] [CrossRef]
Figure 1.
Reduction of Triclosan (TCS) aqueous concentration at pH 7.

Figure 2.
The profile of current generation (A) The profile of current density with NaAc or TCS feeding (B) Polarization curve and power density curve.
Figure 2.
The profile of current generation (A) The profile of current density with NaAc or TCS feeding (B) Polarization curve and power density curve.

Figure 3.
The TCS adsorption in control reactors with or without anode electrodes under abiotic conditions.
Figure 3.
The TCS adsorption in control reactors with or without anode electrodes under abiotic conditions.

Figure 4.
The adsorption of TCS in abiotic MFC at two different pH.

Figure 5.
TCS removal in microbial fuel cells (MFC) during electricity generation.

Figure 6.
The electricity generation during bioelectrical treatment of TCS.

Figure 7.
The pH variation during bioelectrical treatment of TCS.


Table 1.
The distribution of adsorbed TCS in abiotic reactor.
| Initial | Inner Chamber | Anode | Aqueous Solution | Total | |
|---|---|---|---|---|---|
| mass (mg) | 1.40 | 0.30 | 0.28 | 0.43 | 1.02 |
| Fraction (%) | 100 | 19.92% | 21.73% | 30.85% | 72.52% |
Table 2.
The distribution of adsorbed TCS in the MFC with bioanode.
| Initial | Inner Chamber | Anode | Aqueous Solution | Total | |
|---|---|---|---|---|---|
| mass (mg) | 1.40 | 0.20 | 0.01 | 0.08 | 0.29 |
| Fraction (%) | 100 | 14.23% | 0.72% | 5.75% | 20.70% |
© 2020 by the authors. Licensee MDPI, Basel, Switzerland. This article is an open access article distributed under the terms and conditions of the Creative Commons Attribution (CC BY) license (http://creativecommons.org/licenses/by/4.0/).
Share and Cite
MDPI and ACS Style
Xu, W.; Jin, B.; Zhou, S.; Su, Y.; Zhang, Y. Triclosan Removal in Microbial Fuel Cell: The Contribution of Adsorption and Bioelectricity Generation. Energies 2020, 13, 761. https://0-doi-org.brum.beds.ac.uk/10.3390/en13030761
AMA Style
Xu W, Jin B, Zhou S, Su Y, Zhang Y. Triclosan Removal in Microbial Fuel Cell: The Contribution of Adsorption and Bioelectricity Generation. Energies. 2020; 13(3):761. https://0-doi-org.brum.beds.ac.uk/10.3390/en13030761
Chicago/Turabian StyleXu, Wenli, Biao Jin, Shaofeng Zhou, Yanyan Su, and Yifeng Zhang. 2020. "Triclosan Removal in Microbial Fuel Cell: The Contribution of Adsorption and Bioelectricity Generation" Energies 13, no. 3: 761. https://0-doi-org.brum.beds.ac.uk/10.3390/en13030761
Note that from the first issue of 2016, this journal uses article numbers instead of page numbers. See further details here.