Article

Moisture Influence on the Thermal Operation of the Late 19th Century Brick Facade, in a Historic Building in the City of Zamora

by
Alejandro Cabeza-Prieto
1,
María Soledad Camino-Olea
1,*,
María Ascensión Rodríguez-Esteban
2,
Alfredo Llorente-Álvarez
1 and
María Paz Sáez Pérez
3
1
E.T.S. de Arquitectura, Universidad de Valladolid, avda Salamanca, 18, 47014 Valladolid, Spain
2
Campus Viriato, Universidad de Salamanca, avda Cardenal Cisneros, 34, 49001 Zamora, Spain
3
Campus Fuentenueva, Departamento de Construcciones Arquitectónicas, Universidad de Granada, calle Severo Ochoa, s/n; 18071 Granada, Spain
*
Author to whom correspondence should be addressed.
Submission received: 21 January 2020 / Revised: 28 February 2020 / Accepted: 7 March 2020 / Published: 11 March 2020
(This article belongs to the Special Issue Building Energy Audits-Diagnosis and Retrofitting)

Abstract

:
To improve the energy performance of restored cultural heritage buildings, it is necessary to know the real values of thermal conductivity of its envelope, mainly of the facades, and to study an intervention strategy that does not interfere with the preservation of their cultural and architectural values. The brick walls with which a large number of these buildings were constructed, usually absorb water, leading to their deterioration, whereas the heat transmission through them is much higher (than when they are dry). This aspect is often not taken into account when making interventions to improve the energy efficiency of these buildings, which makes them ineffective. This article presents the results of an investigation that analyzes thermal behavior buildings of the early 20th century in the city of Zamora, Spain. It has been concluded that avoiding moisture in brick walls not only prevents its deterioration but represents a significant energy saving, especially in buildings that have porous brick masonry walls and with significant thicknesses.

Graphical Abstract

1. Introduction

There is an important number of buildings built in the last centuries, distributed all over the world, which due to their architectural value are worthy of special protection during the actions that could be carried out in them: restoration, rehabilitation, and even in works of conservation. Many of the Spanish cities are a characteristic example of this fact, since a high percentage of them have historical centers of special relevance, with a great wealth of architectural heritage.
In order to protect this heritage, public administration have been passing laws, regulations and special plans. The main goal is to regulate the actions that can be done in these heritage buildings and to avoid modifications or unfortunate changes that could deface their original configuration.
The research focuses on centennial buildings, which do not usually comply with current regulations regarding their thermal behavior. These standards limit energy consumption, as published in this century in the different European Directives [1]. This is a relevant issue since these buildings are the images of these cities, and in many cases, identity symbols, such as it happens to Zamora and many other small inner cities, in the Autonomous Community of Castilla y León (Spain).
Among the different typologies of cultural heritage, this research focuses on buildings with pressed brick facades, where ornamentation is based on the combination of multiple geometric designs in panels, openings, imposts, and cornices, as differentiating elements. However, this is not only in cultural heritage buildings, but also in those where an intervention to thermally insulate the exterior is not possible, in order to improve the thermal efficiency of the envelope [2,3]
When calculations and estimates of energy demand are made due to losses through this type of facade, it is usual to work with the theoretical values contained in the regulations or auxiliary documents, without making specific checks that corroborate its application. Brick is a porous material that can absorb a significant amount of water: from rain, from the ground or from air humidity, and this humidity can cause thermal characteristics to vary considerably, showing a large difference in the dry state to the wet [4,5,6,7,8,9,10]. For this reason, it is necessary to perform an analysis that allows knowing the influence of moisture on the thermal behavior of the walls [11].
This study presents the results of the research that has been carried out to evaluate the difference of the thermal behavior of these facades [12], from dry to saturated state. A thermal flow test was realized that determines the real thermal behavior [4] in a representative facade of this typology, concerning a residential building in the city of Zamora (Spain), built in 1894. Of which there is documentation of the original project. This building is called “Matilde Mechán’s house”, designed by the architect Segundo Viloria [13], has three floors, and is located in the historic center near the Plaza Mayor de Zamora. This facade has been selected because bricks similar to those used in its construction have been located, which come from the same tilery. This allows testing to determine the characteristics of the materials, without extracting samples from the facade, such as: with the water absorption, density and porosity [14], related to its hygrothermal functioning. With the information obtained in the previous tests, simulations can be carried out by means of which the thermal behavior of the facade with very different moisture contents can be analyzed. Information is needed to better define the actions aimed at the energy rehabilitation of these buildings.

2. Methods

To get to know the behavior of the facades, several actions have been carried out: characterize the materials, analyze the application of the regulations to the values of thermal conductivity obtained according to the water content, perform a thermal flow test “in situ” [4] on the facade, and to subsequently carry out the simulations with the values obtained in these tests. The first simulation aims to verify the similarity between the results obtained in the thermal flow test “in situ” and those shown in the simulation. Subsequently, other series of simulations of the operation of this facade are carried out, considering different moisture contents and assuming that energy rehabilitation would be carried out by attaching a leaf of insulating material through the interior of the facade.

2.1. Characterization of Materials

The two types of bricks that, in general, were used in the construction of the facades at that time have been analyzed: pressed bricks and ordinary bricks [15]. Several bricks from demolitions of buildings of the same era and nearby buildings were located: pressed brick of 261 × 127 × 53 mm. and ordinary brick of 266 × 126 × 46 mm. Four bricks of each type were chosen that were cut in half and ground to make their faces perfectly smooth and parallel. In total, for the tests, eight specimens were used. The morphology of the specimens was determined by the requirements of the test machine that analyzes the thermal conductivity value and the dimensions of the bricks. The two types of brick had different manufacturing processes, the pressed brick was made by pressing the clay between two molds, and the ordinary brick is manufactured by extrusion [16]. Eight mortar specimens were also made with sand and lime in a 1/3 ratio to perform the same tests as with brick specimens, of 158 × 89 × 40 cm. The specimens were left in the laboratory environment at 20 °C and 50% to 55% humidity for 28 days before testing.
The bricks were manufactured in the Tejera de San Antonio, the first industrial tilery of Zamora (late 19th century). It was located near the clay deposit (El Perdigón, Zamora, Spain) and had a great production, so it supplied bricks to all the buildings in the capital, during the late 19th and early 20th centuries [16]. For this reason, it has been possible to find some pieces to carry out the tests. To test the characteristics of the mortar, eight specimens were manufactured with sand from the area and lime in a ratio of three to one.
The 24 specimens were tested to obtain the value of λ, thermal conductivity, for which a quick thermal conductivity meter (QTM 710/700 model, from KEM, KYOTO ELECTRONICS) was used; the the laboratory temperature was 22 °C ± 1 °C and had a relative humidity of 50% ± 5%. The specimens were tested in various moisture states: dry, semi-saturated and saturated, by immersion in cold water. The procedure of European Standard EN 772-21) [17] has been followed to determine the water content.
Other tests were also performed, regarding bulk density [18] and porosity by mercury intrusion porosimetry test, according to ASTM D4404-18 [19]. Through the same test, the average dimension of the pores size was calculated, based on the hypothesis that it could be a characteristic of the materials that could influence thermal conductivity.
In addition, cold water absorption (European Standard EN 772-21) [17] has been verified, calculating the water content in m3/m3 instead of percentage by weight, as indicated in the standard, because it has considered that, using these units, the value is more easily comparable in materials that have different densities.
Subsequently, the thermal conductivity coefficient values obtained, in the wet state, were compared with those obtained by applying the formula of EN ISO 10456 [20], which indicates that the conversion of thermal values from one set of conditions to another set of conditions is performed according to the following expression:
λ 2 = λ 1   F m   F T   F a
where:
λn 
thermal conductivity of the material conditions n, W(m.K);
Fm 
moisture conversion factor;
FT 
temperature conversión factor;
Fa 
ageing conversión factor.
It should be noted that the tests have been carried out on the specimens under the same temperature conditions, so the temperature conversion factor is 1. The ageing conversion factor is not known, so the value 1 will also be used. The moisture conversion factor Fm is calculated, in turn, by the expression:
F m =   e   f ψ   × ( Ψ 2 Ψ 1 )
where:
fψ 
design moisture coefficient % by volumen;
ψdesign 
design water content % by volumen (m3/m3).
Therefore, in the case of the study, the relationship between the coefficients of thermal conductivity of the specimens of the same type of brick, but with different water content, can be compared using the formula:
λ 2 = λ 1   e f Ψ x ( Ψ 2 Ψ 1 )
In Table 4 of the standard EN ISO 10456 [18], it is obtained that the value of the moisture coefficient for the baked clay fΨ = 10, with a density between 1000 y 2400 kg/m3, and for a mortar with a density between 250 and 2000 kg/m3, its value would be fΨ = 4, valid for a moisture content between 0 and 0.25 m3/m3.
To obtain the temperature conversion coefficient for different temperatures, using the figure in table A.111 of the same standard, for burnt clay and mortar of all densities, the value would be fT = 0.001 1/K. This is equivalent to that, for a temperature difference of 20 °C, the conversion factor would be FT = 1.020.
Once the thermal conductivity values of the component materials have been obtained, the masonry conductivity of a λdesign, mas masonry, more depending on the values of its components [21], in this case the brick λdesign, unit and the mortar λdesign, mor, taking into account the percentage of the area in the elevation, is obtained by the following formula:
  λ d e s i n g ,   m a s   = a u n i t   x   λ d e s i g n , u n i t + a m o r   x   λ d e s i g n , m o r
If the formula is applied to the two types of brick wall from which the facade is formed, the thermal conductivity value is obtained for the two leafs that make up the facade. This is the result of calculating the percentage of raised area brick and mortar, being the one of 95% and 5% pressed brick and the ordinary brick 92% and 8%. This is possible since these facades are formed by blight leafs, one with pressed bricks and another with ordinary bricks, locked by keys of the same pieces. The pressed brick leaf is executed with 3-mm joints and that of ordinary brick with 8-mm joints [16].
Masonry specimens were also made to test the water content that this type of masonry can have in a dry and saturated state and the moisture that can be absorbed from the environment by the procedure followed for the materials, European Standard EN 772-21 [17]. The ordinary brick specimens formed by eight bricks were placed in four rows of 270 × 265 mm base.

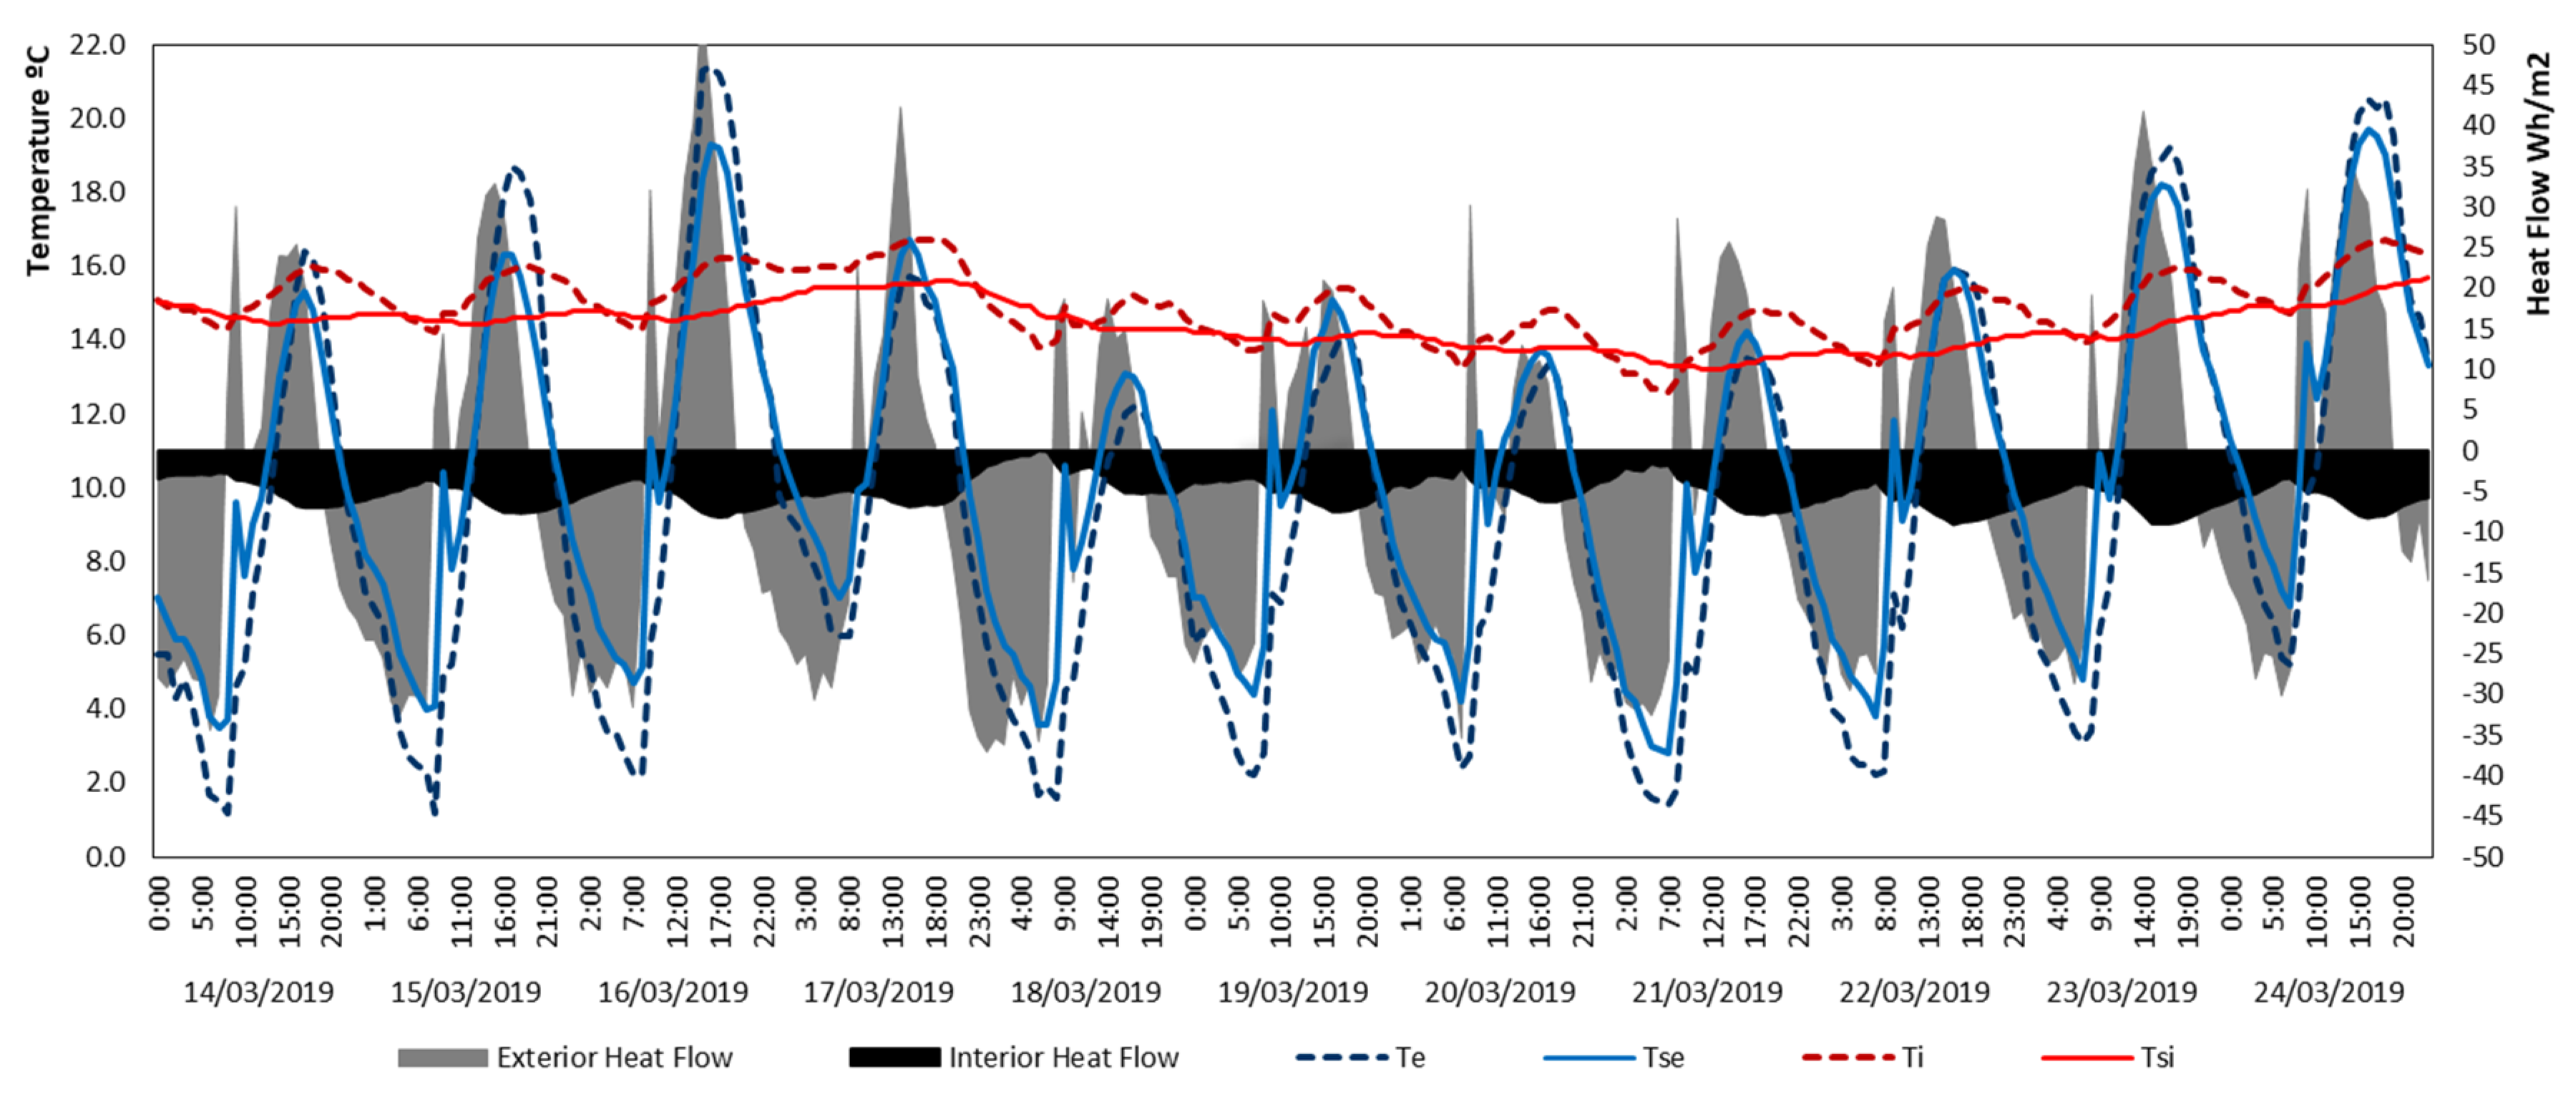
2.2. “in situ” Thermal Flow Test

The facade wall on which the “in situ” test was carried out [4,22,23] has not been subject to interventions and is kept in very good condition after more than 120 years of life. It is composed of two brick walls tied with rigging of Spanish blights, using the brick pressed outside, and the ordinary brick inside, as already mentioned. In the report of the original project of 1894, it is specified that, on the first floor, the wall thickness is 60 cm, very approximate value to the measurement made “in situ”, in which 58 cm have been obtained.
The building was selected by: (1) Being inhabited, so that there is a constant indoor temperature; (2) Having the brick masonry facade, without any other material; (3) Not having undergone restoration or rehabilitation, which may have modified the original composition of the brick wall; (4) Being in an environment with extreme temperatures, below 0 °C in winter, to work in the most unfavorable conditions, and with following permission to place the instruments to do the essay. The test is carried out in the blind area of the facade of which there is greater surface area and is not carried out in singular areas or thermal bridges because the methodology used is better adapted [24].
The in situ test on this facade wall was carried out for 13 days, according to the methodology of the International Standard ISO 9869-1 [25], specifically between 13 and 25 March 2019. It is of a north-facing facade with a slight deviation to the east. This orientation was chosen with the intention of preventing the direct incidence of the sun from having a significant influence and so that it could cause alterations of the flow and surface temperatures (sun-air temperature). Of the 13 days of testing, 11 have been selected discarding the first and the last, because they are not full days and because of the small interferences that could exist during the assembly and disassembly of the measuring equipment.
A novelty was introduced with respect to the test standard and it is that two thermal flow plates were placed, one inside, to measure the flow through the facade from the inside, and another outside, to know the flow in the face outside to better calibrate the simulation (Figure 1a). With those thermal flow plates values are captured at different times of the day, which are very different, since there are important changes in temperatures outside. In addition to the plates, four probes were placed, two inside and two outside the wall, to measure air temperatures and surface temperatures.
The location of the thermal flow plates in the wall is determined by two conditions, on the one hand, allowing the cables to connect both plates and the probes on both sides of the facade with the data logger, which collects the data. On the other, away from the thermal bridges, which, as you can see, were captured by images made with a thermal imager (Figure 1b).
The equipment used in carrying out the test are listed below (Figure 2):
  • Heat flow meter AMR model FQAD19T of Ahlborn (250 mm × 250 mm × 1.5 mm) made of epoxy resin (Figure 2a) (accuracy 0.02% of the measured value) suitable for flat plaster finish, which was placed inside, and a heat flow meter AMR model FQAD18TSI of Ahlborn (120 mm × 120 mm × 3 mm) made of silicon (Figure 2b), which adapts well to the most irregular surface of the brick facade (accuracy 0.02% of the measured value of the measured value).
  • Four thermocouples (Figure 2b) to measure the surface temperature: indoor and outdoor, and the temperature: outdoor and indoor (accuracy ± 0.05 °C ± 0.05% of the measured value).
  • For data storage of heat fluxes and surface temperatures, two Data Logger units model Almemo 2590 of the Ahlborn trademark (Figure 2d) (accuracy 0.03%) have been used.
  • FLIR ThermaCAM B29 brand thermal imager, with a thermal sensitivity of 0.1 °C, temperature measurement range from −20 °C to + 100 °C, spectrum range of 7.5 to 13 μm, and emissivity value of the brick 0.9.
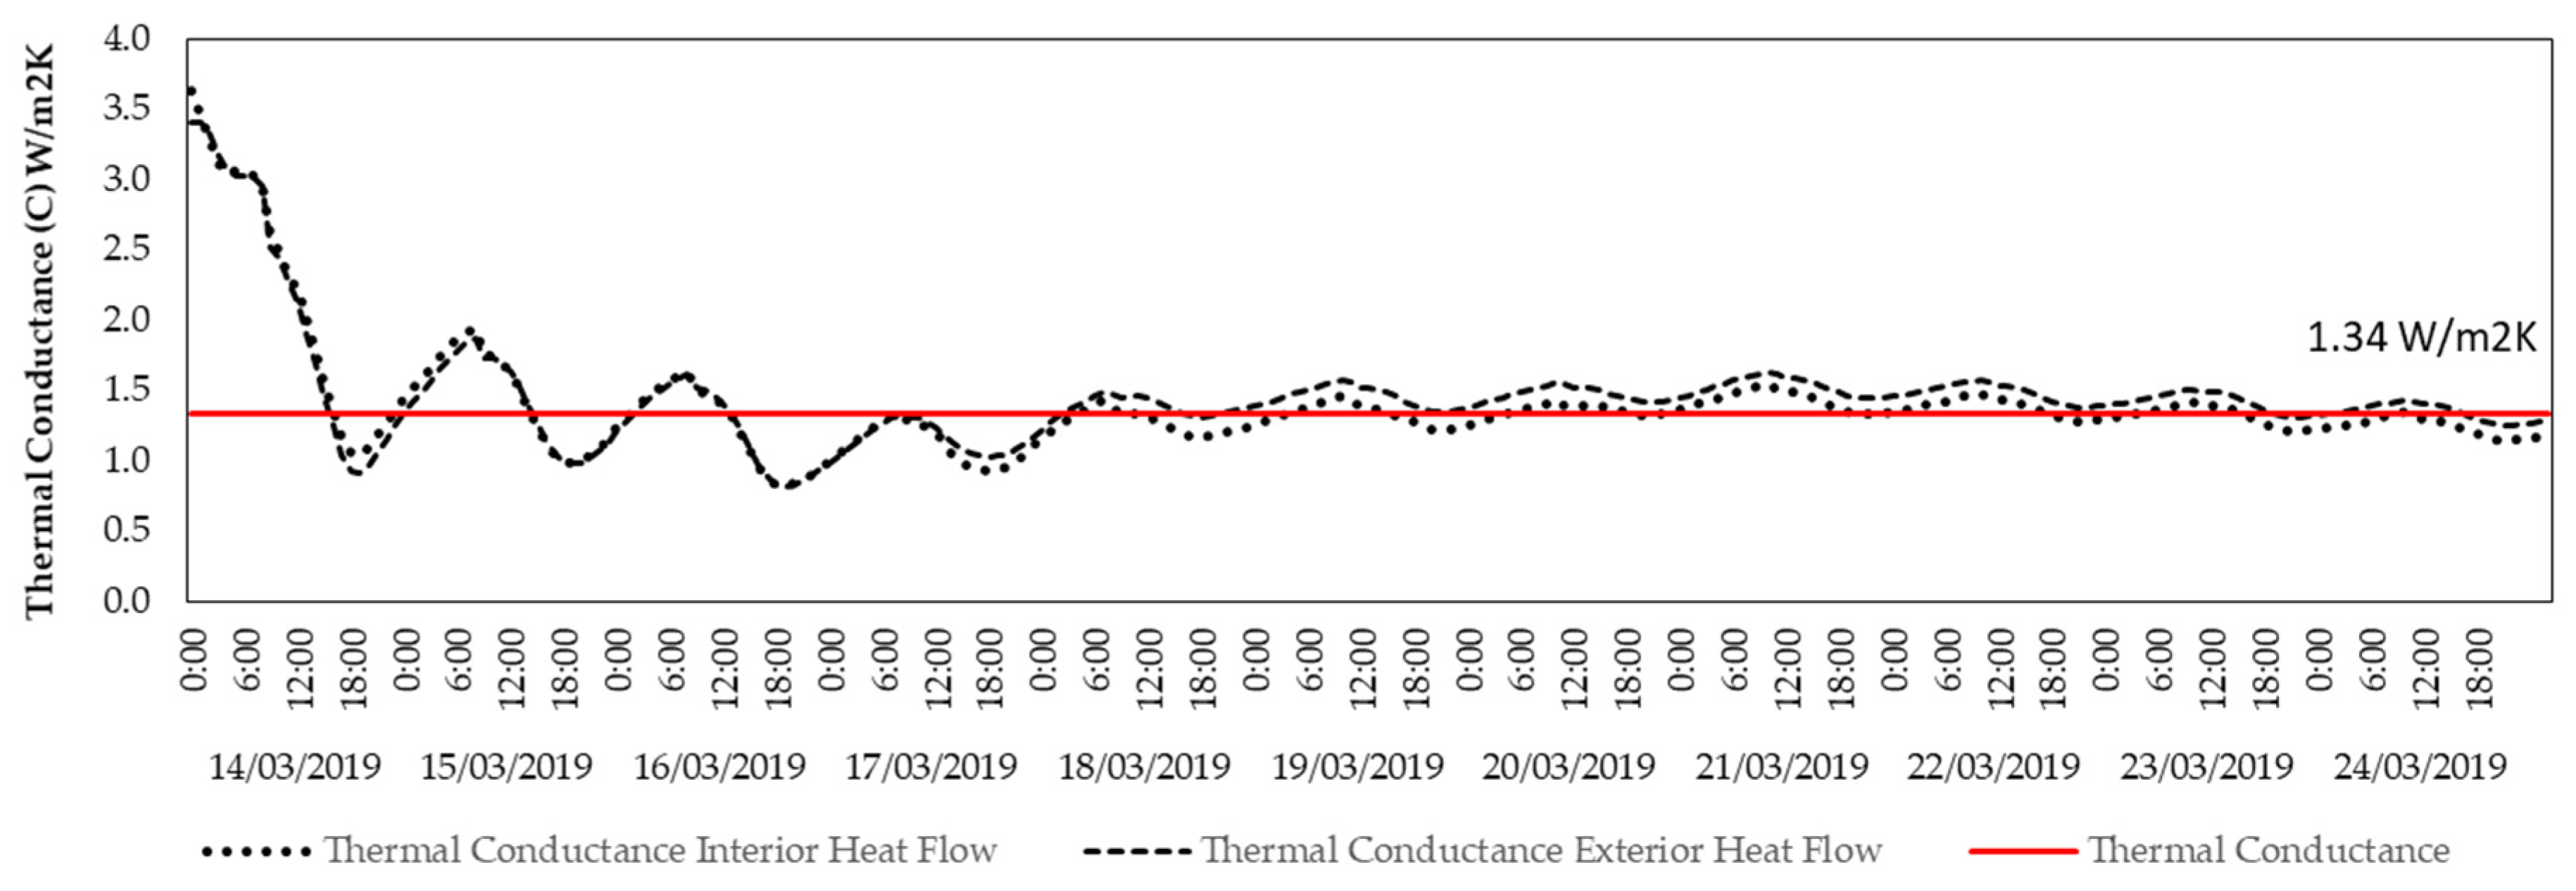
With the surface temperature data and the value of the flow through the specimen, the thermal conductivity value can be calculated according to the procedure established in ISO 9869-1 [25,26,27,28,29] using the formula:
Λ = j = 1 n q j j = 1 n ( T s i j T s e j )
where:
Λ
thermal conductance, en W/(m2.K)
q
density of heat flow rate = Ф/A, en W/m2;
Tsi
interior surface temperature, en °C;
Tse
exterior surface temperature, en °C.

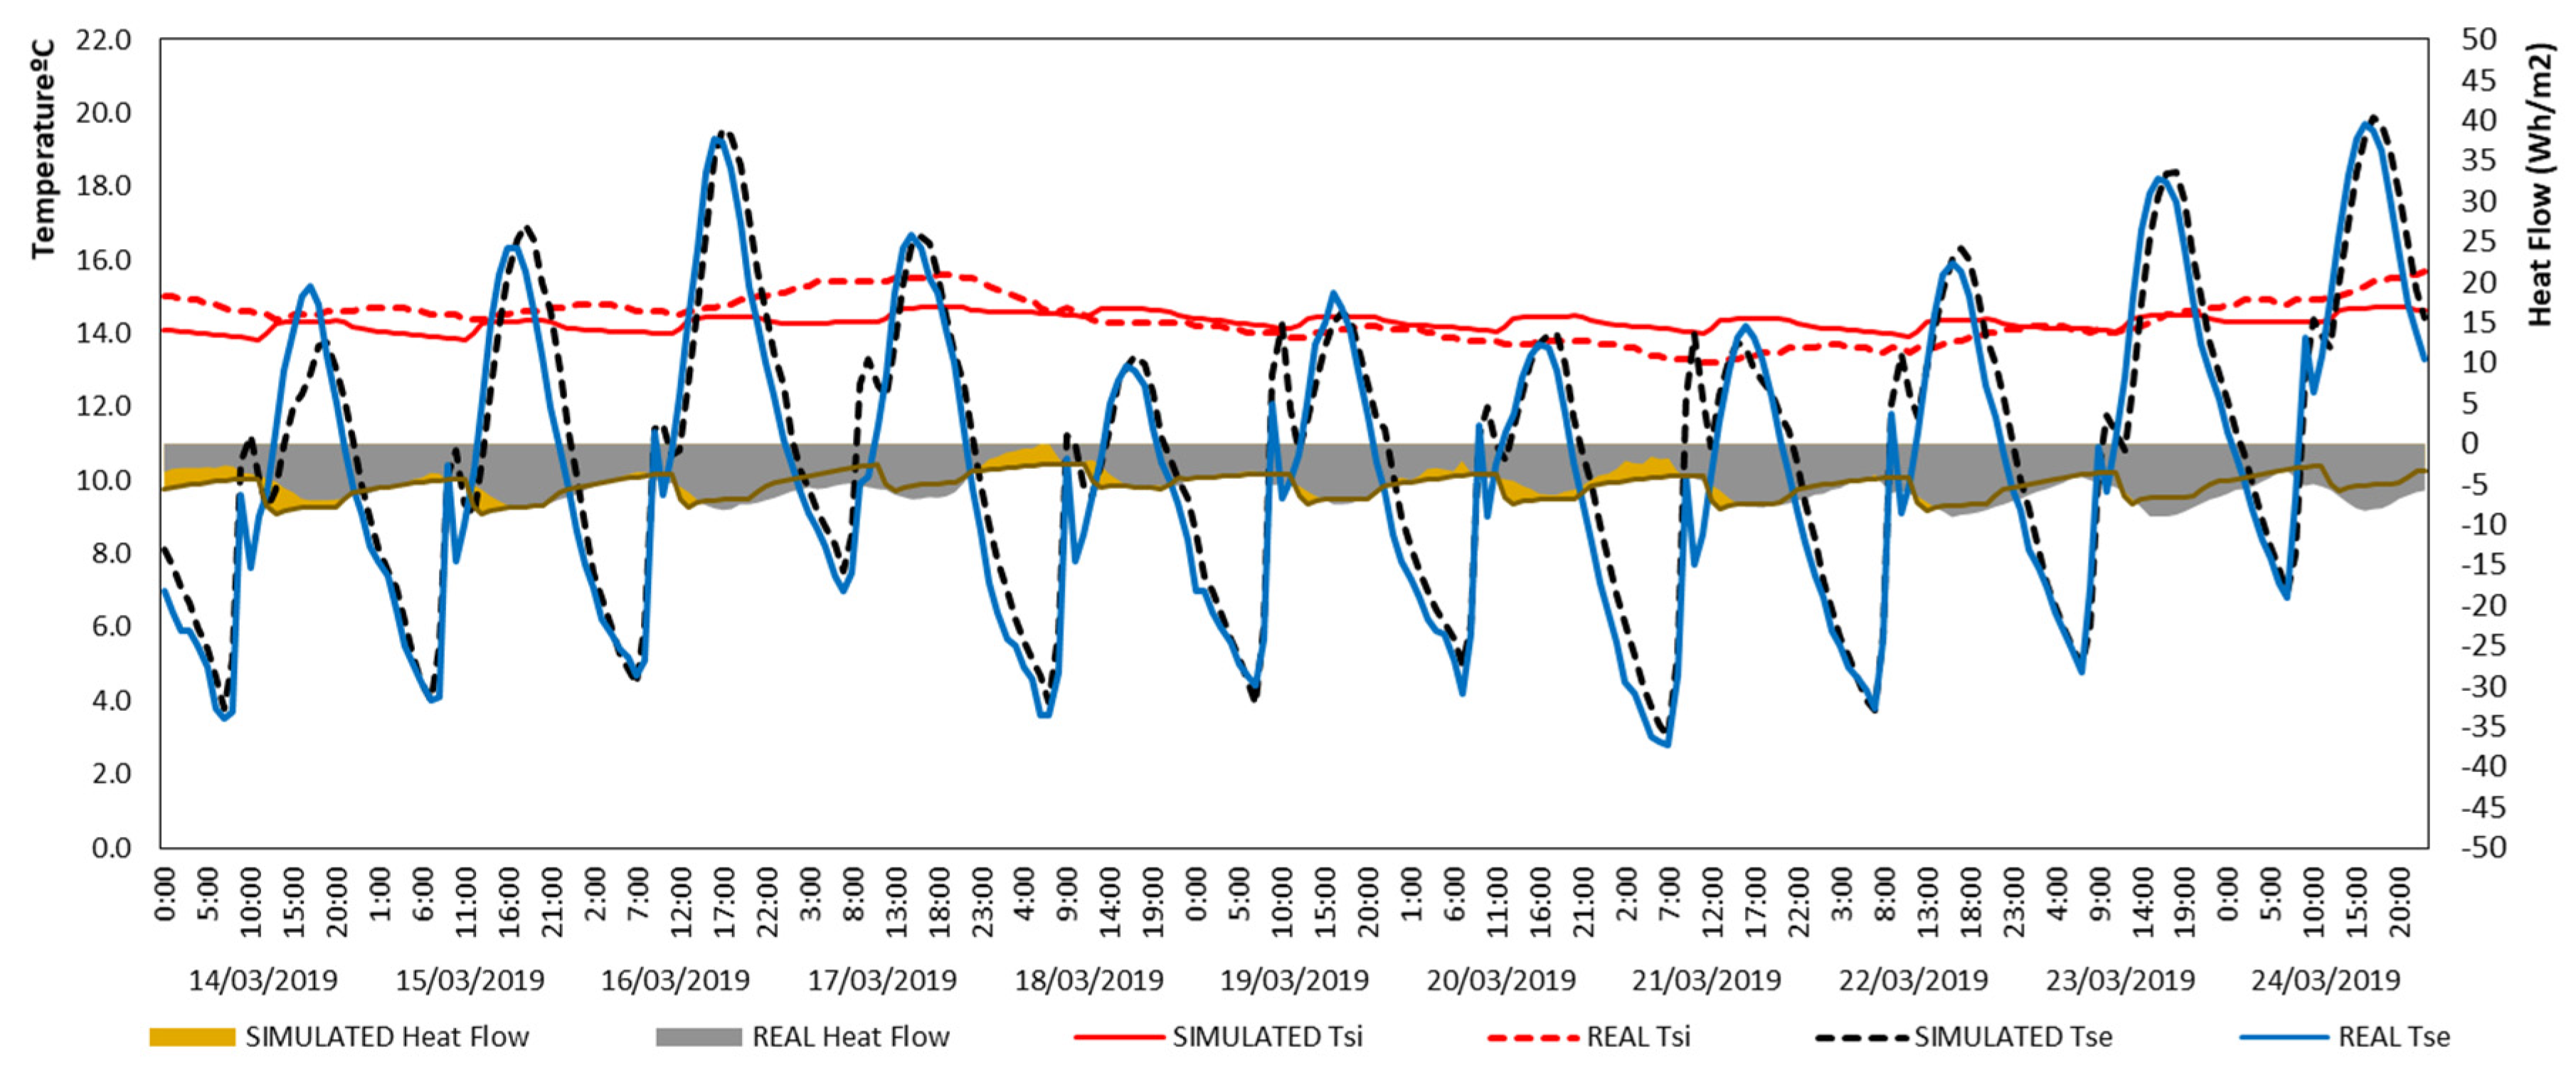
2.3. Energy Simulations Based on the Data Obtained in the Flow Test

With the data obtained in the “in situ” test, it is intended to validate the energy simulation tool to analyze, through simulations, situations in which the facade presents different water contents. For the simulation, a climate file is generated from the data collected by the outdoor air temperature probes. To establish the indoor temperature, an indoor HVAC (Heat Ventilation Air Condicioned) system is simulated that maintains a simulation surface temperature, practically equal to the surface temperature obtained by the probe during the “in situ” test. This is achieved by conditioning the operating temperature inside the space in the simulation at a ratio of 0.70 radiant. A wall similar in size to that of the “in situ” test is simulated, which is supposed to be the closing of a building that has a cubic shape, where the rest of the elements of the envelope are adiabatic. For the characteristics of the materials of which the wall to be simulated is composed, the values of the tests carried out on the materials are used taking into account the following simplifications: The wall is formed by brick leaf, as already described above, and the interior has a water content equal to that of the simulated wall in the laboratory, under similar conditions of water content to the air during the “in situ” test, and the outer leaf has a water content that is obtained from the value of the thermal conductance of the thermal flux test and of the values of the tests on the materials. That is, the water content of the outer leaf has been calculated starting from the rest of the values obtained in the tests. This simulation was carried out with the Energy plus version 8.3 program [30]. Subsequently, the results obtained have been compared with those released in situ. It is possible to know the degree of reliability of the simulation.
Once the simulation has been adjusted to the in situ test, and using the thermal conductivity values according to the water content obtained in the material characterization tests, it has been possible to perform other simulations that calculate the thermal flow of the facade when the rain has dampened by water or by which it rises by capillarity from the ground. The data obtained with these simulations are compared with those obtained in the actual test, and the differences that exist in the thermal flux transmission are analyzed:
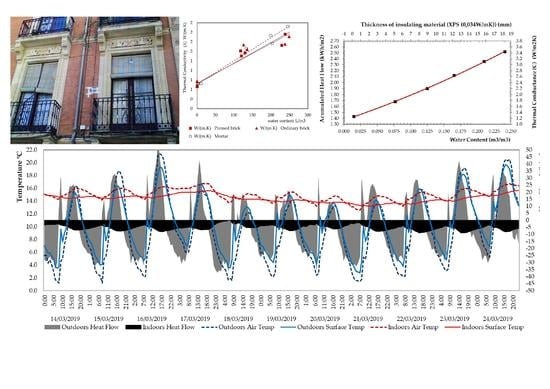
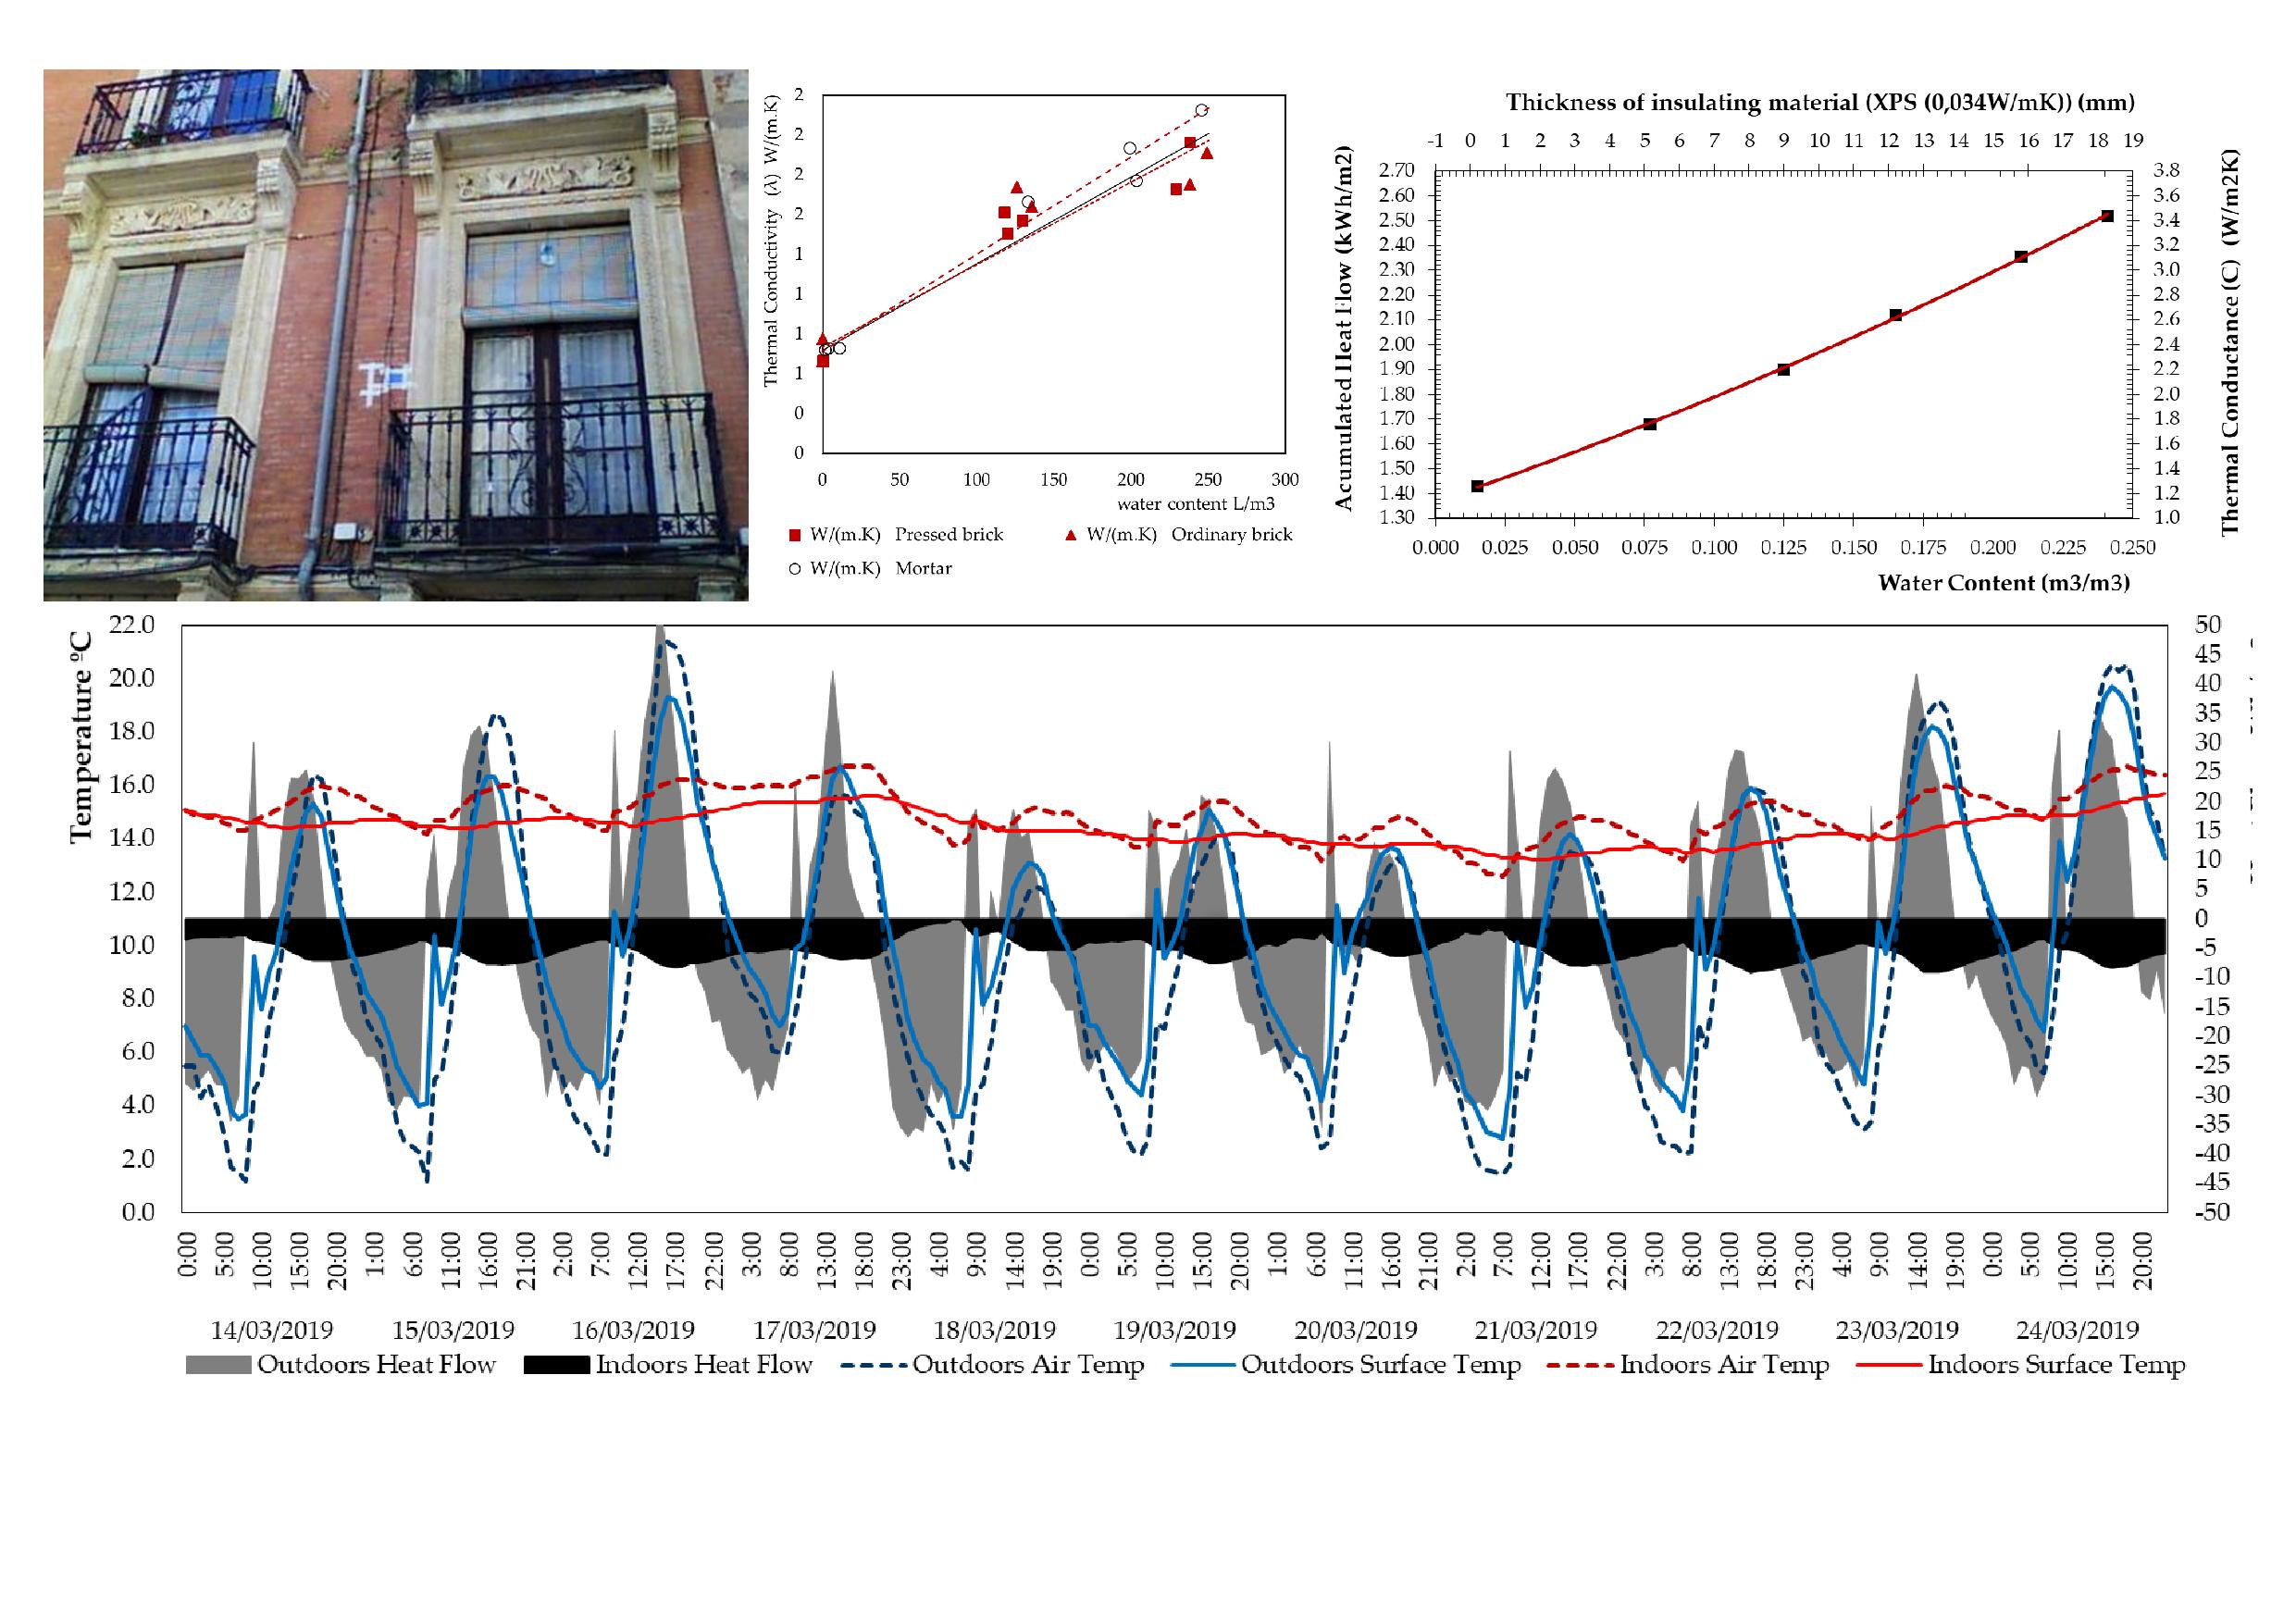
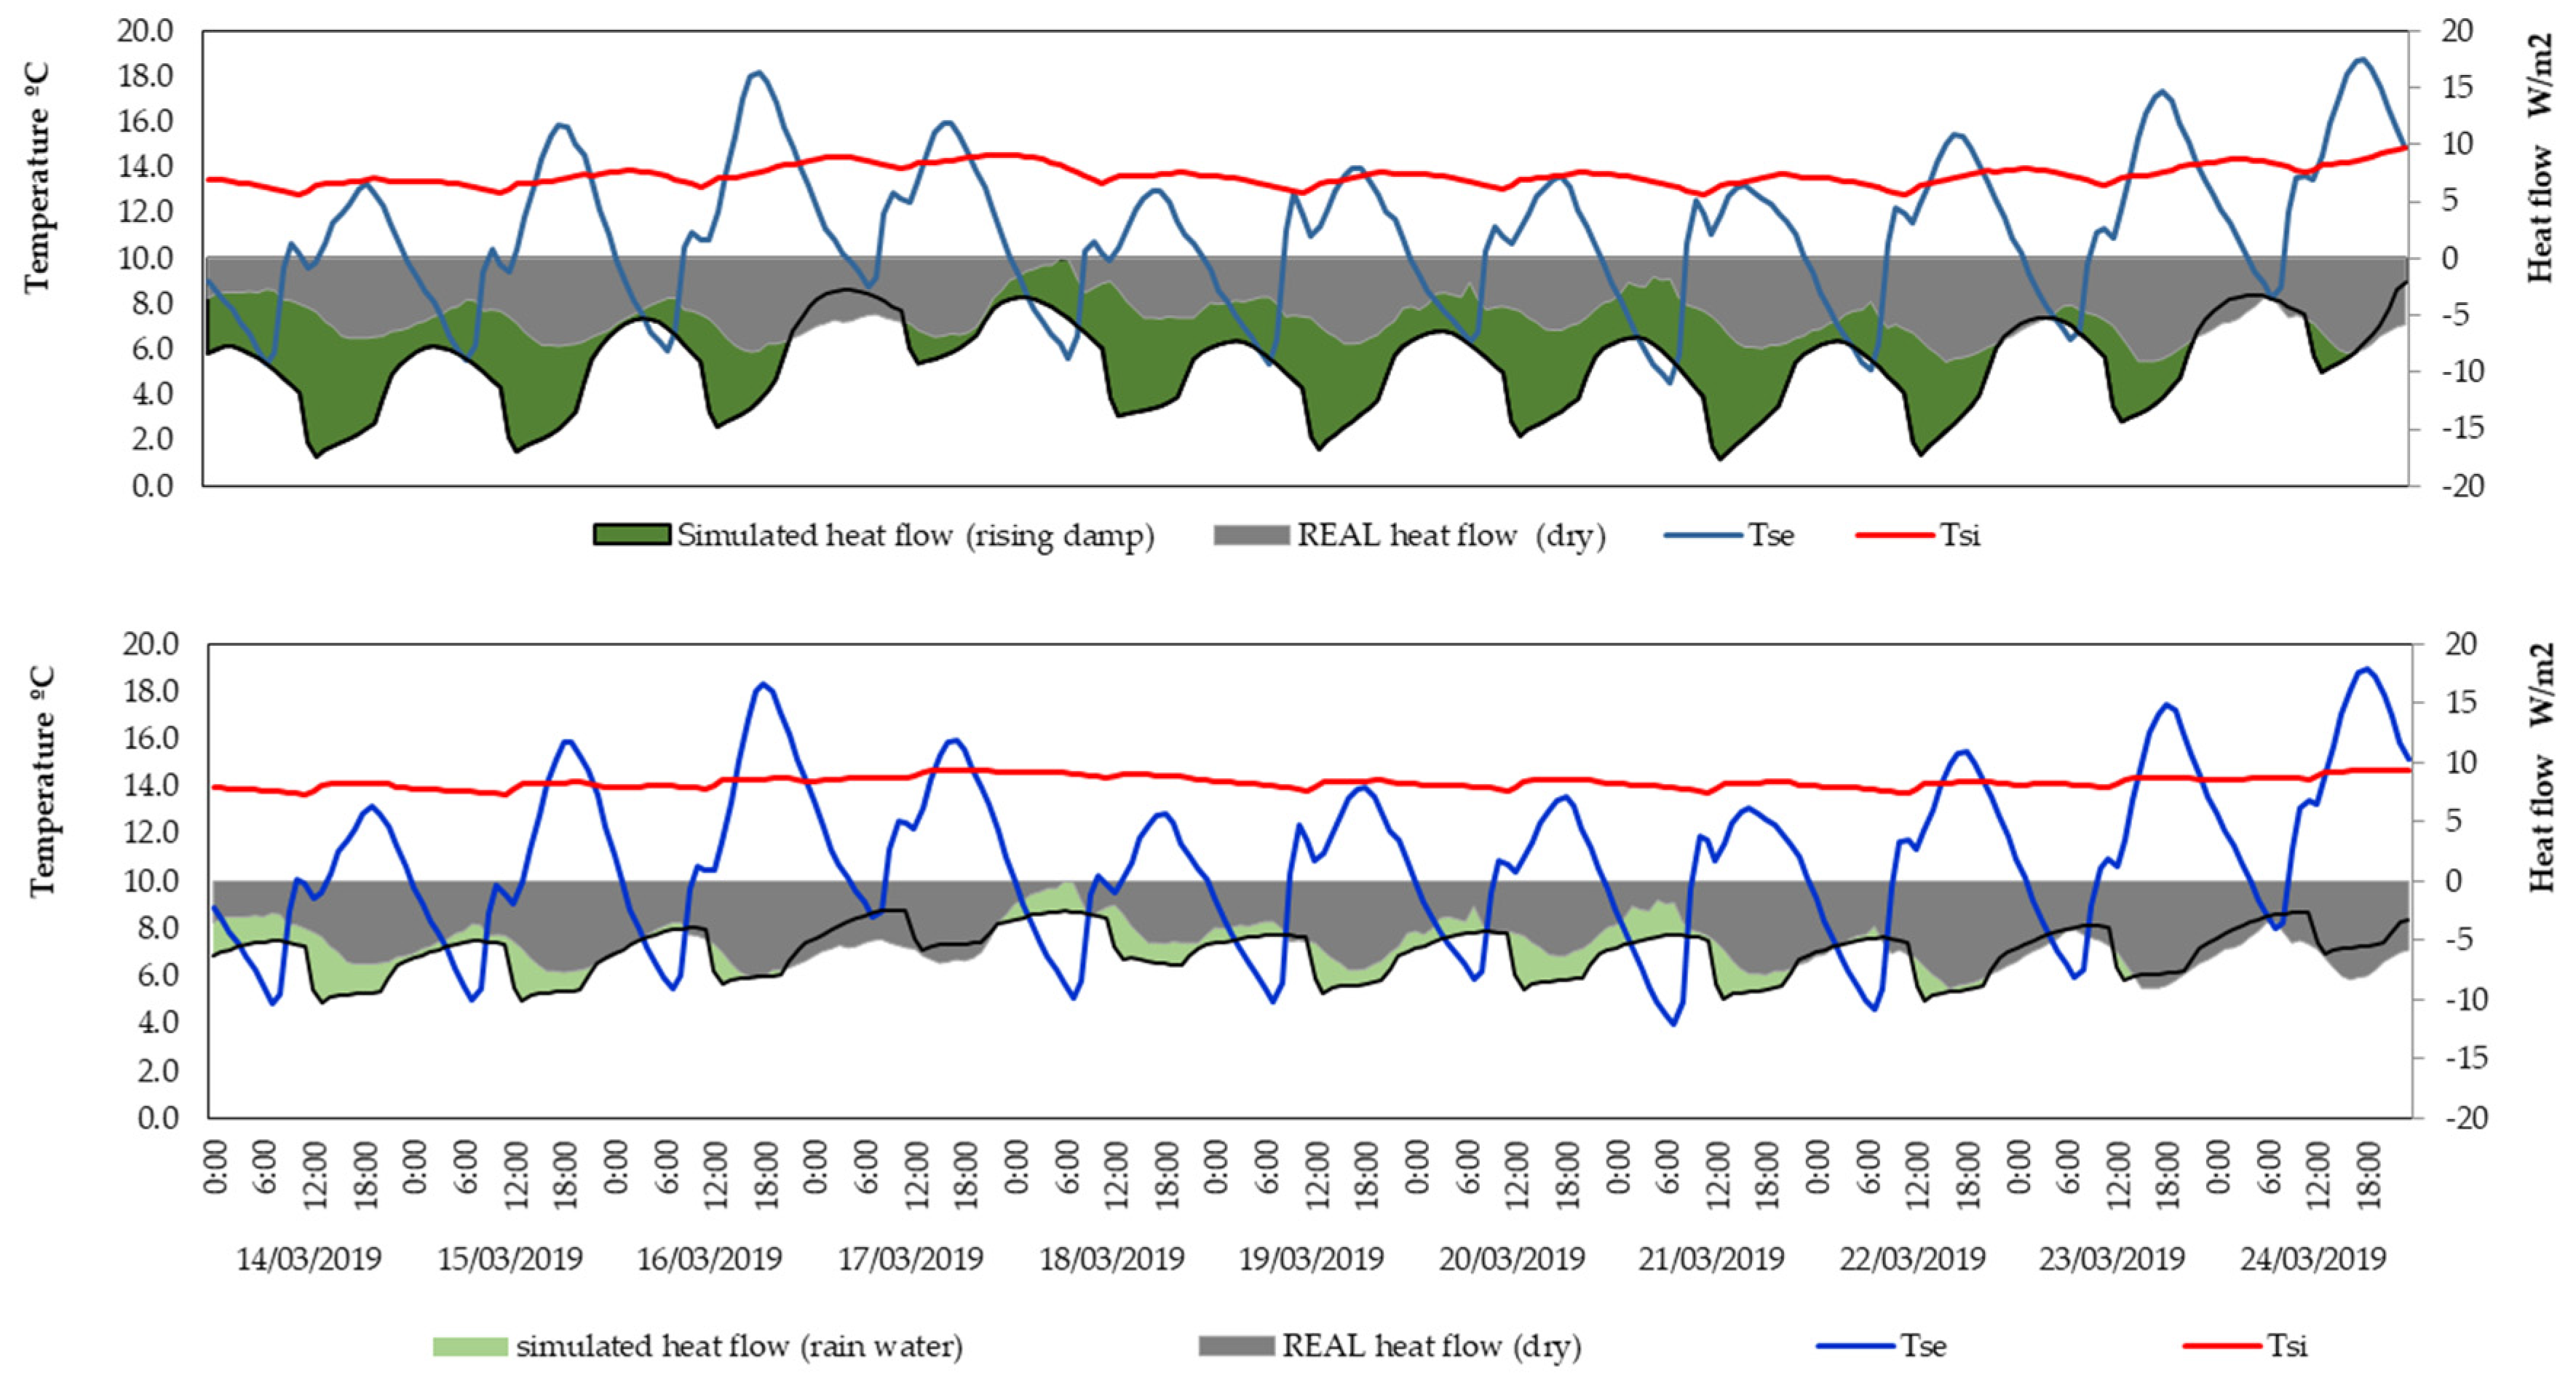
  • The first simulation has been carried out for an alleged case of rainwater that moistens the facade. According to document DB HS1 of the Technical Building Code (Spain) [31], a wall of the thickness of the brick stretcher is sufficient to prevent the passage of rainwater into the interior; for this reason, it has been simulated that only the leaf is moistened on the exterior and is done so gradually: 1/3 of the thickness is totally wetted 241 l/m3 and has a λ = 1.96 W/(mK), another third of the facade is wetted at 66% 160 l/m3 with λ = 1. 52 W/(m.K), and the remaining third is moistened to 33%, 80 l/m3 with λ = 1.08 W/(m.K).
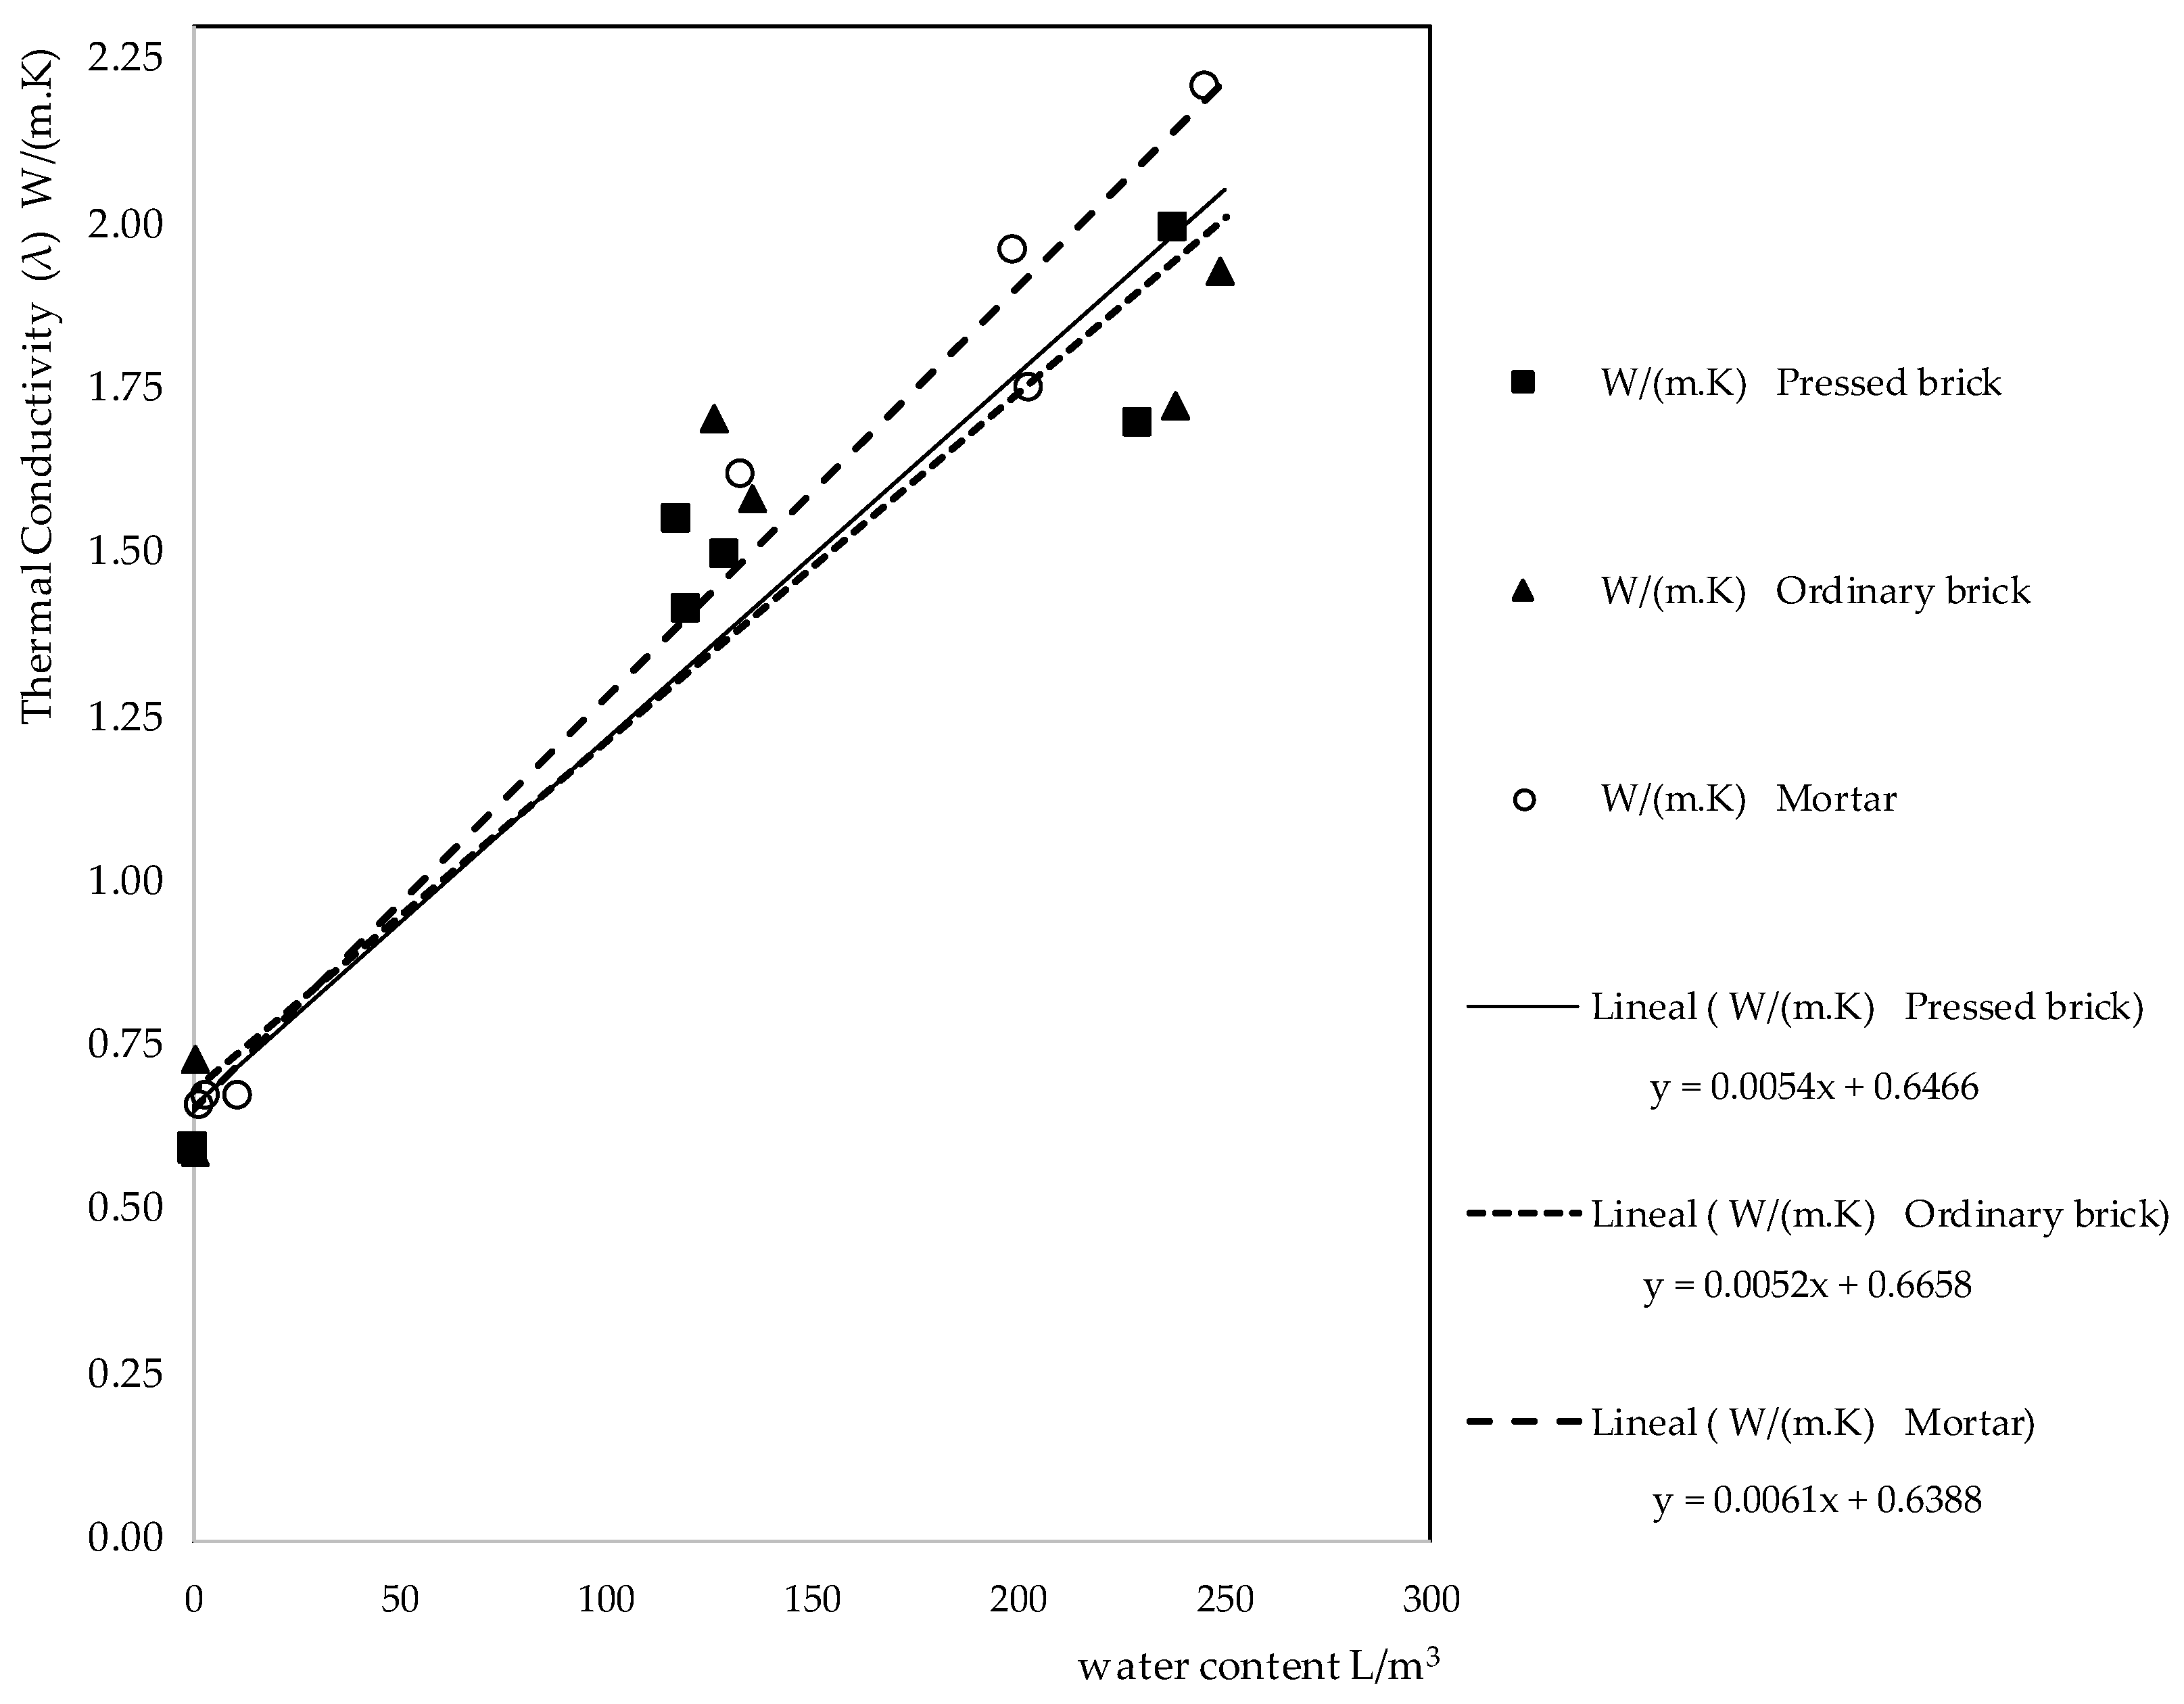
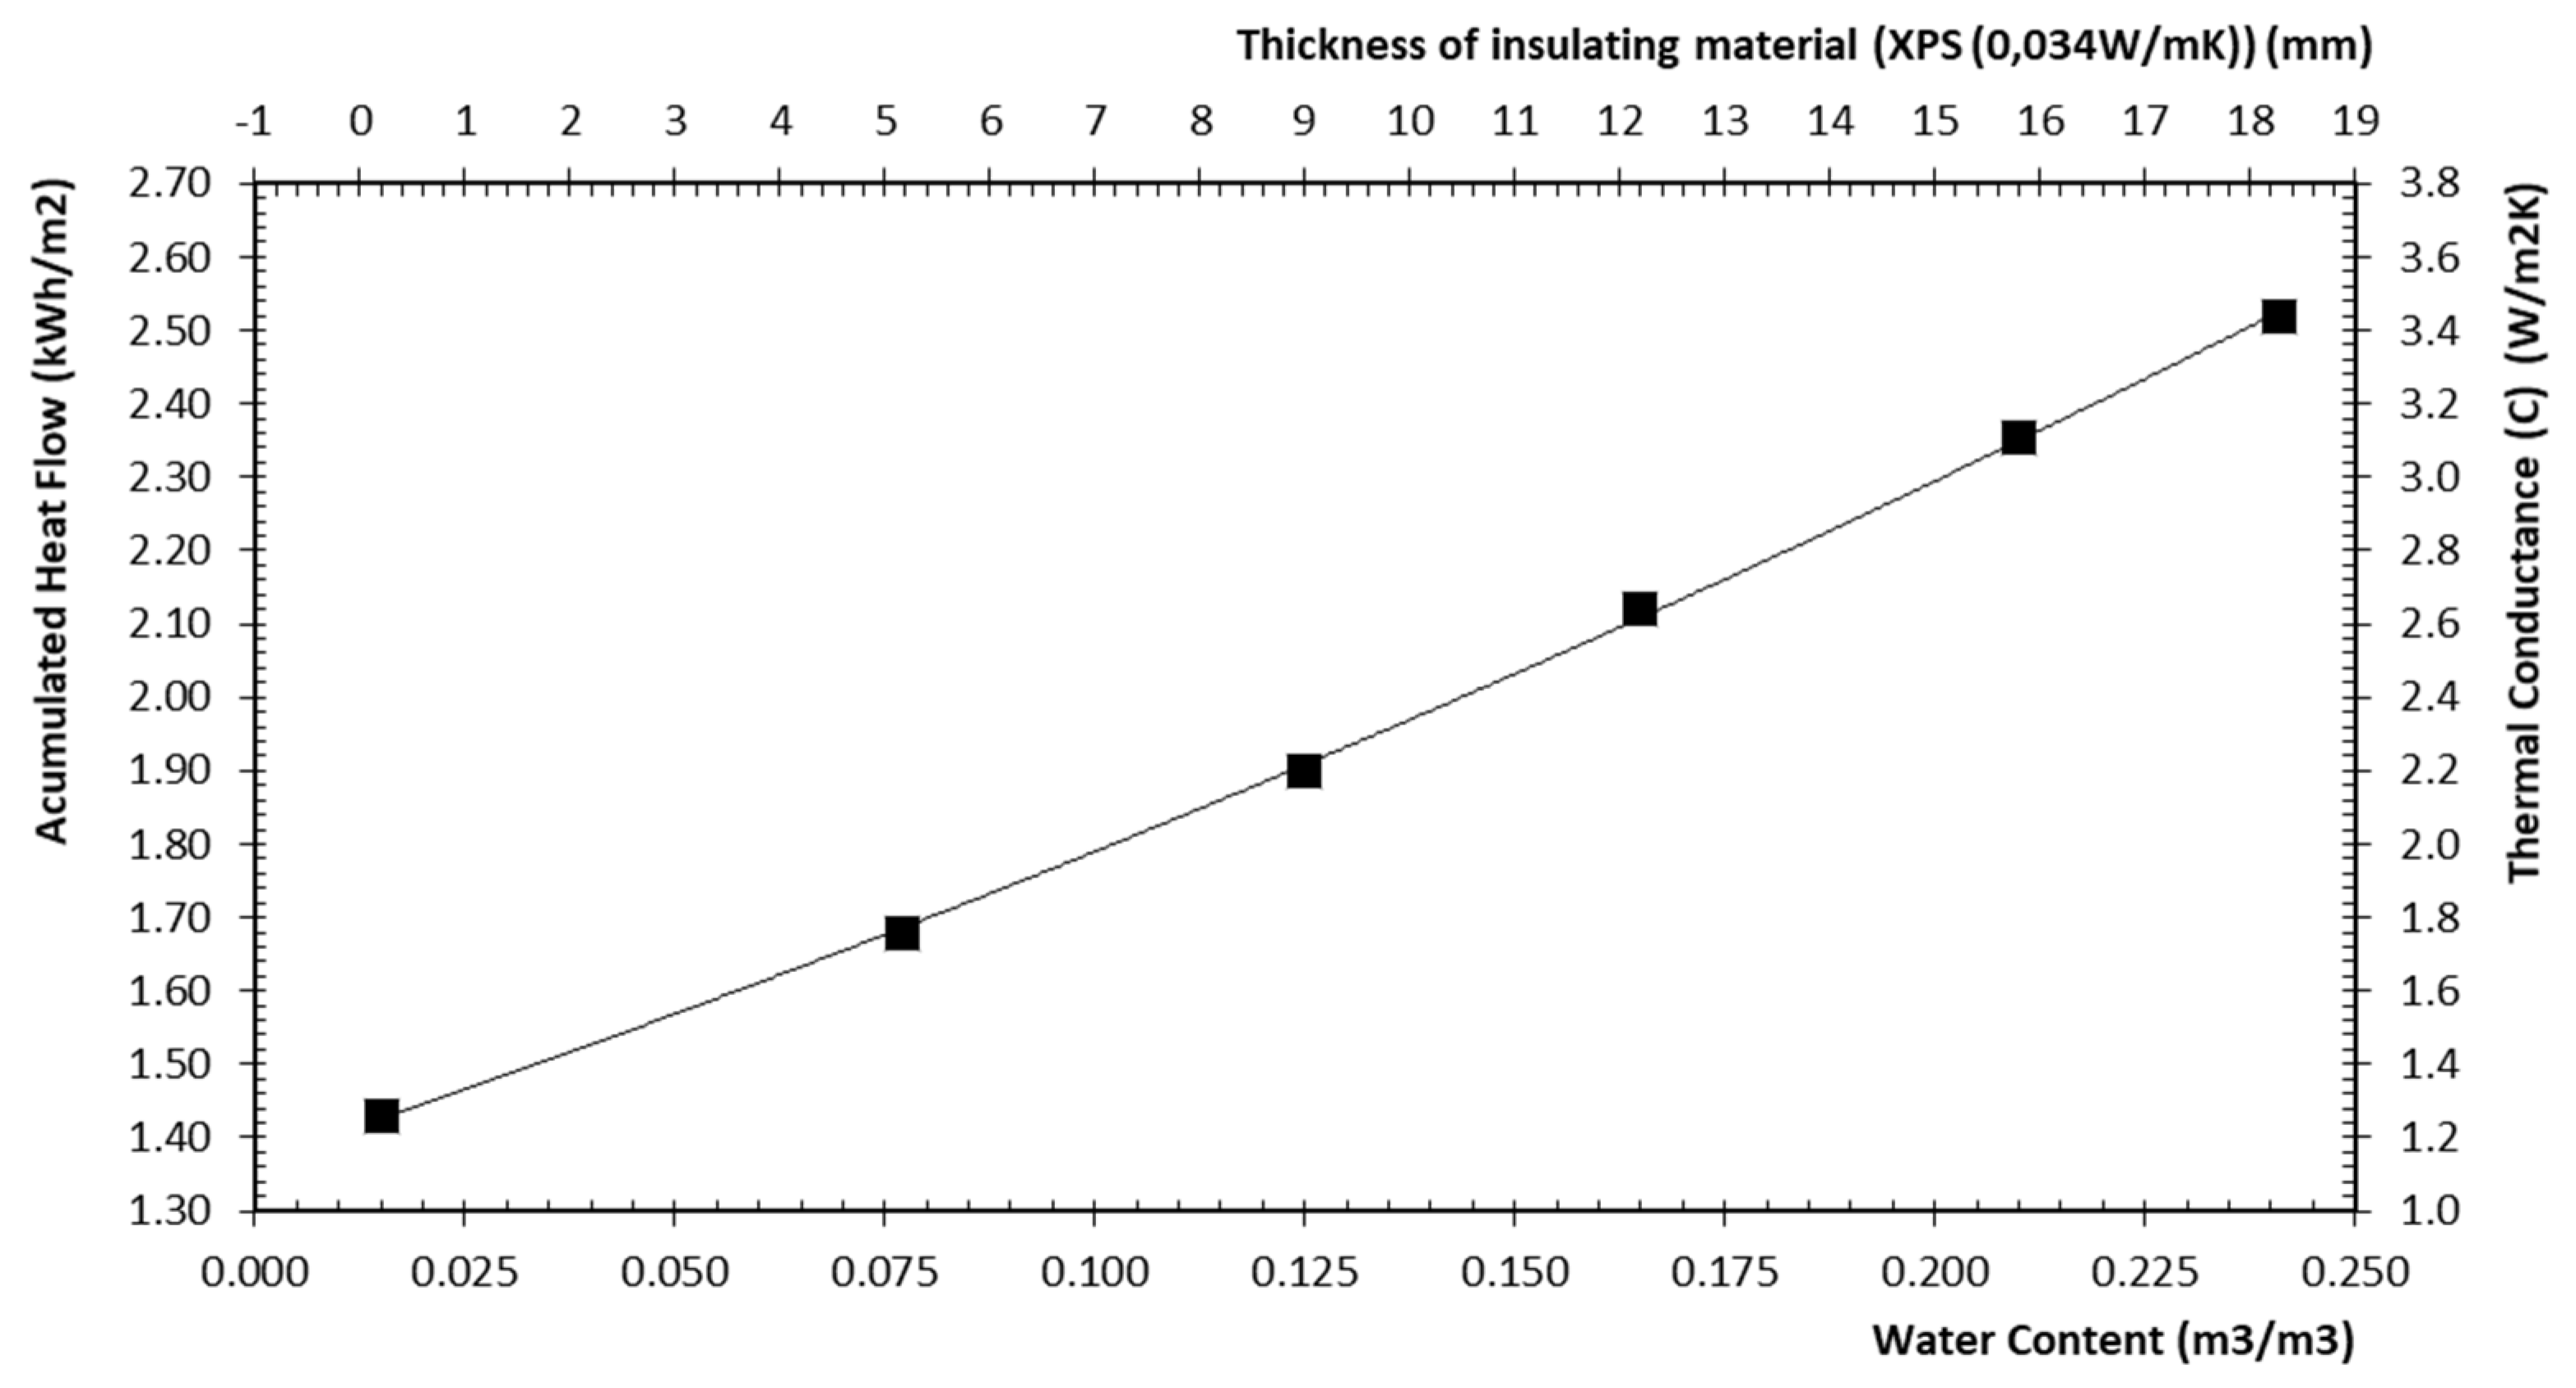
  • The second simulation was carried out assuming that it is a boundary zone where the water rises by capillarity and it has been assumed that the two brick leafs were similarly moistened. For a water content of 0.015 m3/m3 (lthe facade is practically dry), λ pressed brick = 0.73 W/(m.K), λ ordinary brick = 0.74 W/(m.K), and λ mortar = 0.73 W/(m.K). For a water content of 0.077 m3/m3, λ pressed brick = 1.07 W/(m.K), λ ordinary brick = 1.07 W/(m.K), and λ mortar = 1.11 W/(m.K). For a water content of 0.125 m3/m3, λ pressed brick = 1.33 W/(m.K), λ ordinary brick = 1.31 W/(m.K), and λ mortar = 1.40 W/(m.K). For a water content of 0.165 m3/m3, λ pressed brick = 1.54 W/(m.K), λ ordinary brick = 1.52 W/(m.K), and λ mortar = 1.65 W/(m.K). For a water content of 0.210 m3/m3, λ pressed brick = 1.79 W/(m.K), λ ordinary brick = 1.79 W/(m.K), and λ mortar = 1.795 W/(m.K), and for a water content of 0.241 m3/m3, the values previously calculated. Then, other simulations have been carried out to relate the water content of this facade with the thermal flux that would pass through it, the value of the thermal conductance and the thickness of a leaf of insulating material that would be necessary, located inside, to maintain the dry values: flow and thermal conductance of the facade, depending on the water content.

3. Results

3.1. Materials Characterization

The value of the thermal conductivity of the specimens, calculated with the formulas of the trend lines, (Figure 3) are saturated more than three times that of the dried specimens [4]: for the pressed brick specimen λdry = 0.65W/(m.K) and λ241 l/m3 = 1.96 W/(m.K), while for the ordinary brick specimen λdry = 0.67 W/(m.K) and λ243 l/m3 = 1.93 W/(m.K), and for the mortar λdry = 0.64 W/(m.K) and λ231 l/m3 = 2.05 W/(m.K). These values show the difference in thermal transmission between a dry and a saturated facade, especially in the type of facade being studied that has an important thickness.
In the tests of the materials, it can be seen that the two types of bricks that have been tested have similar values, probably because they are two solid bricks manufactured by the same ceramic in the same period of time. They were chosen by a high water absorption so the difference between the conductivity values between dry and wet brick would also be high (Figure 3). Having a high water absorption, the porosity is also high and the density is relatively low for solid bricks. Table 1 shows the density, porosity and average pore size results of the porosimetry test and the results of the water absorption test of the three materials.
In the absorption test of the ordinary brick and mortar specimen, values of 200 l/m3 of difference were obtained between the dried specimen, after being taken out of the oven, and the saturated specimen. Once the sample was taken out of the oven for 2 weeks in the laboratory environment, similar to the interior of the house where the test was conducted, the test tube had absorbed 4 l/m3.
If the formulas of EN ISO 10456 [20] are applied for the conversion of thermal values from one set of conditions to another set of conditions, with different water content, by the formula (3) λ 2 = λ 1   e f Ψ x ( Ψ 2 Ψ 1 ) based on the thermal conductivity values of the dry state materials obtained in the tests with those obtained using the coefficients of the standard, the following thermal conductivity values are obtained for saturated materials: for the pressed brick specimen λ241 l/m3 = 7.23 W/(m.K), while for the ordinary brick specimen λ243 l/m3 = 7.61 W/(m.K), and for the mortar λ231 l/m3 = 1.61 W/(m.K). It can be seen that in a saturated state, the values markedly differ from those obtained in the tests.
In order to analyze more graphically what this increase in the value of thermal conductivity means, the thickness of a leaf of insulating material that would be necessary to be attached to the facade, on the inside, has been calculated to avoid losses due to the dampening of the facade, for an insulator whose characteristics are listed in Table 2.
The result of the calculations has been transferred to Figure 4, where the water content of the facade has been represented on the ordinate axis, the value of the thermal conductance of the facade enclosure studied is on the primary abscissa axis, and thickness of the insulating leaf necessary to maintain thermal insulation when the facade is wetted is on the secondary abscissa axis. To analyze this result, it should be taken into account that the thermal conductance of this facade is the same as a leaf of 17-mm insulating material.

3.2. Thermal Flow Test

Figure 5 shows the data obtained after the “in situ” measurements of the facade. The thermal flux values measured by the plates: exterior and interior, interior and exterior surface temperatures, and interior and exterior temperatures. You can check the thermal wave offset between the external and internal flow characteristic of the enclosures with great thermal inertia. You can also see a minimum incidence of the sun on the facade at surface temperatures in the early hours of the day, (around 8:30 a.m.) when it is observed that the surface temperature increases slightly, maintaining the air temperature. This effect is of very little incidence in the thermal behavior of the enclosure, since it is a phenomenon of few minutes duration.
Obtaining this data, allows us to know the real thermal behavior of the wall, if the wall accumulates thermal energy, and how it transmits it well inside or outside.
It also allows to evaluate the thermal demand due to the heat transmission through the external enclosures, data that are necessary to know for energy rehabilitation actions. With the values of the thermal flow of the plates located inside and outside, and the interior and exterior surface temperatures, applying the formula (5), the value of the thermal conductance of the facade can be estimated, as can be verified in the graph in Figure 6.
For the simulations, this value of U has been used. The facade is formed by two leaves and the interior, as already indicated above, according to the CTE it would not be dampened with rainwater but with ambient humidity, which it has been calculated at 4 L/m3, so the value of the thermal conductivity of this leaf would be calculated with the formula (4) using the values of the tests performed on the materials of Figure 3. Once the conductance value of The facade has estimated the value of the conductivity of the outer leaf of pressed brick of 0.74 W/(m.K) and according to the results of the tests on the materials represented in Figure 2, the water content of this leaf is 15 L/m3.

3.3. Simulations

For the simulations of the facades in the wet state, the thermal conductivity values that have resulted from the tests carried out in the present investigation have been used, according to the linear trend lines of Figure 3:

3.3.1. Simulations of the Behavior of the Facade in the Conditions of the Test “in situ”

The first simulation was carried out to verify if for the same conditions the results offered by the program are similar to those of the in situ test. To perform this simulation, it has been assumed that the water content of the wall is different in the pressed brick outer leaf. The outer leaf contains about 15 L/m3 with a thermal conductivity λ = 0.74 W/(m.K), and the inner leaf is dry with some humidity due to the absorption of about 4 L/m3 from the environment with a thermal conductivity λ = 0.66 W/(m.K). Figure 7 shows the simulation values.

3.3.2. Simulations of Facade Behavior in Other Humidity Conditions

Once the simulation has been validated by comparison with the results of the “in situ” test, other simulations have been carried out to analyze the thermal flow step when the facade is moistened with rainwater or with water rising from the ground. The comparative results of flow during the test and the flow in the two described situations of humidity by rainwater and humidity rising damp, have been transferred to Figure 8.
There is a difference in the flow between the simulation of the state of the facade when the test is performed and the simulation with the facade moistened by rainwater in the upper area. In the graph below, you can see the difference between the simulation of the in situ test and the simulation of the saturated facade due to the water that rises by capillarity.
As you can see, the flow through the facade is greater the more humid the facade, for the conditions of temperatures of the test in situ and during the test
In the case of the water-saturated facade, the increase is 75%, from 1430 to 2593 W/m2; in the case of rainwater, the increase is approximately 10%, going to 1579 W/m2.
The result of other simulations with the facade with different water content that allows to evaluate the difference in thermal flux, thermal conductivity, and the thickness of a leaf of insulating material that would be placed from the inside of facade to keep the thermal facade values dry, are represented in Figure 9.
This graphic would be valid for buildings that had similar facades, under climatic conditions and internal temperature of the in situ test. As you can see in the graph, the heat flux that crosses the facade is almost double in humid conditions than in dry conditions, and the thickness of the leaf of insulating material would be 18 mm in order to equalize the greater heat loss due to the content of water from the facade.

4. Discussion

From the tests carried out on the materials, it can be verified that the coefficient of conductivity λ of the materials is higher in the wet state than in the dry state [32]. However, the results differ from those that could be obtained from the procedure of EN ISO 10456 [20], because the design moisture values coefficient % by volume are lower than the Standard EN 1745 [21,33].
In this case, for saturated bricks, the values are calculated much higher than those given by the test, while for mortar, the value resulting from the calculation with the standard is slightly lower than that of the test. In the results of the thermal conductivity tests, the two types of brick and mortar have similar dry and wet values; the values of apparent density and porosity are similar for both bricks, although for the mortar the density has a lower value and for the porosity has a higher value. The water absorption is also very similar for the two types of brick while the mortar absorbs a smaller amount of water than the bricks, although the porosity is higher, indicating that there is an important number of pores that are accessible for the water. The value of the average pore diameter is very different for the 0.44 pressed brick and for the 5.64 extruded brick, which seems to indicate that the density and porosity may be related to the thermal conductivity values, while the average pore diameter is not.
If the graph of the thermal flow test is analyzed in situ, it is observed that while the air and surface temperatures drop and rise gradually. Almost at the same time, the flow presents a lag with respect to the outside temperature. This phenomenon is due to the great thermal inertia of the facade factor that is important in historical buildings and is not usually taken into account in the calculations that are based on the thermal conductivity of the materials. Nor is the water content of the facades usually considered since the reference thermal conductivity values are in the dry state. Both in the flow test and in the tests carried out on the materials, it has been possible to verify the importance of these two factors to correctly evaluate the thermal behavior of the old, thick and massive walls, without air chambers.
If the simulations are analyzed, it can be verified that the higher the water content of this type of facade, the greater the value of the thermal flux that crosses them.
The tests established for buildings with modern facade systems are not useful for cultural heritage buildings. Without destructive tests, by means of the measurement of the thermal flow with plates of flow, one can have information to make simulations that allow to evaluate this thermal behavior.

5. Conclusions

This study concludes that the thermal conductance of the walls of facades composed of porous materials, such as brick, varies with the water content. The higher the water content, the greater the value of the thermal conductance. In the case of brick walls similar to the ones studied, the thermal conductance can be two to three times higher in a saturated wall than in a dry wall [29], because the water content they can absorb is high.
Estimates of energy loss through facade enclosures are made assuming materials are dry. This fact can lead to important mistakes when estimating energy consumption during interventions in buildings with enclosures similar to those studied in this work [5].
In relation to the suitability of the thermal flow test to know the moisture content of a masonry wall, it has been verified with the tests carried out that it is possible to estimate the water content of an enclosure. This can only be done if tests are carried out on test specimens of the constituent materials of the wall. This is very relevant information when you are going to intervene in a cultural heritage building. In the flow test performed, the results are similar if the flow plate is placed outside or inside.
Finally, it is important to highlight the value of the simulations, by offering with its application wide possibilities to energetically analyze the buildings with facades of important thicknesses and constituted by porous materials, before proposing an intervention. With these simulations the thermal inertia can be contemplated and the variation of the coefficients of thermal conductivity due to the water content of the materials.

Author Contributions

All authors have been involved in the preparation of the manuscript. All authors have read and agreed to the published version of the manuscript.

Funding

This research was funded by the Ministry of Economy and Competitiveness of the Spanish Government for the realization of the project “Proposal for evaluation of moisture that rises by capillarity in the brick walls heritage through non-destructive tests” BIA2015- 684449.

Acknowledgments

to Eduardo Torroja Institute of Construction Sciences of the Higher Council for Scientific Research (CSIC-IETcc) (Spain) for the tests carried out at said Institute whose results are incorporated into this article.

Conflicts of Interest

The authors declare no conflict of interest.

References

  1. Directiva 2012/27/UE del Parlamento Europeo y del Consejo de 25 de octubre de 2012 relativa a la eficiencia energética, por la que se modifican las Directivas 2009/125/CE y 2010/30/UE, y por la que se derogan las Directivas 2004/8/CE y 2006/32/CE. Available online: https://eur-lex.europa.eu/legal-content/ES/TXT/PDF/?uri=CELEX:02012L0027-20180709&from=EN (accessed on 24 November 2019).
  2. Calzolari, M. Prestazione Energetica delle Architetture Storiche: Sfide e Soluzioni; FrancoAngeli: Milan, Italy, 2016. [Google Scholar]
  3. Belpoliti, V.; Bizzarri, G.; Boarin, P.; Calzolari, M.; Davoli, P. A parametric method to assess the energy performance of historical urban settlements. Evaluation of the current energy performance and simulation of retrofit strategies for an Italian case study. J. Cult. Herit. 2018, 30, 155–167. [Google Scholar] [CrossRef]
  4. Litti, G.; Khoshdel, S.; Audenaert, A.; Braet, J. Hygrothermal performance evaluation of traditional brick masonry in historic buildings. Energy Build. 2015, 105, 393–411. [Google Scholar] [CrossRef]
  5. Yu, S.; Cui, Y.; Shao, Y.; Han, F. Simulation Research on the Effect of Coupled Heat and Moisture Transfer on the Energy Consumption and Indoor Environment of Public Buildings. Energies 2019, 12, 141. [Google Scholar] [CrossRef] [Green Version]
  6. Pavlík, Z.; Fiala, L.; Vejmelková, E.; Černý, R. Application of effective media theory for determination of thermal properties of hollow bricks as a function of moisture content. Int. J. Thermophys. 2013, 34, 894–908. [Google Scholar] [CrossRef]
  7. Degiovanni, A.; Moyne, C. Conductivité thermique de matériaux poreux humides: Évaluation théorique et possibilité de mesure. Int. J. Heat Mass Transf. 1987, 30, 2225–2245. [Google Scholar] [CrossRef]
  8. Azizi, S.; Moyne, C.; Degiovanni, A. Approche expérimentale et théorique de la conductivité thermique des milieux poreux humides—I. Expérimentation. Int. J. Heat Mass Transf. 1988, 31, 2305–2317. [Google Scholar] [CrossRef]
  9. Bal, H.; Jannot, Y.; Gaye, S.; Demeurie, F. Measurement and modelisation of the thermal conductivity of a wet composite porous medium: Laterite based bricks with millet waste additive. Constr. Build. Mater. 2013, 41, 586–593. [Google Scholar] [CrossRef]
  10. Vololonirina, O.; Coutand, M.; Perrin, B. Characterization of hygrothermal properties of wood-based products–Impact of moisture content and temperature. Constr. Build. Mater. 2014, 63, 223–233. [Google Scholar] [CrossRef] [Green Version]
  11. Camino-Olea, M.S.; Cabeza-Prieto, A.; Llorente-Alvarez, A.; Sáez-Pérez, M.P.; Rodríguez-Esteban, M.A. Brick Walls of Buildings of the Historical Heritage. Comparative Analysis of the Thermal Conductivity in Dry and Saturated State. IOP Conf. Ser. Mater. Sci. Eng. 2019, 471, 082059. [Google Scholar] [CrossRef]
  12. Pérez-Bella, J.M.; Dominguez-Hernandez, J.; Cano-Suñén, E.; del Coz-Diaz, J.J.; Rabanal, F.P.Á. A correction factor to approximate the design thermal conductivity of building materials. Appl. Span. Facades. Energy Build. 2015, 88, 153–164. [Google Scholar] [CrossRef]
  13. Rodriguez-Esteban, M.A. La Arquitectura de Ladrillo y su Construcción en la Ciudad de Zamora (1888–1931). Ph.D. Thesis, Universidad de Valladolid, Valladolid, Spain, 2012. [Google Scholar]
  14. Ten, J.G.; Orts, M.J.; Saburit, A.; Silva, G. Thermal conductivity of traditional ceramics. Part I: Influence of bulk density and firing temperature. Ceram. Int. 1951, 1959. [Google Scholar]
  15. Rodríguez-Esteban, M.A. La Arquitectura de Ladrillo y su Construcción en la Ciudad de Zamora (1888–1931); Instituto de Estudios Zamoranos Floríán de Ocampo: Zamora, Spain, 2014; p. 179. [Google Scholar]
  16. Rodríguez-Esteban, M.A.; Camino-Olea, M.S.; Sáez-Pérez, M.P. El ladrillo en la arquitectura ecléctica y modernista de la ciudad de Zamora: Análisis de los tipos, los aparejos y la ejecución de los muros. Informes de la Construcción 2014, 66, e035. Available online: http://informesdelaconstruccion.revistas.csic.es/index.php/informesdelaconstruccion/article/view/3488/3926 (accessed on 15 January 2020).
  17. European Standard EN 772-21 Methods of test for masonry units. Part 21: Determination of water absorption of clay and calcium silicate masonry units by cold water absorption. 2011; AENOR. [Google Scholar]
  18. Dondi, M.; Mazzanti, F.; Principi, P.; Raimondo, M.; Zanarini, G. Thermal conductivity of clay bricks. J. Mater. Civ. Eng. 2004, 16, 8–14. [Google Scholar] [CrossRef] [Green Version]
  19. ASTM D4404-18. Standard Test Method for Determination of Pore Volume and Pore Volume Distribution of Soil and Rock by Mercury Intrusion Porosimetry; ASTM International: West Conshohocken, PA, USA, 2018. [Google Scholar]
  20. European Standard EN ISO 10456. Building Materials and Products—Hygrothermal Properties—Tab-Ulated Design Values and Procedures for Determining Declared and DesignThermal Values. 2012. [Google Scholar]
  21. European Standard EN 1745 Masonry and masonry products-Methods for determining thermal properties. 2013; AENOR.
  22. Lucchi, E. Thermal transmittance of historical brick masonries: A comparison among standard data, analytical calculation procedures, and in situ heat flow meter measurements. Energy Build. 2017, 134, 171–184. [Google Scholar] [CrossRef]
  23. Lucchi, E. Thermal transmittance of historical stone masonries: A comparison among standard, calculated and measured data. Energy Build. 2017, 151, 393–405. [Google Scholar] [CrossRef]
  24. Baker, P. U-Values and Traditional Buildings; Historic Scotland Conservation Group: Glasgow, UK, 2011. [Google Scholar]
  25. International Standard ISO 9869-1. Thermal Insulation—Building Elements –In-Situ Measurement of Thermal Resistance and Thermal Transmittance. Part 1. Heat Flow Meter Method. 2014. [Google Scholar]
  26. Choi, D.S.; Ko, M.J. Analysis of Convergence Characteristics of Average Method Regulated by ISO 9869-1 for Evaluating In Situ Thermal Resistance and Thermal Transmittance of Opaque Exterior Walls. Energies 2019, 12, 1989. [Google Scholar] [CrossRef] [Green Version]
  27. Choi, D.S.; Ko, M.J. Comparison of various analysis methods based on heat flowmeters and infrared thermography measurements for the evaluation of the in situ thermal transmittance of opaque exterior walls. Energies 2017, 10, 1019. [Google Scholar] [CrossRef] [Green Version]
  28. Nardi, I.; Lucchi, E.; de Rubeis, T.; Ambrosini, D. Quantification of heat energy losses through the building envelope: A state-of-the-art analysis with critical and comprehensive review on infrared thermography. Build. Environ. 2018, 146, 190–205. [Google Scholar] [CrossRef] [Green Version]
  29. Rotilio, M.; Cucchiella, F.; De Berardinis, P.; Stornelli, V. Thermal transmittance measurements of the historical masonries: Some case studies. Energies 2018, 11, 2987. [Google Scholar] [CrossRef] [Green Version]
  30. EnergyPlus. U.S. Department of Energy (DOE). Available online: https://energyplus.net/ (accessed on 28 March 2016).
  31. CTE DB-HS1. Technical Building Code Basic Document-Basic Requirements Energy Saving; Ministry of Development: Madrid, Spain, 2013; Available online: http://www.codigotecnico.org/index.php/menu-ahorro-energia (accessed on 15 October 2019).
  32. Dell’Isola, M.; d’Ambrosio, F.R.; Giovinco, G.E.; Ianniello, E. Experimental analysis of thermal conductivity for building materials depending on moisture content. Int. J. Thermophys. 2013, 33, 1674–1685. [Google Scholar] [CrossRef]
  33. Campanale, M.; Moro, L. Thermal conductivity of moist autoclaved aerated concrete: Experimental comparison between heat flow method (HFM) and transient plane source technique (TPS). Transp. Porous Media 2016, 113, 345–355. [Google Scholar] [CrossRef]
Figure 1. (a) Placement of the thermal flow plate and probes on the exterior face of the facade; (b) Thermographic image of the facade.
Energies 13 01307 g001
Figure 2. (a) Thermal flow plate placed inside; (b) thermal flow plate placed outside; (c) thermocouple; (d) data logger.
Energies 13 01307 g002
Figure 3. Thermal conductivity as function of water content of specimens.
Energies 13 01307 g003
Figure 4. thermal conductance as a function of water content and leaf thickness of insulating material.
Energies 13 01307 g004
Figure 5. Results of the thermal flow test of the in situ facade.
Energies 13 01307 g005
Figure 6. Thermal conductance W/m2. K filed from the on-site test data with the formula (5).
Energies 13 01307 g006
Figure 7. Simulated test results with the contour conditions of the in situ test.
Energies 13 01307 g007
Figure 8. Top graph comparison between the thermal flow of the in situ test and the simulation in which the outer leaf is saturated with water. In the graphic above, the same type of comparison is made but in that case the wall is saturated with the water that ascends by capillary from the ground.
Energies 13 01307 g008
Figure 9. Comparative graph between the water content and the thickness of a leaf of insulating material to match the flow of a dry wall.
Energies 13 01307 g009
Table 1. Material test values.
MaterialDimensionsmmApparent Density kg/m3Porosity %Average Pore Diameter (μm)Water Absorption m3/m3
pressed brick 127 × 97 × 37 1885 24.05 0.44 0.241
ordinary Brick113 × 84 × 30187724.325.640.243
mortar158 × 89 × 40182528.041.040.231
Table 2. Characteristics of the insulating material used.
MaterialSteam Resistivity (MNs/g)Density kg/m3Specific Heat (J/kgK)Termal Conductivity (W/mK)Thermal Resistance (mk/W)
XPS-CO2 Blowing6003514000.03424.41

