Economic Assessment of Cogeneration Systems in Operation
by

Aikaterini Papadimitriou
1,2,*, 
Vassilios Vassiliou
2,
Kalliopi Tataraki
1,
Eugenia Giannini
1 and
Zacharias Maroulis
1 1
Laboratory of Process Analysis and Design, National Technical University of Athens, 15780 Athens, Greece
2
Attiki Natural Gas Distribution Company SA, 14123 Likovrisi, Greece
*
Author to whom correspondence should be addressed.
Energies 2020, 13(9), 2206; https://0-doi-org.brum.beds.ac.uk/10.3390/en13092206
Submission received: 29 March 2020
/
Revised: 27 April 2020
/
Accepted: 29 April 2020
/
Published: 2 May 2020
(This article belongs to the Special Issue Cogeneration Economics)
Abstract
:A systematic method to evaluate the economic operating performance of existing combined heat and power (CHP) or combined cooling heat and power (CCHP) generation systems is applied. Two key performance indicators are selected to evaluate both the technical and the economic performance, based on operating recording data; the capacity factor and the capital recovery. The case study for eight projects in Athens is presented with the purpose to reveal the current situation of CHP in Greece and identify reasons that are hindering its penetration. Interesting conclusions were reached from the analysis. Only two out of the eight projects managed to achieve the break-even point in less than four years since the beginning of their operation, while oversizing phenomena were noticed in many cases leading in extremely low capacity factors.
1. Introduction
As energy demand is growing along with the concerns for climate change, the need to turn towards more sustainable and environmentally friendly energy systems is imperative. Combined heat and power (CHP) is an energy production system that, through the simultaneous production of electricity and thermal energy from the same initial energy and within the same process [1], can increase the overall efficiency of the system from 30–45% to 80–85% [2]. When combined with a heat-driven absorption chiller, a CHP system can additionally produce useful cooling. The process in this case is called “trigeneration” or combined cooling heat and power (CCHP). Compared to the conventional production of energy, these systems offer plenty of advantages in terms of primary energy savings and consequently, economic and greenhouse gas (GHG) emissions savings.
The actual performance of a CHP system differs from the designed performance due to technical and economic reasons. Technical reasons refer to load changes in regard to the design assumptions and economic reasons refer to energy prices (fuel and electricity) volatility, a critical issue for cogeneration owners, which varies from country to country, especially the latter, which encloses high risk and greatly affects the decision-making process regarding both the investment and the operation of a CHP/CCHP unit. The effect of energy prices variation on the economic efficiency and the relation between the electricity and natural gas price have been examined by various authors, in the effort to develop a method that can indicate the conditions under which investing and/or operating a CHP unit is economically viable [3,4,5,6]. Some of them propose the difference between the electricity and fuel price as the appropriate indicator [5], while others indicate their ratio as the proper one [6].
The analysis of cogeneration systems has been widely examined in the literature. With the use of novel computational tools and analytical techniques, the operation of a CHP unit can be simulated on a high level of accuracy and, on this subject, a plethora of studies exists [7,8,9,10,11]. However, the access to actual operational data is always a valuable tool that can provide useful information about the system’s performance and give insights regarding optimization options, while it may also reveal wrong hypotheses that many times are adopted during the design phase, in both technical and economic aspects. In this respect, Badami et al. [12] performed a techno-economic evaluation of 11 CHP power plants operating in Italy with different prime movers. The energetic and economic behavior was assessed with the primary energy savings (PES) indicator and the simple payback period (), respectively, and the indicators were calculated by using both the design data and the actual data after one year of effective plant operation. It was concluded that the calculated from actual operation data was considerably higher than the estimated during the design stage. Thus, performance levels can be more unpredictable when the systems operate in real buildings and under real operating conditions. Similarly, Li et al. [13] presented a case study of an operating cogeneration system installed in a university in China. They analyzed the energy use and indicated the inefficient use of the unit, since the calculated overall efficiency of the CHP system was lower than the designed one, and only slightly higher than 60%. Kuhn et al. [14] presented the results of several field tests conducted in different countries across Europe, in order to investigate the potential of micro-CHP technologies before their official launch in energy markets, highlighting the importance of assessment under real operating conditions, which can allow for further improvement of the systems and their penetration in the particular energy markets in which they are employed. Furthermore, Magnani et al. [15] analyzed the case study of a microCHP installed in a small industrial building in Italy and used the experimental data in order to emphasize the effect that seasonal variation and, particularly, the temperature changes have on the efficiency and gas consumption, and to compare design characteristics and real data. Finally, in a case study of a larger system with more extended dataset available, Paine et al. [16] used a six-year dataset from the operation of a CHP-led heating network collected by a local authority in the United Kingdom to evaluate the management of the system and its outputs. In an effort to simplify the assessment process, they indicated a simple method that uses and displays in graphs basic operational datasets, such as gas consumption and electricity import from the national grid, in order to provide insight into management strategies and system performances.
Cogeneration, regarded as a sustainable and environmentally friendly energy system, has been promoted by the European Union along with the use of renewable energy systems (RES) and CHP/CCHP systems, in order to achieve its environmental objectives and the security of the energy supply. In Greece, this promotion has been supported through the introduction of new legislation from 2006 and onwards, in which cogeneration systems were assimilated to RES and received investment incentives and higher electricity purchase prices, which were finalized by the target model in 2016. The penetration of cogeneration in the Greek energy system was also included in the long-term national energy planning of the National Energy Strategy Board in 2012, where one of the pillars for 2050 was the development of microCHP and trigeneration systems in the tertiary sector [17].
However, even though those reforms were successful in increasing the share of RES in the energy mix, with an explosive sigmoidal penetration of photovoltaics [18] and great stimulation of wind energy [18,19,20], CHP penetration in the Greek energy market remains very limited. Since its inception, it seems that the feed-in tariff (FiT) support mechanism has not succeeded to act as an incentive to increase the installed capacity, despite the generous tariffs that, in proportion to the gas price, eliminate the risk of fluctuating gas prices. In general, delayed capital recovery is what constitutes such an investment “unattractive”, and this is usually attributed to either incorrect initial system design, which leads to low capacity factors and fails to produce the predicted financial savings [21], or to energy price uncertainty. In some cases, poor management [22] can also cause negative effects. The key question for policy makers is what went wrong in the case of Greece and how the few existing projects evolved. This article aspires to provide the answer to this question.
This is achieved through a comprehensive and comparative presentation of eight CHP/CCHP projects that are currently in operation in Athens, the capital of Greece. Towards this direction, a simple and effective method is applied. Based on the recorded aggregated monthly values of fuel consumption by the gas distribution company [23], the evolution of energy prices in the country, and some assumptions such as operation at nominal load and mean values of investment cost, cogeneration electricity and thermal energy production are determined, and the systems’ design characteristics are investigated. The comparative evaluation of the lifetime performance of the eight CHP/CCHP projects is conducted by using two key performance indicators (KPIs); the capacity factor () of the unit and the capital recovery (), for the technical and economic assessment, respectively.
In that respect, the purpose of this paper is to reveal the current situation of CHP in Greece by analyzing from technical and economic point of view the performance of the existing cogeneration systems since their installation at a macro level. The novelty of the study is the lifetime evaluation of the projects, based on real operation data, through a method that requires only gas consumption data.
2. Data and Methods
2.1. Data Monitoring
Generally, in order to analyze a CHP system in operation, the following data should be recorded versus time:
- (1)
- E (MWh) the electricity production,
- (2)
- Q (MWh) the thermal energy recovered and used, and
- (3)
- G (MWh) the natural gas consumption.
In addition, the following economic data should also be recorded versus time:
- (1)
- Cg (€/MWh) the natural gas price
- (2)
- Ce (€/MWh) the electricity price
- (3)
- Cm (€/MWh) the maintenance cost
Electricity production data E and thermal energy data Q can either be measured from the monitoring system of the unit or they can both be calculated based on gas consumption data G and the system efficiencies:
where is the electrical efficiency, and is the thermal efficiency of the CHP system.
Gas consumption G is regularly recorded by the gas distribution company for charging purposes.
CHP efficiencies (, ) are known either from the machine providers data or from specific designed experiments using Equations (1) and (2). For ICE, the efficiencies usually remain constant for operation at nominal power, or they slightly change for operation at part load; the total efficiency however is expected to remain almost at the same level.
2.2. Key Performance Indicators
Key performance indicators (KPIs) are fundamental indices in assessing plants operation and can provide useful information about their actual performance compared to the design specifications. In this paper, two KPIs are selected, in order to evaluate (a) the technical and (b) the economic operating performance of a CHP system; (a) the capacity factor , and (b) the capital recovery , respectively.
The capacity factor of a CHP system during month j is defined as the ratio of its actual electricity produced (MWh) during month j to its potential production if it operated at full nominal power (MW) continuously all over month j, that is:
where (h) is the total calendar hours of month j, (MWh) is the natural gas consumption during month j, and is the electrical efficiency of the system.
Usually, a CHP system presents seasonal variation of depended on the thermal loads (space heating, cooling, water heating), and the twelve-month moving average eliminates any seasonal variation and reveals the long-term trend.
Moreover, the average during the total operating period (lifetime) of the system is calculated by the following equation:
where M is the total number of months in operation.
, when compared to the designed value , evaluates the technical performance of the CHP unit. is specified at the design stage according to system capacity. Technically, a well-designed system operates at a near 1 during some months of the year. Systematic operation at low values reveals an oversized system while values near 1 during the whole year may conceal an undersized system.
The capital recovery during the j month of operation is defined as the return on investment obtained during month j:
where (€/MWh) is the electricity price during month j, (€/MWh) the corresponding operating cost per electricity produced, and (M€/MW) the installed unit equipment cost. In Equation (5) the nominator calculates the process earnings (before interests, taxes, and depreciations), while the denominator represents the investment cost.
The operating cost per electricity produced (€/MWh) during month j, used in Equation (5), is calculated by the equation:
where (€/MWh) is the price of natural gas during month j, and (€/MWh) is the maintenance cost per electricity produced, which can be considered constant, independent of the month of operation. Similarly, the system efficiencies (electrical , thermal , and conventional boiler ) can also be considered constants, independent of the month of operation. In Equation (6) the first term represents the fuel cost for the production of one unit of electricity from the CHP system, the second term represents the avoided cost achieved from the production of the heat by the CHP, equivalent to one unit of electricity, and the third term represents the maintenance cost.
Moreover, the total capital recovery during the total operating period (lifetime) of the system is calculated by the following equation:
The is monitored versus time and expresses the economic assessment of the project.
When reaches 1, the project has reached the break-even point (), namely the point when the initial capital has been recovered. The designed Simple Payback Period () is the period considered, at the design stage, that would be required for to reach the . The constitutes the operating economic target of the project and in energy related projects is usually 4–5 years [24]. After the is reached, the actual is further compared with the . The is calculated with Equation (8) considering the total operating period of the system. Thus, compared to , the can appear lower if the system performed better during the period after the , or higher if it performed less effectively during that period.
where is the actual average Return on Investment calculated by the following equation:
where M is the total number of months of operation.
The actual could also be compared with the designed to validate the process design targets.
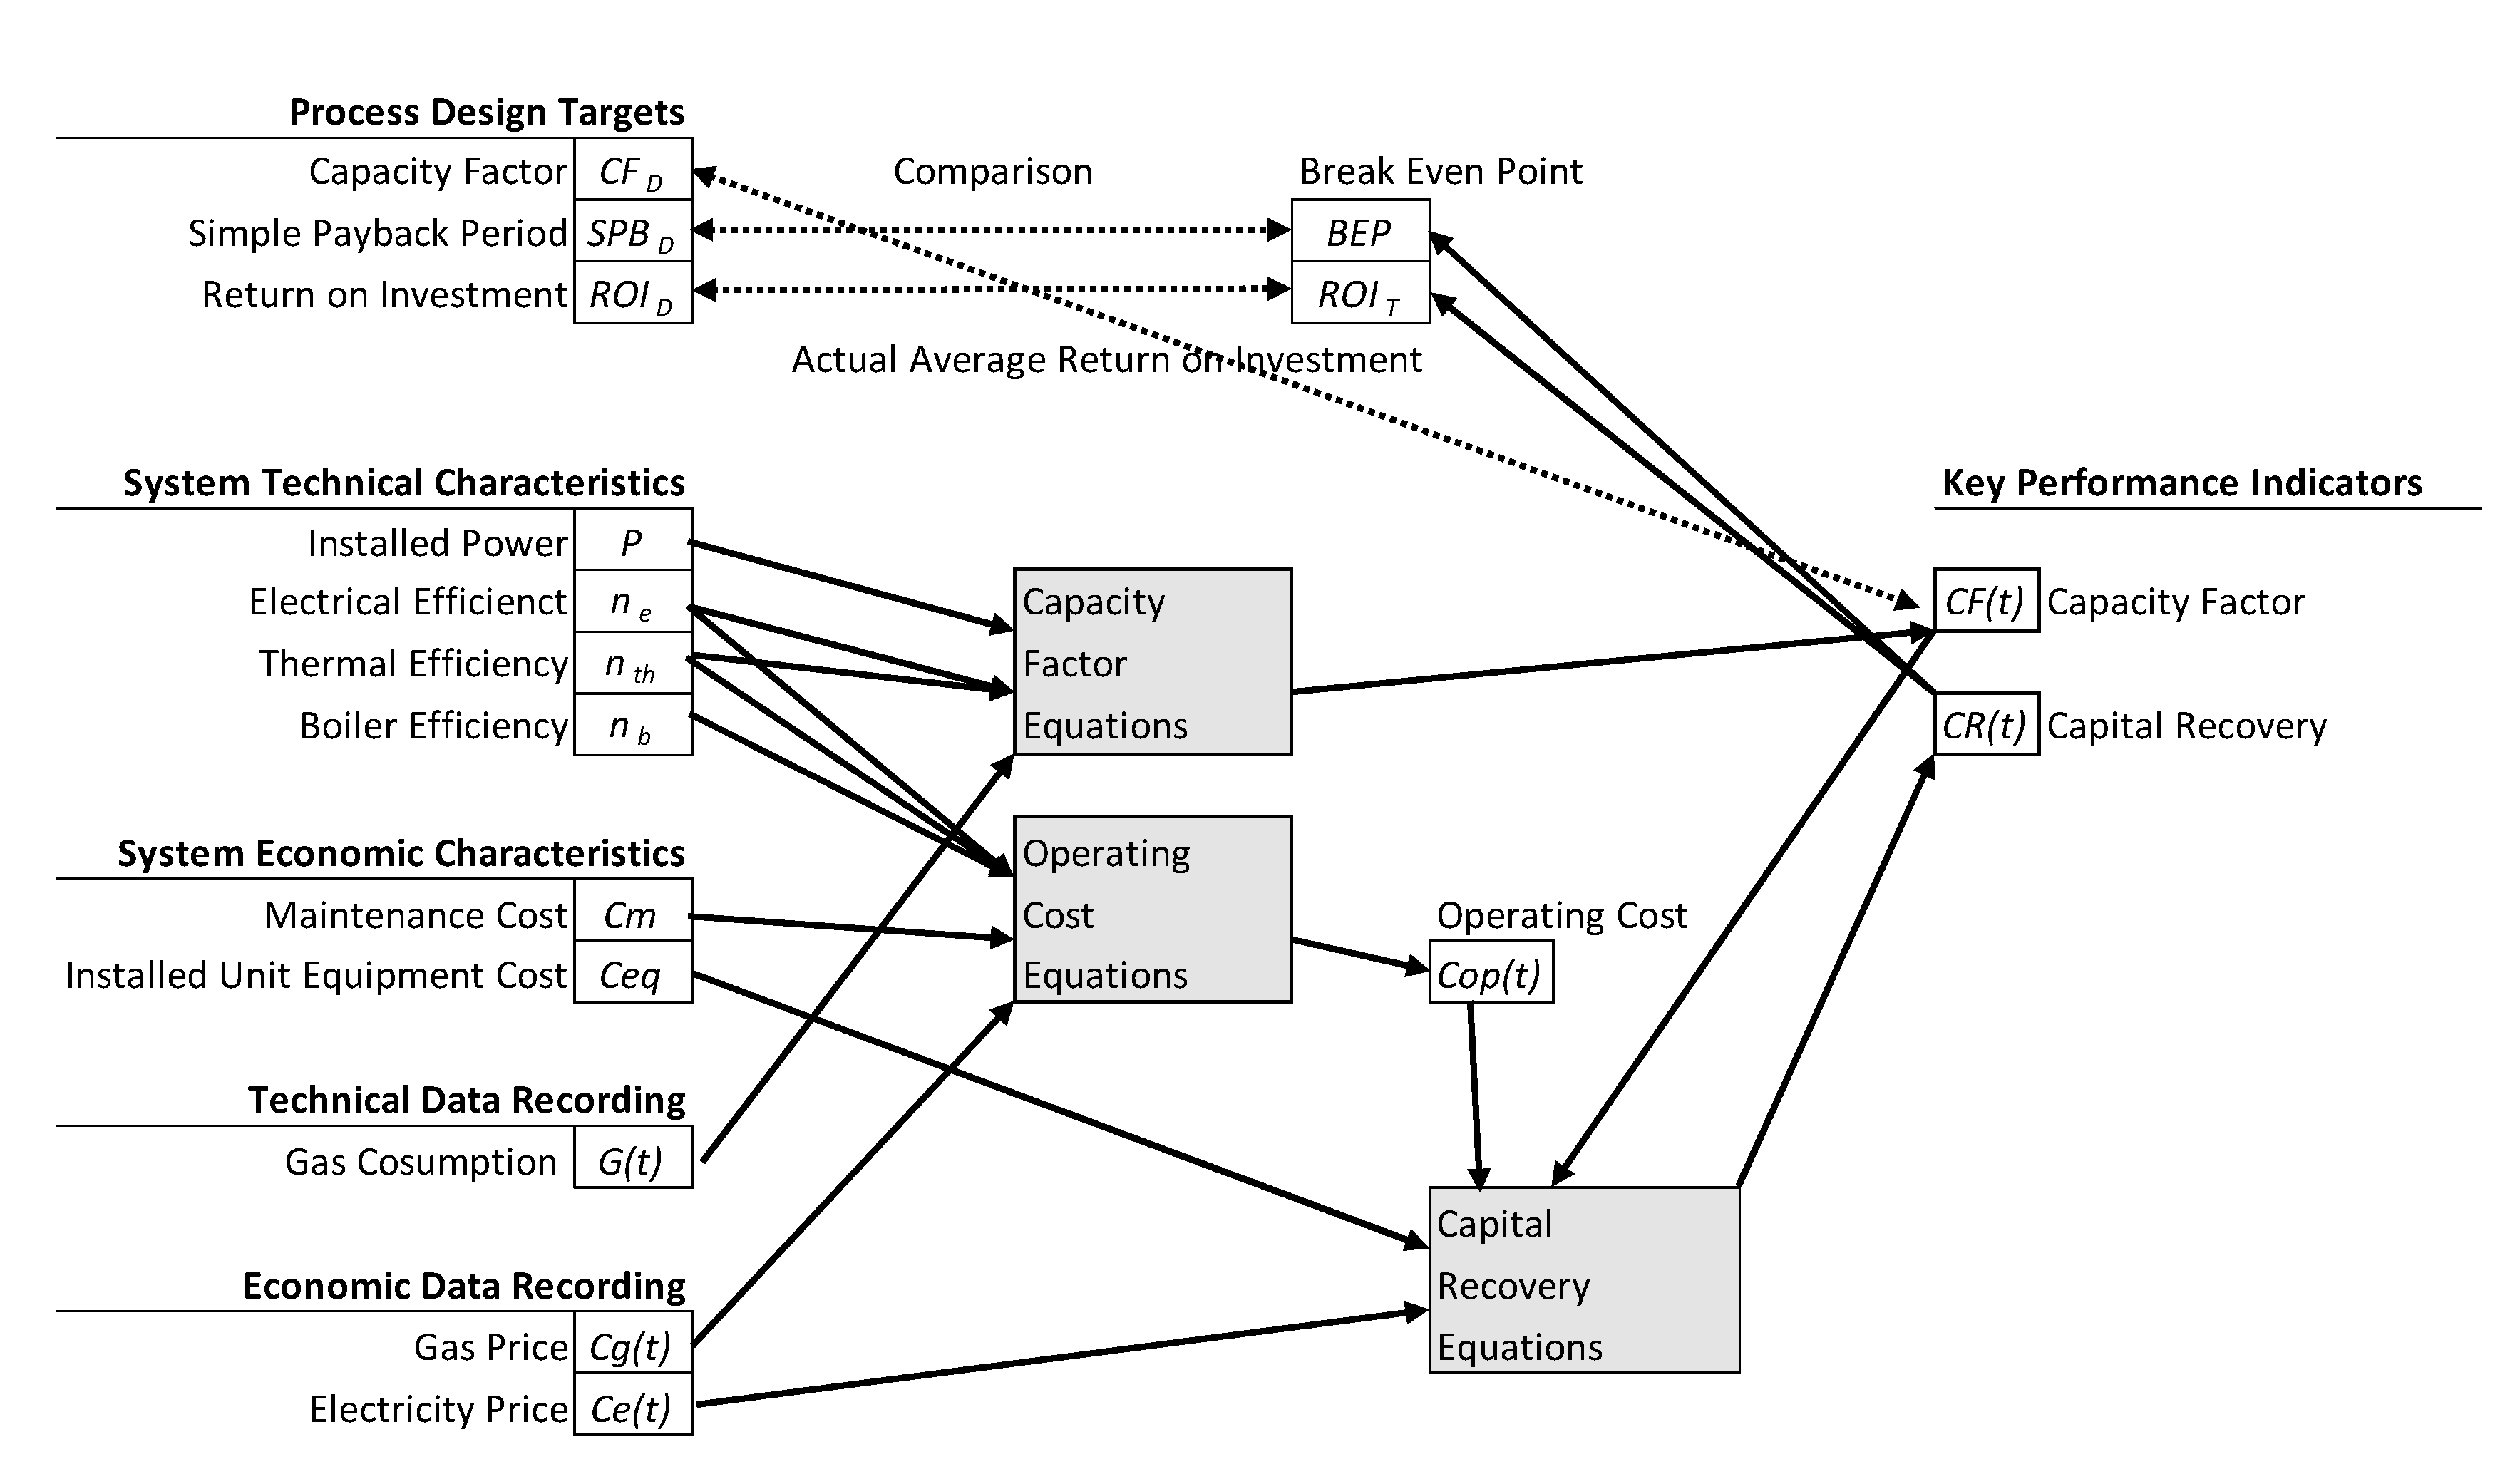
The above analysis is summarized in the information flow diagram of Figure 1.
2.3. Assumptions
As described in the flow diagram, the following analysis of the eight Athens projects relies on gas consumption data, as recorded by the gas distribution company [23], and on system design technical values. The rest of the operating data values and system economic characteristics are appointed or calculated based on the following assumptions because there is no publicly available data per project.
The efficiencies are considered constant and equal to the design values, which are based on the design specifications deriving from the manufacturer’s data for the specific models that have been installed, according to the studies submitted to the gas distribution company. It is assumed that the units operate at full load, and that all the recovered heat is useful to the building. The total machine operating time that is equivalent to nominal operation, (h) of the CHP system is used in the analysis. It refers to the actual operating lifetime and can be estimated by:
where is the lifetime gas consumption.
If the unit operated at partial load, it would be operating for longer time but at lower P so the overall energy production should not to be very different. However, since operation under real circumstances can be more unpredictable, a sensitivity analysis is presented in order to test the validity of the assumption and inspect the accuracy of the results.
Regarding the installed unit cost and the maintenance cost, indicative prices representative of the Greek market have been set. The prices derive from the typical parameter values for the development of CHP/CCHP facilities in Greece based on current national support scheme for RES and high efficiency CHP, and they are categorized according to the installed power [25]. Even though each project has a different cost according to its own characteristics, CHP prices in Greece have remained almost constant over the analysis period, as opposed to photovoltaic or wind prices, so for the comparative analysis purpose of this study the indicative prices were considered acceptable.
Electricity and natural gas prices are based on the evolution of energy prices in the region.
3. Results and Discussion
3.1. Energy Prices
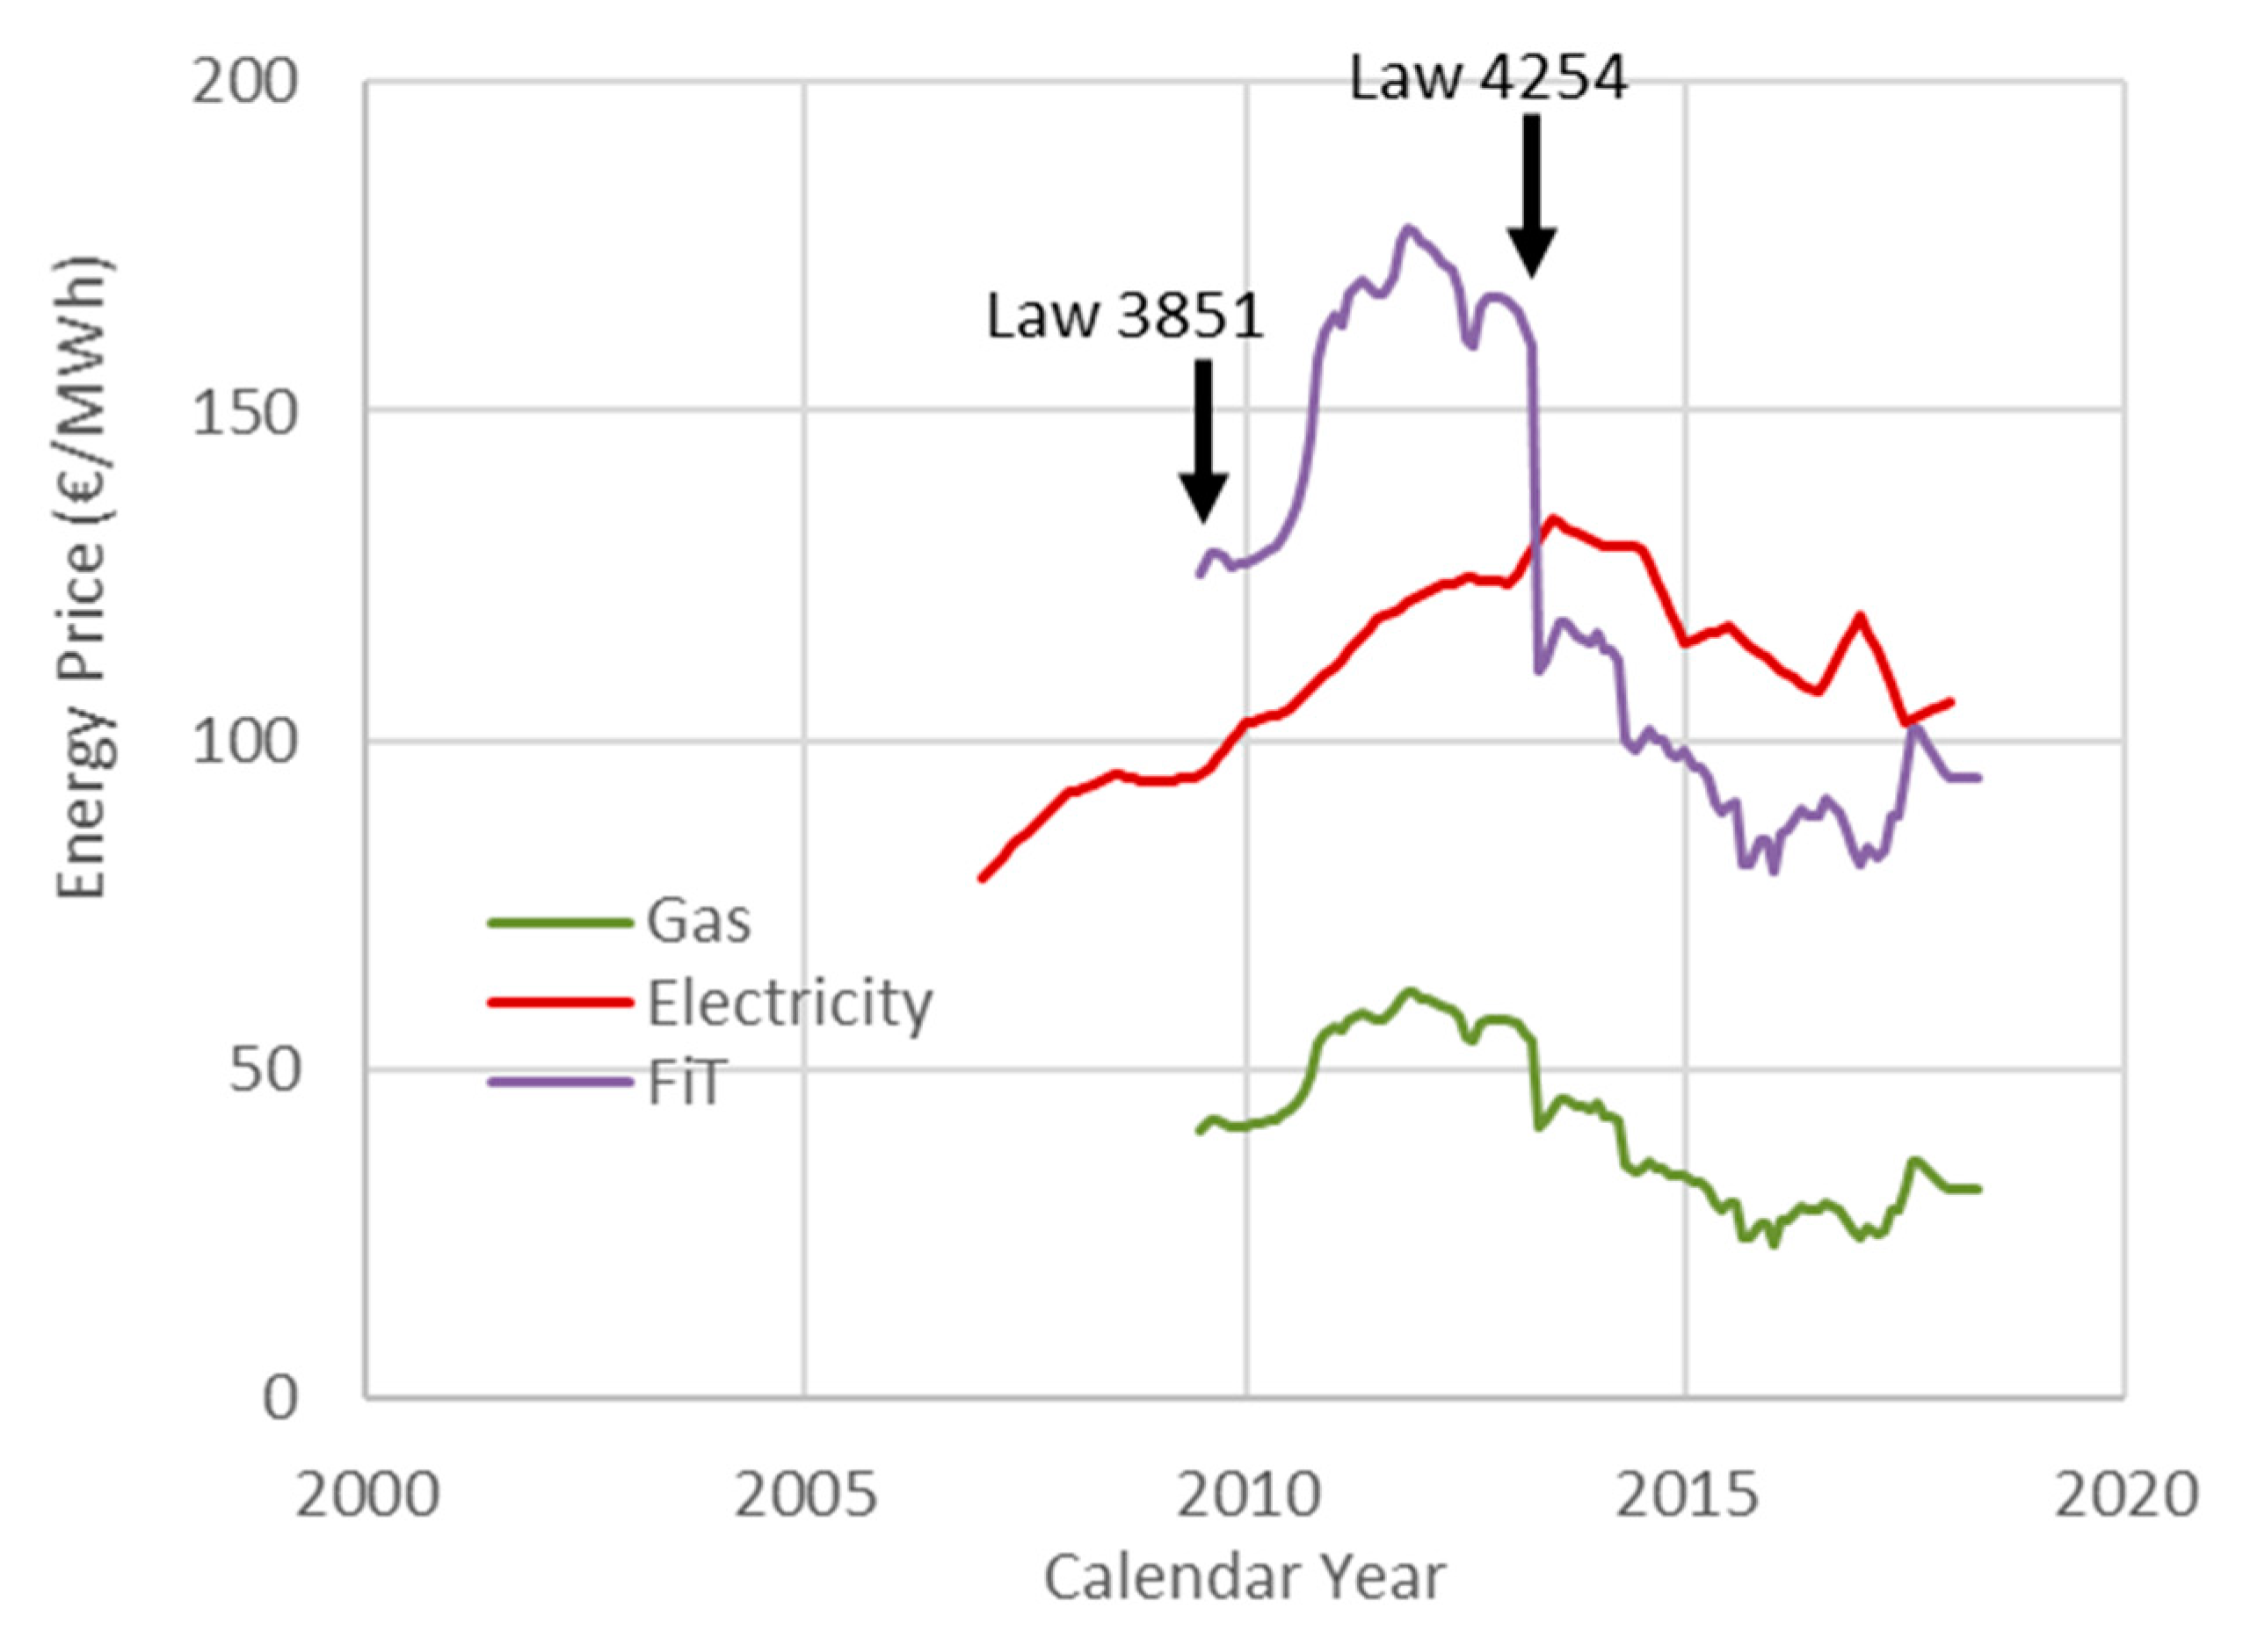
The economic environment that affects the performance of a CHP system is determined by the gas and electricity prices. Figure 2 reveals the evolution of gas and electricity prices in Greece for the recent 17 years, from 2002 to 2018. In the same figure, the feed-in tariffs (FiT) applied by the Greek authorities to support CHP are presented for comparison. Law 3851 (2010) introduced the concept of calculating the FiT as a function of the average gas price in order to eliminate the gas volatility risk. Law 4254 (2013) still follows the same principal but at lower final tariffs.
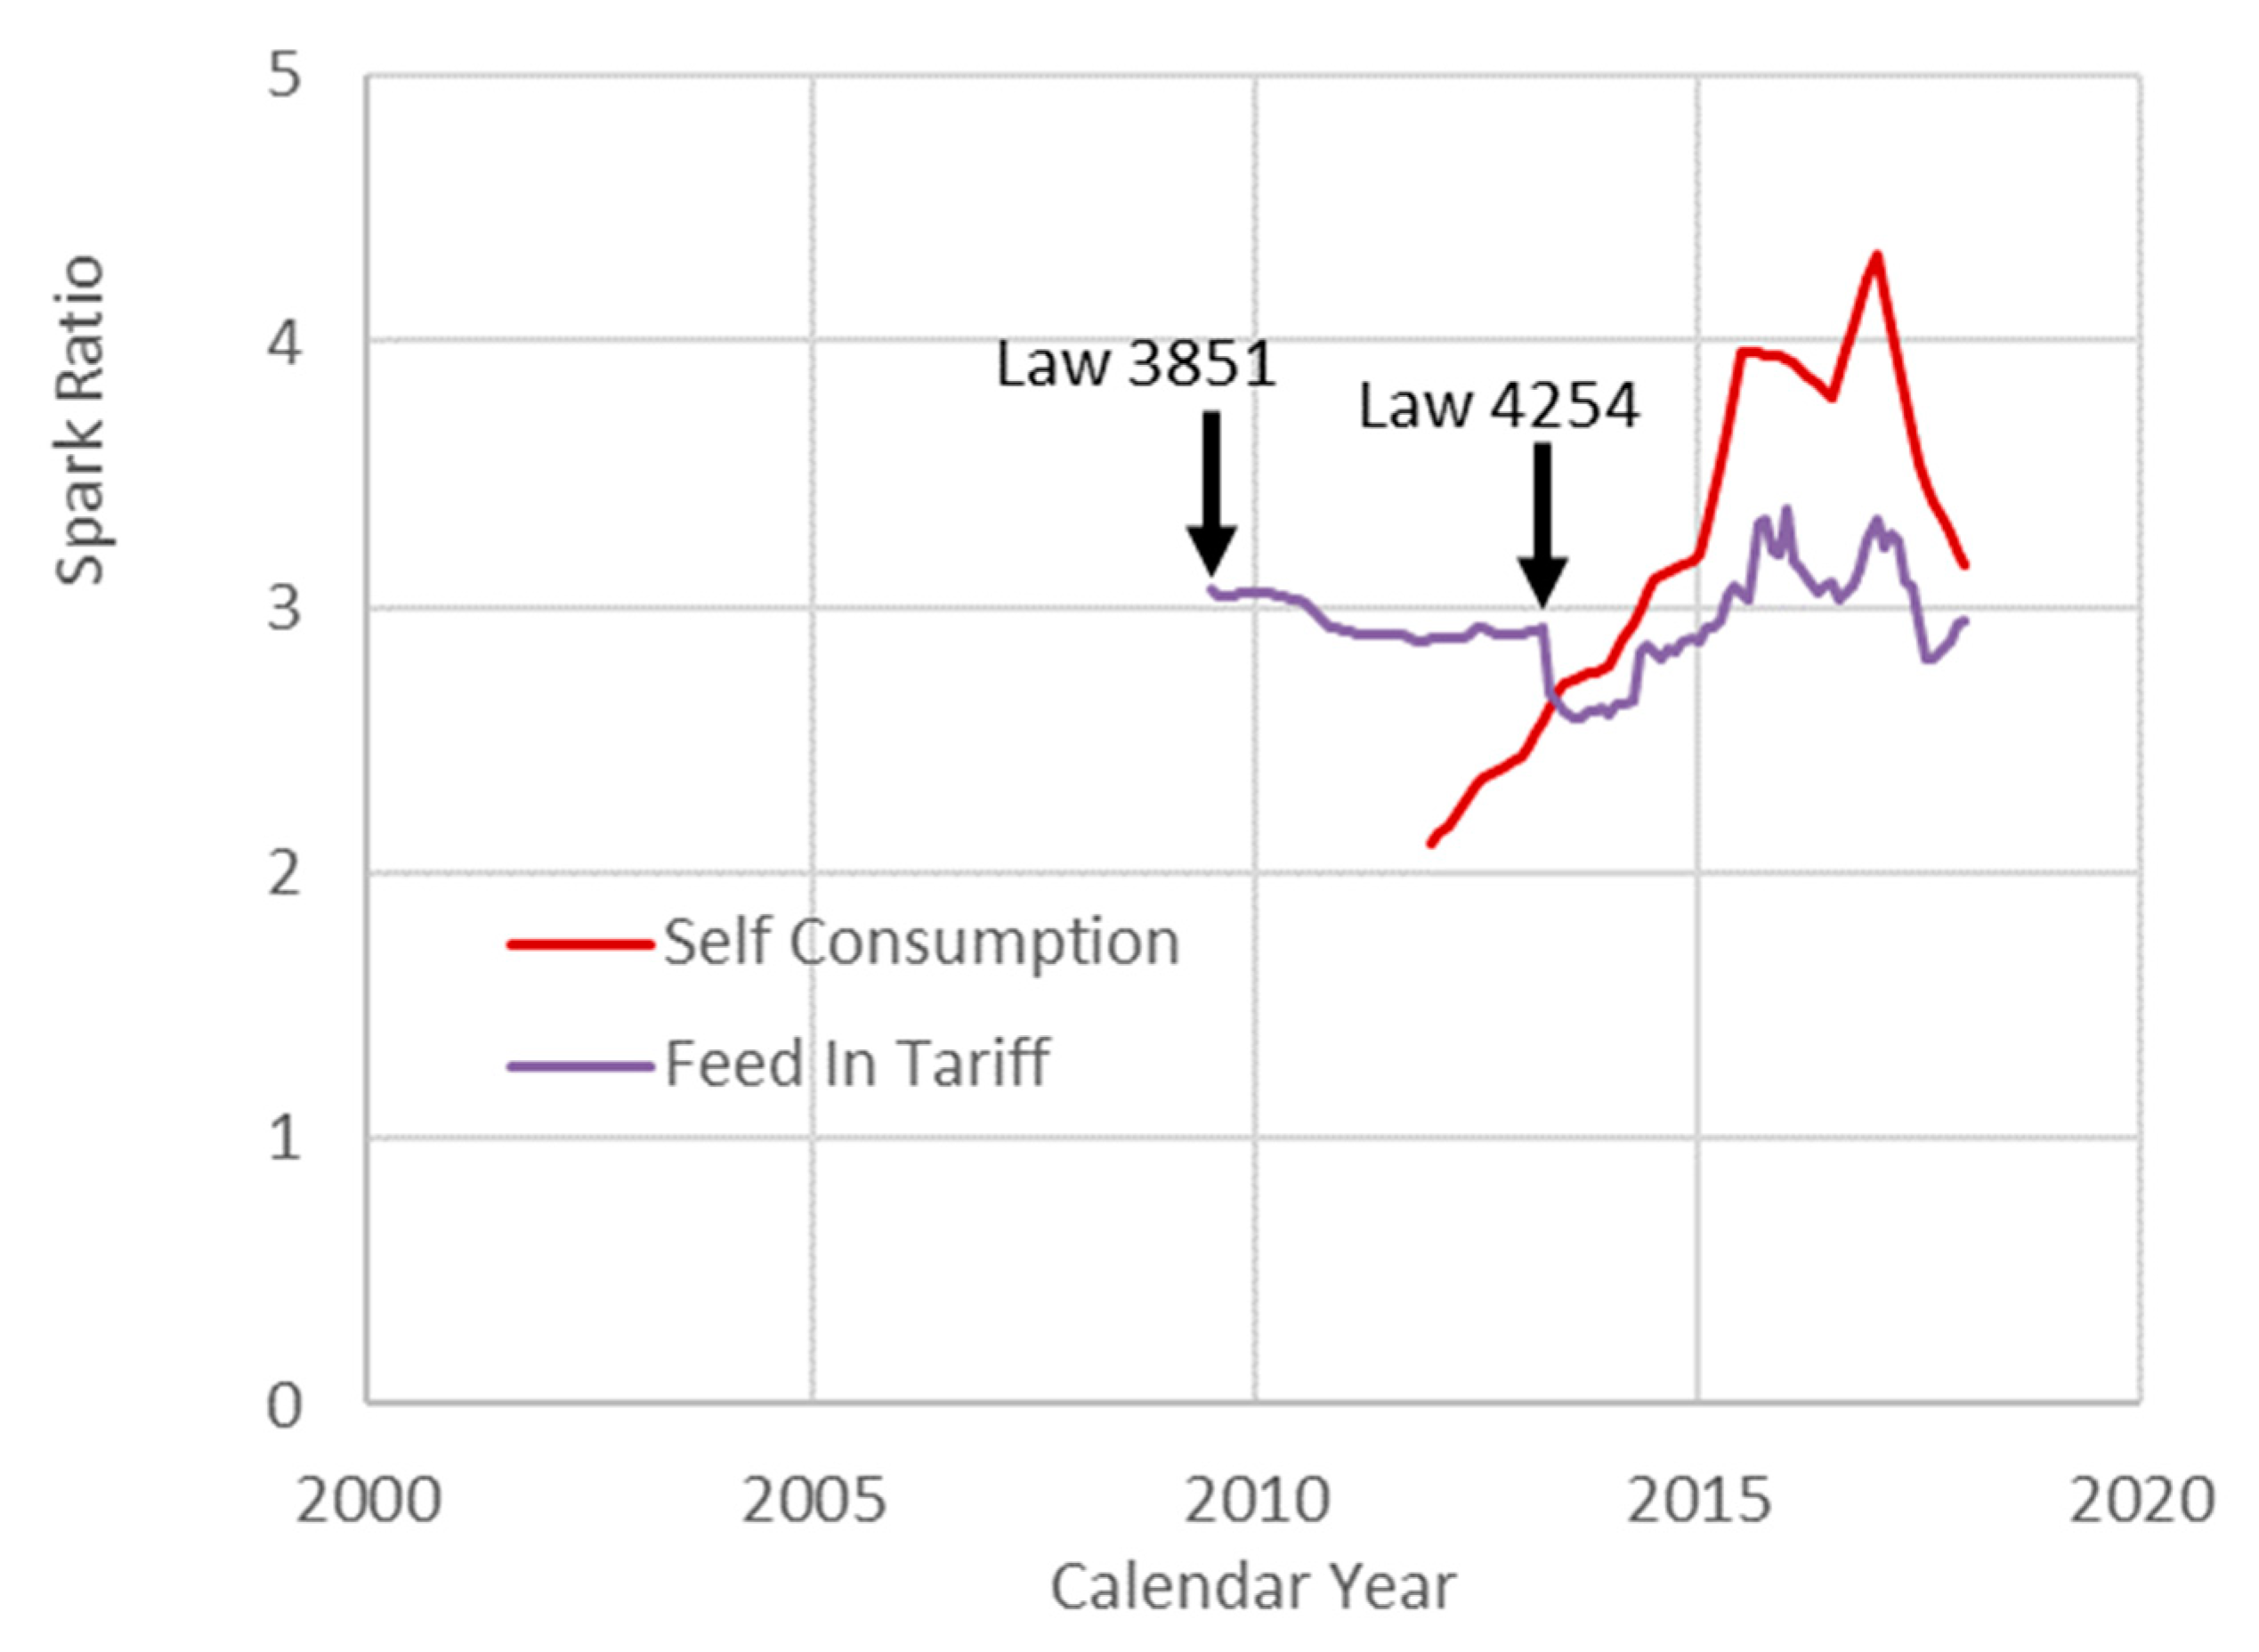
The corresponding spark ratio (the electricity price to gas price ratio) is calculated in Figure 3. According to a well-known rule of thumb, a spark ratio greater than 3 ensures project viability [26]. Obviously, the supporting policy is trying to keep the Spark Ratio about equal to 3 (Laws 3851 and 4254). On the other hand, self-consumption may offer opportunities for the years after 2015.
3.2. The Athens Projects Characteristics
In Athens, the capital city of Greece with more than 3 million inhabitants, only a few CHP projects have been realized during the last 20 years, since natural gas was introduced. More specifically, 10 projects are considered active today (December 2019), according to the gas distribution company files [23], eight of which are included in the study. All the systems are installed in buildings of tertiary sector, and they have internal combustion engines (ICE) as prime movers, fueled by natural gas.
The projects characteristics are summarized in Table 1, sorted by the oldest to the newest. The projects operating time varies from 17 years the oldest to three years the newest. Installed power varies from 0.13 MW to 2 MW. Table 1 also presents the installed unit cost (initial investment), the maintenance cost, along with the CHP and boiler efficiencies. CHP efficiencies are the values considered at design stage for each project. The rest of the data are average values, representative of the Greek market, categorized according to installed power [25]. In terms of building types, cogeneration units in Athens are all installed in buildings of the tertiary sector and mostly installed in hospitals, as this is one of the most appropriate uses of the system due to continuous loads during the day and throughout the year. Projects with code names H1, H2, and H3 are hospitals, O1 and O2 are office buildings, M is a mall, L is a hotel, and S is a school.
3.3. The Athens Projects Performance
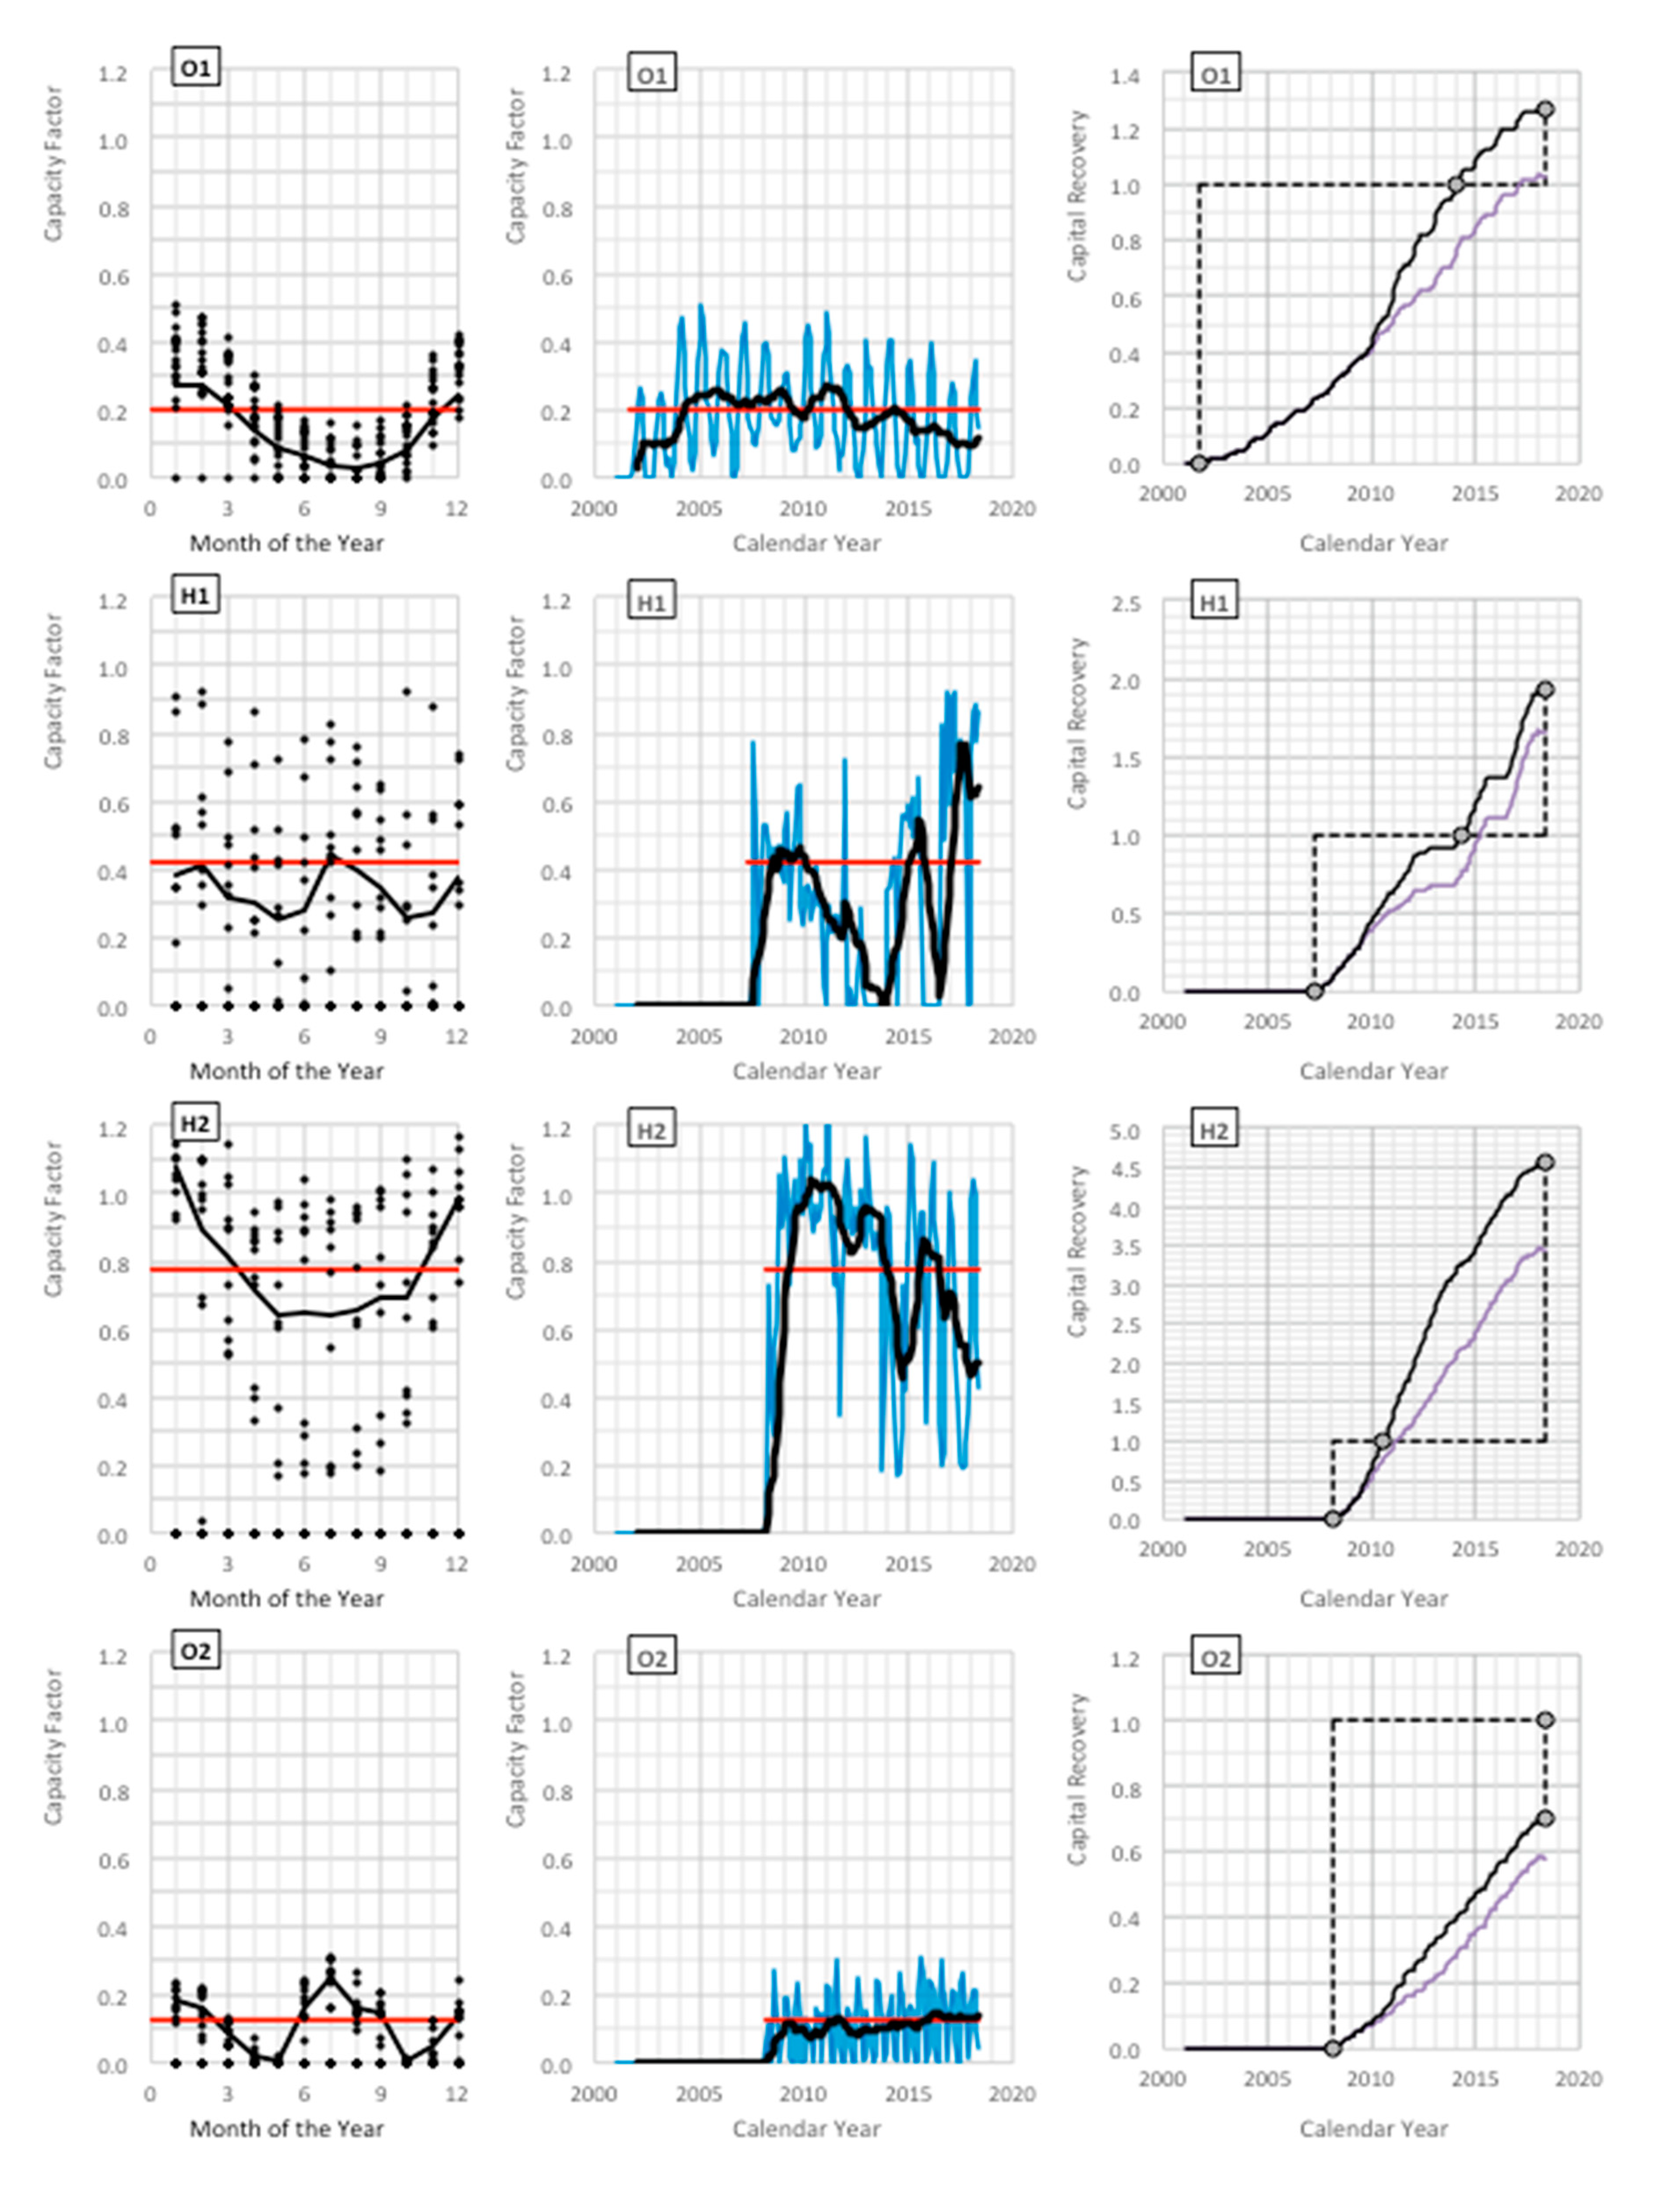
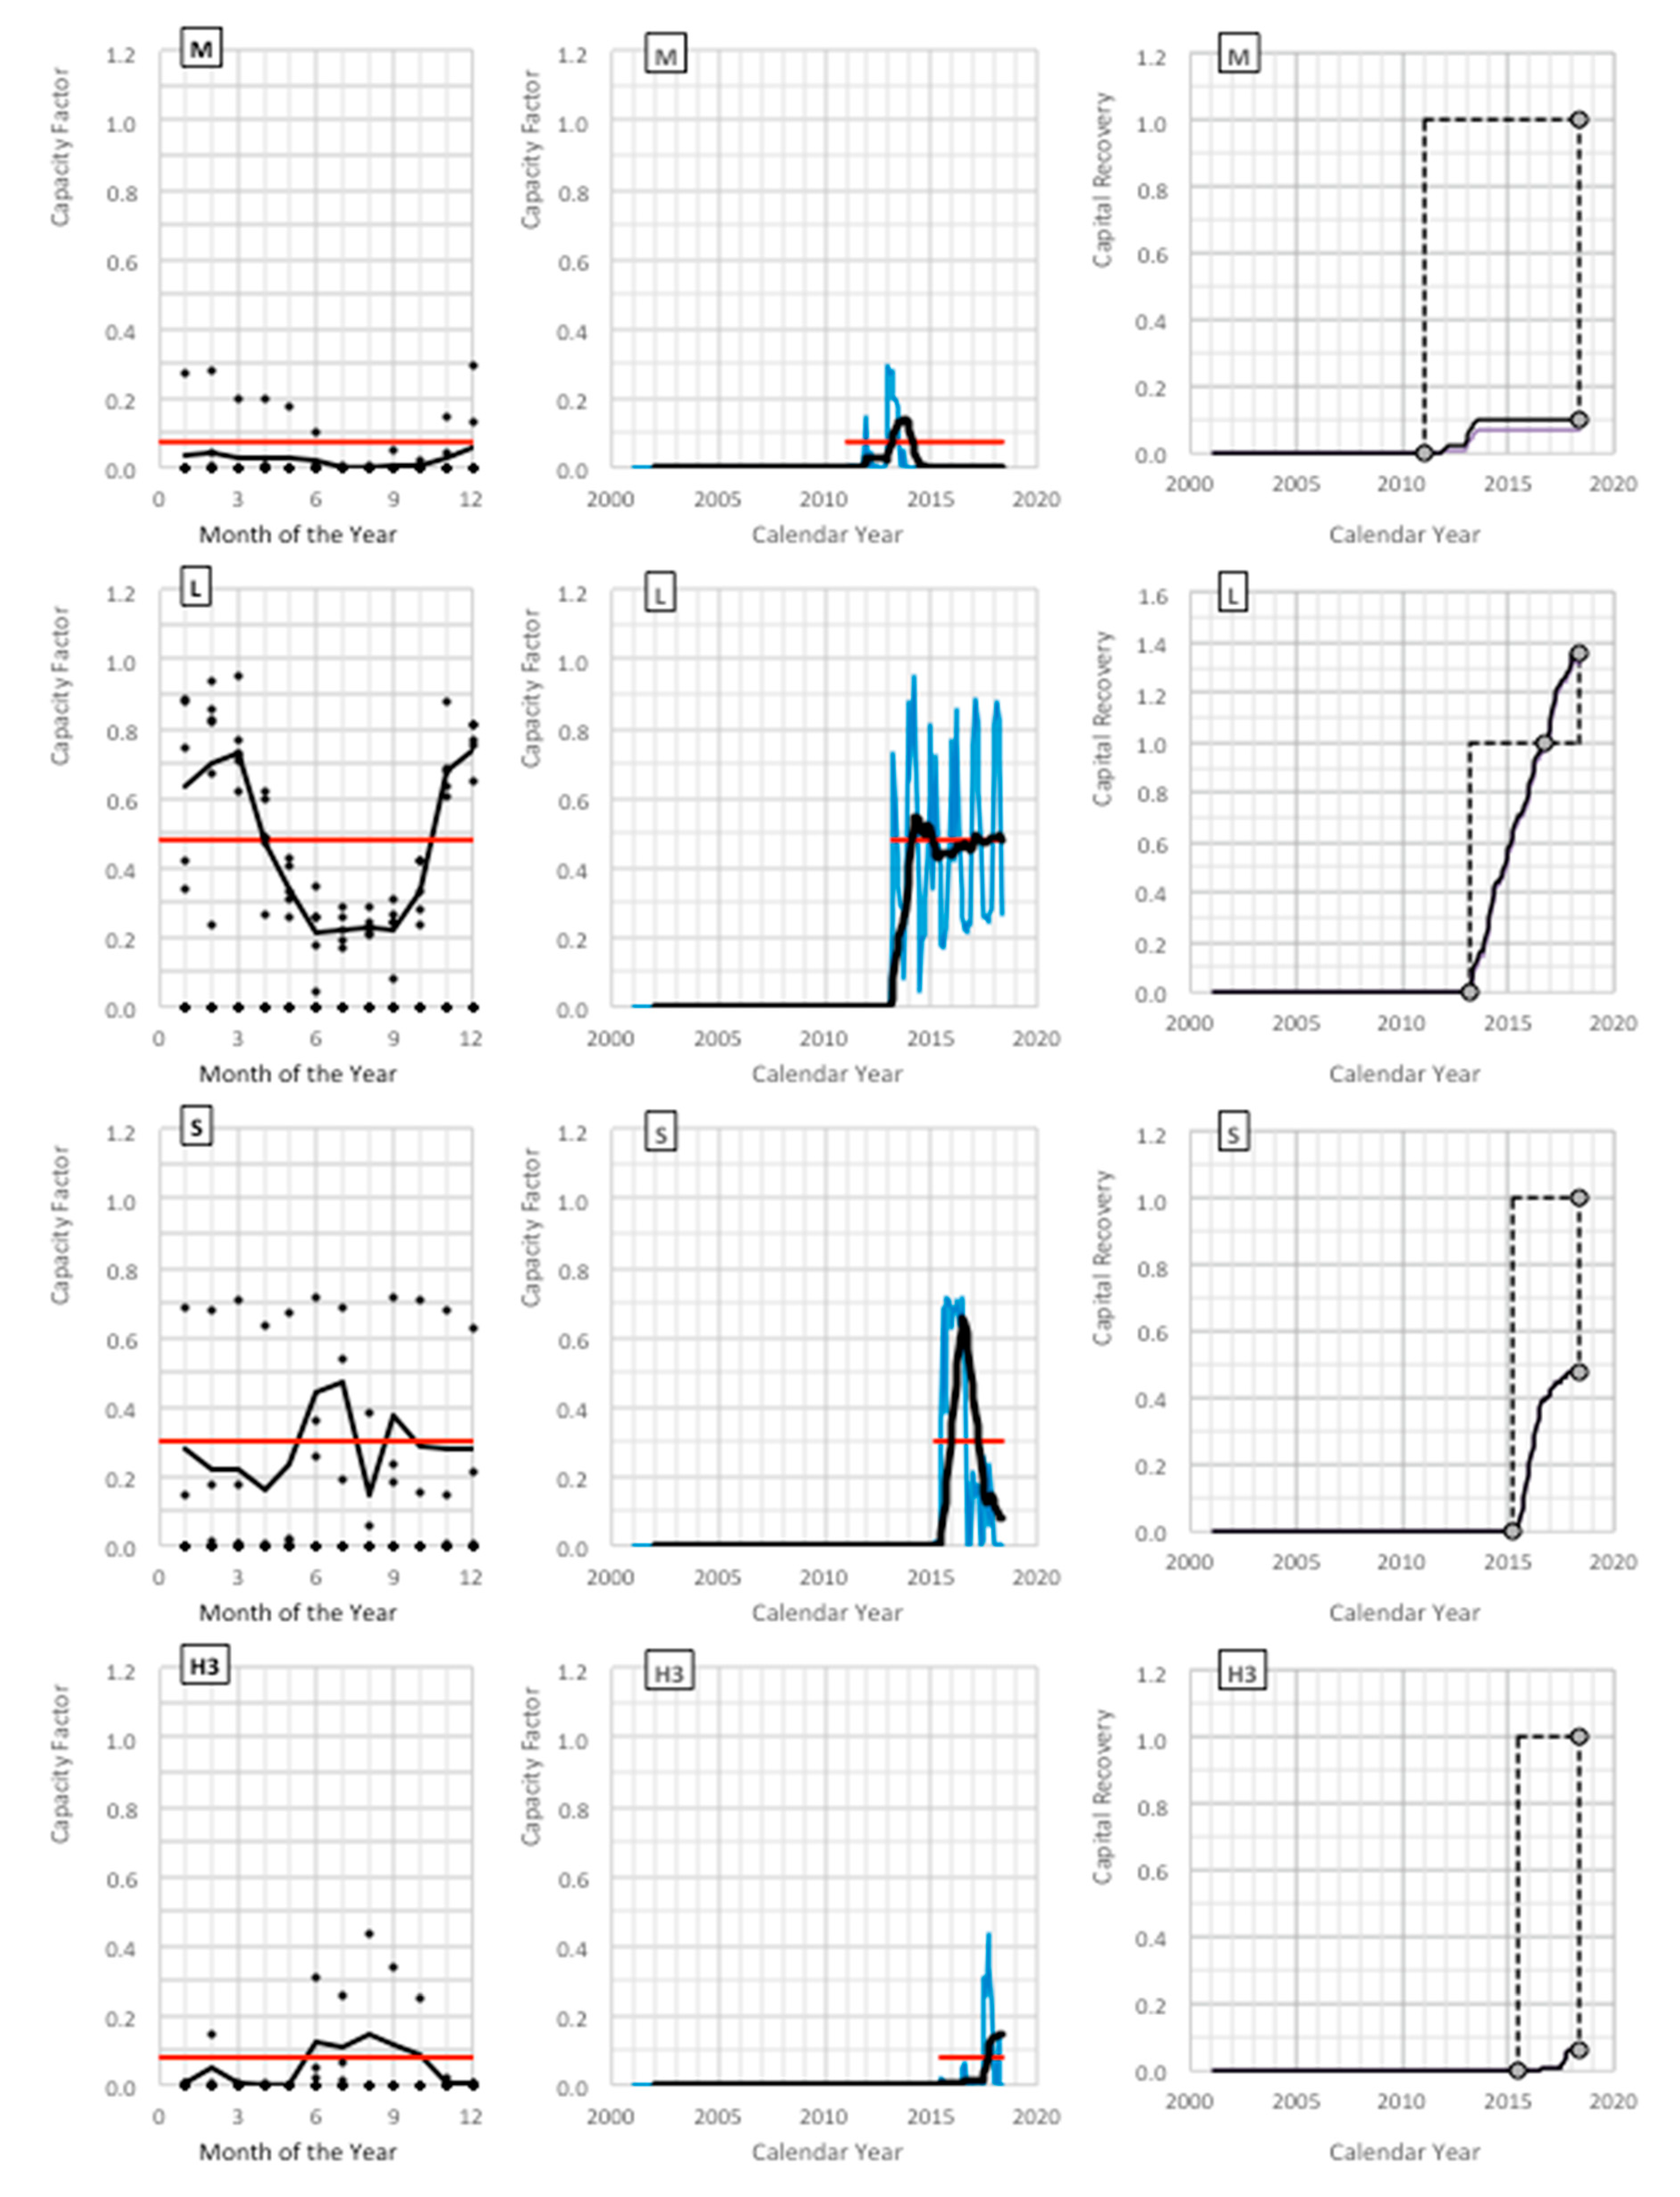
Figure 4 presents the evolution of the KPIs over the years in operation for the eight Athens CHP projects: (a) The first-column diagrams present for each project the monthly capacity factor versus the calendar month revealing the seasonal operating variation. The monthly average and life average values are also denoted. (b) The second-column diagrams present for each project the evolution of the capacity factor versus the time in operation. The 12-month moving average is also denoted to eliminate seasonal variation. (c) Finally, the third-column diagrams present the evolution of the capital recovery versus the time in operation for both the cases of FiT supporting scheme and self-consumption. In the diagrams, there are three highlighted dots which represent the starting point of the capital recovery curve, the break-even point, and the total at the end of the analysis period, as indicated by the dashed lines, for the case of FiT. Thus, Figure 4 reveals the real technical and economic performance of each project.
The main conclusions, separately for each project, are summarized as follows:
(O1) Office O1 is the oldest Athens project; it is in operation 17 years, from 2002. Capacity factor reveals a stable operation with a seasonal variation and a small long-term declination. Since the maximum monthly capacity factor ever obtained is 50%, it is concluded that it is strongly oversized, thus the has been reached after 12.5 years of operation by using the FiT supporting mechanism. A size of 1/3 of the designed power would have been enough.
(H1) Hospital H1 displays unstable operation given the recorded random seasonal and long-term variation. The operational schedule must have been changing throughout the years, while the seasonal variation and the increased capacity factor during summer months confirm that the system allows for trigeneration through a cooling option. The level of the capacity factor achieved indicates that the system is oversized, not greatly though as higher values, closer to 1, have been recorded. It reached break-even point after seven years of operation.
(H2) Hospital H2 presents random seasonal variation and declination in long-term performance. It is well sized and obtained a after 2.5 years of operation. However, from the decrease in the values of during the latest years of operation it can be inferred that operating time has been reduced. At present, it has covered the initial capital more than four-fold.
(O2) Office building O2 shows a very stable operation both seasonally and in the long-term. Obviously, it uses a cooling option, as the highest values of appear in summer. The loads do not allow for use during transition periods between heating and cooling season, reducing total operating time. Unfortunately, it is five-fold oversized, which is why it has still not reached the after 10 years of operation.
(M) Mall M is a failed case, possibly because of extreme oversizing. It does not present a normal operation. An average capacity factor of 7% was obtained after more than seven years from construction, during which the unit was employed only for 27 months. The unit has not been operating for the past four years. Perhaps greatly oversizing the unit is forcing operation at partial load, making it less profitable.
(L) Hotel L is, instead, a success case. It shows stable seasonal and long-term operation reaching the after almost 3.5 years.
(S) School S demonstrates an unstable operation. It started with a capacity factor of about 70% for 1.5 years and then operating time was drastically limited decreasing the capacity factor to about 15%. The unit is a CCHP according to the seasonal variation and it appears to be used mostly during the summer for cooling purposes. The present capital recovery is about 50% after more than three years of operation.
(H3) Hospital H3 is the newest project with less than 3 years in operation and a very small capacity factor of 8% covering the initial capital by about 6%. A cooling option is apparently used here as well and it appears to be the main function of the CCHP system, as the unit is almost not employed during winter months. The unit size might have been appropriate if it was designed to cover thermal needs, however, for the current operational profile the unit is obviously oversized.
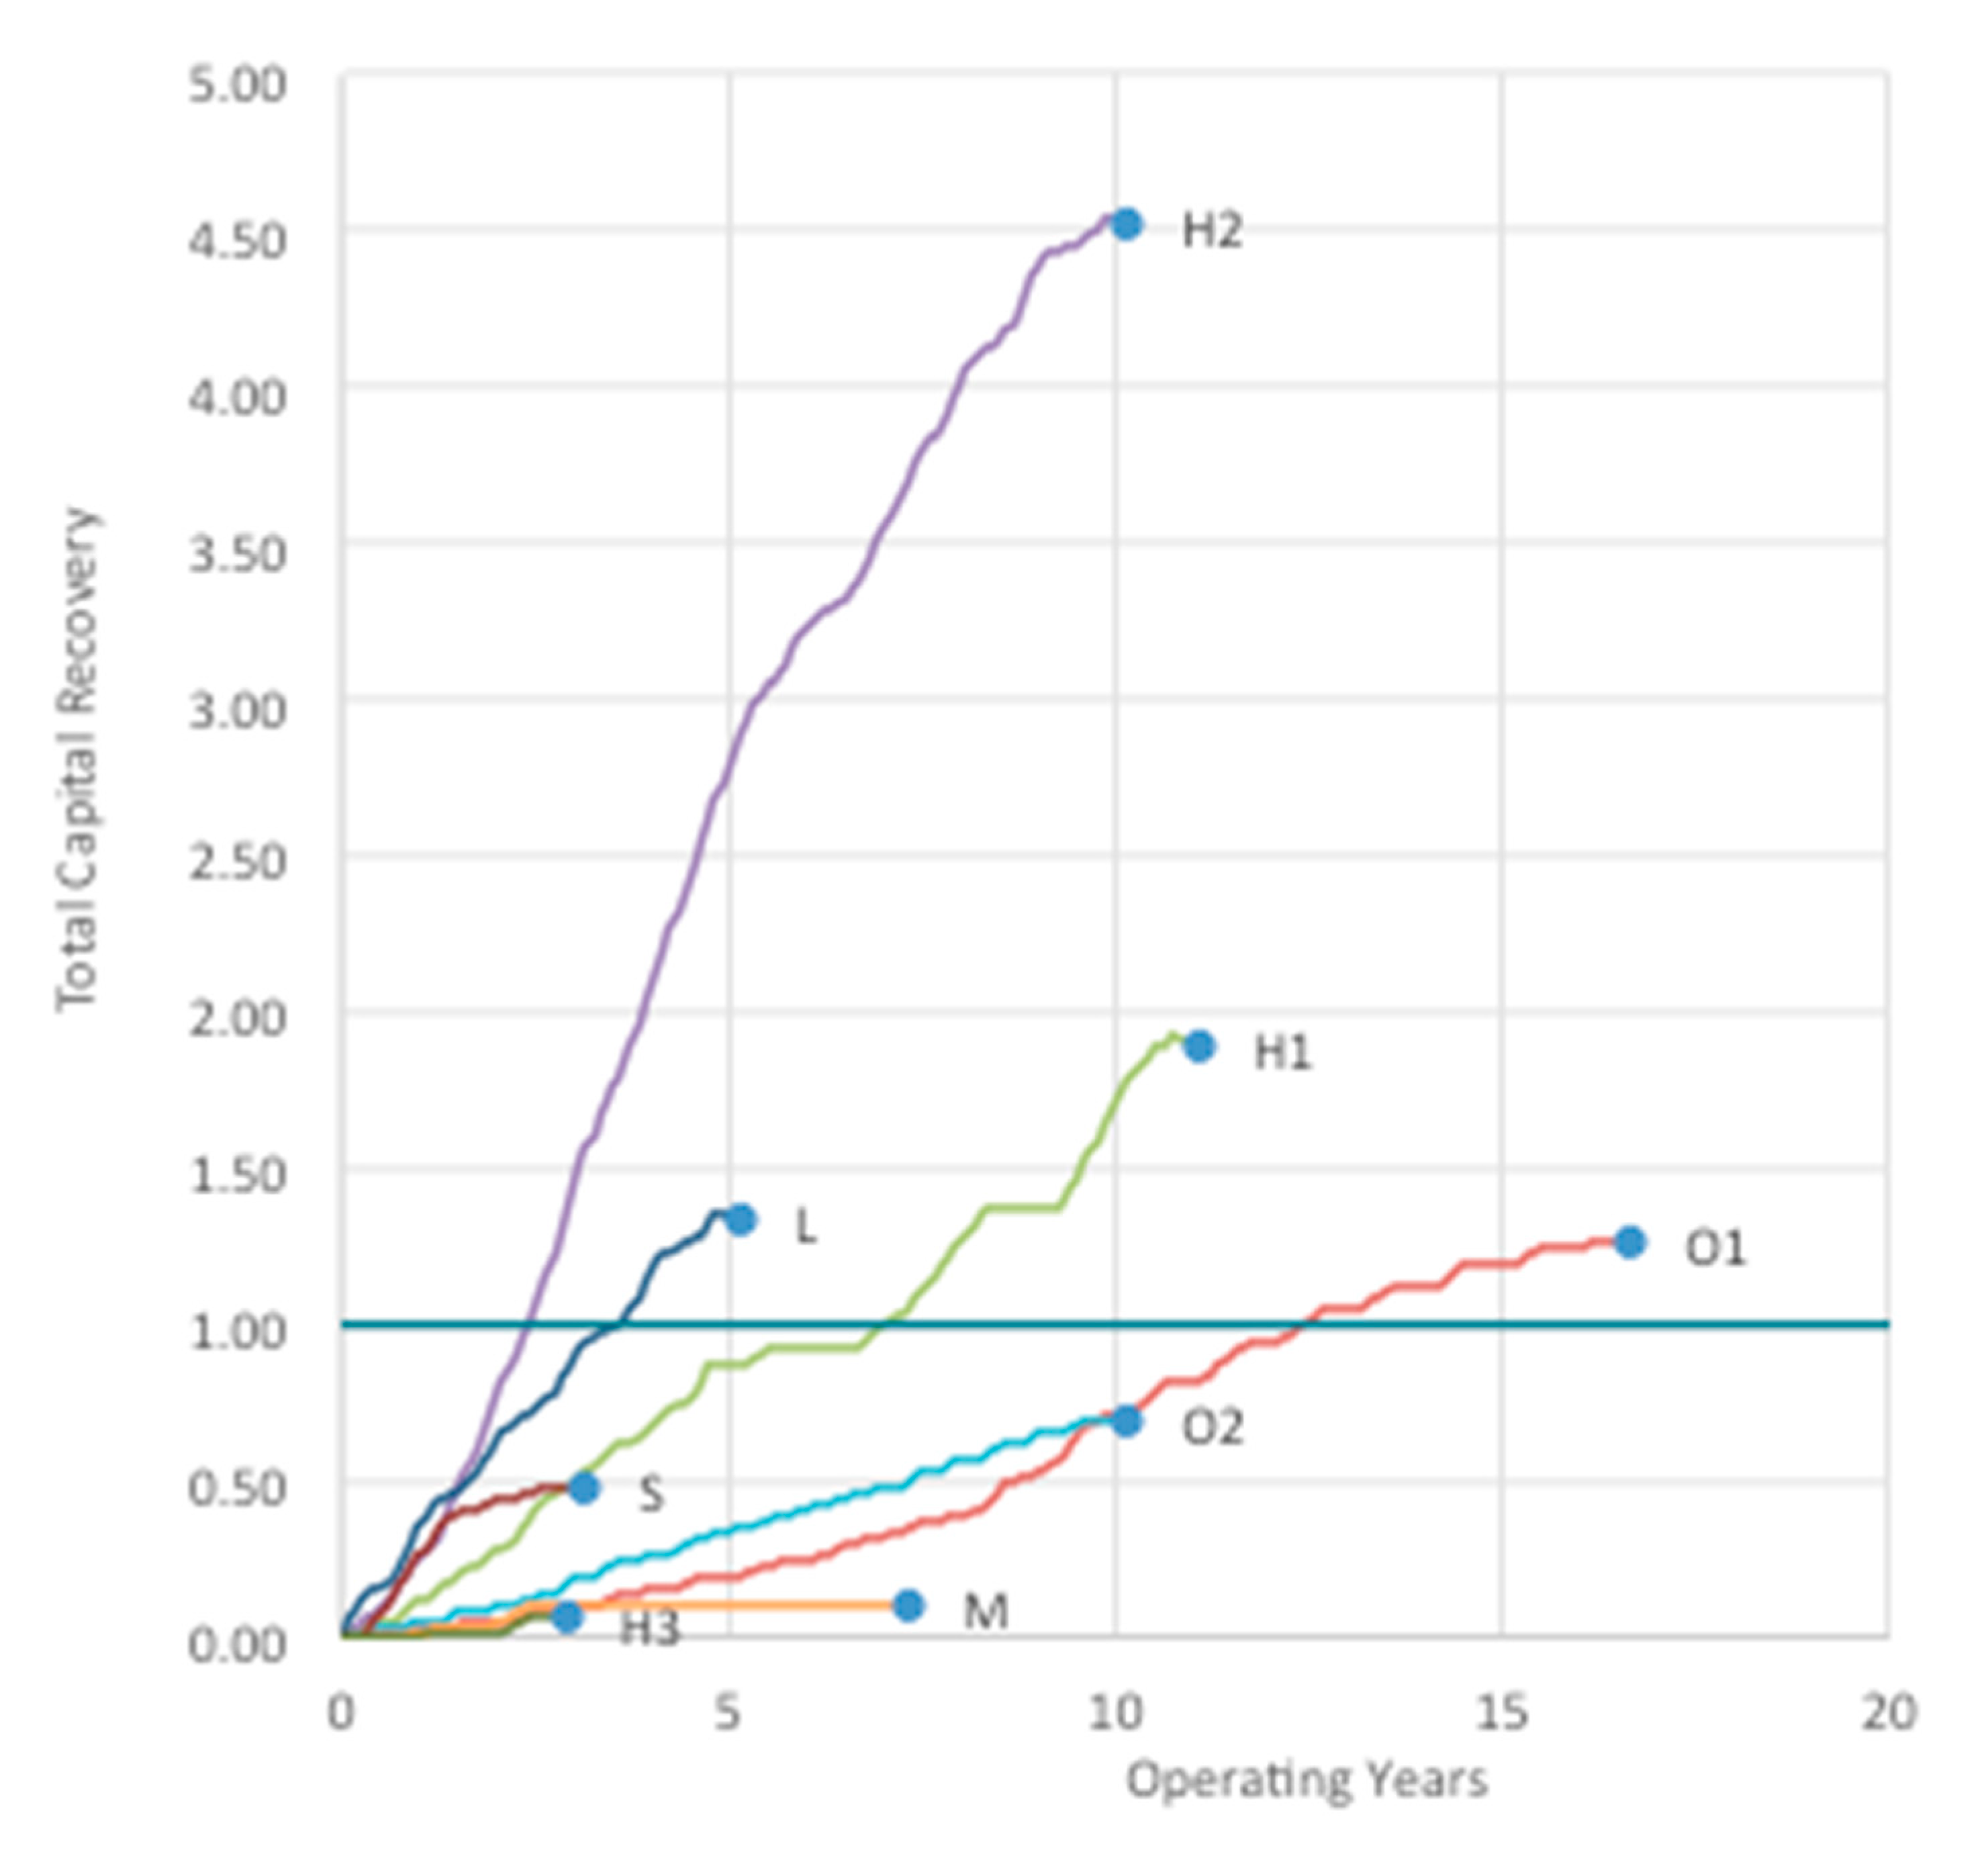
The above results are summarized and compared in Table 2 and Figure 5. Table 2 summarises the overall KPIs, namely the life average capacity factor and the total life capital recovery , for each project. Furthermore, the average return on investment and the corresponding simple payback period are also presented along with the break-even point . Figure 5 compares the evolution of the capital recovery versus time for all projects. The main conclusions are as follows:
Only two out of eight projects reached an acceptable simple payback period less than four years (projects H2 and L) and two more less than 10 years (projects H1 and S). Four projects have already reached the break-even point. Project O2 is significantly oversized, but its operation is stable, and the will be reached in a few years. Instead, project M has failed, while the analysis is not able to forecast the performance of projects S and H3.
All units are installed in tertiary sector buildings and the most successful cases were in a hospital and in a hotel. Half of the projects are trigeneration systems providing a cooling option in order to allow greater use of the system throughout the year. Those systems, however, present lower capital recovery rates, while they also appear to have gradually reduced their operation during heating season, making cooling the prominent use of the system.
The projects do not achieve good capacity factor values, either due to poor design choices or due to failure of the heat load estimates. The most common problem appears to be oversizing the unit, which limits the operating time or forces it to work on partial loads, resulting in lower than expected. Unsteady operation is also quite common, probably due to lower achieved efficiencies that impose the constant revaluation of the operating schedules or the switch towards more efficient or cost-effective for the current conditions energy systems. The associated capital recovery is not sufficiently acceptable primarily due to low but also due to changes in energy prices, which have gradually limited the profitability margin. The actual period appears in most cases much longer than the four years’ intended .
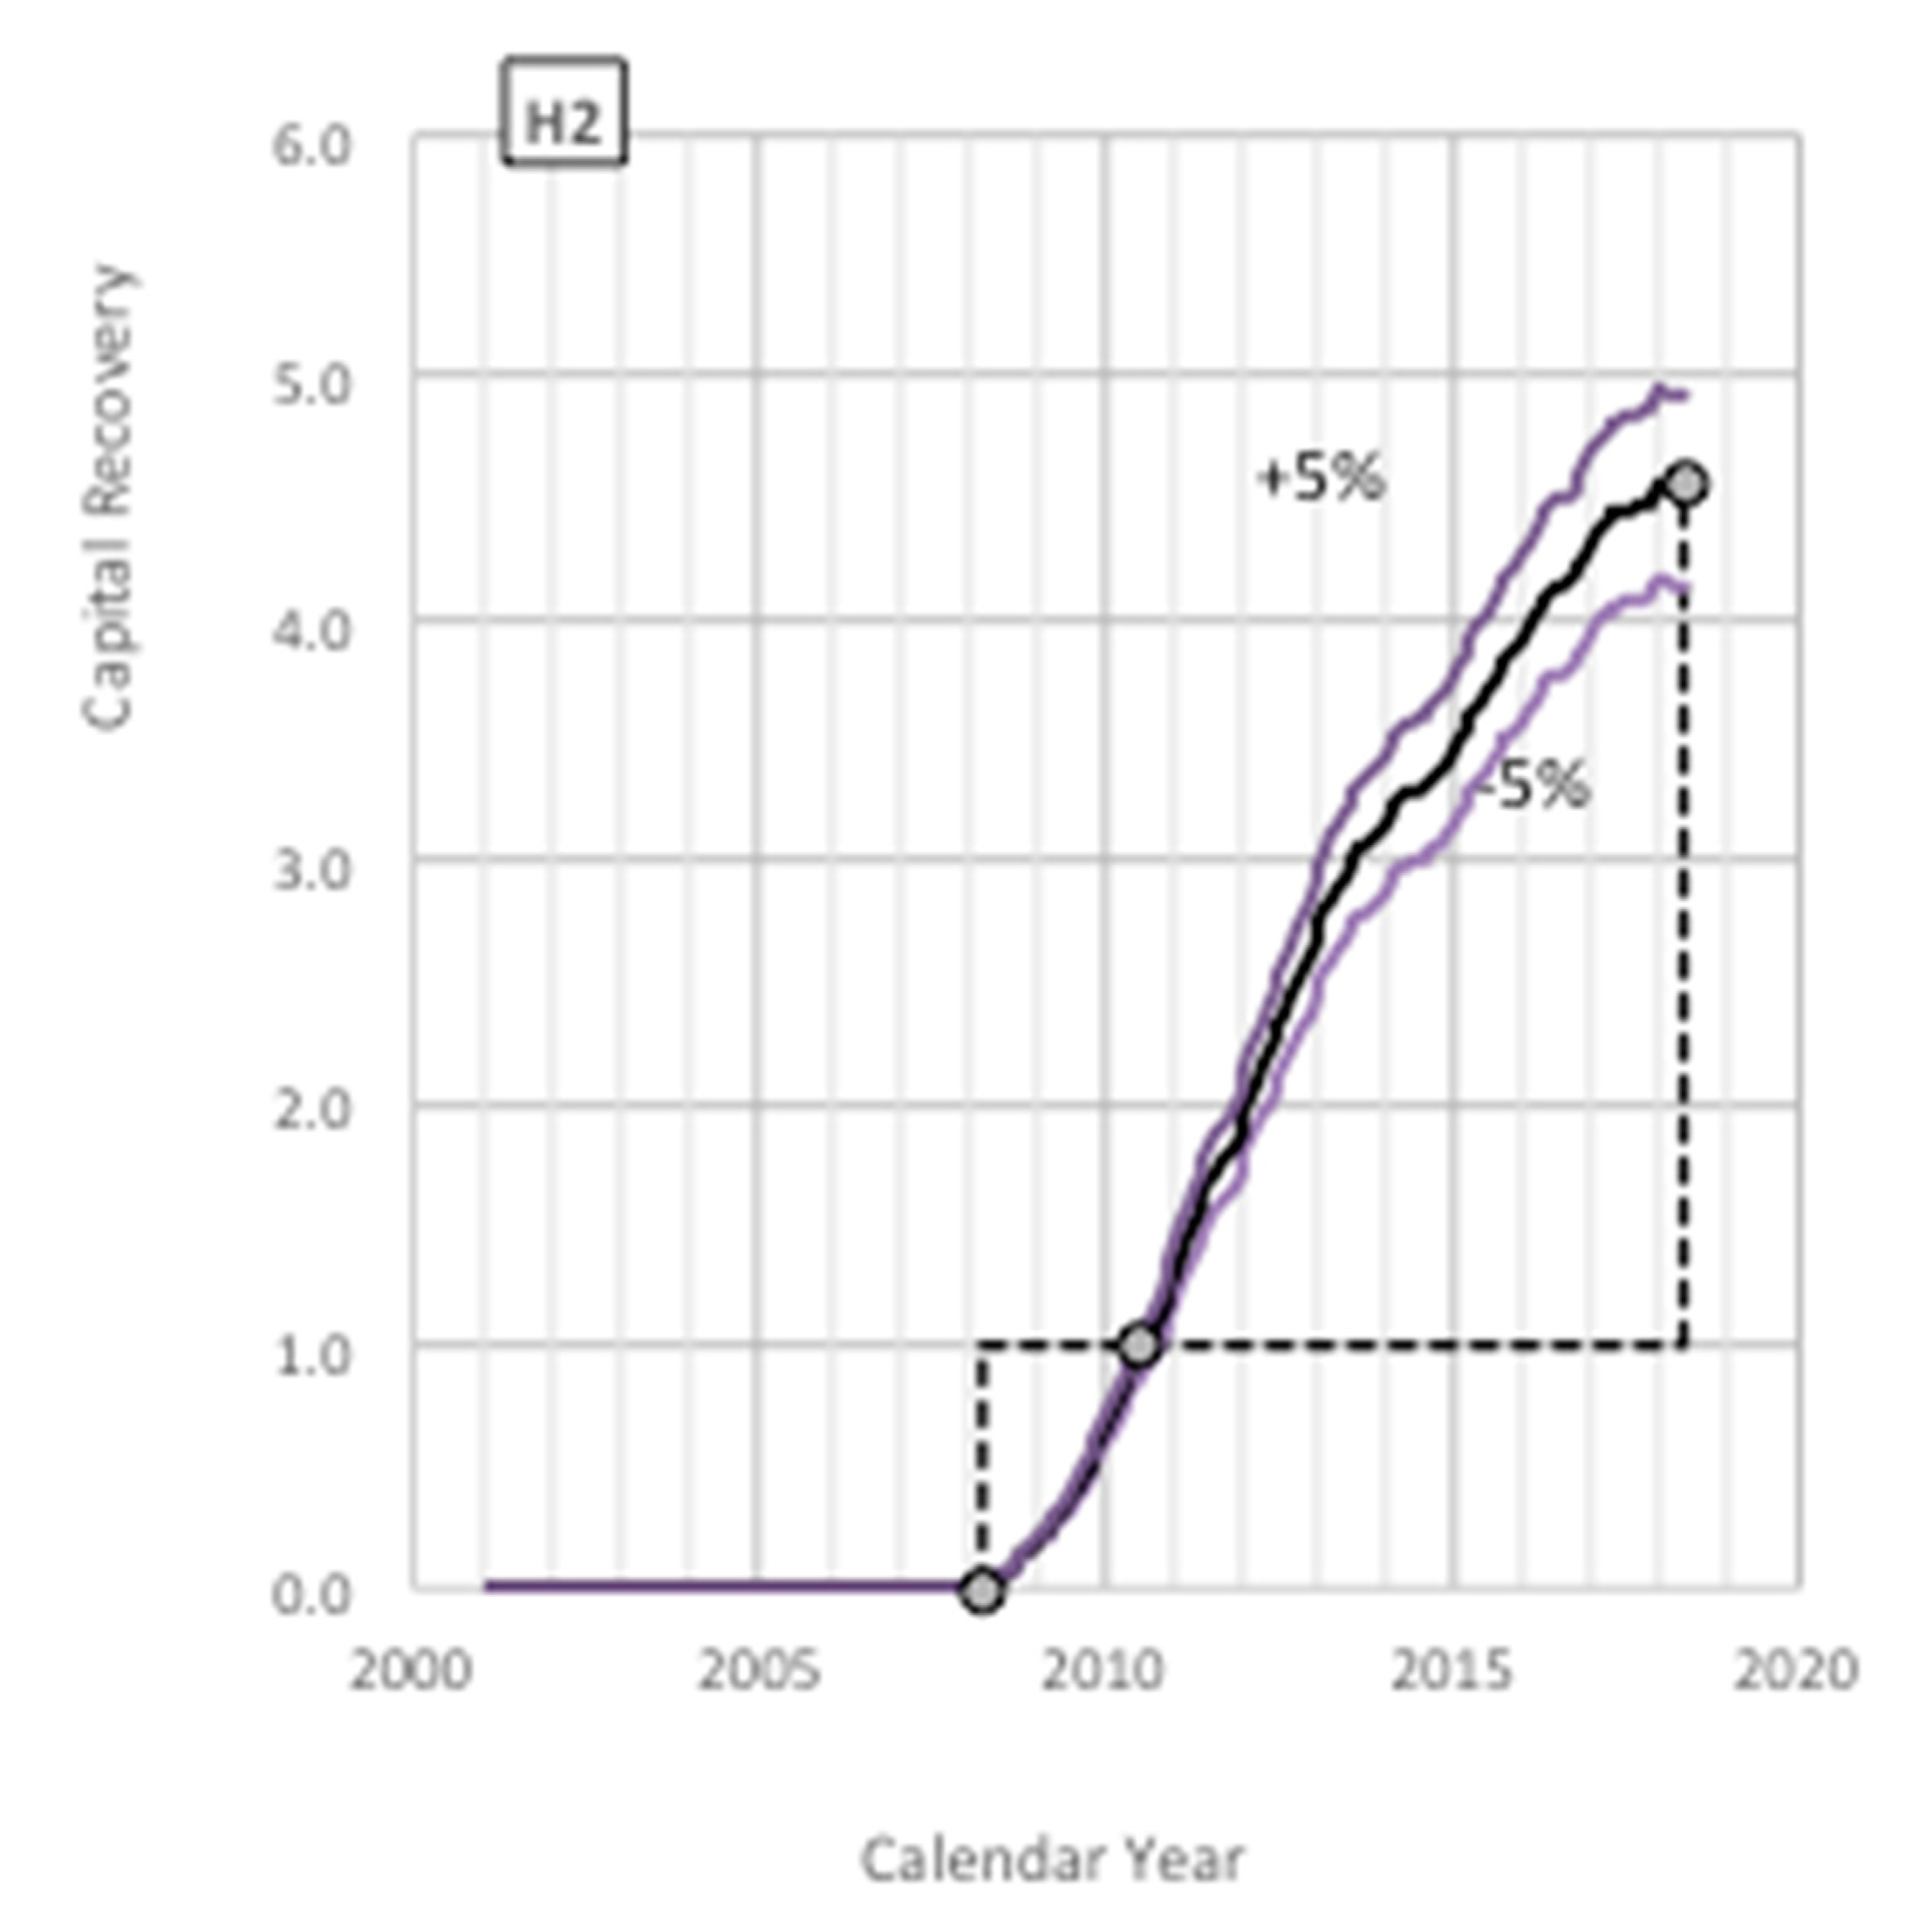
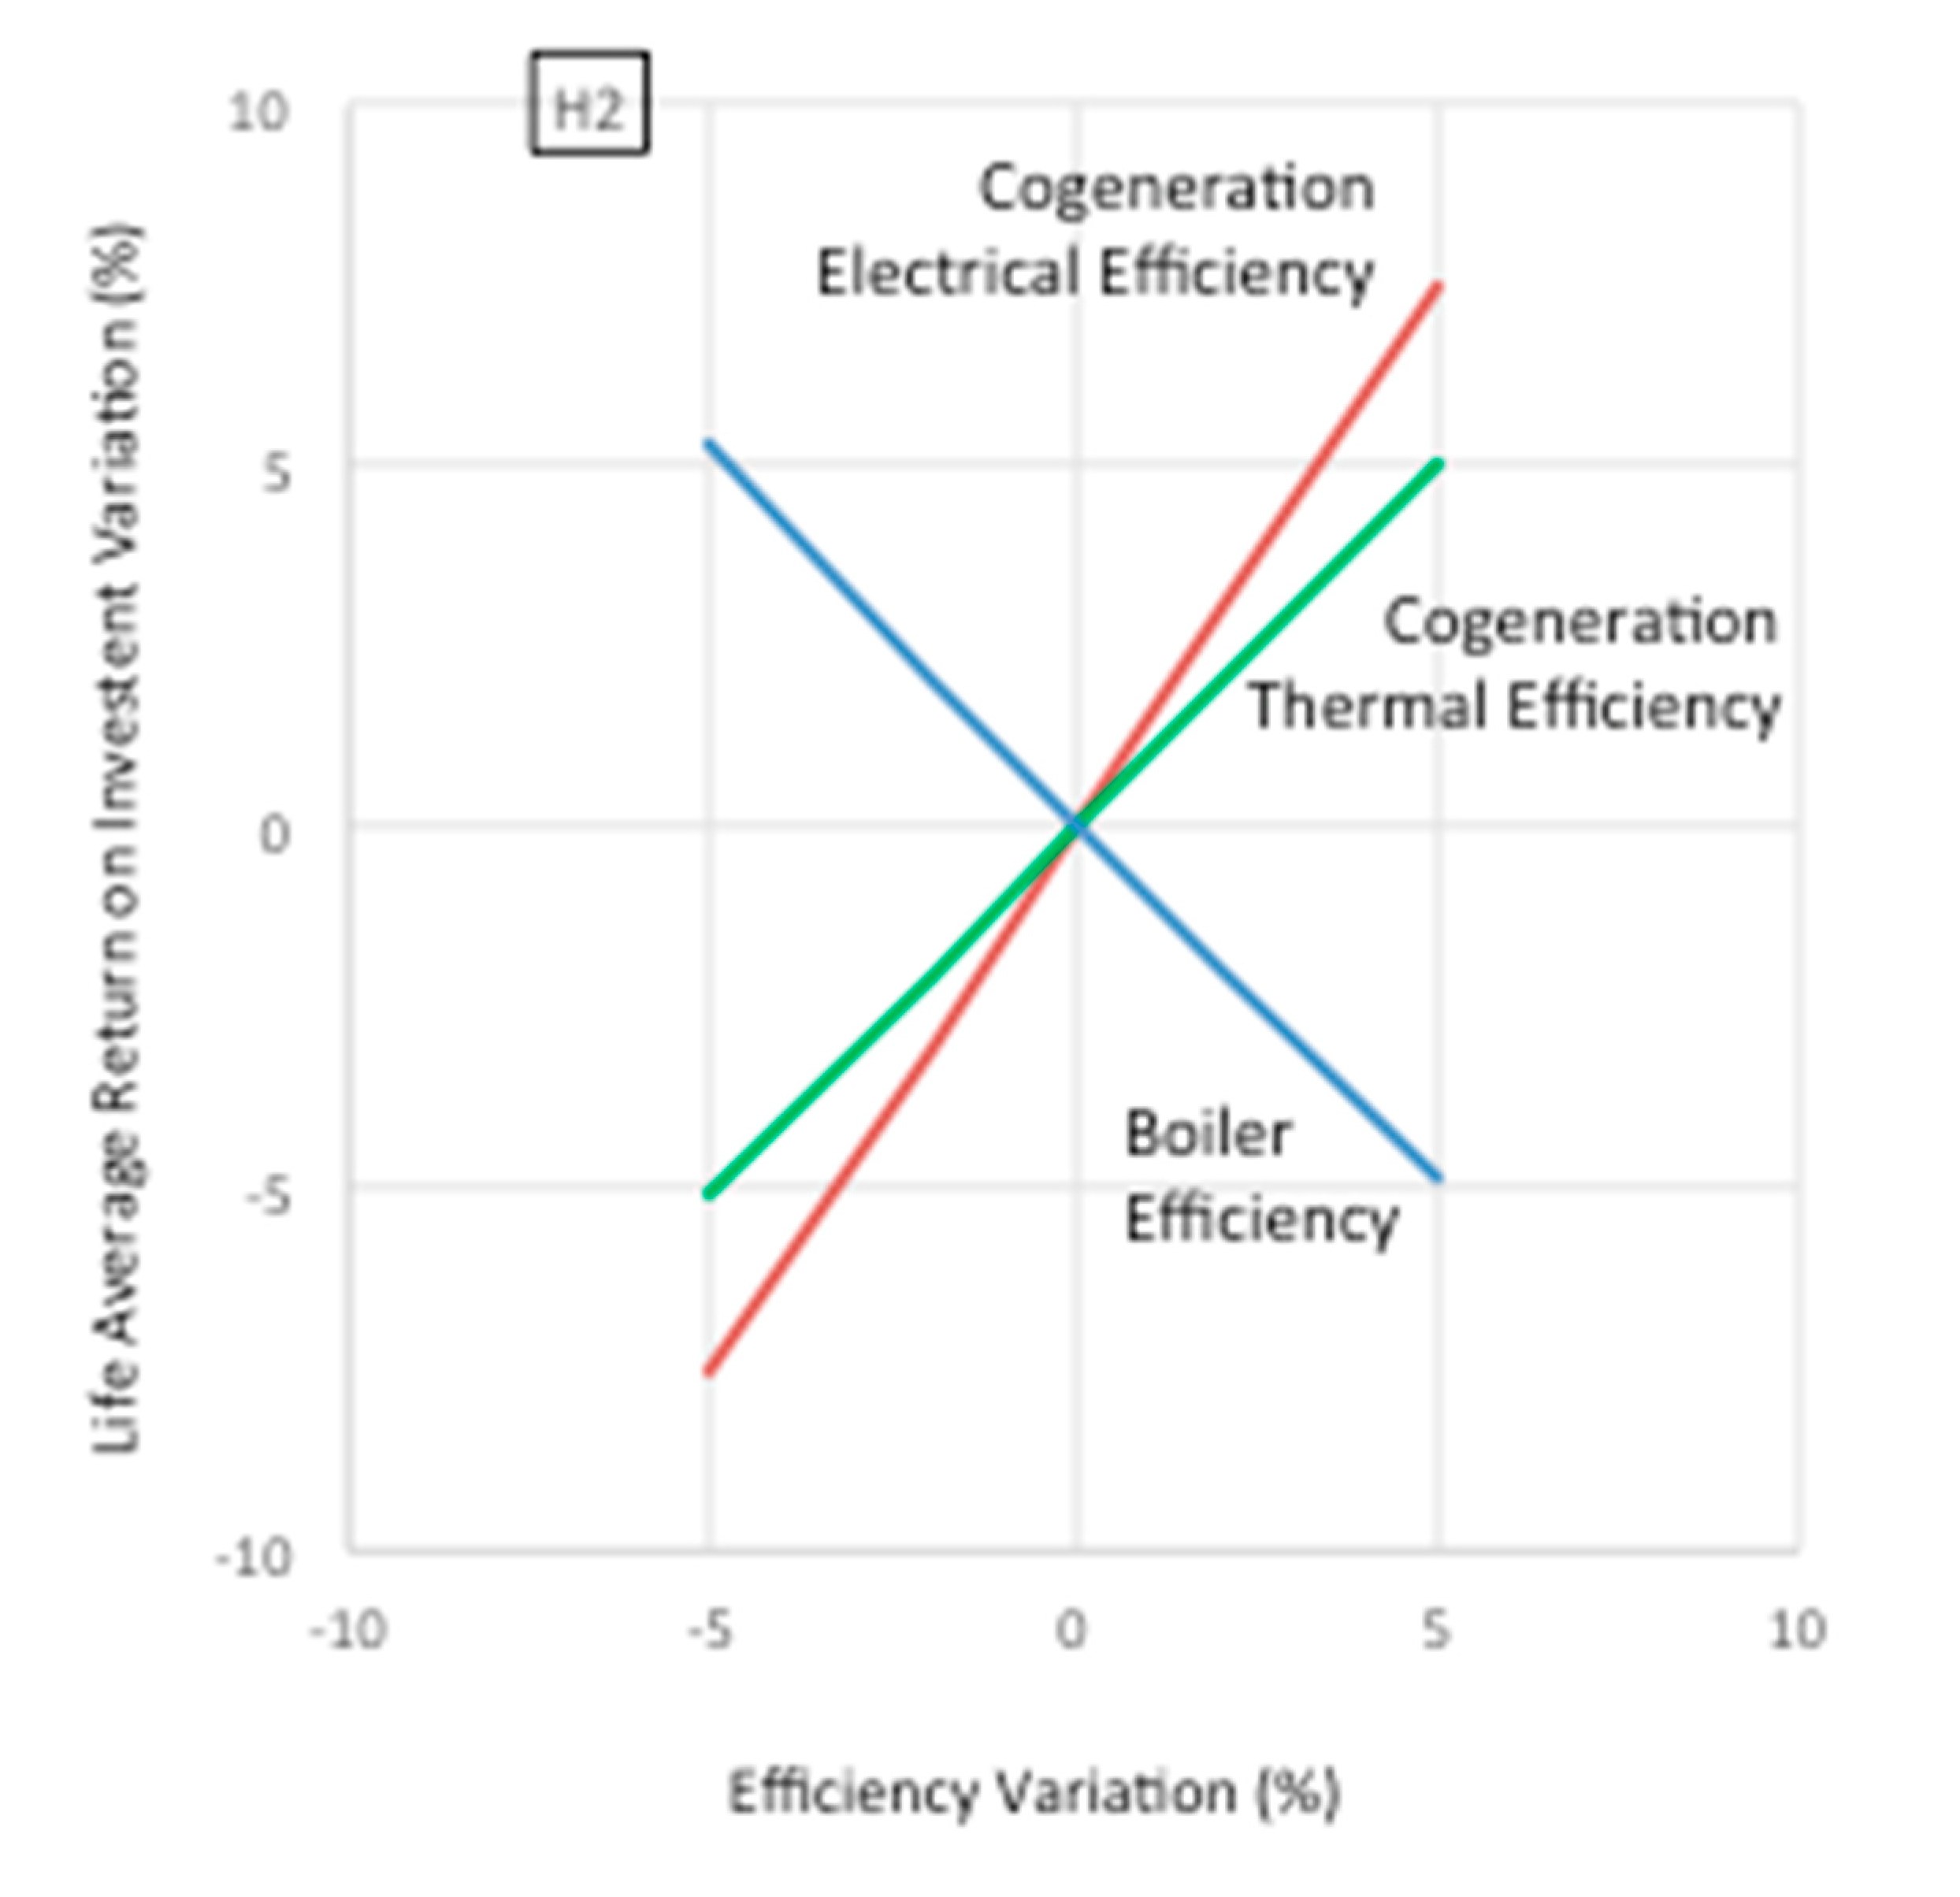
Furthermore, in order to test the validity of the main assumptions and inspect the accuracy of the results, a sensitivity analysis is performed. The results for project H2, which appeared to be the most successful one, are presented in Figure 6 and Figure 7. Figure 6 represents the capital recovery curve for project H2 when the electrical efficiency is between −5% and +5%. Results show a 7.5% proportional difference in capital recovery for 5% change in electrical efficiency. Moreover, the accuracy of the life average return on investment () is further analyzed in Figure 7 for +/−5% variation of electrical, thermal, and boiler efficiency of the system. A change in the system efficiency, results in a similar change in , showing slightly greater sensitivity to electrical performance. Changes in boiler efficiency result in inversely proportional changes in .
4. Conclusions
A comprehensive and comparative analysis and evaluation of the CHP/CCHP projects that are currently in operation in Athens, Greece, has highlighted differences between the actual performance and the designed performance of the systems, due to technical and economic reasons, and has also provided useful insight to the reasons that are hindering cogeneration penetration in Greece.
A simple and effective analysis method based on real operation data of gas consumption, covering the whole period of operation, has been selected and applied successfully to eight CHP/CCHP projects, resulting in the presentation of their lifetime technical and economic performance since their installation. The two KPIs selected for the evaluation of the real performance; (a) the capacity factor, evaluating the technical performance, and (b) the capital recovery, evaluating the economic performance, were both proven effective in the analysis as they could clearly indicate the operating strategy and its effectiveness for each project.
The evolution of the KPIs during the lifetime operation of the plants fluctuated more than it should usually be expected, proving that analyses based on a short period of operating data can be misleading in regard to the future operation of a plant. A sensitivity analysis tested the main assumption, which was operation at nominal load, and validated the accuracy of the results, showing that the overall picture is safely drawn and therefore the assumption can be introduced to the method for simplification and greater applicability reasons.
The analysis proved that 3 projects could be considered as successful, two are technically acceptable but due to oversizing decline in economic performance, one project has failed and the remaining two projects present difficulties to a clear evaluation. Six out of eight projects were considered oversized. The most successful cases were in a hospital and in a hotel, while the CCHP presented lower capital recovery rates compared to the CHP.
In addition to this, the evolution of gas and electricity prices in the region showed that the profitability margin has been shrinking after 2013, while the supporting policy is trying to keep the spark ratio about equal to 3. Self-consumption may offer opportunities for the years after 2015.
Overall, the projects achieve low capacity factor values, either due to poor design choices or due to failure of the heat load estimates. The most common problem appears to be oversizing the unit. The associated capital recovery is not sufficiently acceptable primarily due to low but also due to changes in energy prices, which have gradually limited the profitability margin. The actual period appears in most cases much longer than the four years’ intended . The delay in the recovery of the capital is the main reason why such an investment is not attractive.
The applied method for analyzing the performance of existing systems is simple, efficient, and can be based only on gas consumption recording data.
Author Contributions
Conceptualization: E.G., Z.M.; data curation: A.P., V.V.; formal analysis: A.P., V.V., K.T., E.G., Z.M.; methodology: A.P., E.G., Z.M.; software: A.P., K.T.; supervision: E.G., Z.M.; writing—original draft: A.P., K.T., E.G.; writing—review and editing: A.P., V.V., K.T., E.G., Z.M. All authors have read and agreed to the published version of the manuscript.
Funding
This research received no external funding.
Conflicts of Interest
The authors declare no conflict of interest.
List of Symbols
| The average capacity factor during the total operating period (lifetime) of the CHP system (-) | |
| The capacity factor CFj of the CHP system during month j (-) | |
| The capital recovery during the total operating period (lifetime) of the CHP system (-) | |
| The capital recovery during the j month of operation (-) | |
| The electricity price during the month j (€/MWh) | |
| The installed unit equipment cost (M€/MW) | |
| The price of natural gas during month j (€/mwh) | |
| The maintenance cost per electricity produced (€/mwh) | |
| The operating cost per electricity produced during month j (€/MWh) | |
| The actual electricity produced by the CHP system during month j (MWh) | |
| The natural gas consumption during month j (mwh) | |
| The designed return on investment (-) | |
| The actual average return on investment (-) | |
| The designed simple payback period (y) | |
| The actual average simple payback period (y) | |
| The total calendar hours of month j (h) | |
| The total time of operation (h) | |
| The total time in operation (y) | |
| The thermal efficiency of the conventional boiler (-) | |
| The electrical efficiency of the CHP system (-) | |
| The thermal efficiency of the CHP system (-) | |
| The electricity production (mwh) | |
| The natural gas consumption by the CHP system (mwh) | |
| The total number of months of operation (-) | |
| The nominal power of the CHP system (MW) | |
| The thermal energy recovered and used by the CHP system (mwh) |
Abbreviations
| Break-even point | |
| Capacity factor | |
| Combined heat and power | |
| Combined cooling heat and power | |
| Capital recovery | |
| Feed-in tariff | |
| Greenhouse gas | |
| Key performance indicator | |
| Primary energy savings | |
| Return on investment | |
| Simple payback period |
References
- Silveira, J.L.; Lamas, W.D.Q.; Tuna, C.E.; Villela, I.A.D.C.; Miro, L.S. Ecological efficiency and thermoeconomic analysis of a cogeneration system at a hospital. Renew. Sustain. Energy Rev. 2012, 16, 2894–2906. [Google Scholar] [CrossRef]
- Teke, A.; Timur, O. Assessing the energy efficiency improvement potentials of HVAC systems considering economic and environmental aspects at the hospitals. Renew. Sustain. Energy Rev. 2014, 33, 224–235. [Google Scholar] [CrossRef]
- Tataraki, K.G.; Kavvadias, K.C.; Maroulis, Z.B. A systematic approach to evaluate the economic viability of Combined Cooling Heating and Power systems over conventional technologies. Energy 2018, 148, 283–295. [Google Scholar] [CrossRef]
- Tataraki, K.G.; Kavvadias, K.C.; Maroulis, Z.B. Combined cooling heating and power systems in greenhouses. Grassroots and retrofit design. Energy 2019. [Google Scholar] [CrossRef]
- Smith, A.D.; Fumo, N.; Mago, P.J. Spark spread–A screening parameter for combined heating and power systems. Appl. Energy 2011, 88, 1494–1499. [Google Scholar] [CrossRef]
- Kavvadias, K.C. Energy price spread as a driving force for combined generation investments: A view on Europe. Energy 2016, 1–8. [Google Scholar] [CrossRef]
- Asaee, S.R.; Ugursal, V.I.; Beausoleil-Morrison, I. Techno-economic evaluation of internal combustion engine based cogeneration system retrofits in Canadian houses–A preliminary study. Appl. Energy 2015. [Google Scholar] [CrossRef]
- Rosato, A.; Sibilio, S.; Ciampi, G. Energy, environmental and economic dynamic performance assessment of different micro-cogeneration systems in a residential application. Appl. Therm. Eng. 2013, 59, 599–617. [Google Scholar] [CrossRef]
- Rosato, A.; Sibilio, S. Performance assessment of a micro-cogeneration system under realistic operating conditions. Energy Convers. Manag. 2013, 70, 149–162. [Google Scholar] [CrossRef]
- Mago, P.J.; Hueffed, A.K. Evaluation of a turbine driven CCHP system for large office buildings under different operating strategies. Energy Build. 2010, 42, 1628–1636. [Google Scholar] [CrossRef]
- Borg, S.P.; Kelly, N.J. High resolution performance analysis of micro-trigeneration in an energy-efficient residential building. Energy Build. 2013, 67, 153–165. [Google Scholar] [CrossRef] [Green Version]
- Badami, M.; Camillieri, F.; Portoraro, A.; Vigliani, E. Energetic and economic assessment of cogeneration plants: A comparative design and experimental condition study. Energy 2014, 71, 255–262. [Google Scholar] [CrossRef]
- Li, J.; Laredj, A.; Tian, G. A Case Study of a CHP System and its Energy use Mapping. Energy Procedia 2017, 105, 1526–1531. [Google Scholar] [CrossRef]
- Bulatov, I.; Kuhn, V. MicroCHP: Overview of selected technologies, products and field test results. Appl. Therm. Eng. 2008, 28, 2039–2048. [Google Scholar] [CrossRef] [Green Version]
- Magnani, S.; Danti, P.; Barbero, G. Experimental results of the influence of environmental conditions on the performance of a small-size ICE-based CHP. AIP Conf. Proc. 2019, 2191. [Google Scholar] [CrossRef]
- Paine, S.; James, P.; Bahaj, A.B. Evaluating CHP management and outputs using simple operational data. Int. J. Low-Carbon Technol. 2018, 13, 109–115. [Google Scholar] [CrossRef] [Green Version]
- National Energy Plan. Roadmap to 2050. Ministry of Environmental and Energy, Greece. March 2012. Available online: http://www.ypeka.gr/LinkClick.aspx?Fileticket=Xm5Lg9NOeKg%3D&tabid=367& (accessed on 25 February 2020).
- Giannini, E.; Moropoulou, A.; Maroulis, Z.; Siouti, G. Penetration of Photovoltaics in Greece. Energies 2015, 8, 6497–6508. [Google Scholar] [CrossRef]
- Loumakis, S.; Giannini, E.; Maroulis, Z. Renewable Energy Sources Penetration in Greece: Characteristics and Seasonal Variation of the Electricity Demand Share Covering. Energies 2019, 12, 2441. [Google Scholar] [CrossRef] [Green Version]
- Hellenic Electricity Market Operator. Renewable Energy Sources and CHP Monthly Statistics. Available online: http://www.lagie.gr (accessed on 25 February 2020).
- Cho, H.; Luck, R.; Eksioglu, S.D.; Chamra, L.M. Cost-optimized real-time operation of CHP systems. Energy Build 2009, 41, 445–451. [Google Scholar] [CrossRef]
- The Association for Decentralized Energy. Combined Heat and Power Guidance for Contractors, Consultants and Customers. 2015. Available online: https://www.theade.co.uk/assets/docs/resources/CHP_Advice_for_Contractors_Consultants_and_Customers_Updated.pdf (accessed on 30 April 2020).
- Attiki Natural Gas Distribution Company S.A. Available online: https://edaattikis.gr/ (accessed on 2 February 2020).
- Beck, G. Grid Parity: The Art of Financing Renewable Energy Projects in the US, 1st ed.; The Fairmont Press: Lilburn, GA, USA, 2014. [Google Scholar]
- New Support Scheme for RES and High Efficiency CHP. Ministry of Environmental and Energy, Greece. February 2016. Available online: http://www.ypeka.gr/LinkClick.aspx?fileticket=xWlvcv51hrw%3D&tabid=232&language=el-GR (accessed on 25 February 2020).
- European Cogeneration Roadmap, Cogeneration Observatory and Dissemination Europe 2-CODE 2; Belgium. January 2015. Available online: https://ec.europa.eu/energy/intelligent/projects/en/projects/code2 (accessed on 25 February 2020).
Figure 1.
Information flow diagram of the selected key performance indicators (KPIs).

Figure 2.
Electricity and gas prices. Feed-in tariffs for CHP systems, Greece, 2002–2018.

Figure 3.
Spark ratio, Greece, 2002–2018.

Figure 4.
The evolution of the KPIs over the years in operation for the eight Athens CHP projects. (a) The first-column diagrams present the monthly capacity factor versus the calendar month, where the black solid line represents the monthly average and the red line the life average. (b) The second-column diagrams present the capacity factor versus the time in operation, where the black line represents the 12-month moving average and the red line the life average. (c) The third-column diagrams present the capital recovery versus the time in operation. The purple line shows the case of self-consumption and the black line the FiT supporting scheme. The highlighted dots represent the starting point of the capital recovery curve, the , and the total at the end of the analysis period, for the case of FiT.


Figure 5.
Comparison of total capital recovery evolution for the eight Athens CHP projects.

Figure 6.
Capital recovery curve of project H2, for +/−5% variation of electrical efficiency.

Figure 7.
Life average return on investment () of project H2, for +/−5% variation of electrical, thermal, and boiler efficiency of the system.
Figure 7.
Life average return on investment () of project H2, for +/−5% variation of electrical, thermal, and boiler efficiency of the system.


Table 1.
Characteristics of the examined CHP projects in operation, 2019, Athens, Greece.
| Project Code | O1 | H1 | H2 | O2 | M | L | S | H3 | ||
|---|---|---|---|---|---|---|---|---|---|---|
| Installed Power | P | 0.53 | 0.50 | 0.56 | 0.13 | 2.00 | 0.34 | 0.60 | 1.40 | MW |
| Unit Equipment Cost | Ceq | 1.20 | 1.20 | 1.20 | 1.20 | 1.30 | 1.20 | 1.20 | 1.30 | M€/MW |
| Maintenance Cost | Cm | 10.0 | 10.0 | 10.0 | 10.0 | 9.5 | 10.0 | 10.0 | 9.5 | €/MWh |
| Electrical Efficiency | ηe | 0.36 | 0.32 | 0.35 | 0.34 | 0.41 | 0.32 | 0.41 | 0.35 | - |
| Thermal Efficiency | ηth | 0.49 | 0.55 | 0.50 | 0.56 | 0.44 | 0.55 | 0.44 | 0.50 | - |
| Boiler Efficiency | ηb | 0.75 | 0.75 | 0.75 | 0.75 | 0.75 | 0.75 | 0.75 | 0.75 | - |
| Start of Operation | t0 | 8-2002 | 3-2008 | 2-2009 | 2-2009 | 12-2011 | 2-2014 | 2-2016 | 5-2016 | month-year |
| Years in Operation | top | 16.67 | 11.08 | 10.17 | 10.17 | 7.33 | 5.17 | 3.17 | 2.92 | y |
Table 2.
The Athens CHP projects’ performances.
| Project Code | O1 | H1 | H2 | O2 | M | L | S | H3 | ||
|---|---|---|---|---|---|---|---|---|---|---|
| Installed Power | P | 0.53 | 0.50 | 0.56 | 0.13 | 2.00 | 0.34 | 0.60 | 1.40 | MW |
| Years in Operation | top | 16.7 | 11.1 | 10.2 | 10.2 | 7.33 | 5.17 | 3.17 | 2.92 | y |
| Life Hours of Operation | top,e | 26,556 | 32,825 | 69,563 | 10,051 | 1440 | 21,958 | 7844 | 1414 | h |
| Life Average Capacity Factor | CFT | 0.20 | 0.42 | 0.78 | 0.13 | 0.07 | 0.48 | 0.30 | 0.08 | - |
| Life Average Simple Payback Period | SPBT | 13.1 | 5.77 | 2.24 | 14.6 | 70.4 | 3.82 | 6.63 | 46.2 | y |
| Break-Even Point | BEP | 12.33 | 7.00 | 2.33 | 3.50 | y | ||||
| Life Average Return On Investment | ROIT | 0.08 | 0.17 | 0.45 | 0.07 | 0.01 | 0.26 | 0.15 | 0.02 | - |
| Life Capital Recovery | CRT | 1.27 | 1.92 | 4.55 | 0.70 | 0.10 | 1.35 | 0.48 | 0.06 | - |
© 2020 by the authors. Licensee MDPI, Basel, Switzerland. This article is an open access article distributed under the terms and conditions of the Creative Commons Attribution (CC BY) license (http://creativecommons.org/licenses/by/4.0/).
Share and Cite
MDPI and ACS Style
Papadimitriou, A.; Vassiliou, V.; Tataraki, K.; Giannini, E.; Maroulis, Z. Economic Assessment of Cogeneration Systems in Operation. Energies 2020, 13, 2206. https://0-doi-org.brum.beds.ac.uk/10.3390/en13092206
AMA Style
Papadimitriou A, Vassiliou V, Tataraki K, Giannini E, Maroulis Z. Economic Assessment of Cogeneration Systems in Operation. Energies. 2020; 13(9):2206. https://0-doi-org.brum.beds.ac.uk/10.3390/en13092206
Chicago/Turabian StylePapadimitriou, Aikaterini, Vassilios Vassiliou, Kalliopi Tataraki, Eugenia Giannini, and Zacharias Maroulis. 2020. "Economic Assessment of Cogeneration Systems in Operation" Energies 13, no. 9: 2206. https://0-doi-org.brum.beds.ac.uk/10.3390/en13092206
Note that from the first issue of 2016, this journal uses article numbers instead of page numbers. See further details here.