Gasification of Coal Dust in a Cyclone Furnace in an O2/H2O Atmosphere


Department of Advanced Energy Technologies, Czestochowa University of Technology, Dabrowskiego 73, 42-201 Częstochowa, Poland
*
Author to whom correspondence should be addressed.
Energies 2020, 13(9), 2253; https://0-doi-org.brum.beds.ac.uk/10.3390/en13092253
Submission received: 20 February 2020
/
Revised: 2 April 2020
/
Accepted: 6 April 2020
/
Published: 4 May 2020
(This article belongs to the Special Issue Selected Papers from XII International Conference on Computational Heat, Mass and Momentum Transfer (ICCHMT2019))
Abstract
:This paper presents the results of the modeling of coal dust gasification using oxygen and steam in a cyclone furnace. The combustion process leads to the release of gas composed mainly of CO and H2. The composition of this gas can be controlled through changes in the content of O2 and H2O in the gasifying agent. It is possible for the process conditions adopted in the study to obtain the CO content at the level of 50% with the content of the gasifying agent O2/H2O of 50/50. In the case of the composition of the gasifying agent O2/H2O of 80/20, the H2 content was 50%. The maximal calorific value of the gas was obtained for O2/H2O 50/50 (11.2 MJ/kg).
1. Introduction
Coal is the basic source of energy generation in many countries. It has been used for the generation of heat, electricity and is more and more often used in the chemical industry. Technologies that allow for the obtaining of combustible gases such as CO, H2 or CH4 through gasification or for obtaining synthetic fuels through liquefaction have been known for many years [1,2,3,4,5]. Coal and processes of coal combustion are often associated with environmental degradation and their contribution to climate change. This is especially noticeable in countries with substantial coal resources, where clean coal technologies should be developed. One of these technologies is the concept and design of a cyclone furnace that allows for the combustion and gasification of coal dust and vitrification of the fly ash [6,7,8,9,10,11,12,13].
2. Cyclone Furnace
The formation of strong eddy flow of gases inside cyclone furnaces enable to carry out efficient combustion or gasification of various solid fuels. Compared to other energy-generating systems, such as e.g., pulverized combustors or fluidized-bed furnaces, the cyclone furnaces are characterized by a relatively small combustion chamber, therefore, substantial thermal load. With this design and strong eddies, combustion processes can occur under conditions that exceed the melting point of the ash contained in the fuel. In this case, apart from the energy function, they can be used as machines for processing/utilization of fly ash that contains a substantial amount of coal. The process of coal combustion in a cyclone furnace using oxygen from air causes high emissions of nitrogen oxides, whereas the use of pure oxygen substantially eliminates that problem. However, oxy-fuel combustion generates temperatures that considerably exceed the thermal strength of the ceramic materials used and thus the temperature has to be controlled by flue gas recirculation, combustion in the sub-stoichiometric conditions (gasification), or injection of water or steam. The control of temperature by fuel gasification and maintaining the sub-stoichiometric conditions inside the cyclone furnace is very interesting from commercial point of view since it allows to obtain combustible CO- and H2-rich gases (the amount of those gases depends on the individual process conditions). These gases can be then directly combusted in pulverized-fuel boilers or used as a valuable substrate in the chemical industry. This paper presents the results of calculations of the gasification of coal dust under conditions of oxy-fuel combustion using the steam.
3. Modeling of the Process of Coal Gasification
The process of coal gasification occurred in a cyclone furnace (Figure 1) composed of two chambers: the upper (PC2) and the lower (PC1) ones [6,7,8,10,11,12,13]. The chamber PC2 is cylindrical and its upper part contains two tangential channels for the pneumatic supply of the fragmented fuel into the gas swirl. There is a plunger in the upper part of the furnace in order to minimize the transport and carryover of fine coal particles. The lower part, PC1, is constructed of several elements with gradually reduced diameters. Each of those elements is equipped with tangential nozzles that allow to supply “driving” gases of various composition into the furnace section PC1 (e.g., O2, H2O, CO2, etc.). Both sections (i.e., PC1 and PC2) are connected with a duct with the internal plunger as shown in Figure 1. As already mentioned the role of the plunger is to separate the gas and solid phase – its presence facilitates the flue gas flow upwards and the fuel flow (carbon residue) downwards from the section PC2 to PC1 (Figure 1). Axially located nozzles enable the supply of various gases with various composition to the chamber PC1.
The idea to split the furnace into two sections (chambers) is interesting since it allows 1/ to heat, dry and gasify various solid fuels in the section PC2, and 2/ carry out coal gasification in the PC1 chamber at various atmospheres (CO2, O2 and H2O) in order to control the composition of the produced gas (various content of CO and H2). Furthermore, such design of the cyclone furnace also provides good conditions for the combustion of some carbon residue in order to generate heat for the maintenance and control of endothermic gasification reactions.
Gambit software was used to create and develop the geometry and the grid used for the computation of the cyclone furnace (Figure 1). The software ANSYS FLUENT 14 was used for the calculation of the gasification process, as well as the hydrodynamics of coal dust flow. The numerical model allows for the computation of the gasification in various atmospheres containing oxygen, carbon dioxide and H2O.
As indicated in Figure 1 the section PC1, i.e., the lower part of the furnace features nozzles that allow for the implementation of the driving medium with oxygen (O2, H2O), whereas the upper part (PC2) contains inlet taps for pneumatical supply of the fuel (coal dust) with CO2 (variant A) or steam (variant B). The central nozzle in the lower part of the chamber PC1 (cf. Figure 1) is used for the supply of the gas mixture (e.g., O2/CH4) into the chamber PC1 and eventual stabilization of the combustion and gasification processes. Apart from that the nozzle may also be used to supply into the furnace some recirculated combustible gases generated during the fuel gasification process.
The calculations of hydrodynamics of gas and fuel flow were carried out applying the Reynolds Stress turbulence model which was also used for the calculation of the geometry of the pre-combustion chamber [6,7,8,10,11,12,13]. The model has been particularly recommended and successfully used for the calculation of strong eddy flows. Discrete Phase Model was used to investigate and model the coal particle flow whereas the combustion of the coal particles was carried out using the Species Transport model, which allows to model and investigate various chemical reactions both in the solid and/or gaseous phases [14,15,16,17,18]. For the calculations a radiation Discrete Ordinate (DO) model was applied.
The mesh tests were conducted for five cell numbers, i.e., 527235, 1243879, 1934781, 2464828 and 2983471. It was found that for the cases of 2464828 and 2983471 cell numbers the relative difference in the value of average velocity was about 0.5%, while the relative difference in the average temperature was roughly 0.7%. The calculations were thus performed for a mesh consisting of 2464828 cells. The calculations of the combustion and gasification of coal dust were carried out as non-stationary (transient). After the initial stage of calculations (flow time approx. 80–85 s), the invariability of selected parameters (velocity, temperature, concentration) was found in the established control planes. Then, while conducting non-stationary calculations, the data were sampled for time statistics for a flow period of 30 s. Time-averaged values of selected parameters are presented in the further part of the current work (Figure 2, Figure 3, Figure 4, Figure 5, Figure 6, Figure 7, Figure 8 and Figure 9).
The calculation of coal combustion and gasification (median diameter 500 µm) were carried out for a chosen fuel characterized by physicochemical parameters shown in Table 1. For simplification purposes, it was assumed that the fuel contains no sulfur. The reaction rate constants for chemical reactions (1)-(7) were taken from the literature [14,15].
For the current calculation we assumed that the combustion and/or gasification of coal dust may be were quite easily described by following seven reactions:
- Reaction of volatile matter combustionx1, x2, y1, y2, y3—stoichiometric coefficientsx1 VM + x2 O2 = y1 CO + y2 H2O + y3 N2
- Reaction of oxidation of carbon oxideCO + 0.5 O2 = CO2
- Reaction of oxidation of fixed carbon (FC)C(s) + 0.5 O2 = CO
- Boudouard’s reactionC(s) + CO2 = 2 CO
- Synthesis of water gasC(s) + H2O = CO + H2
- Hydrogen oxidation reactionH2 + 0.5 O2 = H2O
- Methane oxidation reactionCH4 + 1.5 O2 = CO + 2H2O
For the numerical modeling of the coal gasification it was assumed that 1∙10−3 kg/s of coal dust (mean particle size 500 µm) was introduced tangentially into the furnace via two inlets located at the opposite sides of the chamber PC2 (cf. Figure 1) with a ‘carrier gas’ CO2 (temperature 350 K – variants A) or by means of steam with temperature 900 K (variants B) In both cases the gas velocity was roughly 3 m/s. After being fed into the furnace the fuel particles followed a helical line and moved downwards in the PC2 chamber. The particles were heated, dried and then devolatilized through the effect of the hot flue gas which were contacted with the hot walls of the PC2 chamber. The gasification of fuel particles occurred through the partial combustion of fixed carbon (FC) in the chamber PC1 [6,8,10,11,13]. A set of ‘driving’ nozzles supplied the ‘driving’ gas tangentially to the chamber PC1 with the velocity of 3 m/s and at the temperature of 900 K. The calculations were carried out for the range of molar fractions of O2/H2O in the driving gas from 20% O2 and 80% H2O to 80% O2 and 20% H2O.
The introduction of the driving gas tangentially via the nozzles in the chamber PC1 was necessary to maintain the desired conditions for the eddy movement. The composition of the driving gas was selected in order to achieve the assumed conditions of coal combustion and/or gasification.
The additional central nozzle (located axially in the lower part of the chamber PC1 – cf. Figure 1) was used to supply the mixture of gases with a constant velocity of 10 m/s and with the composition depending on the adopted nozzle operating conditions. These conditions were denoted in the following manner:
- 1—Supplying the gas through the central nozzle; gas composition: 80% O2, 20% CH4, rate: 10 m/s, 350 K;
- 2—Supplying the gas through the central nozzle; gas composition: 80% O2, 20% CO2, rate: 10 m/s, 350 K;
- 3—Lack of gas flow through the central nozzle.
The numerical model used for the current investigations also takes into consideration the heat transfer through furnace walls. The calculation of heat loss took into account the actual thickness of all individual components of the lab-scale pilot furnace and the coefficients of heat penetration and conduction for a given material used. It was assumed that air temperature around the furnace is 300 K.
4. Analysis of the Process of Combustion and Gasification of Coal Dust and Steam
The fuel to the chamber PC2 (cf. Figure 1) was supplied at 3 m/s either by the flow of CO2 (temperature 350 K-case A) or by steam (temperature 900 K-case B). A set of nozzles at the outer surface of the chamber PC1 supplied the hot (temperature 900 K) “driving” gas tangentially at the rate of 3 m/s. The O2 and H2O molar fractions in the gas were between 20/80 and 80/20, respectively.
Depending on the gas content (operating conditions 1, 2 or 3), the nozzle in the lower part of the chamber PC1 is to initialize the process of coal dust combustion or its stabilization. Later, the study presents the results of six variants of the fuel gasification process: A1, A2, A3, B1, B2 and B3. Analysis of the combustion process and coal dust gasification was carried out in two stages:
- Analysis of the distribution of selected process values in two cross-sections of the cyclone furnace for the variant A1 and for one selected content of gas supplied with the driving nozzles O2/H2O 60/40;
- Analysis of the effect of driving gas concentration on the process of combustion and gasification of coal dust for the variants A1, A2, A3, B1, B2 and B3 in two cross-sections at the outlet from the chamber PC1 and PC2.
Figure 2 presents distributions of selected process values for the variant A1 (O2/H2O, 60/40). Due to the paper length the results in Figure 2 are only shown for the variant A1, while the results for other cases (A2, A3, B1, B2 and B3) are presented as average values and compared in Figure 4, Figure 5, Figure 6, Figure 7, Figure 8 and Figure 9. As shown in Figure 2, the driving gas was supplied via the nozzles located in the chamber PC1 (lower chamber). Such gas supply caused the formation of gas and fuel eddies (Figure 2a). With the effect of the centrifugal force, the fuel in the form of the coal dust is accumulated at individual levels of the chamber PC1 (Figure 2b,c). A substoichiometric amount of the oxidant was supplied to the chamber PC1, which is illustrated in Figure 2d. Elevated oxygen content occurs only near the driving nozzles and the lower nozzle (lower part of the chamber PC1). Figure 2e presents distributions of H2O content. Changes in O2 and H2O content near the wall of the chamber PC1 results from the fact that these components take part in the processes of combustion and gasification of fuel present near the chamber PC1. This is confirmed by the distributions of combustion rates for the gasified fuel presented in Figure 2f. Figure 2g,h presents the distributions of temperature near the walls of the chamber and vertical cross-section of the chamber. Analysis of the temperature distribution (Figure 2g reveals that a local increase in temperature resulting from the substoichiometric oxygen content (Figure 2d) occurs only near the outlet from the nozzle (Figure 2d). A process of combustion of the mixture O2/CH4 can be observed in the lower part of the chamber. The temperature field (Figure 2g,h) obtained through combustion and gasification of fuel has an effect on the process of fuel gasification. The distribution of the content of volatile matter is presented in Figure 2i. The highest content of volatile matter can be observed in the upper part of the PC1 chamber. Figure 2j presents distributions of CO2 content. Elevated levels of CO2 can be observed in the lower part of the chamber PC1 and is connected with the combustion of the mixture O2/CH4 and in the upper part of the chamber PC2, where, in the stream of CO2, coal dust was supplied for the variant (A1). In the central part of the chamber PC1, the content of CO2 declined virtually to zero. This is connected with the process of coal dust gasification according to Reaction (4). Therefore, the CO content in the whole cyclone furnace increases to the level of ca. 50%. The presence of steam supplied through the set of nozzles and hot fuel gasified in the chamber PC1 offers conditions for reaction (5) where H2 and CO are obtained. A specific amount of heat and temperature level are needed for the above fuel gasification reaction. In order to ensure such conditions, it is necessary to ensure the combustion of a certain amount of fuel to generate heat that allows for further gasification process.
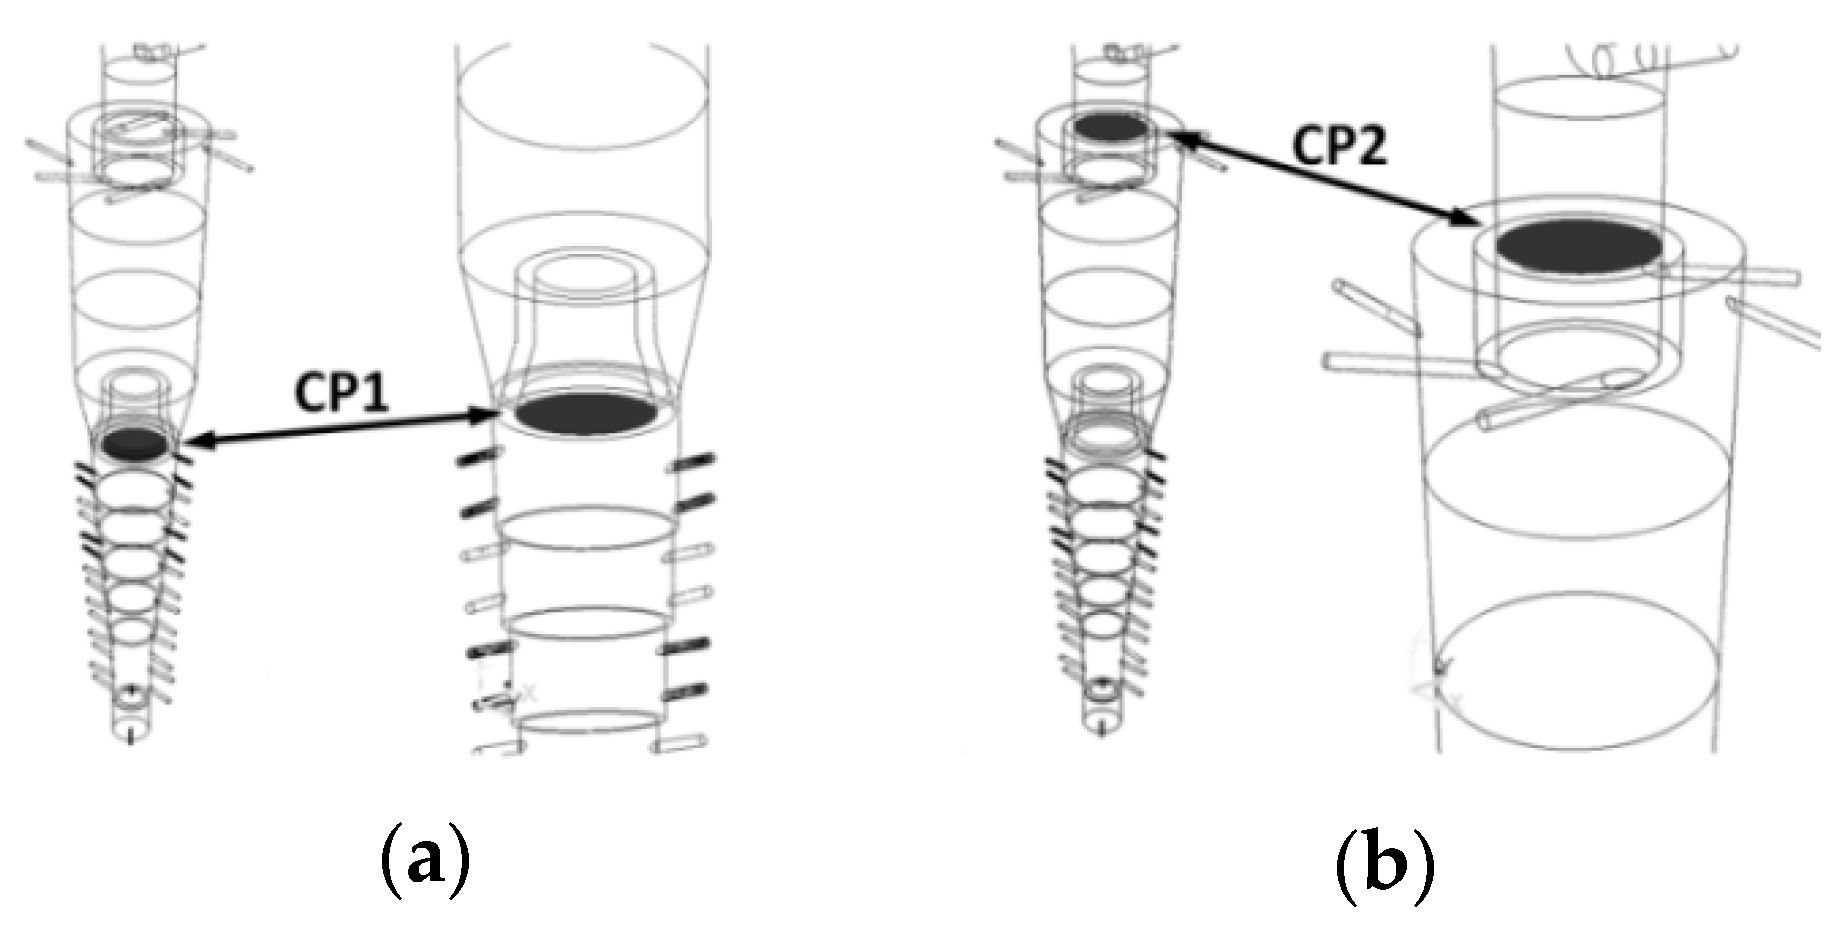
Detailed analysis of the effect of the driving gas composition (content of O2) can be carried out based on the averaged values of selected process parameters (Figure 4, Figure 5, Figure 6, Figure 7, Figure 8 and Figure 9) in the planes located at the outlet from the chamber PC1 (Figure 4, Figure 5, Figure 6, Figure 7, Figure 8 and Figure 9) in the planes located at the outlet from the chambers PC1 (Figure 3a) and PC2 (Figure 3b) denoted as CP1 and CP2, respectively, for the variants A1, A2, A3, B1, B2, B3.
Figure 4 presents averaged values of temperature in the planes CP1 and CP2 with respect to oxygen content for the analyzed variants. It is noticeable (Figure 4a) that the increase in oxygen content in the driving gas allows for obtaining of the temperature at the level of ca. 1400 K at the outlet from the chamber PC1 and ca. 900 K at the outlet from the chamber PC2. However, significant differences in temperatures are not observed for different variants. Relatively low temperatures obtained at the outlet from the chamber PC2 seem to be useful where the product obtained during gasification was used for chemical processes where cooling and cleaning is needed.
Figure 5 presents the averaged values of CO2 content in both analyzed planes CP1 and CP2. It is noticeable for the plane CP1 that the increase in the content of O2 in the driving gas causes a decline in the content of CO2 to zero. This behavior is caused by the increase in temperature, which translates into a direct increase in the rate of conversion of CO2 into CO according to the Reaction (5). The distributions presented in Figure 5b show similar tendencies. However, if the fuel was supplied with the stream of CO2 (variants A) with a relatively low temperature, it was not converted and increased its concentration at the outlet from the cyclone furnace. In the case of the fueling of the cyclone furnace with the stream of H2O (variants B) the level of CO2 at the outlet from the PC2 chamber was around 1%.
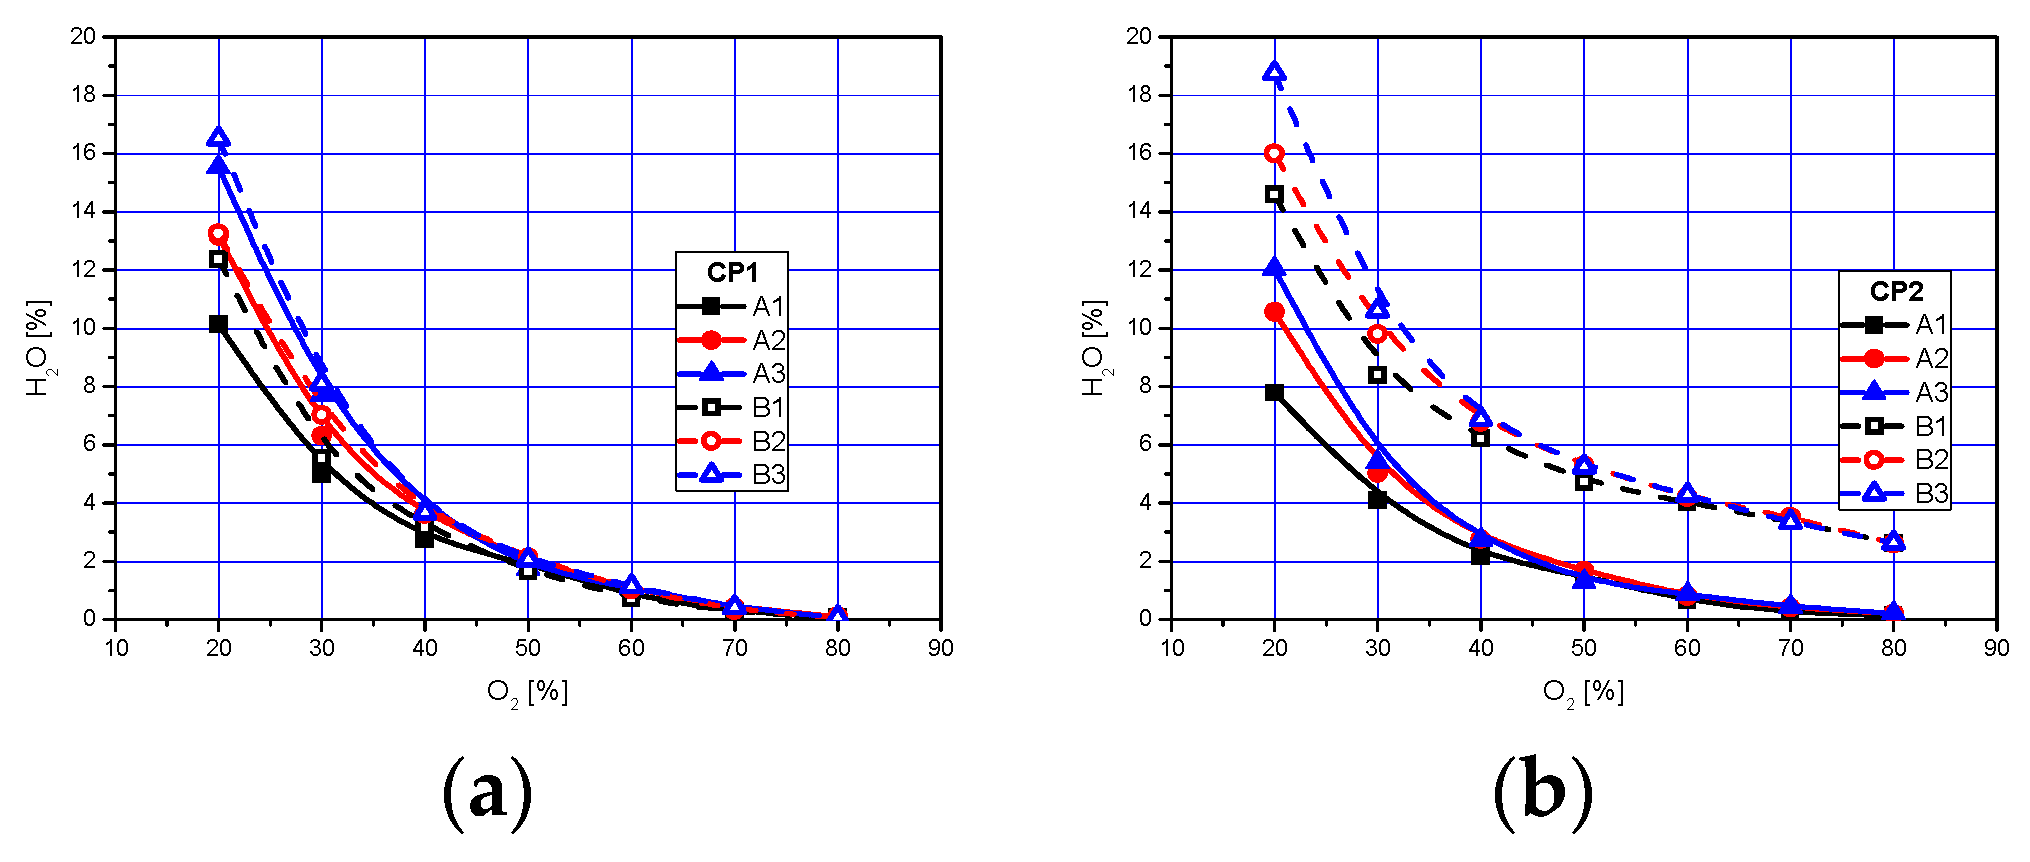
Figure 6 presents averaged values of H2O content at the outlet from the chambers PC1 and PC2. It is noticeable that as the oxygen content increases, H2O decreases in the cross-sections analyzed. On the one hand, these tendencies result from the decreasing stream of the steam supplied to the furnace with the increase in oxygen content. On the other hand, the increase in temperature (Figure 4) leads to an increase in reaction speed (Reaction 5). If the fuel is supplied in the stream of steam (variants B), the level of H2O higher by ca. 7% can be observed in the stream leaving the cyclone furnace compared to variants (A) for low contents of O2. Furthermore, for high contents of O2, the difference between variants A and B is at the level of around 3%.
The supply of the mixture of O2 and H2O to the chamber PC1 in the presence of the fuel results in its gasification. This is supported by the distribution of CO and H2 contents presented in Figure 7 and Figure 8, respectively, with respect to oxygen content in the driving gas. Analysis of Figure 7 reveals the maximum CO content for the driving gas with the composition of O2/H2O 50/50 for all the variants used in the study. Slightly higher values are obtained for the variant B when fuel is supplied with the stream of steam. It is possible to obtain the maximal content of CO at the outlet from the chamber PC2 ranging from 48% to 53% for the adopted process conditions.
Furthermore, the analysis of the results presented in Figure 8 demonstrates that the increase in oxygen content in the driving gas has a substantial effect on H2 content at the outlet from the chambers PC1 and PC2. A smaller stream of H2O is supplied to chamber PC1 as the oxygen content in chamber PC1 increases. However, the increase in oxygen content in the driving gas causes an increase in the temperature in the chamber PC1 (Figure 4). An increase in the reaction speed occurs in this case (Reaction 5), which is noticeable as a decline in H2O content (see Figure 6) and a noticeable increase in H2 (Figure 8). Furthermore, it is possible to obtain the H2 content ranging from 42% to 47% for the analyzed process conditions at the outlet from the chamber PC2. Higher H2 contents were obtained for variants B.
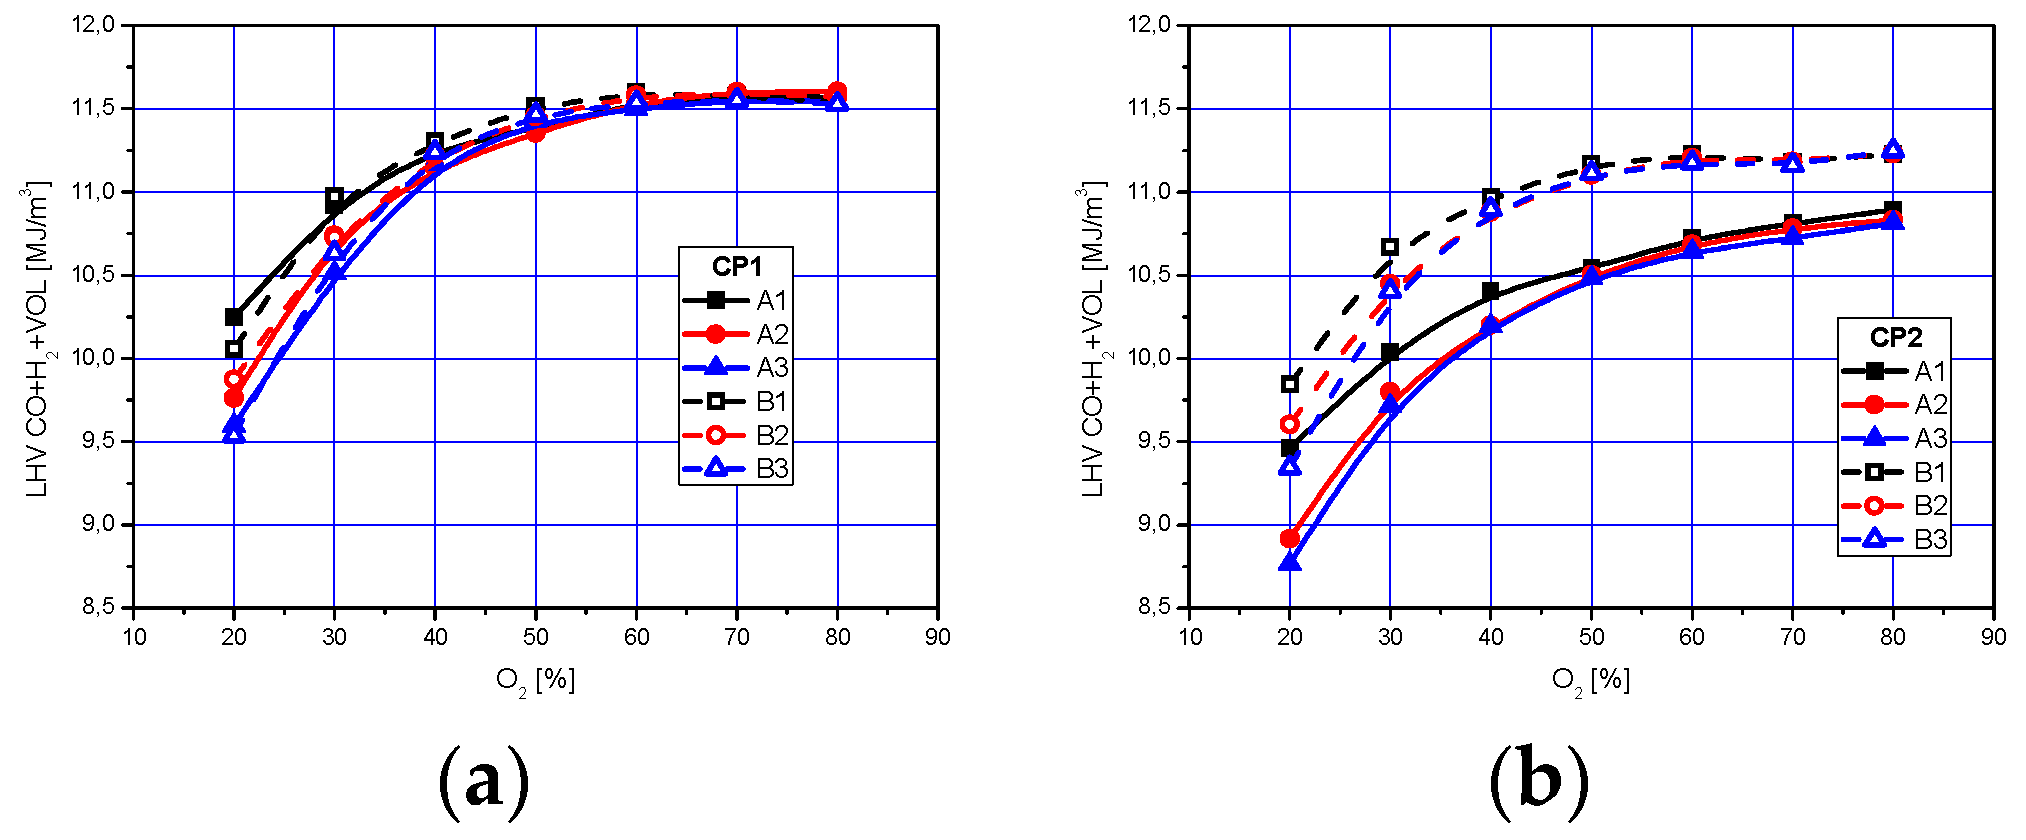
Distributions of the calorific value in the gases leaving the PC1 and PC2 chamber were determined based on the contents of combustible gases (VM, CO and H2). The results are presented in Figure 9. It is noticeable that as the oxygen content rises, the calorific value obtained through gasification increases. The highest increase in the calorific value is noticeable for the range of oxygen contents in the driving gas in the range of from 20% to 50%. A further increase in O2 content of the driving gas does not cause any changes in calorific value. With an O2 concentration of 20%, the differences in calorific value of the gas generated are noticeable, with these changes resulting probably from unsteady conditions of the gasification process observed for the lower temperatures in the chamber PC1 (Figure 4). From the standpoint of maximization of the calorific value of the gas leaving the cyclone furnace (Figure 9b), it is useful to supply fuel in the stream of steam (variants B) as it is possible to increase the calorific value of the gas by ca. 0.5 MJ/kg to the level of ca. 11.2 MJ/kg for O2 contents starting from 50% to 60%.
5. Conclusions
As presented in this study, the proposed cyclone furnace where the internal “swirl” was the result of the supply of a driving gas composed of O2 and H2O allowed to carry out the gasification of coal dust and control the hydrodynamics and composition of the produced gas within a wide range.
Depending on the process parameters (mainly the content of oxygen in the flue gas and the method of fuel supply), it was possible to increase the concentration of CO in the flue gas from slightly over 40% up to almost 60% (Figure 7). Depending on the variant of fuel gasification (A1–A3 and B1–B3) the concentration of CO could vary by roughly 5% to 10%.
As shown in Figure 8 the amount of hydrogen in the flue gas could also be controlled over a wide range (25% to 50%) depending on the composition of the driving gas. The investigation results also indicated that the proposed cyclone furnace design provided quite flexible conditions for solid fuel gasification and the generation of gas with desired chemical composition tailored to the requirements of a particular technological process. As shown in Figure 9, the low heating value of the gas could vary by almost 30%. The variant of fuel gasification (A1–A3, B1–B3) affected the gas LHV particularly for lower content of oxygen in the driving gas (Figure 9a).
An advantage of the investigated cyclone furnace was also the possibility to produce the desired gas with a relatively low process temperature (900 K–cf. Figure 4) thus facilitating the transport and eventual further processing of the gas.
From the standpoint of the use of the gas for power generation, the calculation results indicated (cf. Figure 9) that it would be possible to obtain maximum calorific value gas for oxygen content in the driving gas even at 50%. Such gas could be then efficiently used and combusted e.g., in pulverized-fuel boilers, particularly during cheaper night pricing periods, thus maintaining the furnace in ‘hot standby’ without the need to use the main oil-fired furnace burners.
From the presented results it may also be concluded that steam gasification of fuel requires the maintenance of the desired temperature levels in the cyclone furnace—those may be achieved by the combustion of some part of the fuel or the supply of heat from external sources (transported by e.g., superheated steam).
It must be emphasized that in order to meet the current strict standards for the emission of pollutants from coal processing industrial application and operation of the proposed cyclone furnace should be carried out in combination with the required flue gas treatment devices. The results from the authors’ 50 kW experimental lab-scale pilot facility were quite promising and indicated that the emissions of SO2, NOx could be significantly reduced and the majority of coal mineral matter was discharged in the form of slag. The results are actually under preparation by the authors and are planned to be published in a separate paper.
Author Contributions
Conceptualization, R.Z. and J.J.; methodology, R.Z. and R.K.; software, R.Z.; validation, R.Z., J.J. and R.K.; formal analysis, R.Z. and R.K.; investigation, R.Z. and R.K.; data curation, J.J.; writing—original draft preparation, R.Z., J.J. and R.K.; writing—review and editing, R.Z. and R.K.; visualization, R.Z., J.J. and R.K.; supervision, R.Z. and R.K.; project administration, R.Z.; funding acquisition, R.Z. All authors have read and agreed to the published version of the manuscript.
Funding
The results presented in the paper were obtained in a project co-financed by NCBR within the contract No. BIOSTRATEGG3/345940/7/ NCBR/2017 ‘Water in soil: satellite monitoring to improve water retention using biochar’ (project acronym: SoilAqChar). The scientific research was also co-funded by the statute subvention of Czestochowa University of Technology, Faculty of Infrastructure and Environment.
Conflicts of Interest
The authors declare no conflict of interest.
References
- Osborne, D. The Coal Handbook: Towards Cleaner Production, Volume 2: Coal Utilisation; Woodhead Publishing Series in Energy: Oxford, UK, 2013. [Google Scholar]
- Bell, D.; Towler, B.; Fan, M. Coal Gasification and Its Applications; Elsevier: London, UK, 2010. [Google Scholar]
- De, S.; Agarwal, A.K.; Moholkar, V.S.; Thallada, B. Coal and Biomass Gasification, Recent Advances and Future Challenges; Springer: Singapore, 2018. [Google Scholar]
- Smoot, L.D.; Smith, P.J. Coal Combustion and Gasification; Plenum Press: New York, NY, USA, 1985. [Google Scholar]
- Rezaiyan, J.; Cheremisinoff, N.P. Gasification Technologies: A Primer for Engineers and Scientists; CRC Press Taylor & Francis Group: Boca Raton, FL, USA, 2005. [Google Scholar]
- Zarzycki, R.; Bis, Z. Modelling of the process of coal dust combustion in a cyclone furnace. J. Therm. Sci. 2017, 26, 192–198. [Google Scholar] [CrossRef]
- Zarzycki, R. Pulverized Coal Gasification with Steam and Flue Gas. In Proceedings of the MATEC Web of Conferences 240, Cracow, Poland, 21–24 May 2018; p. 05036. [Google Scholar]
- Zarzycki, R.; Bis, Z. Analysis of Coal Dust Combustion and Gasification in the Cyclone Furnace. In Proceedings of the E3S Web of Conferences 13, Cracow, Poland, 12–14 October 2016; p. 05003. [Google Scholar]
- Zarzycki, R. Swirl Chamber for Vitrification of Fly Ashes. In Proceedings of the E3S Web of Conferences 13, Cracow, Poland, 12–14 October 2016; p. 05004. [Google Scholar]
- Zarzycki, R.; Bis, Z. Modelling of Coal Dust Gasification in a Cyclone Furnace under Oxy-fuel Combustion Conditions. Procedia Eng. 2016, 157, 480–487. [Google Scholar] [CrossRef] [Green Version]
- Zarzycki, R.; Bis, Z.; Kobyłecki, R. The Concept of Coal Burning in a Cyclone Furnace. Procedia Eng. 2016, 157, 472–479. [Google Scholar] [CrossRef] [Green Version]
- Zarzycki, R.; Wichliński, M. Cyclone Furnace as a Way for Mercury Removal from Lignite. In Proceedings of the MATEC Web of Conferences 240, Cracow, Poland, 21–24 May 2018; p. 05037. [Google Scholar]
- Zarzycki, R.; Jędras, J.; Kobyłecki, R. Fuel Processing in a Swirl Flow: Numerical Modelling of Combustion and Gasification. In Proceedings of the E3S Web of Conferences Volume 137, Warsaw, Poland, 3–6 December 2019; p. 01052. [Google Scholar]
- Toporov, D.; Bocian, P.; Heil, P.; Kellermann, A.; Stadler, H.; Tschunko, S.; Förster, M.; Kneer, R. Detailed investigation of a pulverized fuel swirl flame in CO2/O2 atmosphere. Combust. Flame 2008, 155, 605–618. [Google Scholar] [CrossRef]
- Vascellari, M.; Cau, G. Numerical Simulation of Pulverized Coal Oxycombustion with Exhaust Gas Recirculation. In Proceeding of CCT2009 Fourth International Conference on Clean Coal Technologies, Dresden, Germany, 18–21 May 2009. [Google Scholar]
- Chen, L.; Gazzino, M.; Ghoniem, A.F. Characteristics of Pressurized Oxy-coal Combustion under Increasing Swirl Number. In Proceedings of the 35th International Technical Conference on Coal Utilization & Fuel Systems, Clearwater, FL, USA, 6–10 June 2010. [Google Scholar]
- Warzecha, P.; Bogusławski, A. Symulacje numeryczne spalania pyłu węglowego w atmosferze O2-CO2. Arch. Spalania 2012, 12, 145–151. [Google Scholar]
- ANSYS Fluent Theory Guide. Available online: https://www.scribd.com/doc/140163341/Ansys-Fluent-14-0-Theory-Guide (accessed on 5 February 2020).

Figure 2.
Distributions of selected process parameters during fuel gasification in the cyclone furnace for the variant A1 (O2/H2O, 60/40): (a) peripheral speed, (b) fuel content on the internal walls, (c) fuel content in the cross-section, (d) content of O2, (e) content of H2O, (f) fuel combustion rate, (g) temperature on the walls, (h) temperature in the vertical section, (i) volatile matter content, (j) content of CO2, (k) content of CO, (l) content of H2.

Figure 3.
Location of the control planes CP1 and CP2 at the outlet from the chambers PC1 (a) and PC2 (b).
Figure 3.
Location of the control planes CP1 and CP2 at the outlet from the chambers PC1 (a) and PC2 (b).

Figure 4.
Changes in averaged values of temperature in the planes CP1 (a) and CP2 (b) for variants A1, A2, A3, B1, B2, B3.
Figure 4.
Changes in averaged values of temperature in the planes CP1 (a) and CP2 (b) for variants A1, A2, A3, B1, B2, B3.

Figure 5.
Changes in averaged values of molar fractions of CO2 in the planes CP1 (a) and CP2 (b) with respect to oxygen concentration for variants A1, A2, A3, B1, B2, B3.
Figure 5.
Changes in averaged values of molar fractions of CO2 in the planes CP1 (a) and CP2 (b) with respect to oxygen concentration for variants A1, A2, A3, B1, B2, B3.

Figure 6.
Changes in averaged values of molar fractions of H2O in the planes CP1 (a) and CP2 (b) with respect to oxygen concentration for variants A1, A2, A3, B1, B2, B3.
Figure 6.
Changes in averaged values of molar fractions of H2O in the planes CP1 (a) and CP2 (b) with respect to oxygen concentration for variants A1, A2, A3, B1, B2, B3.

Figure 7.
Changes in averaged values of molar fractions of CO in the planes CP1 (a) and CP2 (b) with respect to oxygen concentration for variants A1, A2, A3, B1, B2, B3.
Figure 7.
Changes in averaged values of molar fractions of CO in the planes CP1 (a) and CP2 (b) with respect to oxygen concentration for variants A1, A2, A3, B1, B2, B3.

Figure 8.
Changes in averaged values of molar fractions of H2 in the planes CP1 (a) and CP2 (b) with respect to oxygen concentration for variants A1, A2, A3, B1, B2, B3.
Figure 8.
Changes in averaged values of molar fractions of H2 in the planes CP1 (a) and CP2 (b) with respect to oxygen concentration for variants A1, A2, A3, B1, B2, B3.

Figure 9.
Changes in averaged values of LHV in the planes CP1 (a) and CP2 (b) with respect to oxygen concentration for variants A1, A2, A3, B1, B2, B3.
Figure 9.
Changes in averaged values of LHV in the planes CP1 (a) and CP2 (b) with respect to oxygen concentration for variants A1, A2, A3, B1, B2, B3.


Table 1.
Proximate and ultimate analysis results of the fuel used for the current simulations (the values refer to a ‘dry’ state).
Table 1.
Proximate and ultimate analysis results of the fuel used for the current simulations (the values refer to a ‘dry’ state).
| Technical Analysis | [-] | Elemental Analysis | [-] |
|---|---|---|---|
| VM (volatile mater) | 0.45 | C | 0.85 |
| FC (fixed carbon) | 0.45 | H | 0.1 |
| A (ash) | 0.05 | O | 0.04 |
| M (moisture) | 0.05 | N | 0.01 |
© 2020 by the authors. Licensee MDPI, Basel, Switzerland. This article is an open access article distributed under the terms and conditions of the Creative Commons Attribution (CC BY) license (http://creativecommons.org/licenses/by/4.0/).
Share and Cite
MDPI and ACS Style
Zarzycki, R.; Jędras, J.; Kobyłecki, R. Gasification of Coal Dust in a Cyclone Furnace in an O2/H2O Atmosphere. Energies 2020, 13, 2253. https://0-doi-org.brum.beds.ac.uk/10.3390/en13092253
AMA Style
Zarzycki R, Jędras J, Kobyłecki R. Gasification of Coal Dust in a Cyclone Furnace in an O2/H2O Atmosphere. Energies. 2020; 13(9):2253. https://0-doi-org.brum.beds.ac.uk/10.3390/en13092253
Chicago/Turabian StyleZarzycki, Robert, Justyna Jędras, and Rafał Kobyłecki. 2020. "Gasification of Coal Dust in a Cyclone Furnace in an O2/H2O Atmosphere" Energies 13, no. 9: 2253. https://0-doi-org.brum.beds.ac.uk/10.3390/en13092253
Note that from the first issue of 2016, this journal uses article numbers instead of page numbers. See further details here.