
The Synergy of Two Biofuel Additives on Combustion Process to Simultaneously Reduce NOx and PM Emissions


1
Faculty of Mechanical Engineering, Cracow University of Technology, 31-571 Cracow, Poland
2
Oil and Gas Institute—National Research Institute, 31-503 Cracow, Poland
3
Dagas Sp. z o.o., 05-660 Warka, Poland
*
Author to whom correspondence should be addressed.
Energies 2021, 14(10), 2784; https://0-doi-org.brum.beds.ac.uk/10.3390/en14102784
Submission received: 14 April 2021
/
Revised: 6 May 2021
/
Accepted: 7 May 2021
/
Published: 12 May 2021
(This article belongs to the Special Issue Renewable Fuels for Internal Combustion Engines)
Abstract
:The article presents the results of research on the influence of two fuel additives that selectively affect the combustion process in a diesel engine cylinder. The addition of NitrON® reduces the concentration of nitrogen oxides (NOx), due to a reduction in the kinetic combustion rate, at the cost of a slight increase in the concentration of particulate matter (PM) in the engine exhaust gas. The Reduxco® additive reduces PM emissions by increasing the diffusion combustion rate, while slightly increasing the NOx concentration in the engine exhaust gas. Research conducted by the authors confirmed that the simultaneous use of both of these additives in the fuel not only reduced both NOx and PM emissions in the exhaust gas but additionally the reduction of NOx and PM emissions was greater than the sum of the effects of these additives—the synergy effect. Findings indicated that the waveforms of the heat release rate (dQ/dα) responsible for the emission of NOx and PM in the exhaust gas differed for the four tested fuels in relation to the maximum value (selectively and independently in the kinetic and diffusion stage), and they were also phase shifted. Due to this, the heat release process Q(α) was characterized by a lower amount of heat released in the kinetic phase compared to fuel with NitrON® only and a greater amount of heat released in the diffusion phase compared to fuel with Reduxco® alone, which explained the lowest NOx and PM emissions in the exhaust gas at that time. For example for the NOx concentration in the engine exhaust: the Nitrocet® fuel additive (in the used amount of 1500 ppm) reduces the NOx concentration in the exhaust gas by 18% compared to the base fuel. The addition of a Reduxco® catalyst to the fuel (1500 ppm) unfortunately increases the NOx concentration by up to 20%. On the other hand, the combustion of the complete tested fuel, containing both additives simultaneously, is characterized, thanks to the synergy effect, by the lowest NOx concentration (reduction by 22% in relation to the base). For example for PM emissions: the Nitrocet® fuel additive does not significantly affect the PM emissions in the engine exhaust (up to a few per cent compared to the base fuel). The addition of a Reduxco® catalyst to the fuel greatly reduces PM emissions in the engine exhaust, up to 35% compared to the base fuel. On the other hand, the combustion of the complete tested fuel containing both additives simultaneously is characterized by the synergy effect with the lowest PM emission (reduction of 39% compared to the base fuel).
1. Introduction
In the case of diesel engines, the emission of carbon monoxide (CO) and unburned hydrocarbons (HCs) does not pose a serious threat due to the high conversion efficiency of the commonly used oxidation reactors [1]. The situation is different for the emission of nitrogen oxides (NOx) and particulate matter (PM). The mechanism of NOx and PM formation in the engine cylinder shows that if one specific design (structure) [2], control or fueling method reduces NOx emissions, it simultaneously increases PM emissions in the engine exhaust gas and vice versa. For this reason, different ways are used to reduce NOx emissions in the exhaust gas and different techniques are used to reduce PM emissions [3]. The impact of design, control and post-process methods used in diesel engines to control the composition of exhaust gases is the main challenge for designers and researchers of internal combustion engines in all important research centers and laboratories in the world. The result of these works is a relatively well-known area of the tendency in the development of internal combustion engines described in numerous publications (including [4,5,6,7,8,9,10,11]). A similar situation concerns the influence of dual-fuel supply of internal combustion engines and the mixing of various unconventional fuels on the composition of exhaust gases (eg. [12,13,14,15,16,17,18,19,20,21,22,23,24,25]). The analysis of the tests of these parameters is omitted in this publication because it concerns only the influence of diesel engine biofuel additives, and in particular the beneficial synergy of their simultaneous application on the simultaneous reduction of NOx and PM emissions. The principle says that if we reduce NOx emissions with one method, unfortunately we will increase PM emissions in the exhaust gas - this rule also applies to fuel additives. Some types of fuel additives that reduce the auto-ignition delay and the combustion rate in the kinetic phase (dQk/dα) are used to reduce NOx emissions in the exhaust gas. Other types of fuel additives that increase the combustion rate in the diffusion phase (dQd/dα) are used to reduce PM emissions [3,26,27,28,29]. The main advantage of modifying the course of the heat release rate with fuel additives is the fact that they selectively affect individual dQ/dα phases, corresponding to the kinetic or diffusion part of the combustion process, without significantly affecting the average combustion rate. Furthermore, the change in the maximum rate of kinetic or diffusion combustion is also associated with a different course of dQ/dα as a function of the combustion time (engine crankshaft rotation angle). The authors of this publication hypothesized that the simultaneous application of a fuel additive that reduces the kinetic combustion rate and an additive that increases the diffusion combustion rate, with a simultaneous shift in the phase of dQ/dα waveforms, may lead to a favorable synergy phenomenon. The synergy phenomenon consists of combining the action of several components or processes in such a way that the obtained effect is stronger than the theoretical sum of the actions of the individual components. In the case of using a package containing both analyzed additives, the synergy phenomenon should lead to a positive enhancement of the effect. This effect would consist in reducing the kinetic combustion rate to an even greater extent than for the additive itself that reduces dQk/dα. Though it should be noted that the additive increasing of dQd/dα yields a slight increase in dQk/dα. This is due to the superimposition of the heat release rate curves for the dQk/dα reducing additive and the dQd/dα increasing additive being shifted as a function of the angle of rotation of the engine crankshaft.
An additional argument for the simultaneous use of both analyzed fuel additives, which reduce both NOx and PM emissions, is the fact that the European Union intends to introduce the obligatory use of 10% (instead of the current 7%) of bio-additive to diesel fuel in the form of rapeseed oil methyl esters (RME) [30]. Multiple studies indicate increasing the RME content in fuel is associated with several negative effects related to both the combustion process and the use of these fuels. In practice, this is relevant to several problems, including the stability of such fuel, the tendency to form deposits inside the engine cylinders, and increased emission of NOx in the exhaust gas. For this reason, in the presented research, an additive increasing of the cetane number of the fuel was also used. This contributed to reducing the kinetic combustion rate as well as providing stabilizing and detergent additives. Neither the stabilizing nor the washing additives affect the fuel combustion process. The additive package prepared in this way is particularly advantageous for diesel fuels with increased content of biocomponents. Therefore, in the conducted tests, the base fuel (reference fuel) had a content of 10% RME—B10 (instead of B7 fuel).
The research presented aimed to confirm the validity of the hypothesis regarding the synergy of both additives in laboratory conditions using a diesel engine. This synergy ultimately led to the enhancement of NOx reduction to an even greater extent than for the additive itself, reducing dQk/dα while maintaining lower PM emissions in the exhaust gas compared to the base fuel by increasing dQd/dα.
2. Research Methodology
2.1. Characteristics of the Fuels Used
For the reasons mentioned above, the base (reference) fuel was diesel oil containing 10% (v/v) of RME, the basic physical and chemical parameters of which are presented in Table 1.
The B10 fuel was upgraded with three groups of additives:
- (1)
- NitrON® is a detergent-dispersing package with a Nitrocet 50® additive, involved in the formation of free radicals in the region of low-temperature and indirect diesel oxidation B10 [32]. The main task of this component from the research point of view was to increase the cetane number of the fuel (from LC = 52.3 for the B10 fuel to LC = 58 after fuel upgrading). As a result, the use of this fuel additive package allowed reduction of the combustion rate in the kinetic phase. Nitrocet 50® is, in the chemical sense, 2-ethylhexyl nitrate (2-EHN) with the summary chemical formula: C8H17ONO2. The concentration of the NitrON® package in the refined fuel (fuel with an additive reducing the kinetic combustion rate—fuel marking: DFKA) was 1500 ppm, including 50 ppm of detergent-dispersing additives.
- (2)
- Reduxco® is a catalyst that is a reaction product of acetic acid, iron, n-butanol, n-propanol, and isopropanol [30]. Traces of iron compounds that were involved in the production technology of the Reduxco® catalyst are removed from the final product in such a way that the chemical composition of Reduxco® complies with Worldwide Fuel Charter, sixth edition, on gasoline and diesel fuel from 28 October 2019 [33]. Reduxco® catalyst in fuel, according to the manufacturer’s data, causes a decrease in the activation energy of the HC fuel oxidation reaction as well as the formation of additional OH groups, which together allow the combustion rate to increase and facilitate the afterburning of the already formed PM in the engine cylinder. In the current research, the concentration of the Reduxco® catalyst in the diesel fuel (fuel with an additive increasing the diffusion combustion rate—fuel designation: DFDA) was 1500 ppm.
- (3)
- The sum of the NitrON® package (1500 ppm) and the Reduxco® catalyst (1500 ppm), a test fuel denoted as DFΣ.
In earlier research projects, the authors tested both the Nitrocet 50® additive (made by the Oil and Gas Institute) and the Reduxco® liquid catalyst (by Dagas) as separate additives [31,34,35]. These research development projects resulted in a quantitative and qualitative change in both the Nitrocet 50® and Reduxco® additive packages. In the project [31] carried out by the authors of this publication, Nitrocet 50® was included in the Innocet® package. Through multi-stage research, a new version of the Innocet® package was created with a different chemical composition, and it, therefore, has a different impact on the combustion process. The new proprietary name of this package is NitrON®. Similarly, the successive stages of previous research for Dagas [34,35], described in Cisek et al. [30], led to a quantitative and qualitative change of the Reduxco® additive to the form in which it was used in the research project [36]. The new version of Reduxco®, in line with the latest Worldwide Fuel Charter edition, no longer contains any metal-based additives. Therefore, it should be emphasized that firstly, the research results described in Cisek et al. [30,32] refer to slightly different additives (in the chemical sense), and they were not added simultaneously. Thus, this publication is not an extension of the previous work [30,32]. Secondly, the main task of this publication is to demonstrate the existence of a beneficial effect of the simultaneous use of both fuel additives. Through the synergy phenomenon, simultaneous use leads to an even greater reduction in the kinetic combustion rate (reduction of NOx concentration in the exhaust gas) and an even greater increase in the amount of heat in the diffusion phase (reduction of PM in exhaust gas) than for these additives used separately. For the above reasons, this publication presents an analysis of research results that have not been previously published.
2.2. Measurement Stand
The engine tests of the tested fuels were carried out in the Combustion Engine laboratory of the Cracow University of Technology. For each of the fuels, a Volkswagen 1.9 TDI 4-cylinder diesel engine (AJM version, manufacturer: Volkswagen, Wolfsburg, Germany) was used with the technical characteristics presented in Table 2. Each of the four fuels used allowed for the determination of five groups of engine parameters against the load characteristics of the engine (at a constant rotational speed of the maximum torque):
- (1)
- Energy parameters of the engine (fuel consumption, total efficiency of diesel engine)—AVL fuel balance, manufacturer: AVL, Graz, Austria
- (2)
- Composition of exhaust gases (concentration of CO, HC, NOx, smoke, and PM)—AVL bench emission system CEB II, AVL smoke meter, dilution tunnel (DT), manufacturer: AVL, Graz, Austria
- (3)
- Parameters of engine systems (e.g., start of fuel injection, temperature, and pressure of air after turbocharger, temperature of exhaust gases, and percent of exhaust gas recirculation [EGR])—VCDS Diagnostic System, manufacturer: Ross-Tech LLC, Lansdale, USA and external sensors
- (4)
- Parameters of indicator diagrams (e.g., start of self-combustion, maximum rate of combustion pressure, and maximum of combustion pressure)—AVL Indimeter 617D, manufacturer: AVL, Graz, Austria
- (5)
- Parameters of heat release diagrams (e.g., maximum of kinetic and diffusion heat release and end of combustion)-AVL software, manufacturer: AVL, Graz, Austria.
The measuring stand shown in Figure 1 was used to carry out the research. The photos in Figure 2, Figure 3, Figure 4 and Figure 5 show selected basic modules of this test stand. The VW 1.9 TDI engine used in the tests was connected with the Schenck engine dynometer (12) with a module (3). The fuel consumption was measured by the AVL Fuel Balance mass computer fuel meter. The air temperature and the exhaust gas temperature were measured by standard sensors and thermocouples and read by the bench control system (2). Parameters of engine operation were read with the VCDS Diagnostic System (1). The concentration of exhaust fumes components (CO, HC, NOx, O2, CO2) was measured by the AVLCEBII System (19). The sample was taken with a probe compliant with ISO [37], heated by the exhaust gas sampling path, and was directed to the sampling condition unit. In this module, an integral part of CEBII, the exhaust gas floated to the heated CLD unit (NOx) and the heated FID unit (HC). The exhaust gas floated to NDIR analyzers (O2, CO2, and CO concentration) and was cooled to 4 °C.
Smoke opacity was analyzed by a filtration test with the AVL Smoke Meter System (11). The PM emission measurement was carried out with the following standards [37], using the DT (28). The dilution ratio (DR) varies from 4 to 10. Thanks to the set of filters (mechanical and chemical) (21), the air was cleaned of dust and HC background so that it would not affect the result of the determined PM emission. In the heat exchanger (22), the air temperature was controlled so that the temperature of the exhaust fumes mixed with the air did not exceed 52 °C, in accordance with [37]. The co-current probe (25) introduced the exhaust sample into the air in the DT, and the orifice (24) ensured that the exhaust fumes mixed thoroughly with the air. At a length of 10 diameters of the DT, the probe (29) drew a strictly specified number of liters of diluted exhaust fumes per packet (30) through two PALL measuring filters (fiberglass coated with Teflon). These filters were seasoned before and after PM measurement. The filter mass was measured by a special MicroBalance (27) (with an accuracy of 0.001 mg). The fast-changing pressure in the engine cylinder was measured (by piezo-quartz pressure sensor (39)) as a function of the crankshaft angle (by an AVL optical angle encoder (9)). These sensors were connected to the AVL Indimeter 617D (37), which was used to the analysis of indicator charts. This data was also used to calculate the rate of heat release (dQ/dα) [38,39,40], which was the basis for the analysis of the correlation between the kinetic-diffusion combustion phase and NOx-PM emissions.
Measurement accuracy for energy parameters and exhaust gas composition as well as parameters of indicator diagrams (e.g., maximum combustion pressure, self-ignition start, auto-ignition delay, etc.) and parameters of heat release rate diagrams, e.g., maximum kinetic/diffusion combustion speed, end of combustion, etc.) results from both from the accuracy class of the measuring instruments used (in direct and indirect measurements) and from the natural fluctuations that affect the successive cycles of the piston internal combustion engine operation. Due to the already long text of this publication, a table with error values is not included here. Uncertainties analysis for experiments conducted in the research covered by this publication can be found in the research report [36]. Pictures of selected modules of a stand used in the test are presented below.
3. Research Results and Analysis
As described in Section 2.1, the engine used in the tests was consecutively fed one of the four fuels within the load characteristics of the engine (constant rotational speed corresponding to the maximum torque of the engine and variable load during the tests). The base (reference) fuel was B10 diesel oil (indicated as DF and marked blue both in the text and in the graphs). The test fuels were as follows: B10 diesel oil with the NitrON® additive, reducing the combustion rate in the kinetic phase (indicated as DFKA and marked green); B10 diesel oil with the addition of Reduxco®, increasing the combustion rate in the diffusion phase (indicated as DFDA and marked brown); and finally, the complex test fuel was B10 diesel oil with the addition of both NitrON® and Reduxco® (indicated as DFΣ and marked red).
3.1. Energy Parameters
The basic energy parameters of a given internal combustion engine are hourly fuel consumption (Gf) and specific fuel consumption (gf) as well as overall efficiency (ηo). The effect of engine load on hourly fuel consumption (Gf) for the base fuel (DF) and complex test fuel (DFΣ) is shown in Figure 6a. Since the impact of engine load on the change in the Gf value is many times greater than the impact of the fuels used in the research, for this reason in the Figure 6b is shown the values of the percentage reduction in hourly consumption of test fuels in relation to the hourly consumption of base fuel (in such configuration, the differences in Gf values resulting from the influence of tested fuel additives are better visible).
The data in this graph shows that, over the entire engine load range, the use of Reduxco® fuel reduced fuel consumption (Gf) compared to conventional diesel fuel. For a low engine load, this difference was relatively small—about 1%. However, for an engine load greater than 175 Nm, the relative reduction in the Gf value began to assume significantly higher values. For the highest engine torque used in the tests (To = 250 Nm), the use of the test fuel reduced the hourly fuel consumption by 4% compared to the base fuel. The situation was different for fuel with Nitrocet® additive. At lower engine loads (up to 150 Nm in this case or approximately 50% of the maximum load), the addition of Nitrocet® caused a slight increase in fuel consumption. Only after exceeding the engine load associated with closing the EGR valve, the beneficial effect of Nitrocet® on the reduction of fuel consumption in relation to the base fuel was observed. At the maximum engine load, the reduction in consumption of this fuel was almost 3% and was only slightly less than the reduction in Gf for the Reduxco® fuel. The complex test fuel was notably characterized by much lower fuel consumption in relation to the base fuel in the entire engine load range than both tested fuels with the additives used separately.
The conclusions resulting from the analysis of hourly fuel consumption (Gf) for the tested fuels (at constant rotational speed and engine load) were clearly the same as the conclusions concerning the overall efficiency (ηo) of the engine.
In addition to the basic energy parameters, the parameters that allowed the control of the engine’s operation were also measured. The data in Figure 7a shows that the exhaust gas temperature of the engine powered by the complex test fuel was significantly lower (over 100 °C for high engine torque) than the exhaust fumes temperature for the base fuel. Such a large difference in exhaust fumes temperature in favor of the complex test fuel DFΣ did not result only from the differences in the then lower value of the hourly fuel consumption (Figure 7a).
The reason may have been that the fuel combustion process ended earlier in the engine cylinder [41]. This circumstance is advantageous because the earlier end of combustion and the lower temperature of the exhaust fumes reduce the loss of energy entrained with the exhaust gas. This increases the amount of energy that can be converted in the engine cylinder for technical work [42]. Alternatively, the earlier ending of the combustion process with the same start of injection of both fuels may have been due to the earlier start of fuel self-ignition, which allows the entire combustion process to take place and end earlier. Another reason for an earlier end of combustion may have been an increase in the combustion rate, which has the effect of shorter combustion duration and, therefore, an earlier end of combustion. Analysis of indicator diagrams and the heat release rate in the engine cylinder in Section 3.4 will allow deciding which of these hypotheses is true. However, it should be noted that, as in the case of fuel consumption (Figure 6a), the greatest favorable differences in the exhaust gas temperature values (for the base fuel DF and the test fuel DFΣ) occurred at high engine loads (Figure 7b). This confirmed the previously presented conclusion that the positive effect of the catalyst in test fuels DFDA and DFΣ was enhanced with a higher engine torque, which was associated with a high temperature in the engine cylinder at that time.
3.2. Exhaust Gas Composition
From the point of view of the rapidly changing processes in an internal combustion engine, in terms of exhaust gas composition, the most important are the exhaust components limited during official certification or approval of engine type. This group includes CO, gaseous HCs, NOx, PM, and non-toxic CO2.
All gaseous exhaust components are measured in accordance with the applicable standards (including approval standards) with special exhaust gas analyzers (described in Section 2.2) in direct measurement as a volumetric concentration expressed in ppm. Taking into account a number of parameters related to the operation of the combustion engine (including mass and volumetric flow of exhaust gases), the hourly emission in g/h is calculated and, taking into account the engine power, the specific emission in g/kWh. Since the main objective of this publication is to determine the influence of the tested fuel additives on the analyzed engine operating parameters (including exhaust gas composition), the comparison of the concentration of exhaust gas components (for different fuels) was carried out at a constant rotational speed (which results from the assumption of the engine load characteristic) but at the same time only with the same engine loads. Under these conditions, the percentage differences between the concentration [ppm], the hourly emission [g/h] and the specific [g/kWh] of the exhaust gas components are identical and equivalent. For this reason, this publication uses direct measurement (concentration) and not hourly or specific emission, the calculation of which is burdened with additional measurement errors (e.g., exhaust gas flow rate). In type-approval tests, calculating the specific exhaust emissions in g/kWh is necessary due to the possibility of comparing the results obtained for large and small engines with reference to the same limit. In the case of the presented tests (exhaust gas composition), the same engine and fuel with the same calorific value were used, therefore the comparative analysis of the concentration of gaseous exhaust components is the same as the analysis of exhaust emissions.
The formation of CO2 is directly related to the amount of fuel burned in the diesel engine [42]. The data presented above (Figure 6) shows that the hourly consumption of the complex test fuel (Gf) is 2 to 4.5% lower than the Gf for the base fuel. Therefore, it can be assumed (as confirmed in laboratory tests) that a similar, percentage reduction in CO2 concentration in the exhaust gas is also observed for the engine powered by the complex test fuel compared to the base fuel. Since the main objective of this publication is to confirm and analyze the synergy phenomenon with regard to the impact of the fuel additives used on the simultaneous reduction of NOx concentration and PM emission in the exhaust gas, and due to the length of this article, no graphs on the concentration and emission of CO2 for the tested fuels are included here.
In the chemical aspect, the formation of CO under the combustion conditions in the cylinder of the petrol engine is related to global oxygen deficiency (homogeneous mixture). However, in the cylinder of a diesel engine, the formation of CO is possible due to the local oxygen deficiency, even with a global excess of oxygen, around the streams of the injected fuel after its self-ignition and in the combustion process.
Gaseous HCs in the exhaust of a diesel engine are mainly the result of incomplete combustion, and their formation, even with a sufficient amount of oxygen, is mainly related to excessively low temperature in the fuel combustion zone [42]. Contemporary diesel engines, including the engine used in the tests, are characterized by an extremely low concentration of HCs in the exhaust gas even before the oxidation catalytic converter, and their concentration is usually a few or a dozen or so ppm as a result of various structural and regulatory settings. Moreover, the commonly used oxidation catalytic converter has such a high conversion efficiency that the concentration of HCs in the exhaust gas leaving the diesel engine is minimal. However, the concentrations of both CO and HCs in the exhaust gases from the base fuel and the complex test fuel are important indicators of the differences in the combustion process for these fuels.
The smoke opacity were measured using the Bosch filtering method. The excess air factor (λ) is an important parameter that strongly influences the composition of the exhaust gases. This parameter includes the mass of air used to burn the fuel mass (in the engine cylinder) in relation to the stoichiometric constant, which depends on the elemental composition of the fuel. The elemental composition of both the base fuel and the complex test fuel is the same. Thus, the values of the excess air coefficient determined in the fuel tests are related to the unit dose of air and specified dose of fuel, the values of which result directly from the hourly fuel consumption.
The data presented in Figure 8a shows that the values of λ for both tested fuels were similar in the entire engine load range. A slight increase in the value of λ for the complex test fuel, in the range of high engine loads, may be one of the reasons for the increase in the overall efficiency of the engine.
The values of the excess air factor indirectly take into account the portion of air directed to the engine cylinder in relation to the portion of fuel. However, in a qualitative sense, such as a function of engine load, it may be a totally different course than the oxygen concentration in the exhaust fumes (see Figure 9a). This is because the values of λ are definitively related to air (and oxygen), which are directed to the engine cylinder and accessible for the fuel oxidation process. The concentration of O2 in the exhaust gas indicates the amount of this gas that remains after the combustion process. As seen in Figure 9b, the difference in oxygen concentration in the exhaust gases of the engine powered by the complex test fuel and the base fuel decreased, with a simultaneous increase in the value of λ for the complex test fuel as compared to the base fuel. This demonstrated more effective use of oxygen in the test fuel (DFΣ) combustion process for higher engine loads than in the base fuel.
The data presented in Figure 10a shows that in the range of high engine loads, the concentration of CO in the exhaust gas was lower for the complex test fuel than for the DF fuel. This is in line with the previously mentioned better use of oxygen in the combustion process, as CO is a typical product of incomplete combustion. This further confirms that the operation of the catalyst in the test fuel DFΣ was more effective and efficient for high engine loads.
To better illustrate the influence of the tested fuels on the concentration of CO, this parameter was also presented as a relative difference in CO concentration in the exhaust gas for the tested fuels in relation to the base fuel (Figure 10b).
The presence of CO is the result of local oxygen deficiency, but the presence of HCs in the engine exhaust indicates incomplete combustion. This may occur even with excess oxygen, because it could be the result of an excessively low combustion temperature. Despite the different mechanisms of formation of CO and gaseous HCs in the engine exhaust (numerous studies, e.g., [1,42]), Figure 11a shows that, as in the case of CO, the high engine load favored the reduction of HC concentration in the exhaust gas for the complex test fuel compared with the base fuel. This may be the result of more HCs from the fuel being burnt due to a higher combustion temperature, which reduced their concentration in the exhaust gas. Thus, this parameter further confirmed the more effective catalytic oxidation effect of the tested fuel additive for high engine loads, which are related to the higher temperature in the engine cylinder [30,34].
For a fuller view of the influence of the tested fuels on the concentration of HCs in the exhaust gases, this parameter is additionally presented as a relative difference of HC concentration in Figure 11b.
The hypothesis that the combustion temperature of fuel with Reduxco® additive would be higher than that of the base fuel for high engine loads was supported by the fact that the concentration of NOx was also higher (Figure 12a). The increase in the combustion temperature under the conditions of the internal combustion engine operation was the main cause of the increase in the number of NOx formed. In the physicochemical sense, the number of NOx particles that are formed is influenced by the combustion temperature (above 1000 K), the availability of oxygen, and the long-lasting of this process. In a compression ignition engine, the availability of oxygen needed for NOx formation is sufficient due to the nature of the combustion process in a diesel engine, which is the combustion of lean fuel-air mixtures [30]. This is true even in the engine operating area with active EGR and for high engine loads. Despite the rapidly changing processes in the engine cylinder, the time for the nitrogen oxides formation was also sufficient. The maximum combustion temperature was the main factor determining the number of NOx formed. Additionally, the number of NOx was affected by the duration of this temperature, the location of the maximum combustion temperature in relation to TDC, and the volume of the working gas covered by this temperature (in a diesel engine, the combustion process is not homogeneous) [30,34]. More information on the causes of a slightly different concentration of NOx in the exhaust gas of the engine powered by the complex test fuel at high engine loads will be derived from the analysis of the heat release rate in the engine cylinder in Section 3.4.
It should be noted that under conditions typical for the combustion process in diesel engines, NOx is a component that undergoes a so-called “freeze”, which means that the amount of NOx formed in the engine cylinder is emitted to the exhaust system [1]. In this situation, the causes that affect the amount of NOx formed in the engine cylinder are the only causes within the engine exhaust system that affect the NOx concentration in the exhaust gas.
The influence of the tested fuels on the concentration of NOx in the exhaust gas was additionally presented as a relative percentage difference (Figure 12b).
The increase in NOx concentration in the exhaust gas of the engine fueled with the fuel with Reduxco® additive alone was the main barrier to the use of this additive in diesel fuel. The tests conducted for the fuel with the Nitrocet® additive showed that the exhaust gases were characterized by a significantly lower NOx concentration (Figure 12a,b). The results clearly showed that the use of the complex test fuel containing both Nitrocet® and Reduxco® reduced the NOx concentration in the exhaust gas even slightly more than Nitrocet® alone (Figure 12b).
Tests of various diesel engines, tested around the world for many years, have confirmed that the use of one design or regulatory or fuel method reduces the NOx concentration in the exhaust gas and at the same time increases the emission of PM. This is shown schematically in Figure 13.
Comparative testing of the catalyst contained in the Reduxco® fuel and the base fuel also showed that a slight increase in NOx was matched by a simultaneous reduction in PM emissions. Figure 14a shows absolute values of PM emissions for the complex test fuel and the base fuel, and Figure 14b shows the relative difference of PM emissions in the exhaust gas from the engine powered by the base fuel and tested fuels. The mass of PM measured in the engine exhaust system was the result of the balance between the solid particles produced at the end of the kinetic combustion phase and the solid particles that had been burned off in the engine cylinder during diffusion combustion. Therefore, for a more complete understanding of the causes of significantly lower emissions of PM in the exhaust of the engine burning Reduxco® fuel and the complex test fuel, an analysis of the heat release rate was performed and is presented in Section 3.4. It should be emphasized that the use of Reduxco® additive resulted in a decrease of PM emissions in the entire engine torque range, up to about 34% for high engine loads. In the case of the complex test fuel, it was confirmed that both additives used at the same time were more effective in reducing PM emissions in the exhaust gas, with up to a 38% reduction observed in relation to the base fuel. The synergy effect was confirmed as the combined effect of both additives (Nitrocet® and Reduxco®) led to an even greater reduction in PM emissions than for Reduxco® alone. The description of this synergy does not yet explain the cause of the phenomenon, which will be explained in Section 3.4.
Since the only non-transparent component of diesel exhaust gas is soot, which is a monolith of solid particles, usually an increase in the emission of solid particles in the engine exhaust gas is accompanied by an increase in their smokiness. The same is true here. Both the fuel with the Reduxco® additive and the complex test fuel, which were characterized by lower PM emission, also led to significantly lower exhaust smokiness in the entire engine load range (Figure 15a). For a better illustration of the discussed phenomenon, in Figure 15b. shows the relative difference in the exhaust opacity of the engine powered by the tested fuels in relation to the base fuel.
3.3. Indicator Charts
The main goal of laboratory tests was not only to determine whether the applied changes would affect the course of the examined process but above all why it was so. If the causes are understood, it is likely possible to influence the object in such a way that the effects are more favorable. Historically, the oldest method of cause-and-effect causal analysis of fast-changing processes inside the cylinder of an internal combustion engine is based on its indications. The measurement of the pressure of the working medium in the engine cylinder as a function of the angle of rotation of the crankshaft has been commonly used to analyze the processes taking place in it.
The measured indicator diagrams for the tested fuels included a constant rotational speed, characteristic for the maximum torque of the engine used (n = 2000 rpm), and various loads, averaged for several dozen consecutive engine work cycles. These were used in conjunction with other parameters measured by a computer diagnostic system VCDS including:
- start of fuel injection—αsi,
- start of fuel self-ignition—αsc,
- fuel self-ignition delay—τc,
- maximum rate of combustion pressure—(dp/dα)max,
- maximum combustion pressure—pc.max,
- and angle of occurrence of the maximum combustion pressure—αp.max.
Moreover, the pressure values in the engine cylinder as a function of the crankshaft rotation angle were used to calculate the heat release rate in the engine cylinder, which is presented in the following section.
As the fuel additives used did not affect viscosity, the start of fuel injection was the same for the constant engine loads, regardless of the fuel used. Changes in the optimal start of fuel injection as the engine load increased were monitored by the engine controller in the same way for all fuels.
The onset of fuel self-ignition (αsc) was determined based on an open indicator diagram using the Indimeter 617D system software, as the engine crankshaft rotation angle (in relation to the piston TDC) for which a rapid pressure increase occurs in the engine cylinder. The start of self-ignition of the DF fuel and the complex test fuel, as a function of the engine load, are presented graphically in Figure 16a,b. The data in these figures clearly shows that in the entire engine torque range, the onset of self-ignition of the fuel with Nitrocet® additive (DFKA) was earlier than for the base fuel, and the onset was later for fuel with Reduxco® additive (DFDA). For the complex test fuel (DFΣ), the onset of fuel self-ignition was slightly later than for DFKA fuel but much earlier than for DFDA fuel.
The consequence of the earlier onset of self-ignition for the fuel with the Nitrocet® additive and the complex test fuel was the then shorter self-ignition delay (τc), presented in Figure 17a,b.
In the shorter time between the start of injection and the start of fuel self-ignition, a smaller part of the injected fuel dose is accumulated in the combustion chamber. Self-ignition of a lower mass of fuel (with shorter τc) leads to less dynamic self-ignition and fuel combustion and therefore to a lower maximum combustion temperature, which in turn results in a lower concentration of NOx in the exhaust gases. Such a situation occurred both for the fuel with the Nitrocet® additive and for the complex fuel with both additives. This is important because the use of fuel with only Reduxco® added led to an extended self-ignition delay, which was the main reason for the formation of more NOx in the exhaust gases compared to the base fuel. At the same time, as explained above, the reduction of the auto-ignition delay for the Nitrocet® fuel and the complex fuel led to a reduction in the maximum rate of combustion pressure (dp/dα)max (see Figure 18a,b).
It is necessary to clarify the issue of differences in the values of the maximum rate of pressure increase for older (up to Euro 2) and newer generation engines (above Euro 3). These differences are related to the strong restriction of NOx and PM emissions in modern internal combustion engines. Euro 0 class engines were not equipped with, inter alia, the division of the fuel dose into parts, EGR system, or delayed start of fuel injection (in relation to the optimal ηt), which meant that the maximum value of the rate of pressure increase in the engine cylinder (dp/dα)max always applied to the combustion process.
In modern diesel engines, especially at low speed and engine load, the onset of split fuel injection is so late that the onset of self-ignition occurs after the piston TDC. As it concerns a pilot dose of fuel in this case, the maximum pressure increase rate in the cylinder is higher for the compression (around the TDC of the piston) than for combustion of a pilot dose. In such a situation, (dp/dα)max has a greater value for the compression process than for the fuel combustion process, which is shown schematically in Figure 19 (line 1).
The diagram shows that at low engine load and late start of injection and self-ignition of the pilot dose of fuel, the maximum value of dp/dα occurred for the compression period and not for the combustion time. For this reason, the unknowing use of software for analyzing indicator diagrams can lead to erroneous conclusions, because such software will show only the actual maximum value of the pressure increase rate in the cylinder for the compression period [30]. Meanwhile, (dp/dα)max in the combustion process stage (which was lower than (dp/dα)max for the compression process) was responsible for the exhaust gas composition, in particular for the concentration and emission of NOx. Therefore, in these studies, only (dp/dα)max for the combustion process was analyzed.
Typically, shortening the self-ignition delay (τc) is associated with a reduction in the value of the pressure increase rate after fuel self-ignition and leads to a lower maximum combustion pressure (pc,max; see Figure 20a) [43]. The use of the fuel with the Nitrocet® additive and the complex test fuel led to a slight reduction in the value of pc,max, as shown in Figure 20b. This data also shows that fuel with only Reduxco® additive resulted in a slight increase in pc,max, which resulted from a longer self-ignition delay and was one of the reasons for the higher NOx concentration in the engine exhaust gases in this situation. The use of both additives (Nitrocet® and Reduxco®) eliminated this problem, leading the complex test fuel to an earlier start of self-ignition, reduction of self-ignition delay, lower (dp/dα)max, and lower maximum combustion pressure, which resulted in the reduction of NOx concentration in the exhaust gas.
It should be taken into account that changes in the self-ignition delay time (τc) are the only cause of changes in the value of the pressure increase rate (dp/dα)max when the same fuel is used in the tests; the independent variable is the engine design and control parameters). However, even in such a situation, if the applied structural and regulatory changes are associated with a change in pressure and/or fuel injection speed, then the self-ignition delay in the combustion chamber will accumulate a different mass of fuel, which at the time of self-ignition will cause different values of the maximum pressure rate and maximum combustion pressure. Thus, in general, it cannot be said that the self-ignition delay time is the only cause of changes in the values (dp/dα)max and pc,max. In studies where fuels with various chemical additives are used, the situation is even more complicated. The value of (dp/dα)max and pc,max is influenced not only by the self-ignition delay time, through the mass of fuel in the combustion chamber at the moment of self-ignition, but also by the combustion rate (oxidation) of the tested fuels in the first, kinetic combustion phase. In such a situation where the independent variable is the fuels with additives influencing the course of the combustion rate, the leading factor affecting (dp/dα)max may not be the self-ignition delay (τc) but the oxidation rate of such fuels in the first phase of combustion. Such a situation occurs when the values of τc and (dp/dα)max are compared for the complex test fuel (DFΣ) and the fuel with the additive Nitrocet® (DFKA), reducing the kinetic combustion rate. Figure 17 and Figure 18 show that although the self-ignition delay (τc) for the complex test fuel (DFΣ) was slightly greater than the value of τc for the fuel with the Nitrocet® additive (DFKA), the values of the combustion pressure rate for DFΣ fuel were lower than for DFKA fuel. The same is true for the maximum combustion pressure and the NOx concentration in the exhaust gas. The values of pc,max and NOx concentration in the exhaust gases were lower for combustion of the complex test fuel (DFΣ) than of the DFKA fuel. The synergy effect was observed as the impact of applying both additives to the DFΣ fuel in terms of reducing the values of (dp/dα)max and pc,max. Reducing the concentration of NOx in the exhaust gas was stronger than the effect of each of these additives in the DFKA fuel and especially the DFDA fuel.
From the point of view of both the energy parameters of the engine and particularly the exhaust gas composition, the maximum value of the combustion pressure is important as well as its presence in relation to the TDC of the piston. Since the onset of self-ignition of fuel with only Reduxco® was slightly later than for the base fuel (Figure 16), the maximum combustion pressure of this fuel also took place a little later. In the case of the complex test fuel, the occurrence of the maximum combustion pressure was earlier (Figure 21a). This is important from the point of view of the thermal efficiency of the cycle (reduction of the exhaust loss) and partially explains the even lower fuel consumption of an engine powered by the complex fuel than by the fuel with only Reduxco® (Figure 21b).
The different course of pressure in the cylinder as a function of the angle of rotation of the engine crankshaft for the analyzed fuels and different loads, initially characterized by the parameters of the indicator diagrams (αpc, τc, (dp/dα)max, pc,max, αp,max), does not provide a full explanation of the reasons for the differences in the values of energy parameters and the exhaust gas composition. Therefore, the next section presents the analysis of the heat release in the cylinder of the engine powered by the tested fuels.
3.4. Heat Release Rate
The rate of heat release began being calculated and analyzed historically much later than the indicator diagrams, at a time when the most important criteria for optimizing internal combustion engines became not only the general efficiency but also the exhaust gas composition. The heat release rate is calculated on the basis of an open indicator diagram. Various calculation models [38,39] that are frequently used, including by AVL, are described in [40].
The bimodal course of the heat release rate is divided, in the physical sense, into two stages: kinetic and diffusion heat release rate, as seen in Figure 22.
The kinetic heat release occurs immediately after the fuel self-ignition. In older generation diesel engines, it was essentially uncontrolled. In new-generation diesel engines, the maximum kinetic combustion rate (dQk/dα)max can be controlled in two modes: by shaping the fuel injection characteristics in such a way that the smallest possible dose of fuel is injected during the self-ignition delay period (usually dividing the fuel dose into parts) [44] and by shortening the self-ignition delay (τc) [2,45]. For at least 30 years, designers of internal combustion engines have focused on constructional, regulatory, and fuel methods to shape the course of the heat release rate, increase the overall efficiency of the engine and reduce the emission of NOx and PM. To achieve the above mentioned aims, it would be necessary to enact some combination of the following [3]:
- shorten the kinetic combustion phase (αc,k) to reduce the emission of NOx,
- increase the maximum diffusion combustion rate (dQd/dα)max to reduce the emission of PM [26],
- increase the duration of the diffusion combustion phase (αc,d) to reduce the emission of PM [26],
- hasten the end of combustion process (αec) to increase the combustion efficiency value, and/or
- reduce the combustion duration (αc) to increase the combustion efficiency value.
Most often, the simultaneous fulfillment of the above-mentioned requirements concerning the course of the heat release rate using only one method is impossible, even contradictory [19,45]. Therefore, by some constructional or control or fuel methods, dQ/dα is shaped to reduce NOx emissions in the exhaust gas, while other methods are used to shape dQ/dα to reduce PM emissions and to shape dQ/dα to obtain an increase in the thermal efficiency of the engine. This illustrates the difficulty of altering the dQ/dα course by one single design or control or fuel method and simultaneously optimizing the combustion process in terms of thermal efficiency of the engine and both PM, NOx emissions [28].
In this research, the two fuel additives available showed a selective and completely different effect on the course of the heat release rate. The effects were as follows:
- Nitrocet®—strong reduction of the maximum combustion rate in the kinetic phase, slight reduction of the maximum diffusion combustion rate as well as slightly earlier completion of the combustion process (resulting from earlier self-ignition and not from shortened combustion duration),
- Reduxco®—strong increase in the maximum combustion rate in the diffusion phase, slight increase in the maximum kinetic combustion rate, and significant reduction in the duration of combustion (resulting from a long-term increase in the combustion rate in the diffusion phase),
- Nitrocet® + Reduxco®—synergy of the impact of both additives to the fuel with an even more intense reduction of the maximum combustion rate in the kinetic phase, increase of the maximum diffusion combustion rate, and reduction of the duration and earlier termination of the combustion process.
Since the heat release rate is a function, for example, of the crankshaft rotation angle, engine load, and type of fuel used [29], it is much easier to analyze the commonly defined parameters of these waveforms than in the case of multi-variable functions, such as the open indicator charts. For the purposes of this article, the following parameters were analyzed, determined on the basis of the dQ/dα waveform:
- maximum kinetic heat release rate—(dQk/dα)max,
- maximum diffusion heat release rate—(dQd/dα)max,
- duration of kinetic combustion—(αc,k),
- duration of diffusion combustion—(αc,d),
- duration of combustion—(αc),
- the beginning of combustion—(αsc’), and
- end of combustion—(αec).
The abbreviated information presented above shows that the influence of the tested fuels on the maximum value of the heat release rate in the kinetic combustion phase (dQk/dα)max and in the diffusion combustion phase (dQd/dα)max was the essence of the presented study from the point of view of energy parameters and in particular the composition of the engine exhaust gases. The effect of the fuels used on the maximum kinetic combustion rate (dQk/dα)max is shown in Figure 23a.
This data shows that the quantitative course of changes (dQk/dα)max for the analyzed fuels for all engine loads corresponded the course of changes in the self-ignition delay (τc) and the maximum pressure increase rate in the engine cylinder (dp/dα)max, the maximum combustion pressure (pc,max), and, as a result, the concentration of NOx in the exhaust gas.
Once again, it should be emphasized that several parameters, measured by different methods at various stages of the processes of filling, combustion, and exhaust gas outlet, correlated perfectly with the phenomena related to the use of the tested fuels. Furthermore, parameters such as hourly fuel consumption (Gf), exhaust gas temperature (Texh), and boost pressure (pd) were the result of measurements related to the course of a multiple engine work cycles and were averaged for all engine cylinders. By contrast, indicator charts and charts of heat release rate related to a specific, single-engine cycle for one engine cylinder. As the consecutive working cycles of the piston internal combustion engine have natural fluctuations, it is not correct to analyze a randomly selected engine operation cycle when analyzing the fast-changing phenomena occurring in the engine cylinder. Therefore, in this research, for measurements and analysis of open indicator diagrams and the heat release rate calculated on the basis of these diagrams, a representative indicator diagram and the course of heat release rate were determined for each engine operating point by averaging one hundred consecutive engine operation cycles. In this way, the parameters measured after multiple engine operation cycles (e.g., Gf, Texh, pd) could be correlated with the parameters of representative indicator diagrams and heat release rate diagrams. This provided further confirmation that the analyzed differences in the values of the parameters for the base fuel and test fuels were not accidental but resulted from the influence of additives used in the tested fuels.
Since the Reduxco® catalytic additive to the fuel (DFDA) caused a slight delay in the start of fuel self-ignition (as seen in the analysis of indicator diagrams in Section 3.3), the initial stage of the combustion process, including the phase of kinetic combustion, moved to a little later. However, since the entire stage of kinetic combustion just after the fuel self-ignition is very short, at only a few degrees of crankshaft angle rotation, it does’nt have a significant impact on the engine operating parameters in comparsion to the DF fuel.
As seen in Figure 23b, the addition of Nitrocet® to the fuel (DFKA) resulted in a significant reduction in (dQk/dα)max, which corresponded to a lower NOx concentration in the engine exhaust. Adding Nitrocet® and Reduxco® to the fuel (DFΣ) at the same time reduced the NOx concentration in the exhaust gas to values even lower than for Nitrocet® by itself (Figure 23b).
Just as the concentration of NOx in the exhaust gas depends on the maximum rate and duration of fuel combustion in the kinetic phase, the PM emission in the exhaust gas is related to the (dQd/dα)max and αc in the diffusion phase. Since the greater amount of heat released in the diffusive combustion phase has the potential to burn off more of the PM previously formed in the engine cylinder, it ultimately reduces PM emissions in the engine exhaust. From this point of view, even the analysis of the maximum value of the rate and duration of combustion in the diffusion phase may not be sufficient to understand the processes related to the quantity of emitted solids. Thus, only the amount of heat Qd released in the diffusion phase, resulting from the speed course dQd/dα, gives the basis for a full and clear interpretation of the phenomena related to the balance of the resulting and partially burnt solid particles in the engine cylinder and the quantity of emitted particles in the engine exhaust. In this publication, the characteristic parameters of the course dQ/dα, previously defined in Figure 22, were used to perform a preliminary analysis of the heat release rate for the fuels used.
The values of the maximum diffusion combustion rate (dQd/dα)max for the tested fuels are shown in Figure 24a, while the relative reduction of the maximum diffusion combustion rate Δ(dQd/dα)max is shown in Figure 24b.
The use of the Reduxco® catalytic additive (DFDA fuel) caused a significant increase in the value (dQd/dα)max in relation to the base fuel, especially for high engine loads. Moreover, the increase in the maximum rate of diffusion combustion as a result of the application of Reduxco® was much greater than the unfavorable increase in the combustion rate in the kinetic phase from the point of view of NOx emissions, probably due to the lower PM emission then. As a result, the DFDA fuel tests measured a significantly lower increase in the concentration of nitrogen oxides in the exhaust gas than the reduction of PM emissions and the reduction of exhaust smokiness.
The addition of Nitrocet® (DFKA fuel) reduced the value (dQd/dα)max in relation to the values obtained for the base fuel (DF), especially for low engine loads, which resulted in slightly higher emission of PM in the exhaust gas for this fuel (Figure 14).
While the DFΣ fuel with both additives had the lowest PM emission for all tested fuels, contrary to expectations, it did not increase the maximum rate of diffusion combustion (Figure 24b) to the highest value for all tested fuels. No longer duration of combustion in the diffusion phase was found for the complex test fuel (DFΣ), which would explain the lower PM emission than for the other tested fuels (Figure 25).
Therefore, if for the complex test fuel (DFΣ) neither a higher value (dQd/dα)max nor greater combustion duration in this phase was found, then the reason for the lowest PM emission must be related to a different course of the heat release rate during the diffusive phase of combustion. In this situation, it would be expected that the combustion of DFΣ in the diffusion phase would then result in the release of a greater amount of heat Qd, despite a lower maximum rate and a slightly shorter time, because a greater amount of the heat then gives the possibility of burning more of the previously formed solid particles, which lowers PM emission in the exhaust gas). This is confirmed by the data in Figure 26.
The data obtained in the tests and presented in Figure 26 shows that the combustion of the complex test fuel (DFΣ) led to the greatest amount of heat released in the diffusion combustion phase, which in turn led to the combustion of the largest amount of PM formed slightly earlier in the engine cylinder and ultimately to the lowest for this fuel PM emission in the engine exhaust in relation to all tested fuels.
It should be remembered that the effects of the combustion process are also influenced by the end (αec) and duration (αc) of the combustion process, which for the tested fuels is shown in the next two charts. As seen in Figure 27b, the use of the Nitrocet® additive alone, especially for low engine load, caused an unfavorable delay of the ending of combustion.
Adding only Reduxco® to the fuel did lead to a favorable earlier end of the combustion process (compared to the base fuel), but this phenomenon occurred to a significant extent only at high engine loads. In the case of using Nitrocet® and Reduxco® simultaneously, the favorable earlier end of combustion was present in the entire engine load range (Figure 27a). As a result, the combustion process of the test fuel was closer to the piston TDC in the expansion process, where the efficiency of converting the generated heat into technical work is bigger than that of the DF fuel. Moreover, the earlier end of the test fuel combustion reduces the thermal losses related to the amount of heat carried with the exhaust gas.
The end of combustion in the engine cylinder is associated with both the beginning of combustion and the duration of combustion, and the values of these for the tested fuels are presented in Figure 28b.
For the fuel with the Nitrocet® additive, the beginning of combustion occurred earlier than for the base fuel, but the end of combustion occurred earlier only at high engine loads due to the increased combustion duration at low engine loads. Unlike Nitrocet® alone, both the Reduxco® additive and the Reduxco® additive used with Nitrocet® reduced the duration of the combustion process. Due to the phenomena of combustion duration (αc) and end of combustion (αec), a slightly higher overall efficiency value (ηo) was measured in the laboratory for the complex test fuel than for the base fuel.
Based on the analysis of the rate of heat release (dQ/dα) in the engine cylinder during combustion of the tested fuels at various engine loads, a diagram was developed to show the measured and calculated dQ/dα waveforms. It presents representative waveforms that show the most significant differences that explain the variation in the composition of exhaust gases (NOx and PM emissions) and fuel consumption (thermal efficiency) for the tested fuels. Since the diagram below (Figure 29), which displays dQ/dα as a function of the angle of rotation of the engine crankshaft for the tested fuels, is true in a qualitative sense for all engine loads, the vertical axis does not contain specific values of this parameter.
The presented diagram clearly shows that the initial assumptions regarding the beneficial effects of the simultaneous application of the Nitrocet® and Reduxco® additives on the optimal shaping of the course of the heat release rate in the engine cylinder were confirmed. This means that the four basic criteria for optimizing the course of the combustion process for the complex test fuel (DFΣ) in relation to the base fuel (DF) were met simultaneously. The criteria were as follows:
- reduction of the maximum rate of kinetic combustion (to reduce the NOx concentration in the exhaust gas),
- increase in the maximum rate of diffusion combustion (to reduce PM emissions and exhaust smoke),
- earlier ending of combustion (to bring the combustion process closer to the TDC of the piston; an increase in the value of ηo and a reduction in fuel consumption),
- shortening the duration of combustion (to reduce the outlet loss; increase the value of ηo and reduce fuel consumption).
It is also important to note that burning fuel with both additives simultaneously (DFΣ) led to the following:
- A lower quantity of NOx particles was formed, even than for the combustion of the fuel with Nitrocet® additive (DFKA fuel), which resulted from the lowest maximum kinetic combustion speed (dQk/dα) among all tested fuels. It was related to the phase shift of the dQ/dα waveforms for DFKA and DFDA fuels. In physical terms, this was due to the much earlier onset of self-ignition in DFKA fuel than in DFDA fuel. As a result, the maximum amount of heat of combustion in the kinetic phase of DFKA fuel was reduced by the heat consumed at that time for evaporation of DFDA fuel, which had not yet self-ignited. The result was a reduction in (dQk/dα)max for DFKA fuel to a value even lower than for DFDA fuel, as shown in Figure 29.
- Thermal efficiency reached a higher value even than that of the combustion of DFKA and DFDA fuel, which resulted both from the earlier end of combustion (reduction of the outlet loss) and from the proximity of the combustion process to the piston TDC. This was because the combustion of DFKA fuel ended earlier, as it started earlier than that of the base fuel. The combustion of DFDA fuel also ended earlier, because the combustion rate of this fuel is higher; and, consequently, the dQ/dα course for DFΣ fuel, which is the resultant of the dQ/dα function for DFDA and DFKA fuels, was characterized by the earliest end of combustion.
- PM emission was lower, which was not due to having the highest value of (dQd/dα)max and the longest diffusion combustion duration (αc,d) in relation to the tested fuels; instead, it was related to generating the greatest amount of heat in the diffusion phase as this fuel (DFΣ) burned. Figure 29 shows that due to the overlapping of the dQ/dα values for DFKA and DFDA, an additional local extreme appeared in the case of the complex test fuel (DFΣ—red line in the diagram). This indicated the formation of additional heat and an increase in the amount of heat released in the diffusion phase (Qd), which caused the combustion of part of the previously formed PM and, as a result, reduction of PM emissions in the exhaust gas.
In the simplest situation, the simultaneous application of a fuel additive that reduces the value of parameter X and a second additive that increases the value of parameter X should lead to a value of parameter X that results from the sum of the action of the individual additives. However, the research presented showed that the simultaneous application of the Nitrocet® additive, which reduced the NOx concentration in the exhaust gases by 8 to 18%, and the Reduxco® additive, which increased the NOx concentration by 12 to 20%, led the complex test fuel (DFΣ) to reduce the NOx concentration in the exhaust gases to an even greater extent (up to 20%) than for the Nitrocet® additive alone. It was possibly due to the synergy that took place at that time, which was related to the phase shift of the heat release rate (dQ/dα) for the combustion of fuels with the tested additives. Thus, the simultaneous use of the Nitrocet® and Reduxco® additives in the DFΣ fuel caused a synergy of the effects of both additives confirmed in laboratory tests showing the simultaneous and even more intense reduction of both NOx concentration and PM emission in the exhaust gases and an increase in the combustion efficiency value greater than for each additive separately.
Cause-and-effect analysis of the parameters of the engine operating process powered by the base fuel (DF), the test fuel with Nitrocet® additive (DFKA), the test fuel with Reduxco® additive (DFDA), and the complex test fuel with both Nitrocet® and Reduxco® (DFΣ) pointed to the conclusion that the synergy phenomenon has a beneficial effect on the following parameters:
4. Summary and Final Conclusions
The conducted research indicated the following important conclusions regarding the impact of the biofuel additives used on the parameters of the combustion process in a compression ignition engine:
- Nitrocet®, used as a standalone fuel additive, caused earlier fuel self-ignition and, consequently, shortened the self-ignition delay, strongly reduced the kinetic combustion speed (leading to a several percent reduction of NOx concentration in the exhaust gases), and slightly reduced the diffusive combustion speed (leading to an increase in PM emissions and exhaust smoke of about 1%).
- Reduxco®, used as a standalone fuel additive, caused a slightly later self-ignition of the fuel and, consequently, extended the self-ignition delay and slightly increased the kinetic combustion speed, which increased the NOx concentration in the exhaust gas up to several percent. However, the main task of Reduxco® in this case was to strongly increase the diffusion rate of combustion, which resulted in the reduction of PM emissions and exhaust smoke from a few to over 30%.
- The simultaneous addition of Nitrocet® and Reduxco® in the complex fuel mainly caused:
- earlier fuel self-ignition and, consequently, shortening the self-ignition delay to an even greater extent than when Nitrocet® was the only additive,
- a strong reduction of the kinetic combustion rate, which led to a reduction in NOx concentration in the engine exhaust that was slightly more than that caused by the addition of Nitrocet® alone (from several to 20%),
- a significant increase in the amount of heat released in the diffusion phase of combustion, which resulted in a significant reduction in PM emissions and exhaust smoke (from 12 to almost 40%),
- bringing the combustion process closer to the piston TDC, which resulted in lower fuel consumption (from 2 to 5%),
- In the case of the complex test fuel, containing both Nitrocet® and Reduxco® additives, the effects of the favorable synergy phenomenon were observed in fuel consumption (thermal efficiency – ηt) and the NOx concentration and PM emission in the engine exhaust. The combined action of both these additives with the fuel had a more favorable effect than the use of each of these additives separately.
- The reason for the synergistic effect of the two tested fuel additives on the values of ηt, NOx and PM was the shift in the heat release rate (dQ/dα) for the fuel with the Nitrocet® additive compared to dQ/dα for the fuel with the addition of Reduxco®. This was mainly due to the much earlier self-ignition of the Nitrocet® fuel compared to the later self-ignition of the Reduxco® fuel. The moment the Nitrocet® fuel started to burn, the Reduxco® fuel was just evaporating. The latent heat reduced the amount of heat released in the kinetic phase of combustion (dQk/dα) of the Nitrocet® fuel, which additionally reduced dQk/dα of the fuel with both additives and led to a lower number of NOx formed and reduced NOx emissions in the engine exhaust.
- For the fuel with both additives (DFΣ), the heat development course Q(α) was characterized by a lower amount of heat released in the kinetic phase (even than for fuel with Nitrocet® only) and the lowest concentration of NOx in the exhaust gas. It was also characterized by a higher amount of heat released in the diffusion phase (even than for the fuel with Reduxco® alone), which explained the lowest PM emission in the exhaust gas at that time. The synergy also concerned the earlier end of fuel combustion with both tested additives, which allowed for the lowest emission of NOx and PM in the exhaust gas and the highest thermal efficiency in relation to all fuels used in the research.
Author Contributions
Conceptualization, J.C. and S.L.; methodology, J.C.; validation, J.C.; formal analysis, J.C. and S.L.; investigation, J.C. and S.L.; resources, W.S. and W.P.; data curation, J.C.; writing—original draft preparation, J.C. and S.L.; writing—review and editing, J.C. and S.L.; supervision, J.C.; project administration, J.C.; funding acquisition, J.C., W.S. and W.P. All authors have read and agreed to the published version of the manuscript.
Funding
This research was founded by DAGAS Limited Company, Contract No: M-04/187/2020/P; Cracow University of Technology: Cracow, Poland, 2020.
Institutional Review Board Statement
Not applicable.
Informed Consent Statement
Not applicable.
Data Availability Statement
Cracow University of Technology: Cracow, Poland.
Conflicts of Interest
The authors declare no conflict of interest.
Nomenclature
| dQk | (dQk/dα)max—the maximum rate of heat release in the kinetic phase of combustion |
| dQd | (dQd/dα)max—the maximum rate of heat release in the diffusive phase of combustion |
| —the maximum rate of heat release in the kinetic phase of combustion for fuel with an additive increasing diffusive combustion rate | |
| —the maximum rate of heat release in the kinetic combustion phase for fuel with an additive reducing kinetic combustion rate | |
| —the maximum rate of heat release in the kinetic combustion phase for the base (reference) fuel | |
| —the maximum rate of heat release in the kinetic phase of combustion for fuel with two additives | |
| —the maximum rate of heat release in the diffusive phase of combustion for fuel with an additive increasing the diffusive combustion rate | |
| —the maximum rate of heat release in the diffusive phase of combustion for fuel with an additive reducing the kinetic combustion rate | |
| —the maximum rate of heat release in the diffusive phase of combustion for the base (reference) fuel | |
| —the maximum rate of heat release in the diffusive phase of combustion for fuel with two additives | |
| (dp/dα)max | the maximum rate of pressure increase |
| KA | fuel additive that reduces the kinetic combustion rate |
| DA | fuel additive that increasing the diffusive combustion rate |
| Σ | the sum of additions KA + DA |
| DF | diesel fuel |
| DFKA | fuel with an additive that reduces the kinetic combustion rate (DF + KA) |
| DFDA | fuel with an additive that increases the diffusive combustion rate (DF + DA) |
| DFΣ | fuel with both additives (DF + KA + DA) |
| Qd | heat released in the diffusive phase |
| NOx | nitrogen oxides |
| PM | particulate matter |
| CO | carbon monoxide |
| HC | hydrocarbons |
| O2 | dioxide |
| CO2 | Carbon dioxide |
| Texh | exhaust gas temperature |
| TDC | top dead center |
| ηt | thermal efficiency |
| ηo | overall efficiency |
| τc | self-ignition delay |
| Gf | hourly fuel consumption |
| gf | specific fuel consumption |
| αsi | start of injection |
| αsc | start of combustion |
References
- Merkisz, J. Ekologiczne Problemy Silników Spalinowych; Wydawnictwo PP: Poznań, Poland, 1999; ISBN 83-7143-039-6. [Google Scholar]
- Jindal, S.; Nandwana, B.P.; Rathore, N.S.; Vashistha, V. Experimental investigation of the effect of compression ratio and injection pressure in a direct injection diesel engine running on Jatropha methyl ester. Appl. Therm. Eng. 2010, 30, 442–448. [Google Scholar] [CrossRef]
- Masjuki, H.; Kalam, M.; Syazly, M.; Mahlia, T.; Rahman, A.; Redzuan, M.; Varman, M.; Saidur, R.; Yau, Y. Experimental Evaluation of an Unmodified Diesel Engine using Biodiesel with Fuel Additive. In Proceedings of the Strategic Technology, The 1st International Forum on Strategic Technology “e-Vehicle Technology”, Ulsan, Korea, 18–20 October 2006; pp. 96–99. [Google Scholar]
- Kim, M.H.; Chung, W.I.; Chyun, I.B. Three-Dimensional Flow Characteristics and Engine Performance for the Geometry Modification of Intake Manifold in Multi-Cylinder Diesel Engine. In Proceedings of the Seoul 2000 FISITA World Automotive Congress, SAE Technical Paper 2000-05-0020. Seoul, Korea, 12–15 June 2000. [Google Scholar]
- Montajir, R.M.; Tsunemoto, H.; Ishitani, H.; Minami, T. Fuel Spray Behavior in a Small DI Diesel Engine: Effect of Combustion Chamber Geometry; SAE Technical Paper Series; SAE International: Warrendale, PA, USA, 2000. [Google Scholar] [CrossRef]
- Zeng, K.; Huang, Z.; Liu, B.; Liu, L.; Jiang, D.; Ren, Y.; Wang, J. Combustion characteristics of a direct-injection natural gas engine under various fuel injection timings. Appl. Therm. Eng. 2006, 26, 806–813. [Google Scholar] [CrossRef]
- Agarwal, A.K.; Srivastava, D.K.; Dhar, A.; Maurya, R.K.; Shukla, P.C.; Singh, A.P. Effect of fuel injection timing and pressure on combustion, emissions and performance characteristics of a single cylinder diesel engine. Fuel 2013, 111, 374–383. [Google Scholar] [CrossRef]
- Imtenan, S.; Rahman, S.A.; Masjuki, H.; Varman, M.; Kalam, M. Effect of dynamic injection pressure on performance, emission and combustion characteristics of a compression ignition engine. Renew. Sustain. Energy Rev. 2015, 52, 1205–1211. [Google Scholar] [CrossRef]
- Vedharaj, S.; Vallinayagam, R.; Yang, W.; Saravanan, C.; Lee, P. Optimization of combustion bowl geometry for the operation of kapok biodiesel—Diesel blends in a stationary diesel engine. Fuel 2015, 139, 561–567. [Google Scholar] [CrossRef]
- Millo, F.; Giacominetto, P.F.; Bernardi, M.G. Analysis of different exhaust gas recirculation architectures for passenger car Diesel engines. Appl. Energy 2012, 98, 79–91. [Google Scholar] [CrossRef]
- Asad, U.; Zheng, M. Exhaust gas recirculation for advanced diesel combustion cycles. Appl. Energy 2014, 123, 242–252. [Google Scholar] [CrossRef]
- Sayin Kul, B.; Kahraman, A. Energy and Exergy Analyses of a Diesel Engine Fuelled with Biodiesel-Diesel Blends Containing 5% Bioethanol. Entropy 2016, 18, 387. [Google Scholar] [CrossRef]
- Monsalve-Serrano, J.; Belgiorno, G.; Di Blasio, G.; Guzmán-Mendoza, M. 1D Simulation and Experimental Analysis on the Effects of the Injection Parameters in Methane-Diesel Dual-Fuel Combustion. Energies 2020, 13, 3734. [Google Scholar] [CrossRef]
- Belgiorno, G.; Dimitrakopoulos, N.; Di Blasio, G.; Beatrice, C.; Tuner, M.; Tunestal, P. Parametric Analysis of the Effect of Pilot Quantity, Combustion Phasing and EGR on Efficiencies of a Gasoline PPC Light-Duty Engine. In Proceedings of the 13th International Conference on Engines & Vehicles, Napoli, Italy, 10–14 September 2017; Volume 1, p. 1. [Google Scholar] [CrossRef]
- Rashedul, H.; Masjuki, H.; Kalam, M.; Ashraful, A.; Rahman, S.A.; Shahir, S. The effect of additives on properties, performance and emission of biodiesel fuelled compression ignition engine. Energy Convers. Manag. 2014, 88, 348–364. [Google Scholar] [CrossRef]
- Agarwal, A.K.; Das, L.M. Biodiesel Development and Characterization for Use as a Fuel in Compression Ignition Engines. J. Eng. Gas Turbines Power 2001, 123, 440–447. [Google Scholar] [CrossRef]
- Aldhaidhawi, M.; Chiriac, R.; Badescu, V. Ignition delay, combustion and emission characteristics of Diesel engine fueled with rapeseed biodiesel—A literature review. Renew. Sustain. Energy Rev. 2017, 73, 178–186. [Google Scholar] [CrossRef]
- Hwang, J.; Qi, D.; Jung, Y.; Bae, C. Effect of injection parameters on the combustion and emission characteristics in a common-rail direct injection diesel engine fueled with waste cooking oil biodiesel. Renew. Energy 2014, 63, 9–17. [Google Scholar] [CrossRef]
- Chadwell, C.J.; Dingle, P.J.G. Effect of Diesel and Water Co-Injection with Real-Time Control on Diesel Engine Performance and Emissions; SAE Technical Paper Series; SAE International: Warrendale, PA, USA, 2008. [Google Scholar] [CrossRef]
- Pidol, L.; Lecointe, B.; Starck, L.; Jeuland, N. Ethanol—biodiesel—diesel fuel blends: Performances and emissions in conventional diesel and advanced low temperature combustions. Fuel 2012, 93, 329–338. [Google Scholar] [CrossRef]
- Bose, P.K.; Maji, D. An experimental investigation on engine performance and emissions of a single cylinder diesel engine using hydrogen as inducted fuel and diesel as injected fuel with exhaust gas recirculation. Int. J. Hydrogen Energy 2009, 34, 4847–4854. [Google Scholar] [CrossRef]
- Choi, C.; Reitz, R. An experimental study on the effects of oxygenated fuel blends and multiple injection strategies on DI diesel engine emissions. Fuel 1999, 78, 1303–1317. [Google Scholar] [CrossRef]
- Soudagar, M.E.M.; Mujtaba, M.A.; Safaei, M.R.; Afzal, A.; Raju, V.D.; Ahmeda, W.; Banapurmath, N.R.; Hossainh, N.; Bashiri, S.; Badruddinjk, I.A.; et al. Effect of Sr@ZnO nanoparticles and Ricinus communis biodiesel-diesel fuel blends on modified CRDI diesel engine characteristics. Energy 2021, 215, 119094. [Google Scholar] [CrossRef]
- Gavhane, R.S.; Kate, A.M.; Pawar, A.; Safaei, M.R.; Soudagar, M.E.M.; Abbas, M.M.; Ali, H.M.; Banapurmath, N.R.; Goodarzi, M.; Badruddin, I.A.; et al. Effect of Zinc Oxide Nano-Additives and Soybean Biodiesel at Varying Loads and Compression Ratios on VCR Diesel Engine Characteristics. Symmetry 2020, 12, 1042. [Google Scholar] [CrossRef]
- Khan, H.; Soudagar, M.E.M.; Kumar, R.H.; Safaei, M.R.; Farooq, M.; Khidmatgar, A.; Banapurmath, N.R.; Farade, R.A.; Abbas, M.M.; Afzal, A.; et al. Effect of Nano-Graphene Oxide and n-Butanol Fuel Additives Blended with Diesel—Nigella sativa Biodiesel Fuel Emulsion on Diesel Engine Characteristics. Symmetry 2020, 12, 961. [Google Scholar] [CrossRef]
- Barrios, C.C.; Martin, C.; Domínguez-Sáez, A.; Álvarez, P.; Pujadas, M.; Casanova, J. Effects of the addition of oxygenated fuels as additives on combustion characteristics and particle number and size distribution emissions of a TDI diesel engine. Fuel 2014, 132, 93–100. [Google Scholar] [CrossRef]
- Razzaq, L.; Mujtaba, M.; Soudagar, M.E.M.; Ahmed, W.; Fayaz, H.; Bashir, S.; Fattah, I.R.; Ong, H.C.; Shahapurkar, K.; Afzal, A.; et al. Engine performance and emission characteristics of palm biodiesel blends with graphene oxide nanoplatelets and dimethyl carbonate additives. J. Environ. Manag. 2021, 282, 111917. [Google Scholar] [CrossRef]
- D’Silva, R.; Binu, K.; Bhat, T. Performance and Emission Characteristics of a C.I. Engine Fuelled with Diesel and TiO2 Nanoparticles as Fuel Additive. Mater. Today Proc. 2015, 2, 3728–3735. [Google Scholar] [CrossRef]
- Li, R.; Wang, Z.; Ni, P.; Zhao, Y.; Li, M.; Li, L. Effects of cetane number improvers on the performance of diesel engine fuelled with methanol/biodiesel blend. Fuel 2014, 128, 180–187. [Google Scholar] [CrossRef]
- Cisek, J.; Lesniak, S.; Mokretskyy, V.; Przybylski, W. The Influence of Reduxco Catalyst in the Diesel Fuel on Energy Parameters, Exhaust Gas Composition and Rate of Heat Release of a Diesel Engine; SAE Technical Paper Series; SAE Technical Paper 2020-01-2061; SAE International: Warrendale, PA, USA, 2020. [Google Scholar]
- Oil and Gas InstituteNational Research Institute. Analysis of the Impact of Self-Ignition Delay on the Rate of Kinetic Combustion as Well as the Composition and Opacity of Exhaust Gases as a Function of the Load of a Compression-Ignition Engine Powered by Three Fuels; Research Report, Contract No: M-04/277/2018/P; Cracow University of Technology: Cracow, Poland, 2018. [Google Scholar]
- Stanik, W.; Cisek, J. Influence of cetane-detergent additives into diesel fuel with RME content increased to 10% on the parameters of indicator diagrams and rate of heat release in a diesel engine. Combust. Eng. 2019, 179, 226–235. [Google Scholar] [CrossRef]
- Worldwide Fuel Charter Committee. Gasoline and Diesel Fuel, 6th ed.; Worldwide Fuel Charter: Brussels, Belgium, 2019. [Google Scholar]
- DAGAS Limited Company. Analysis of the Influence of a New Type of Fuel Catalyst on the Operating Parameters of a Compression Ignition Engine; Research Report, Contract No: M-04/105/2019/P; Cracow University of Technology: Cracow, Poland, 2019. [Google Scholar]
- DAGAS Limited Company. Determination of the Influence of a New Type of Fuel Catalyst on Coking of a Fuel Atomizer; Research Report, Contract No: M-04/139/2020/P; Cracow University of Technology: Cracow, Poland, 2020. [Google Scholar]
- DAGAS Limited Company. Analysis of the Synergy of the Impact of Reduxco and Nitrocet Additives for Diesel Fuel on the Course of the Combustion Process in the Cylinder of a Compression Ignition Engine; Research Report, Contract No: M-04/187/2020/P; Cracow University of Technology: Cracow, Poland, 2020. [Google Scholar]
- ISO. RIC Engines—Exhaust Emission Measurement, Part 1, Test Bed Measurement of Gaseous and Particulate Exhaust Emissions from RIC Engines; ISO nr CD 8178-1; ISO: Frankfurt am Main, Germany, 1992. [Google Scholar]
- Rychter, T.; Teodorczyk, A. Modelowanie Matematyczne Roboczego Cyklu Silnika Tłokowego; PWN: Warszawa, Poland, 1990. [Google Scholar]
- Mitianiec, W.; Jaroszewski, A. Modele Matematyczne Procesów Fizycznych w Silnikach Spalinowych Małej Mocy; Wydawnictwo Ossolineum: Wroclaw, Poland, 1993. [Google Scholar]
- AVL LIST Gmbh. Indimeter 617 D. System Description and Examples; AVL: Graz, Austria, 2000. [Google Scholar]
- Lodi, F.; Zare, A.; Arora, P.; Stevanovic, S.; Jafari, M.; Ristovski, Z.; Brown, R.J.; Bodisco, T. Combustion Analysis of a Diesel Engine during Warm up at Different Coolant and Lubricating Oil Temperatures. Energies 2020, 13, 3931. [Google Scholar] [CrossRef]
- Heywood, J.B. Internal Combustion Engine Fundamentals; McGraw-Hill Series in Mechanical Engineering; University of Michigan: Ann Arbor, MI, USA, 1988. [Google Scholar]
- Kowalewicz, A. Podstawy Procesów Spalania; Wydawnictwo Naukowo Techniczne: Warszawa, Poland, 2000; ISBN 83-204-2496-8. [Google Scholar]
- Purushothaman, K.; Nagarajan, G. Effect of injection pressure on heat release rate and emissions in CI engine using orange skin powder diesel solution. Energy Convers. Manag. 2009, 50, 962–969. [Google Scholar] [CrossRef]
- Muralidharan, K.; Vasudevan, D. Performance, emission and combustion characteristics of a variable compression ratio engine using methyl esters of waste cooking oil and diesel blends. Appl. Energy 2011, 88, 3959–3968. [Google Scholar] [CrossRef]
- Patel, N.; Singh, R. Optimization of NOx Emission from Soya Biodiesel Fuelled Diesel Engine using Cetane Improver (DTBP). Jordan J. Mech. Ind. Eng. 2014, 8, 213–217. [Google Scholar]
Figure 1.
Schema of the laboratory measuring systems (description in the text).

Figure 2.
Test bench with the Schenck eddy current brake and VW 1.9 TDI engine.

Figure 3.
AVL Fuel Balance 4210 mass dynamic fuel gauge.

Figure 4.
Front panel of the AVL CEBII measurement system.

Figure 5.
Exhaust DT for the determination of PM emissions.

Figure 6.
(a) Hourly fuel consumption (Gf) vs. engine torque; (b) Percentage difference in the values of hourly fuel consumption (ΔGf) vs. engine torque in relation to the base fuel.
Figure 6.
(a) Hourly fuel consumption (Gf) vs. engine torque; (b) Percentage difference in the values of hourly fuel consumption (ΔGf) vs. engine torque in relation to the base fuel.

Figure 7.
(a) Exhaust gas temperature vs. engine torque; (b) Percentage difference in exhaust gas temperature vs. engine torque in relation to the base fuel.
Figure 7.
(a) Exhaust gas temperature vs. engine torque; (b) Percentage difference in exhaust gas temperature vs. engine torque in relation to the base fuel.

Figure 8.
(a) Excess air coefficient (λ) vs. engine torque; (b) Percentage difference in the values of the excess air coefficient (λ) vs. engine torque in relation to the base fuel.
Figure 8.
(a) Excess air coefficient (λ) vs. engine torque; (b) Percentage difference in the values of the excess air coefficient (λ) vs. engine torque in relation to the base fuel.

Figure 9.
(a) Oxygen concentration in the exhaust fumes vs. engine torque; (b) Percentage difference in the values of oxygen concentration in the exhaust fumes vs. engine torque in relation to the base fuel.
Figure 9.
(a) Oxygen concentration in the exhaust fumes vs. engine torque; (b) Percentage difference in the values of oxygen concentration in the exhaust fumes vs. engine torque in relation to the base fuel.

Figure 10.
(a) CO concentration in the exhaust fumes vs. engine torque; (b) Percentage difference in the concentration of CO in the exhaust fumes vs. engine torque in relation to the base fuel.
Figure 10.
(a) CO concentration in the exhaust fumes vs. engine torque; (b) Percentage difference in the concentration of CO in the exhaust fumes vs. engine torque in relation to the base fuel.

Figure 11.
(a) The concentration of HCs in the exhaust fumes vs. engine torque; (b) Percentage difference in the concentration of HCs in the exhaust fumes vs. engine torque in relation to the base fuel.
Figure 11.
(a) The concentration of HCs in the exhaust fumes vs. engine torque; (b) Percentage difference in the concentration of HCs in the exhaust fumes vs. engine torque in relation to the base fuel.

Figure 12.
(a) Concentration of NOx in the exhaust fumes vs. engine torque; (b) Percentage difference in the concentration of NOx in the exhaust fumes vs. engine torque in relation to the base fuel.
Figure 12.
(a) Concentration of NOx in the exhaust fumes vs. engine torque; (b) Percentage difference in the concentration of NOx in the exhaust fumes vs. engine torque in relation to the base fuel.

Figure 13.
A schema of the NOx-PM emission trade-off.

Figure 14.
(a) Emission of PM in the exhaust fumes vs. engine torque; (b) Percentage difference in emission of PM in exhaust fumes vs. engine torque in relation to the base fuel.
Figure 14.
(a) Emission of PM in the exhaust fumes vs. engine torque; (b) Percentage difference in emission of PM in exhaust fumes vs. engine torque in relation to the base fuel.

Figure 15.
(a) The smokiness of exhaust fumes vs. engine torque; (b) Percentage difference in exhaust fumes smokiness vs. engine torque in relation to the base fuel.
Figure 15.
(a) The smokiness of exhaust fumes vs. engine torque; (b) Percentage difference in exhaust fumes smokiness vs. engine torque in relation to the base fuel.

Figure 16.
(a) Onset of fuel self-ignition vs. engine torque; (b) Difference in the onset of fuel self-ignition vs. engine torque in relation to the base fuel.
Figure 16.
(a) Onset of fuel self-ignition vs. engine torque; (b) Difference in the onset of fuel self-ignition vs. engine torque in relation to the base fuel.

Figure 17.
(a) Fuel self-ignition delay vs. engine torque; (b) Difference in fuel self-ignition delay vs. engine torque in relation to the base fuel.
Figure 17.
(a) Fuel self-ignition delay vs. engine torque; (b) Difference in fuel self-ignition delay vs. engine torque in relation to the base fuel.

Figure 18.
(a) Maximum pressure increase rate in the cylinder vs. engine torque; (b) Percentage difference of the maximum pressure increase rate in the cylinder vs. engine torque in relation to the base fuel.
Figure 18.
(a) Maximum pressure increase rate in the cylinder vs. engine torque; (b) Percentage difference of the maximum pressure increase rate in the cylinder vs. engine torque in relation to the base fuel.

Figure 19.
Pressure course in the cylinder of the 1.9 TDI VW engine [30].
Figure 19.
Pressure course in the cylinder of the 1.9 TDI VW engine [30].

Figure 20.
(a) Maximum pressure in cylinder vs. engine torque; (b) Percentage difference of maximum pressure in cylinder vs. engine torque in relation to the base fuel.
Figure 20.
(a) Maximum pressure in cylinder vs. engine torque; (b) Percentage difference of maximum pressure in cylinder vs. engine torque in relation to the base fuel.

Figure 21.
(a) Occurrence of the maximum pressure in the cylinder vs. engine torque, 1 = combustion range of very small fuel doses, 2 = combustion range of larger fuel doses); (b) Difference in the occurrence of the maximum pressure in the cylinder vs. engine torque in relation to the base fuel.
Figure 21.
(a) Occurrence of the maximum pressure in the cylinder vs. engine torque, 1 = combustion range of very small fuel doses, 2 = combustion range of larger fuel doses); (b) Difference in the occurrence of the maximum pressure in the cylinder vs. engine torque in relation to the base fuel.

Figure 22.
Heat release rate in the cylinder of the diesel engine. ![Energies 14 02784 i001]() —fuel vaporization phase,
—fuel vaporization phase, ![Energies 14 02784 i002]() —kinetic combustion phase,
—kinetic combustion phase, ![Energies 14 02784 i003]() —diffusion combustion phase.
—diffusion combustion phase.
 —fuel vaporization phase,
  —kinetic combustion phase,
  —diffusion combustion phase.
Figure 22.
Heat release rate in the cylinder of the diesel engine. ![Energies 14 02784 i001]() —fuel vaporization phase,
—fuel vaporization phase, ![Energies 14 02784 i002]() —kinetic combustion phase,
—kinetic combustion phase, ![Energies 14 02784 i003]() —diffusion combustion phase.
—diffusion combustion phase.
—fuel vaporization phase, —kinetic combustion phase, —diffusion combustion phase.
Figure 23.
(a) Maximum kinetic combustion rate vs. engine torque; (b) Difference of the maximum kinetic combustion rate vs. engine torque in relation to the base fuel.
Figure 23.
(a) Maximum kinetic combustion rate vs. engine torque; (b) Difference of the maximum kinetic combustion rate vs. engine torque in relation to the base fuel.

Figure 24.
(a) Maximum rate of diffusion combustion vs. engine torque; (b) Difference of the maximum diffusion combustion rate vs. engine torque in relation to the base fuel.
Figure 24.
(a) Maximum rate of diffusion combustion vs. engine torque; (b) Difference of the maximum diffusion combustion rate vs. engine torque in relation to the base fuel.

Figure 25.
(a) Duration of diffusion combustion vs. engine torque; (b) Difference in diffusion combustion duration vs. engine torque in relation to the base fuel.
Figure 25.
(a) Duration of diffusion combustion vs. engine torque; (b) Difference in diffusion combustion duration vs. engine torque in relation to the base fuel.

Figure 26.
(a) Heat of diffusion combustion vs. engine torque; (b) Difference in diffusion combustion heat vs. engine torque in relation to the base fuel.
Figure 26.
(a) Heat of diffusion combustion vs. engine torque; (b) Difference in diffusion combustion heat vs. engine torque in relation to the base fuel.

Figure 27.
(a) Occurrence of the end of combustion vs. engine torque; (b) Difference in the occurrence of the end of combustion vs. engine torque in relation to the base fuel.
Figure 27.
(a) Occurrence of the end of combustion vs. engine torque; (b) Difference in the occurrence of the end of combustion vs. engine torque in relation to the base fuel.

Figure 28.
(a) Duration of combustion vs. engine torque; (b) Difference in combustion duration vs. engine torque in relation to the base fuel.
Figure 28.
(a) Duration of combustion vs. engine torque; (b) Difference in combustion duration vs. engine torque in relation to the base fuel.

Figure 29.
Rate of heat release in the cylinder of a diesel engine for all tested fuels.


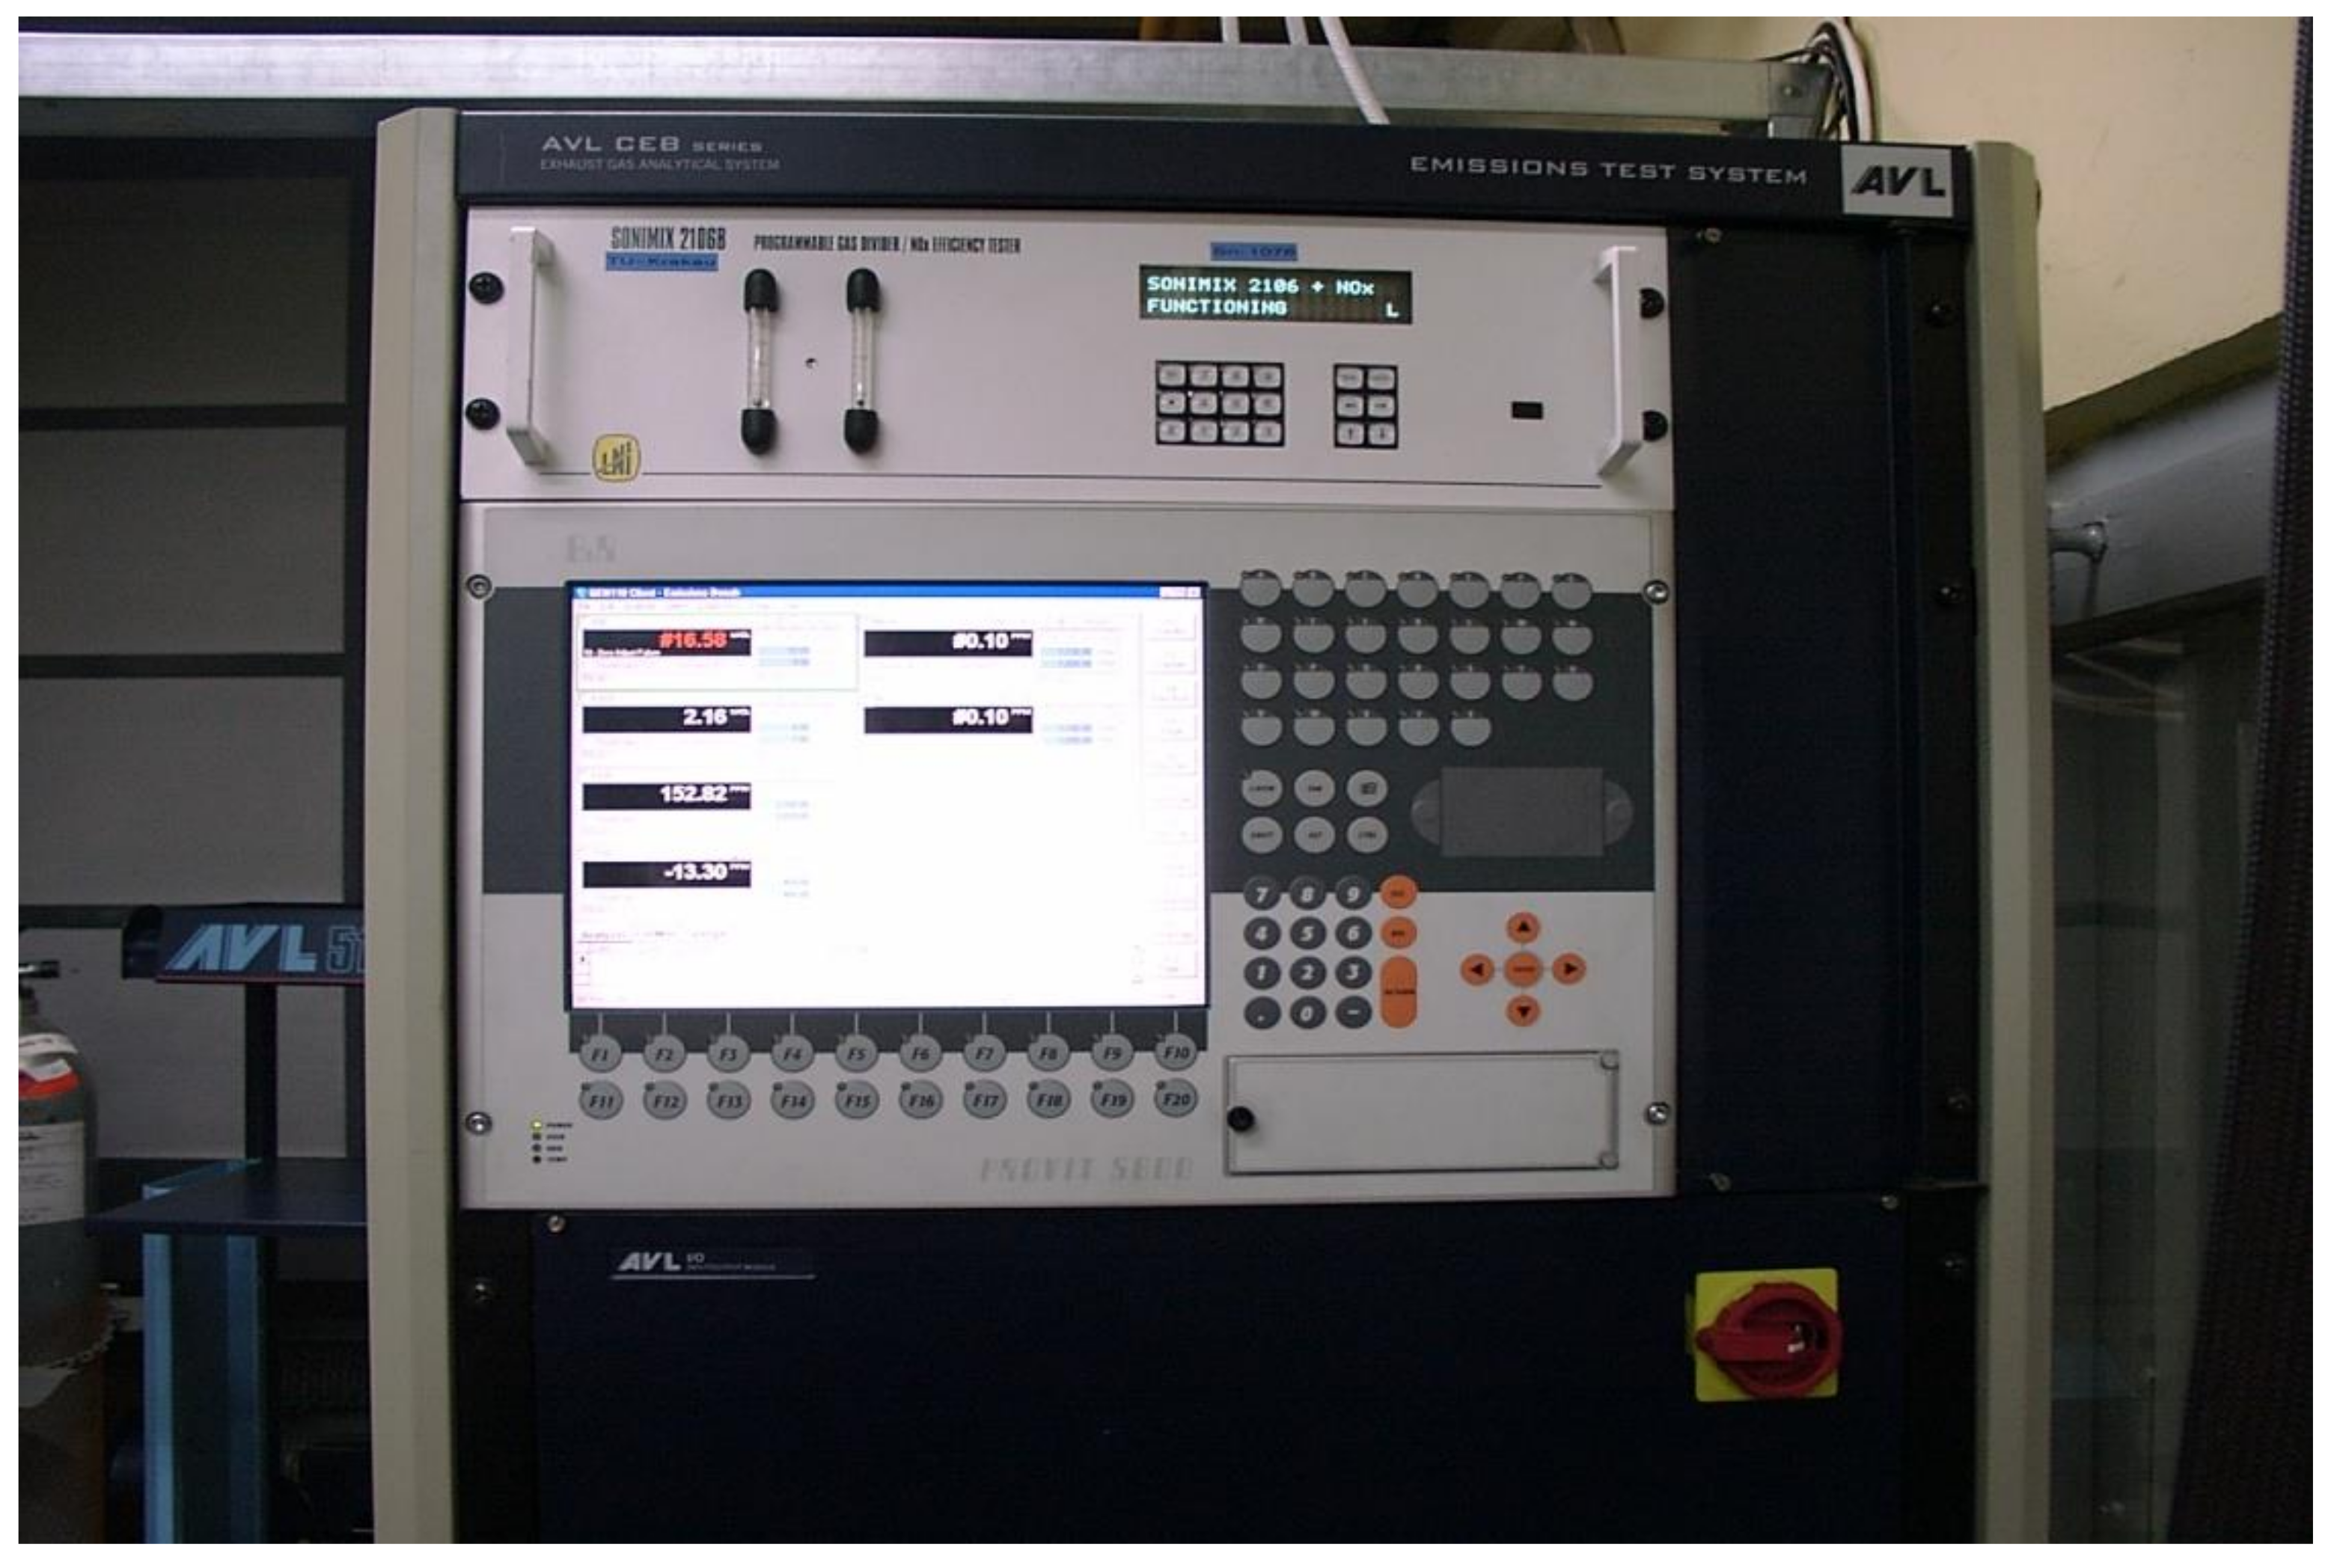
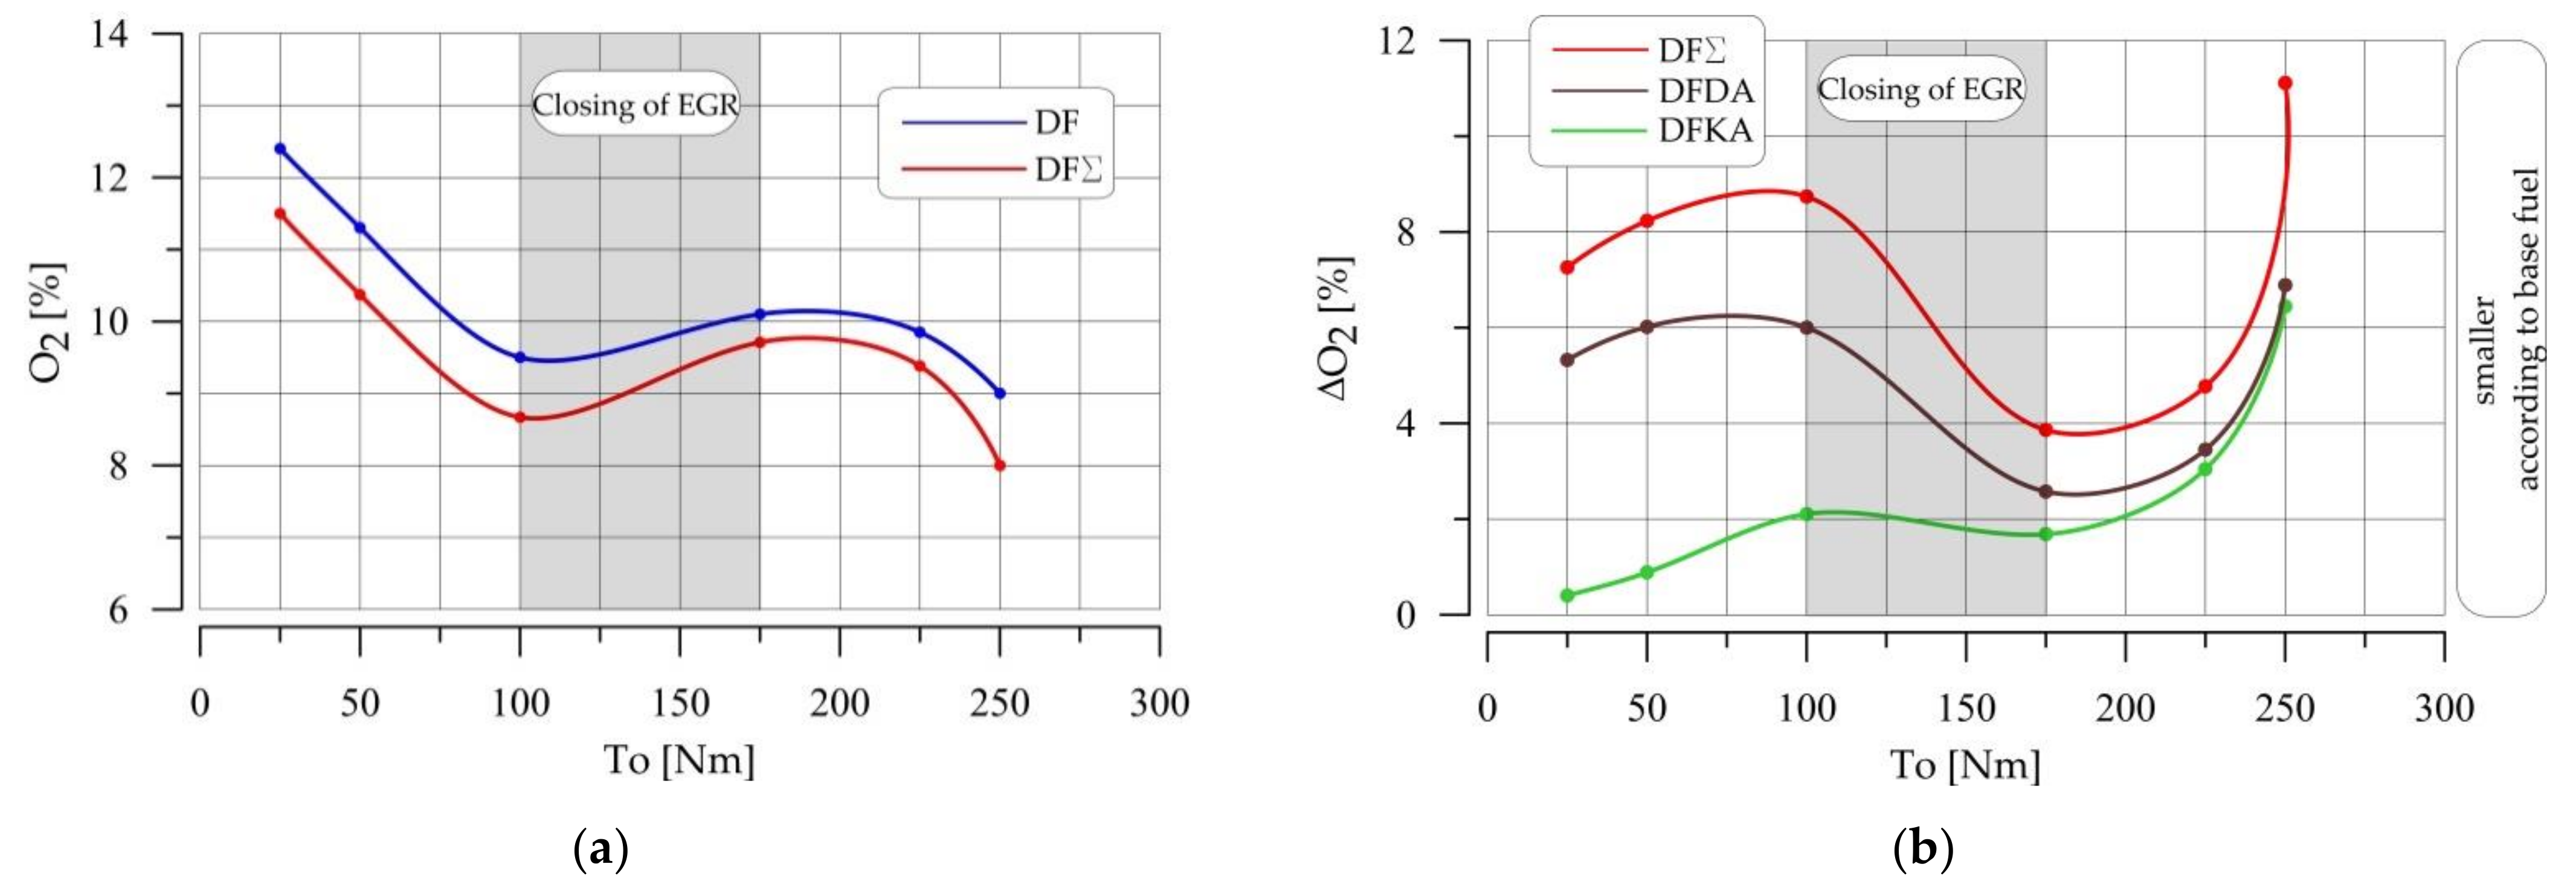
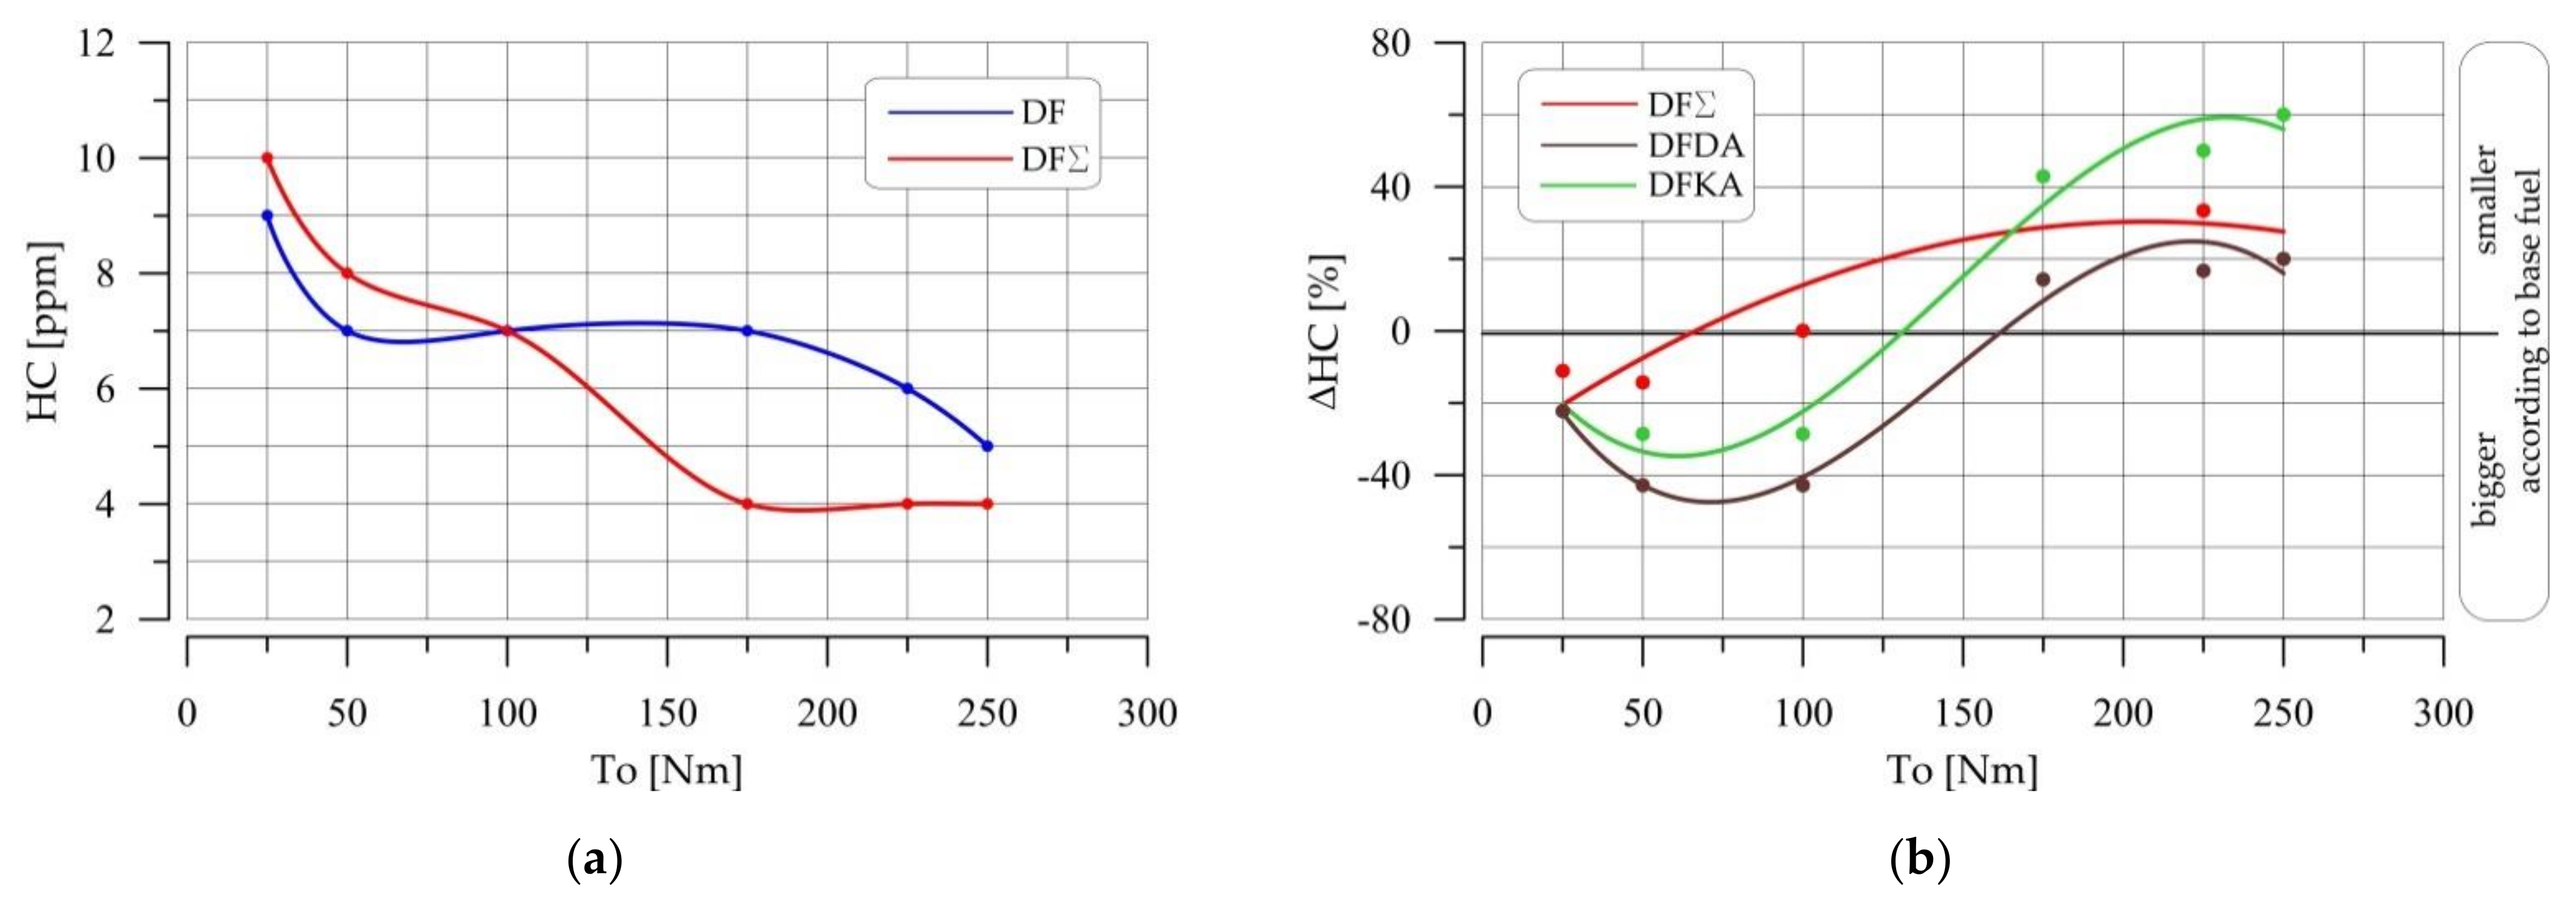
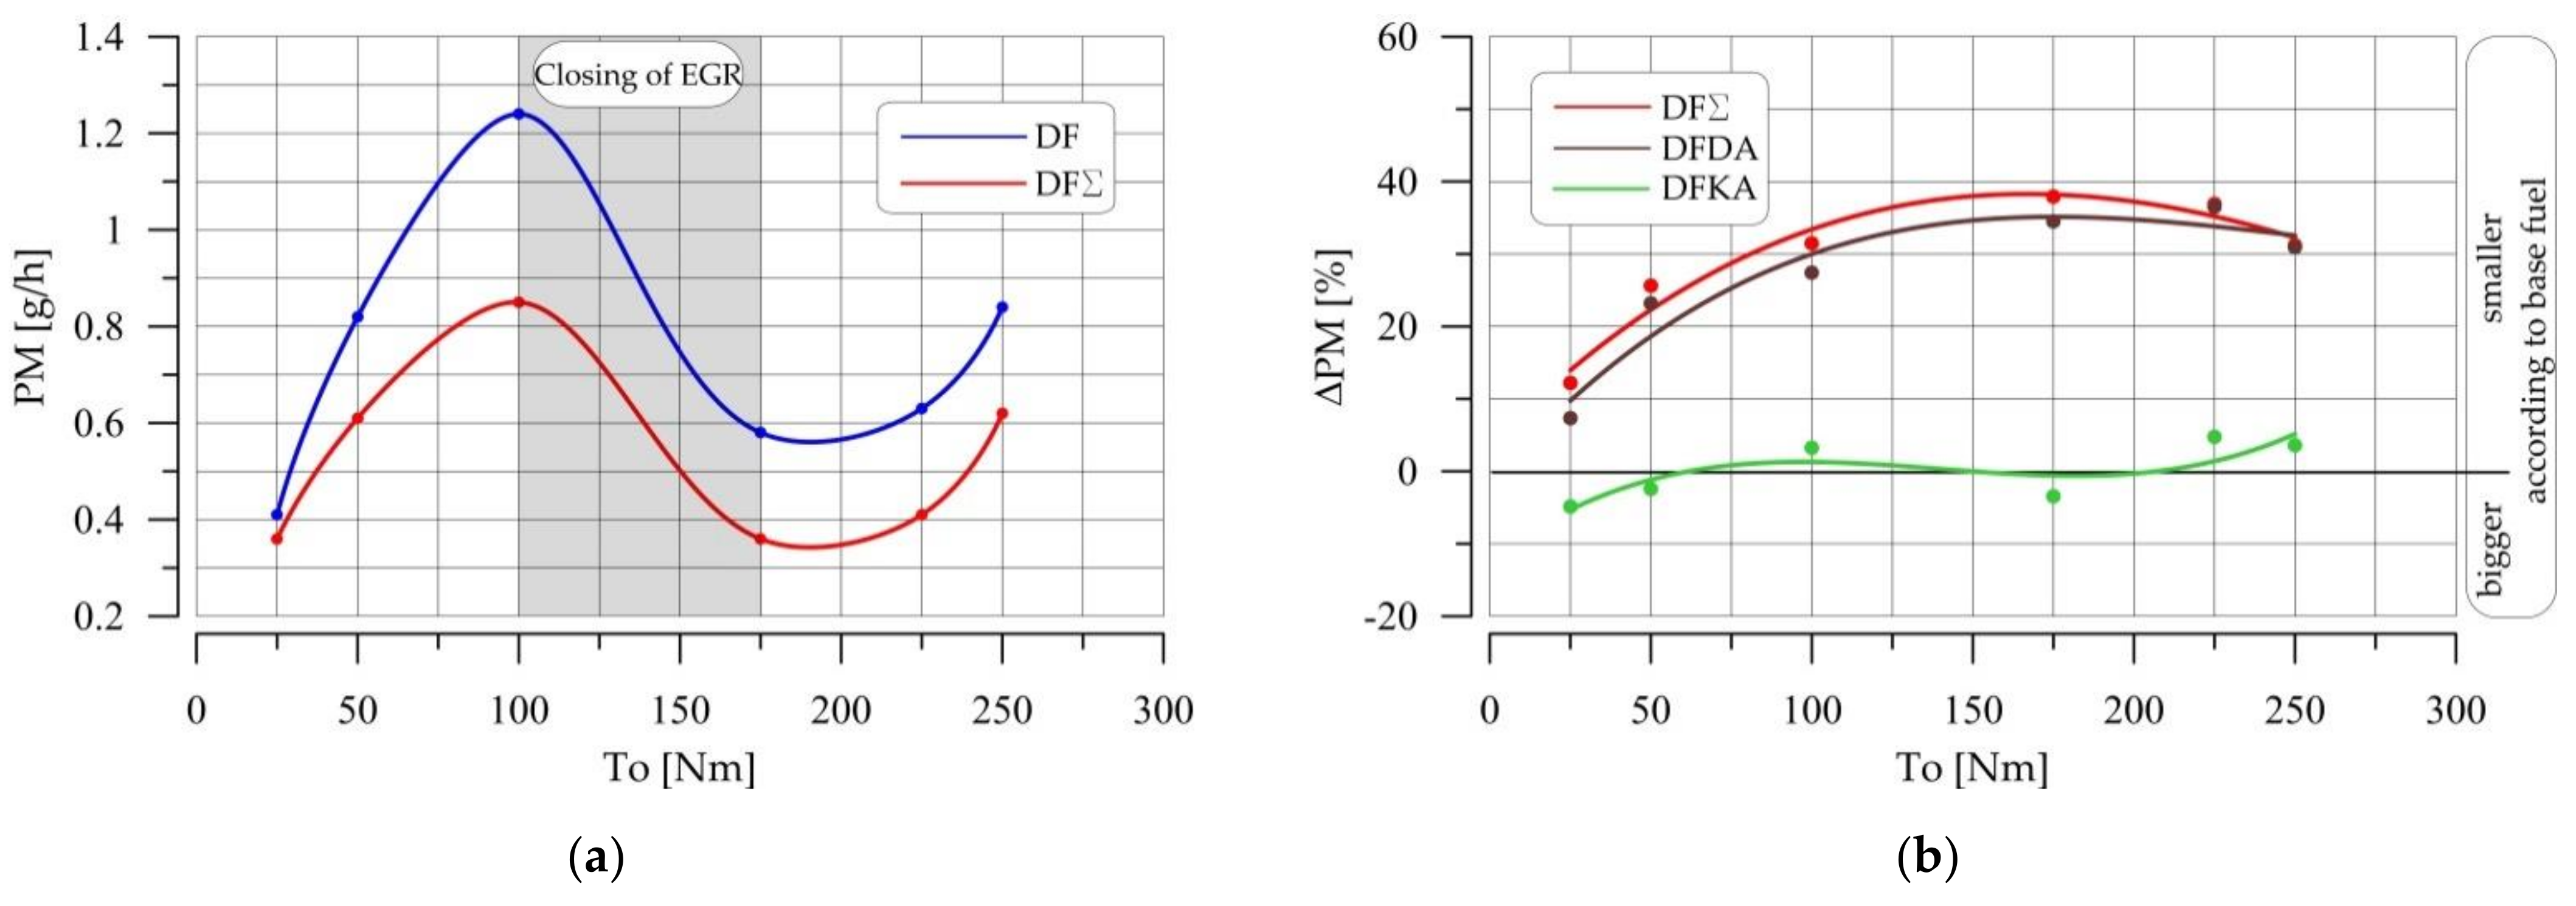
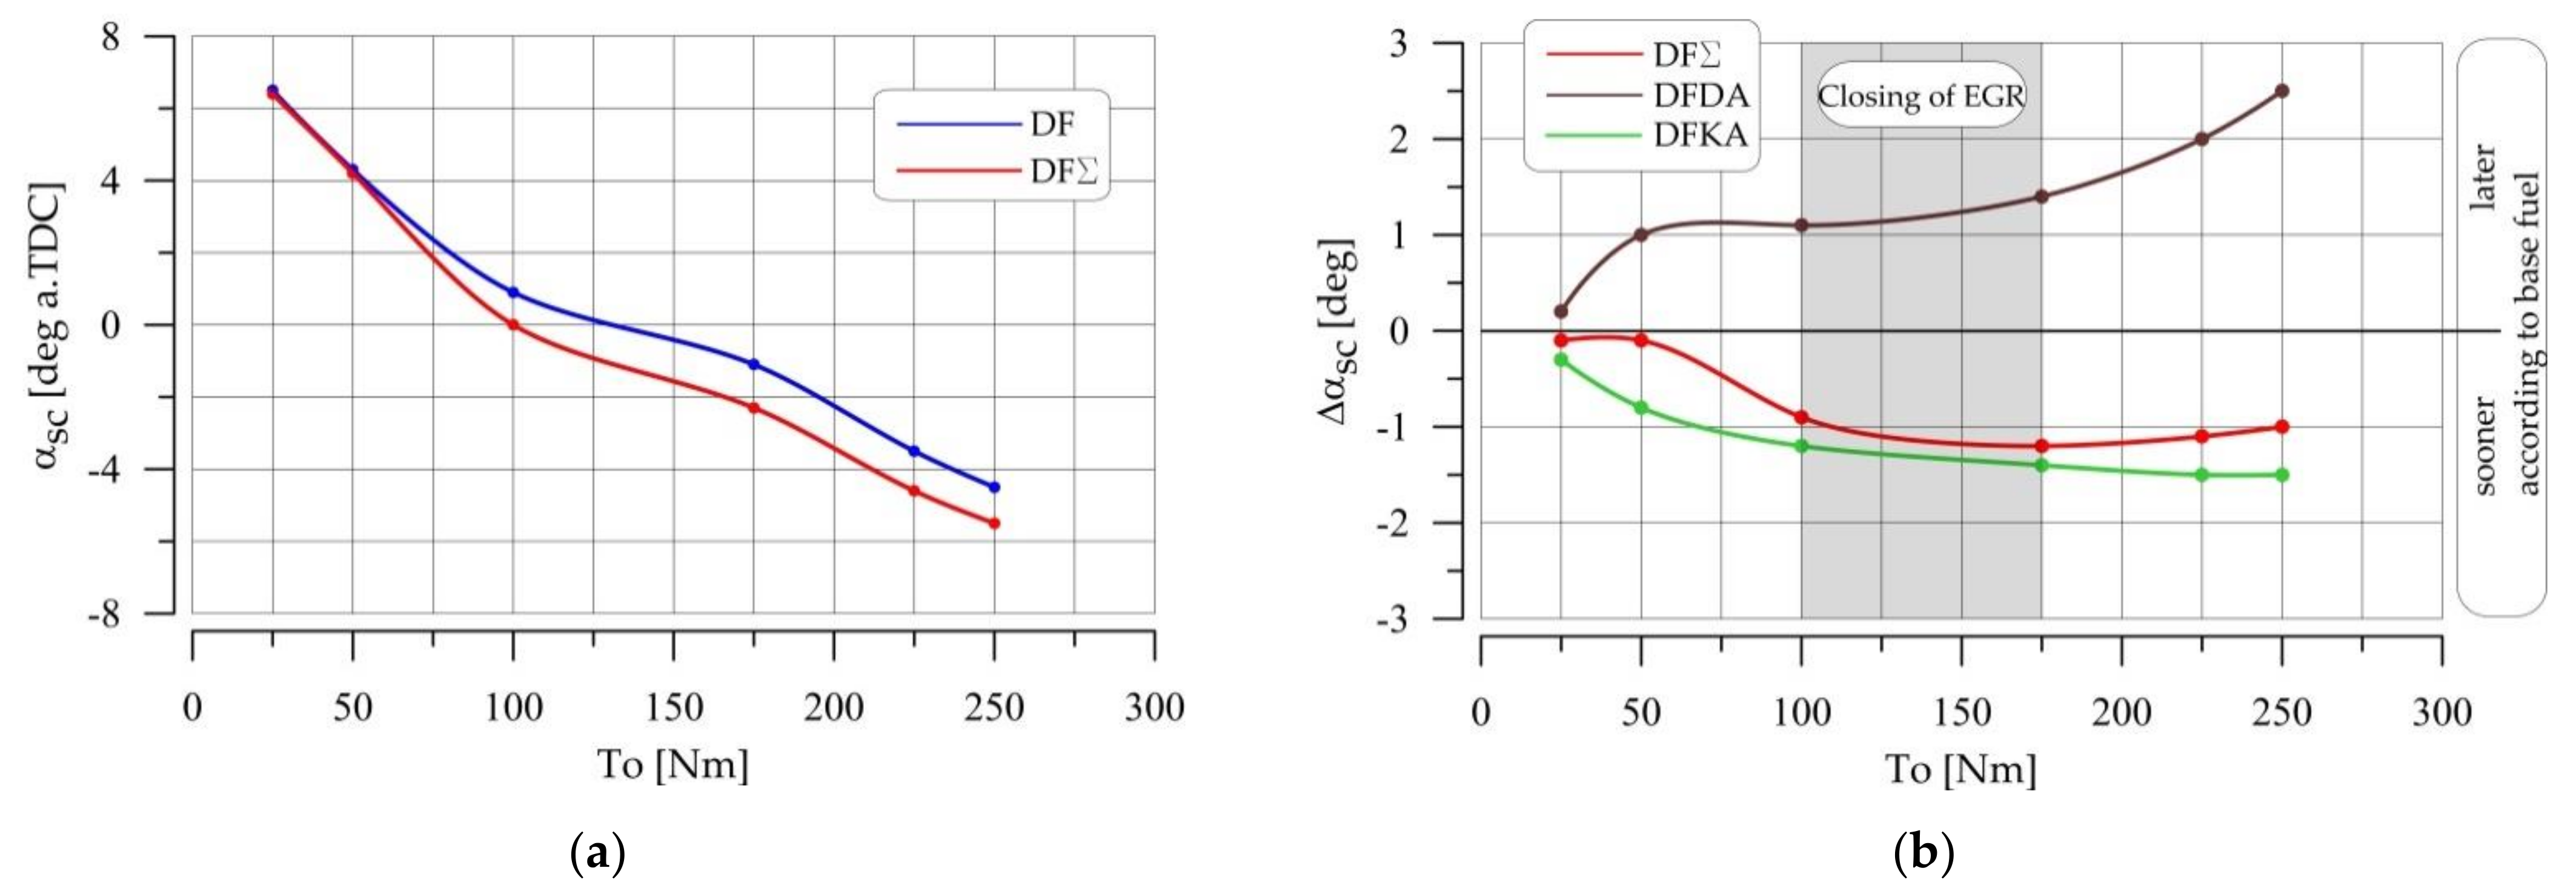
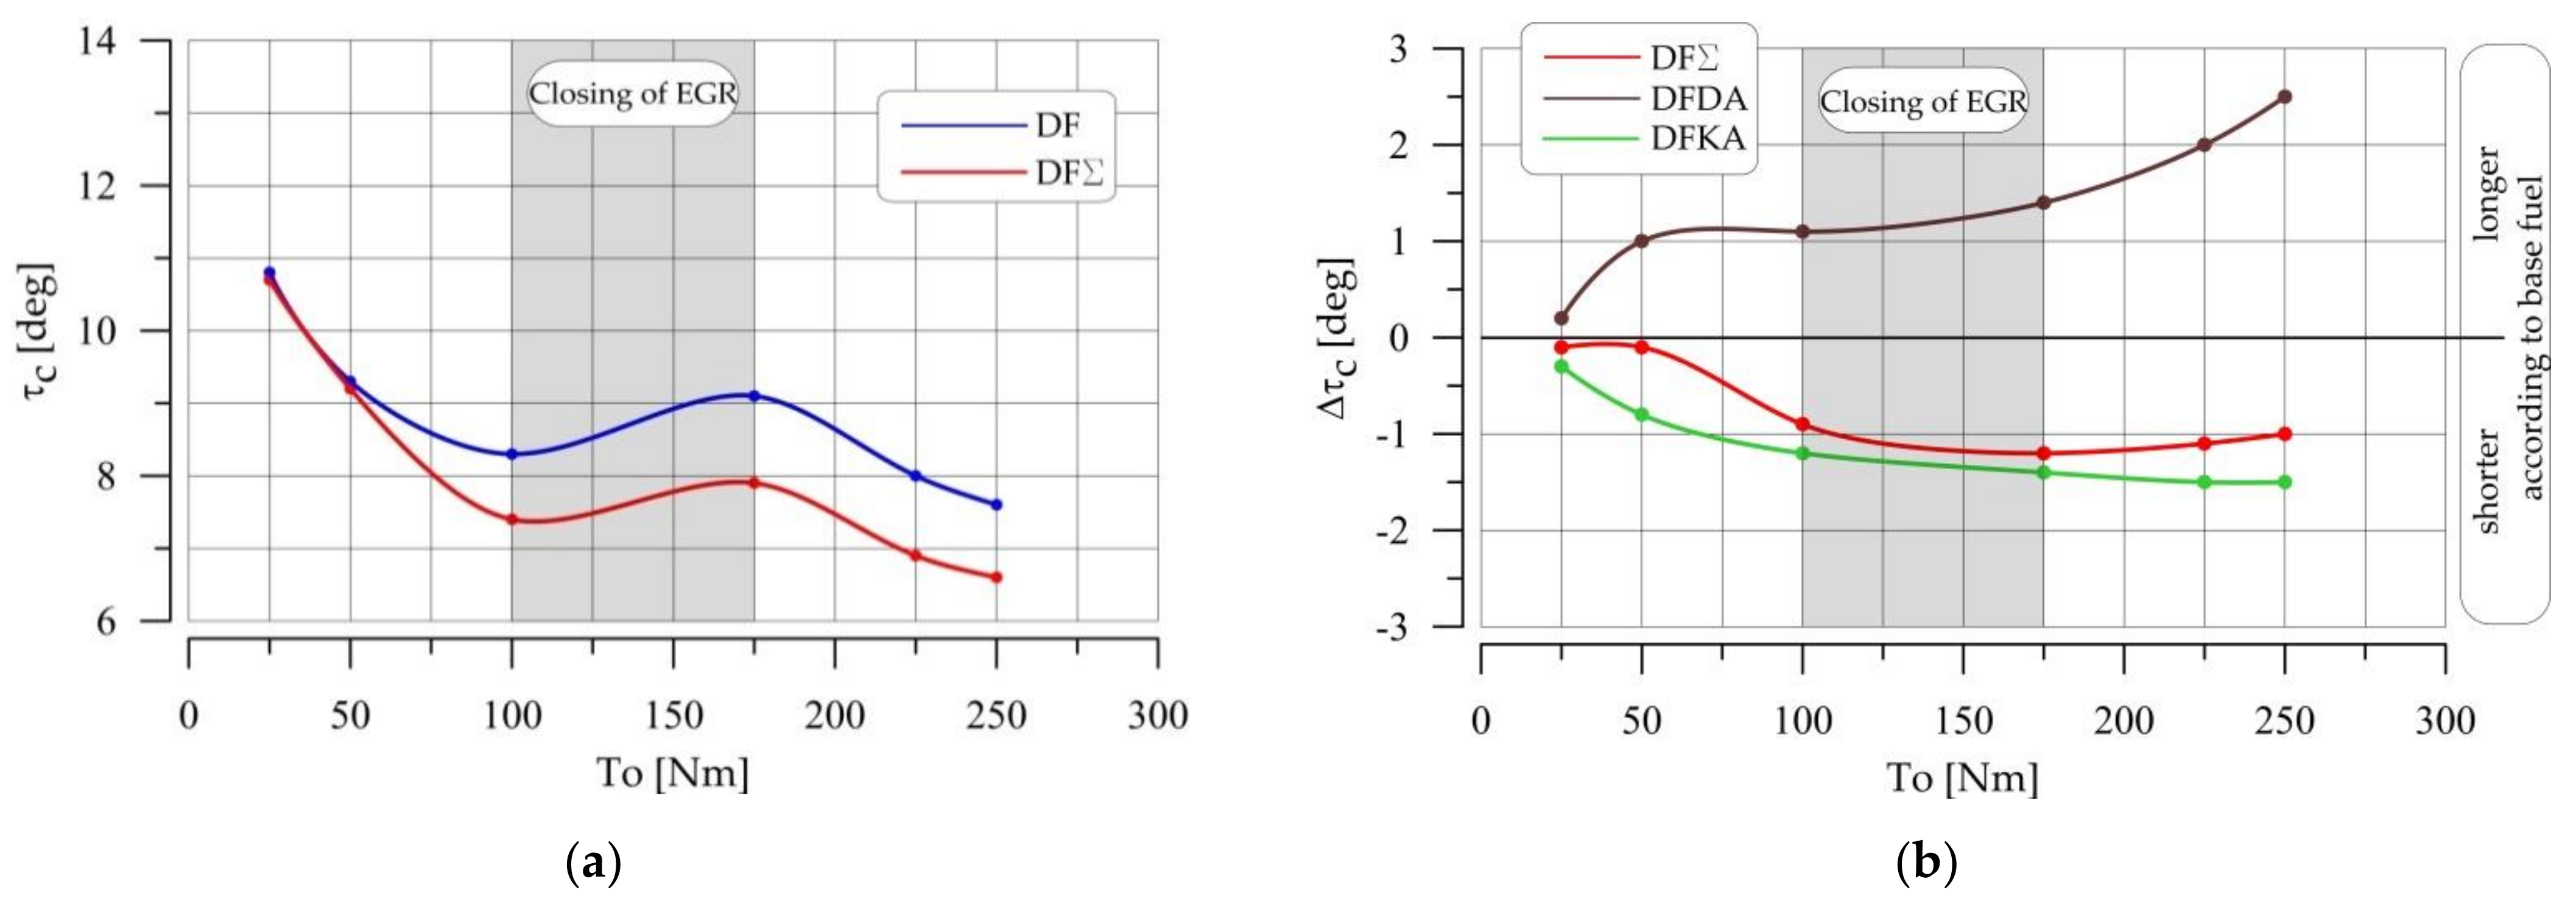
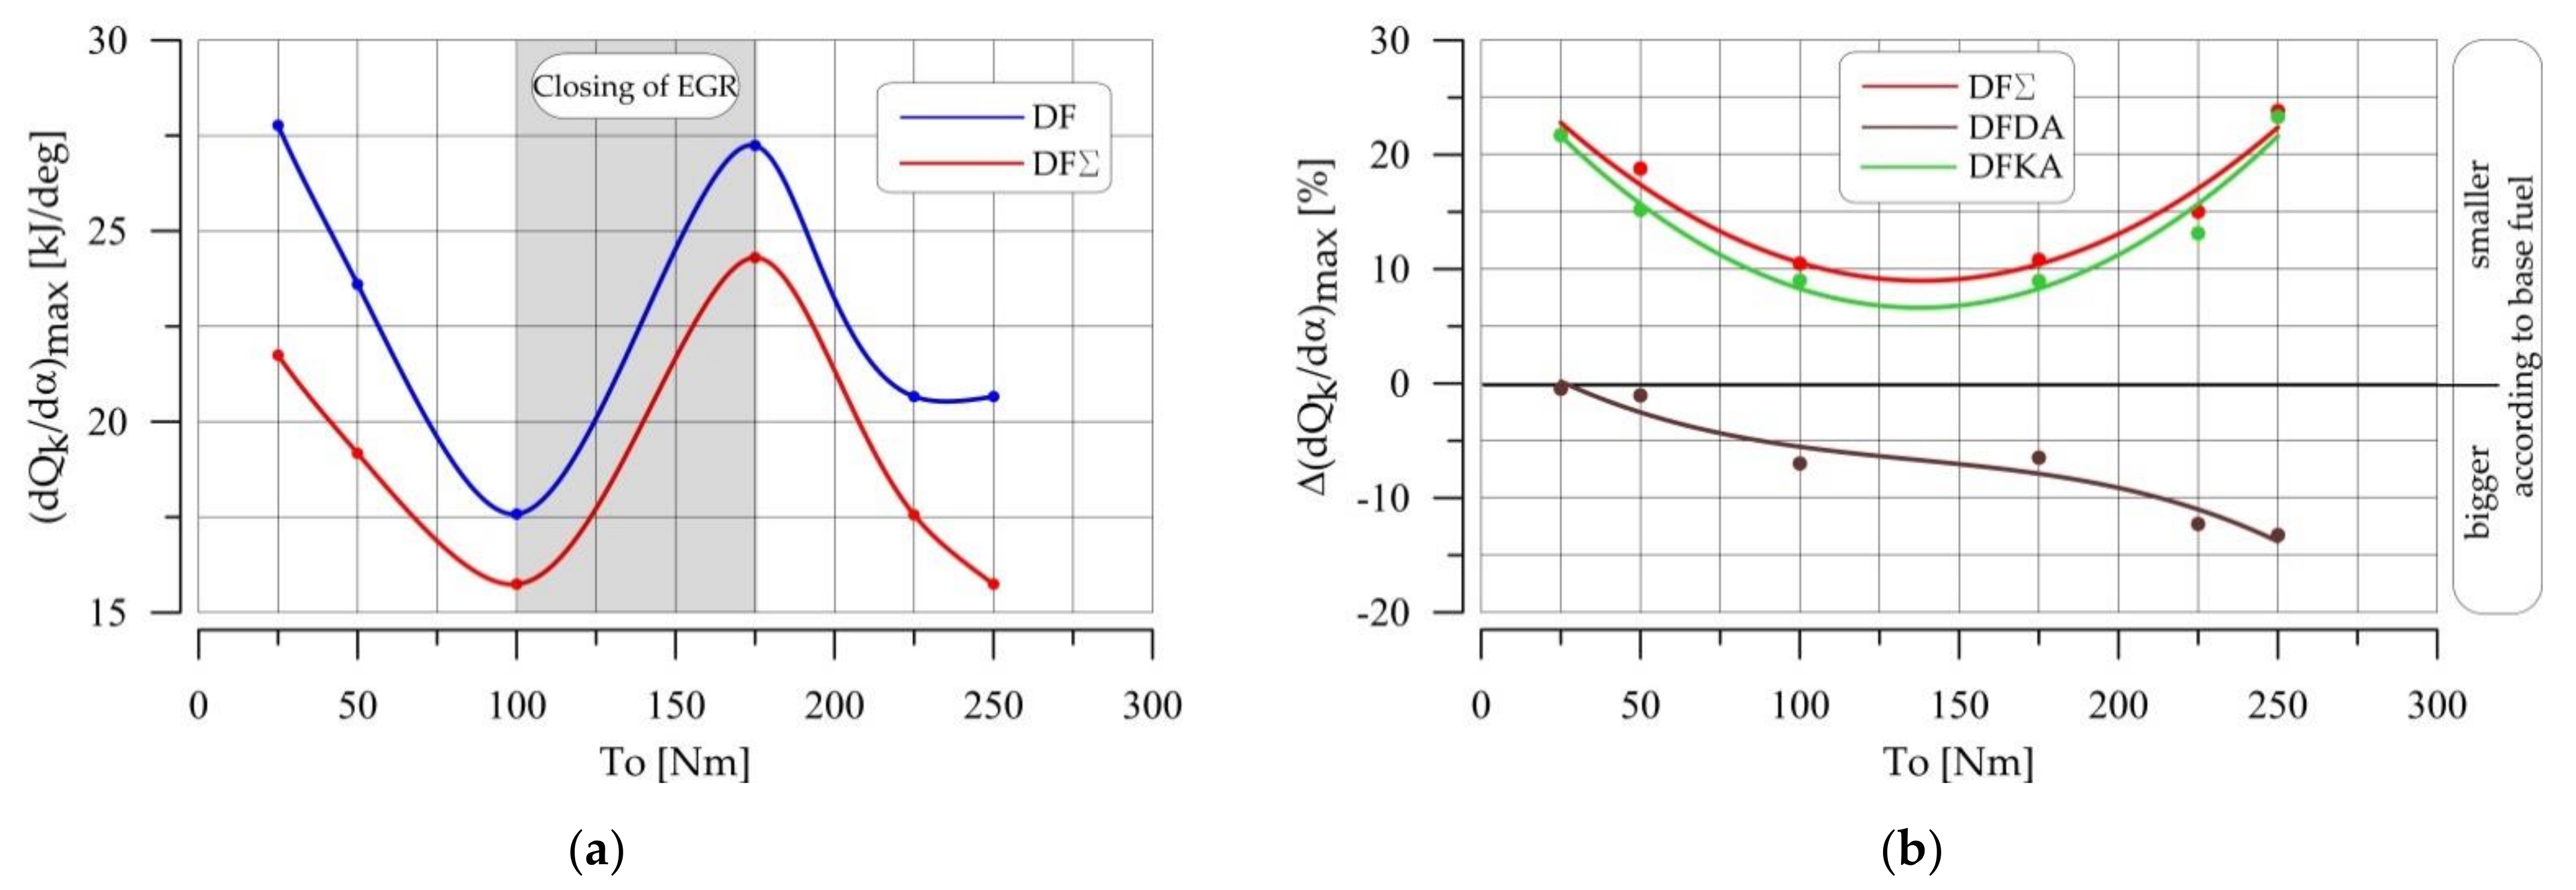
Table 1.
Base fuel characteristics [31].
Table 1.
Base fuel characteristics [31].
| Attribute | Unit | B7 Fuel | B10 Fuel |
|---|---|---|---|
| Cetane number | - | 51.7 | 52.3 |
| Cetane index | - | 52.5 | 55.0 |
| Density at temperature 15 °C | kg/m3 | 825 | 830.4 |
| PAH content | %(m/m) | 2.3 | 1.1 |
| Sulfur content | mg/kg | 9.4 | 4.9 |
| Manganese content | mg/L | - | <0.5 |
| Flash-point | °C | 62 | 60.5 |
| Coking residue(with 10% distillation residue) | %(m/m) | 0.01 | 0.016 |
| Water content | mg/kg | 80 | 60 |
| Total impurity content | mg/kg | 12 | 20.5 |
| Cooper strip corrosion (corrosion rate) (3 h, 50 °C) | degree of corrosion | 1 | 1 |
| Oxidativestability (g/m3) | g/m3 | 4 | 8 |
| Oxidativestability [110 °C] (Rancimat) | h | 55.4 | 23.1 |
| Lubricity, wear scar diameter, [60 °C] | µm | 436 | 165 |
| Kinematic viscosity [40 °C] | mm2/s | 2.78 | 2.73 |
| Fractional composition | |||
| %(v/v) recovered at 250 °C %(v/v) recovered at 350 °C 95% (v/v) recovered at | %(v/v) %(v/v) °C | 39.0 93.8 354.7 | 36.8 93 355.9 |
| FAME content | %(v/v) | 7 | 9.9 |
| Ash residue | %(m/m) | 0.001 | <0.001 |
Table 2.
Engine parameters.
| Type of Engine | VW 1.9 TDI |
|---|---|
| type of fuel ignition | compression ignition |
| cylinder layout | in-line |
| the number of cylinders | 4 |
| piston diameter | 79.5 mm |
| piston stroke | 95.5 mm |
| engine displacement | 1896 cm3 |
| geometric compression ratio | 18 |
| cylinders work order | 1-3-4-2 |
| rated gross power | 85 kW |
| rated engine speed | 4000 rpm |
| maximum engine speed | 4450 rpm |
| maximum engine torque | 285 Nm |
| rot. speed of maximum torque | 2000 rpm |
| engine cool | 6.1 dm3 |
| engine oil system | 4.4 dm3 |
| oil pressure | 0.11–0.41 MPa |
| fuel system | unit injectors |
| max. pressure of fuel injection | 20 MPa |
Publisher’s Note: MDPI stays neutral with regard to jurisdictional claims in published maps and institutional affiliations. |
© 2021 by the authors. Licensee MDPI, Basel, Switzerland. This article is an open access article distributed under the terms and conditions of the Creative Commons Attribution (CC BY) license (https://creativecommons.org/licenses/by/4.0/).
Share and Cite
MDPI and ACS Style
Cisek, J.; Lesniak, S.; Stanik, W.; Przybylski, W. The Synergy of Two Biofuel Additives on Combustion Process to Simultaneously Reduce NOx and PM Emissions. Energies 2021, 14, 2784. https://0-doi-org.brum.beds.ac.uk/10.3390/en14102784
AMA Style
Cisek J, Lesniak S, Stanik W, Przybylski W. The Synergy of Two Biofuel Additives on Combustion Process to Simultaneously Reduce NOx and PM Emissions. Energies. 2021; 14(10):2784. https://0-doi-org.brum.beds.ac.uk/10.3390/en14102784
Chicago/Turabian StyleCisek, Jerzy, Szymon Lesniak, Winicjusz Stanik, and Włodzimierz Przybylski. 2021. "The Synergy of Two Biofuel Additives on Combustion Process to Simultaneously Reduce NOx and PM Emissions" Energies 14, no. 10: 2784. https://0-doi-org.brum.beds.ac.uk/10.3390/en14102784
Note that from the first issue of 2016, this journal uses article numbers instead of page numbers. See further details here.